storytelling for stakeholder engagement
TRANSCRIPT
Storytelling holds an untapped potential for communicating evidence from systematic reviews and systematic maps for increased stakeholder engagement. It is time for
researchers and research networks to support and emphasize the importance of exploring new tools for effective science communication. Storytelling may be one such tool.
Rethinking communication:Integrating storytelling in systematic reviews
and maps for stakeholder engagementAnneli Sundin1, Karolin Andersson2 and Robert Watt1
¹Stockholm Environment Institute, Stockholm, Sweden, ²Mistra-EviEM, Stockholm, Sweden.
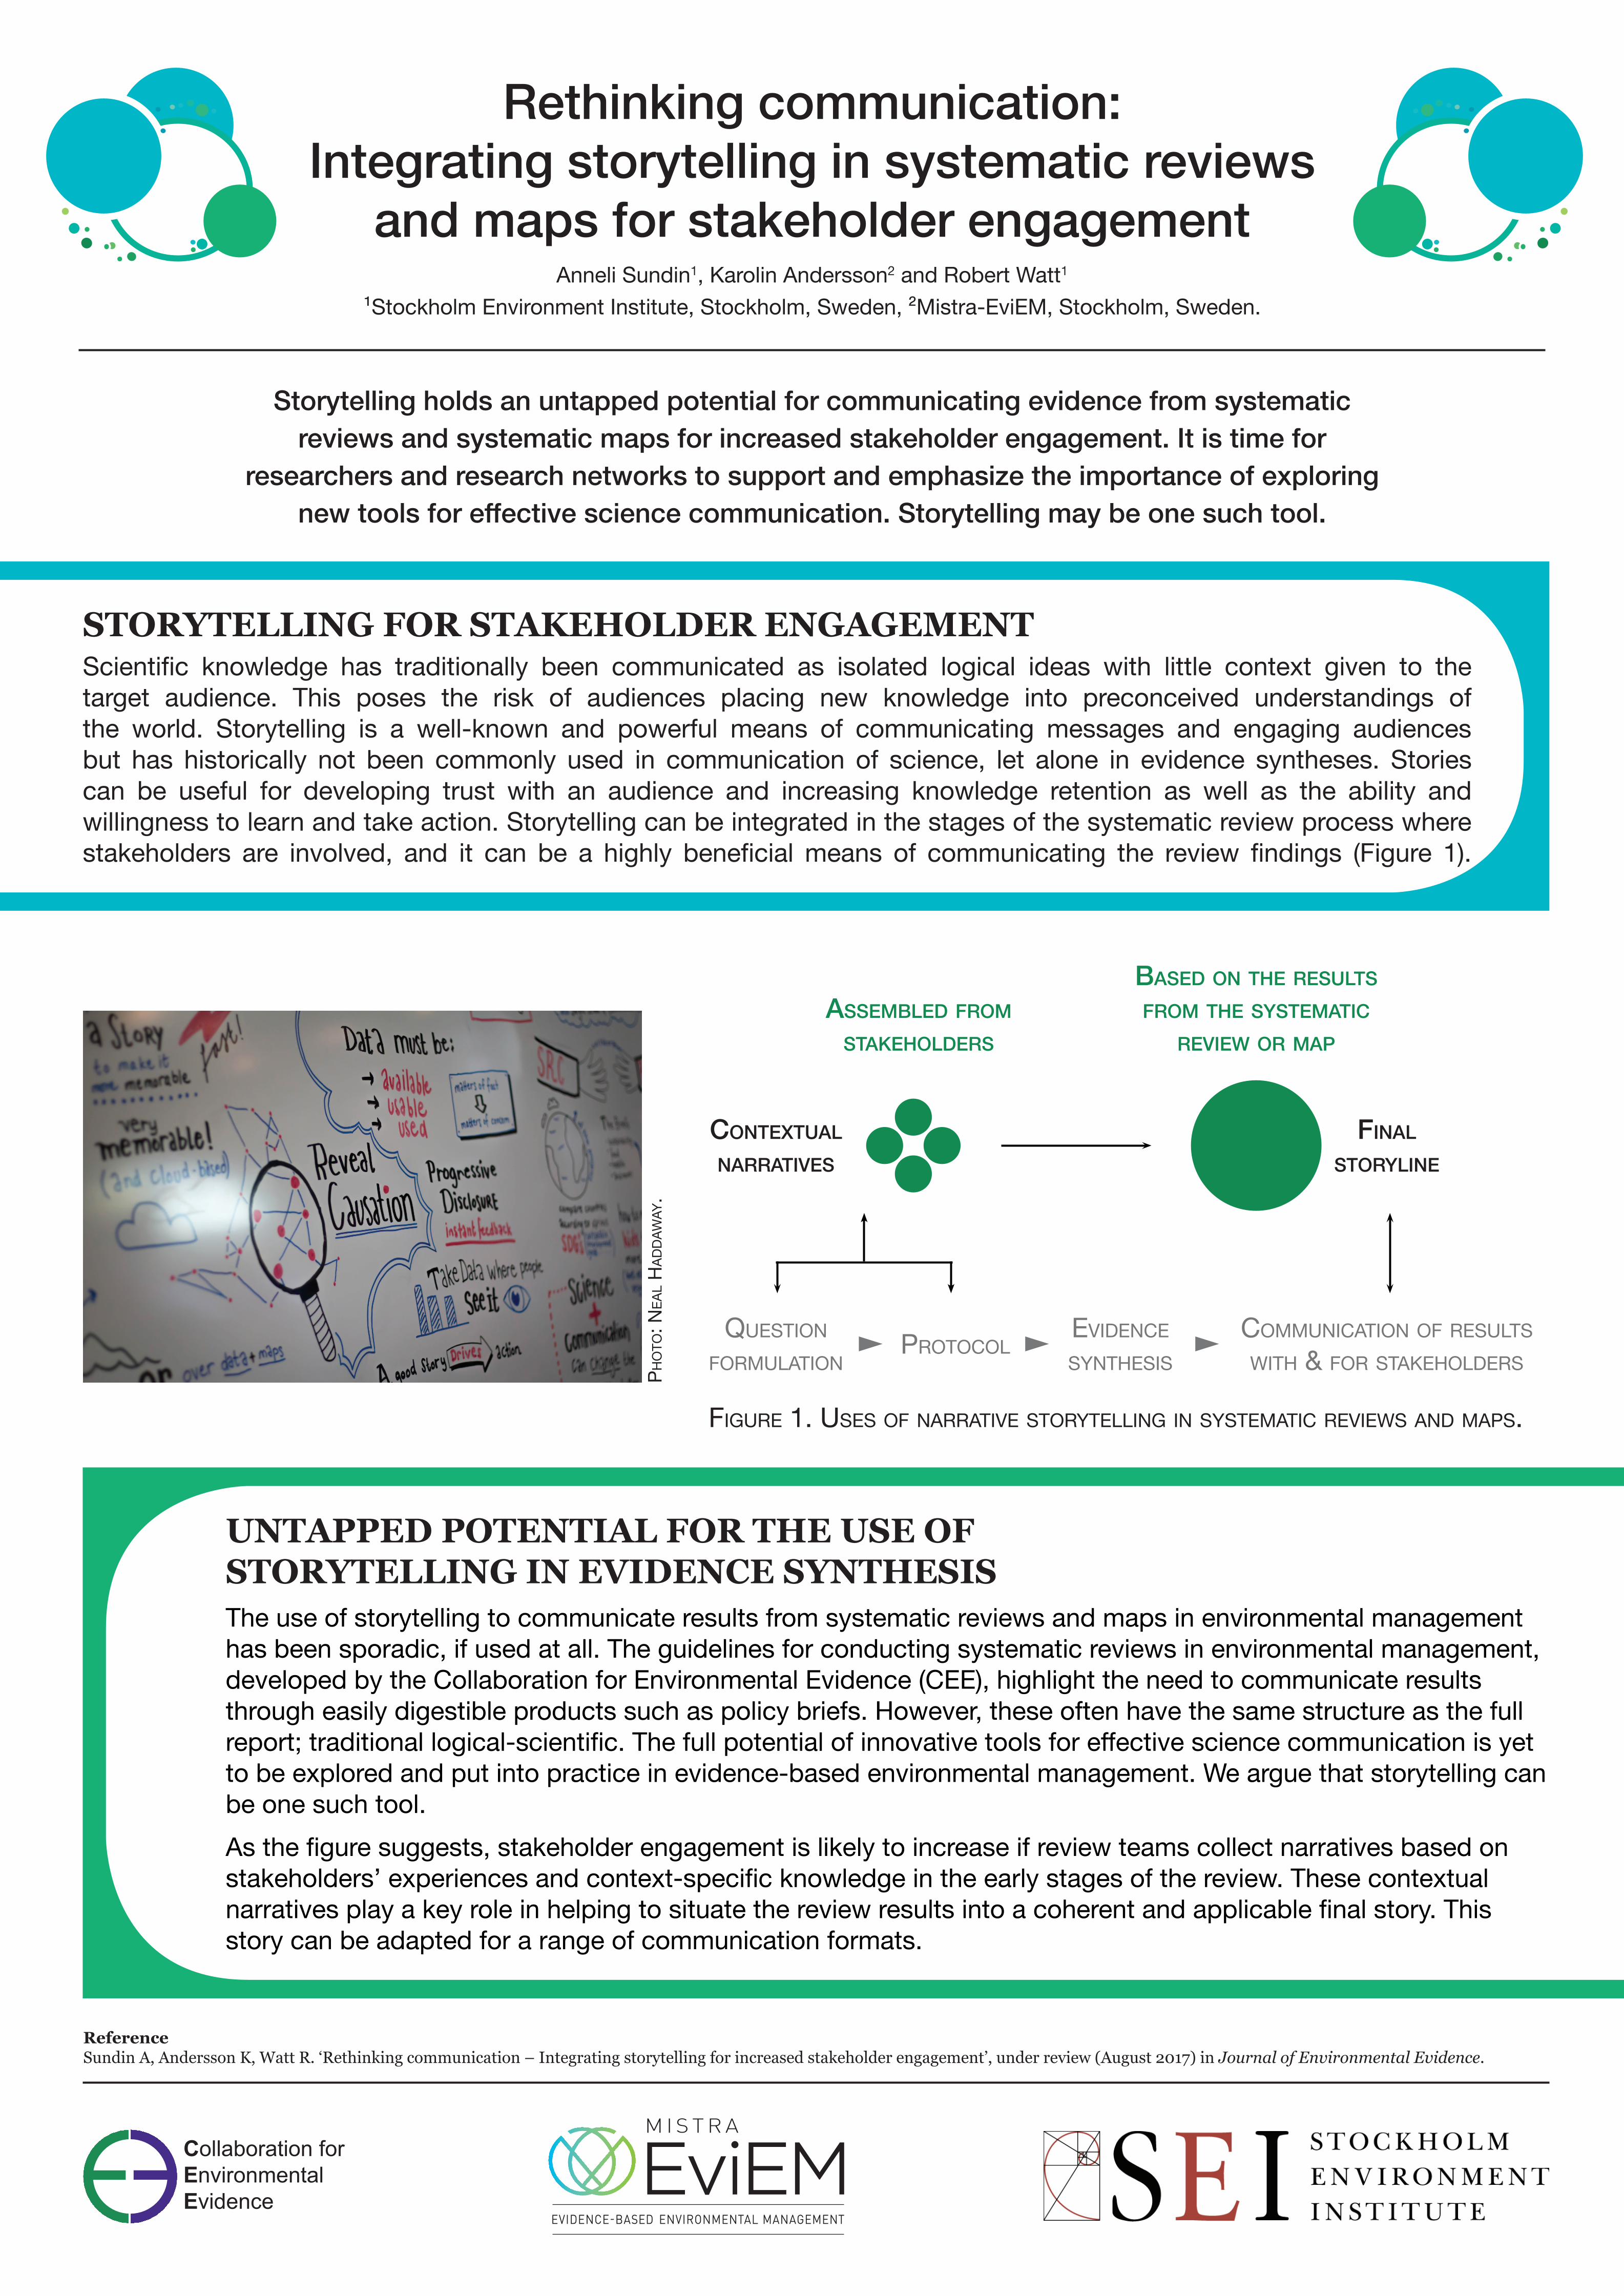
Scientific knowledge has traditionally been communicated as isolated logical ideas with little context given to the target audience. This poses the risk of audiences placing new knowledge into preconceived understandings of the world. Storytelling is a well-known and powerful means of communicating messages and engaging audiences but has historically not been commonly used in communication of science, let alone in evidence syntheses. Stories can be useful for developing trust with an audience and increasing knowledge retention as well as the ability and willingness to learn and take action. Storytelling can be integrated in the stages of the systematic review process where stakeholders are involved, and it can be a highly beneficial means of communicating the review findings (Figure 1).
STORYTELLING FOR STAKEHOLDER ENGAGEMENT
As the figure suggests, stakeholder engagement is likely to increase if review teams collect narratives based on stakeholders’ experiences and context-specific knowledge in the early stages of the review. These contextual narratives play a key role in helping to situate the review results into a coherent and applicable final story. This story can be adapted for a range of communication formats.
The use of storytelling to communicate results from systematic reviews and maps in environmental management has been sporadic, if used at all. The guidelines for conducting systematic reviews in environmental management, developed by the Collaboration for Environmental Evidence (CEE), highlight the need to communicate results through easily digestible products such as policy briefs. However, these often have the same structure as the full report; traditional logical-scientific. The full potential of innovative tools for effective science communication is yet to be explored and put into practice in evidence-based environmental management. We argue that storytelling can be one such tool.
UNTAPPED POTENTIAL FOR THE USE OF STORYTELLING IN EVIDENCE SYNTHESIS
ReferenceSundin A, Andersson K, Watt R. ‘Rethinking communication – Integrating storytelling for increased stakeholder engagement’, under review (August 2017) in Journal of Environmental Evidence.
Figure 1. uses oF narrative storytelling in systematic reviews and maps.
Assembled from stAkeholders
bAsed on the results from the systemAtic
review or mAp
communication oF results with & For stakeholders
evidence synthesis
protocolQuestion
Formulation
contextuAl nArrAtives
finAl storyline
ph
oto
: ne
al
ha
dd
aw
ay.
Collaboration forEnvironmental Evidence
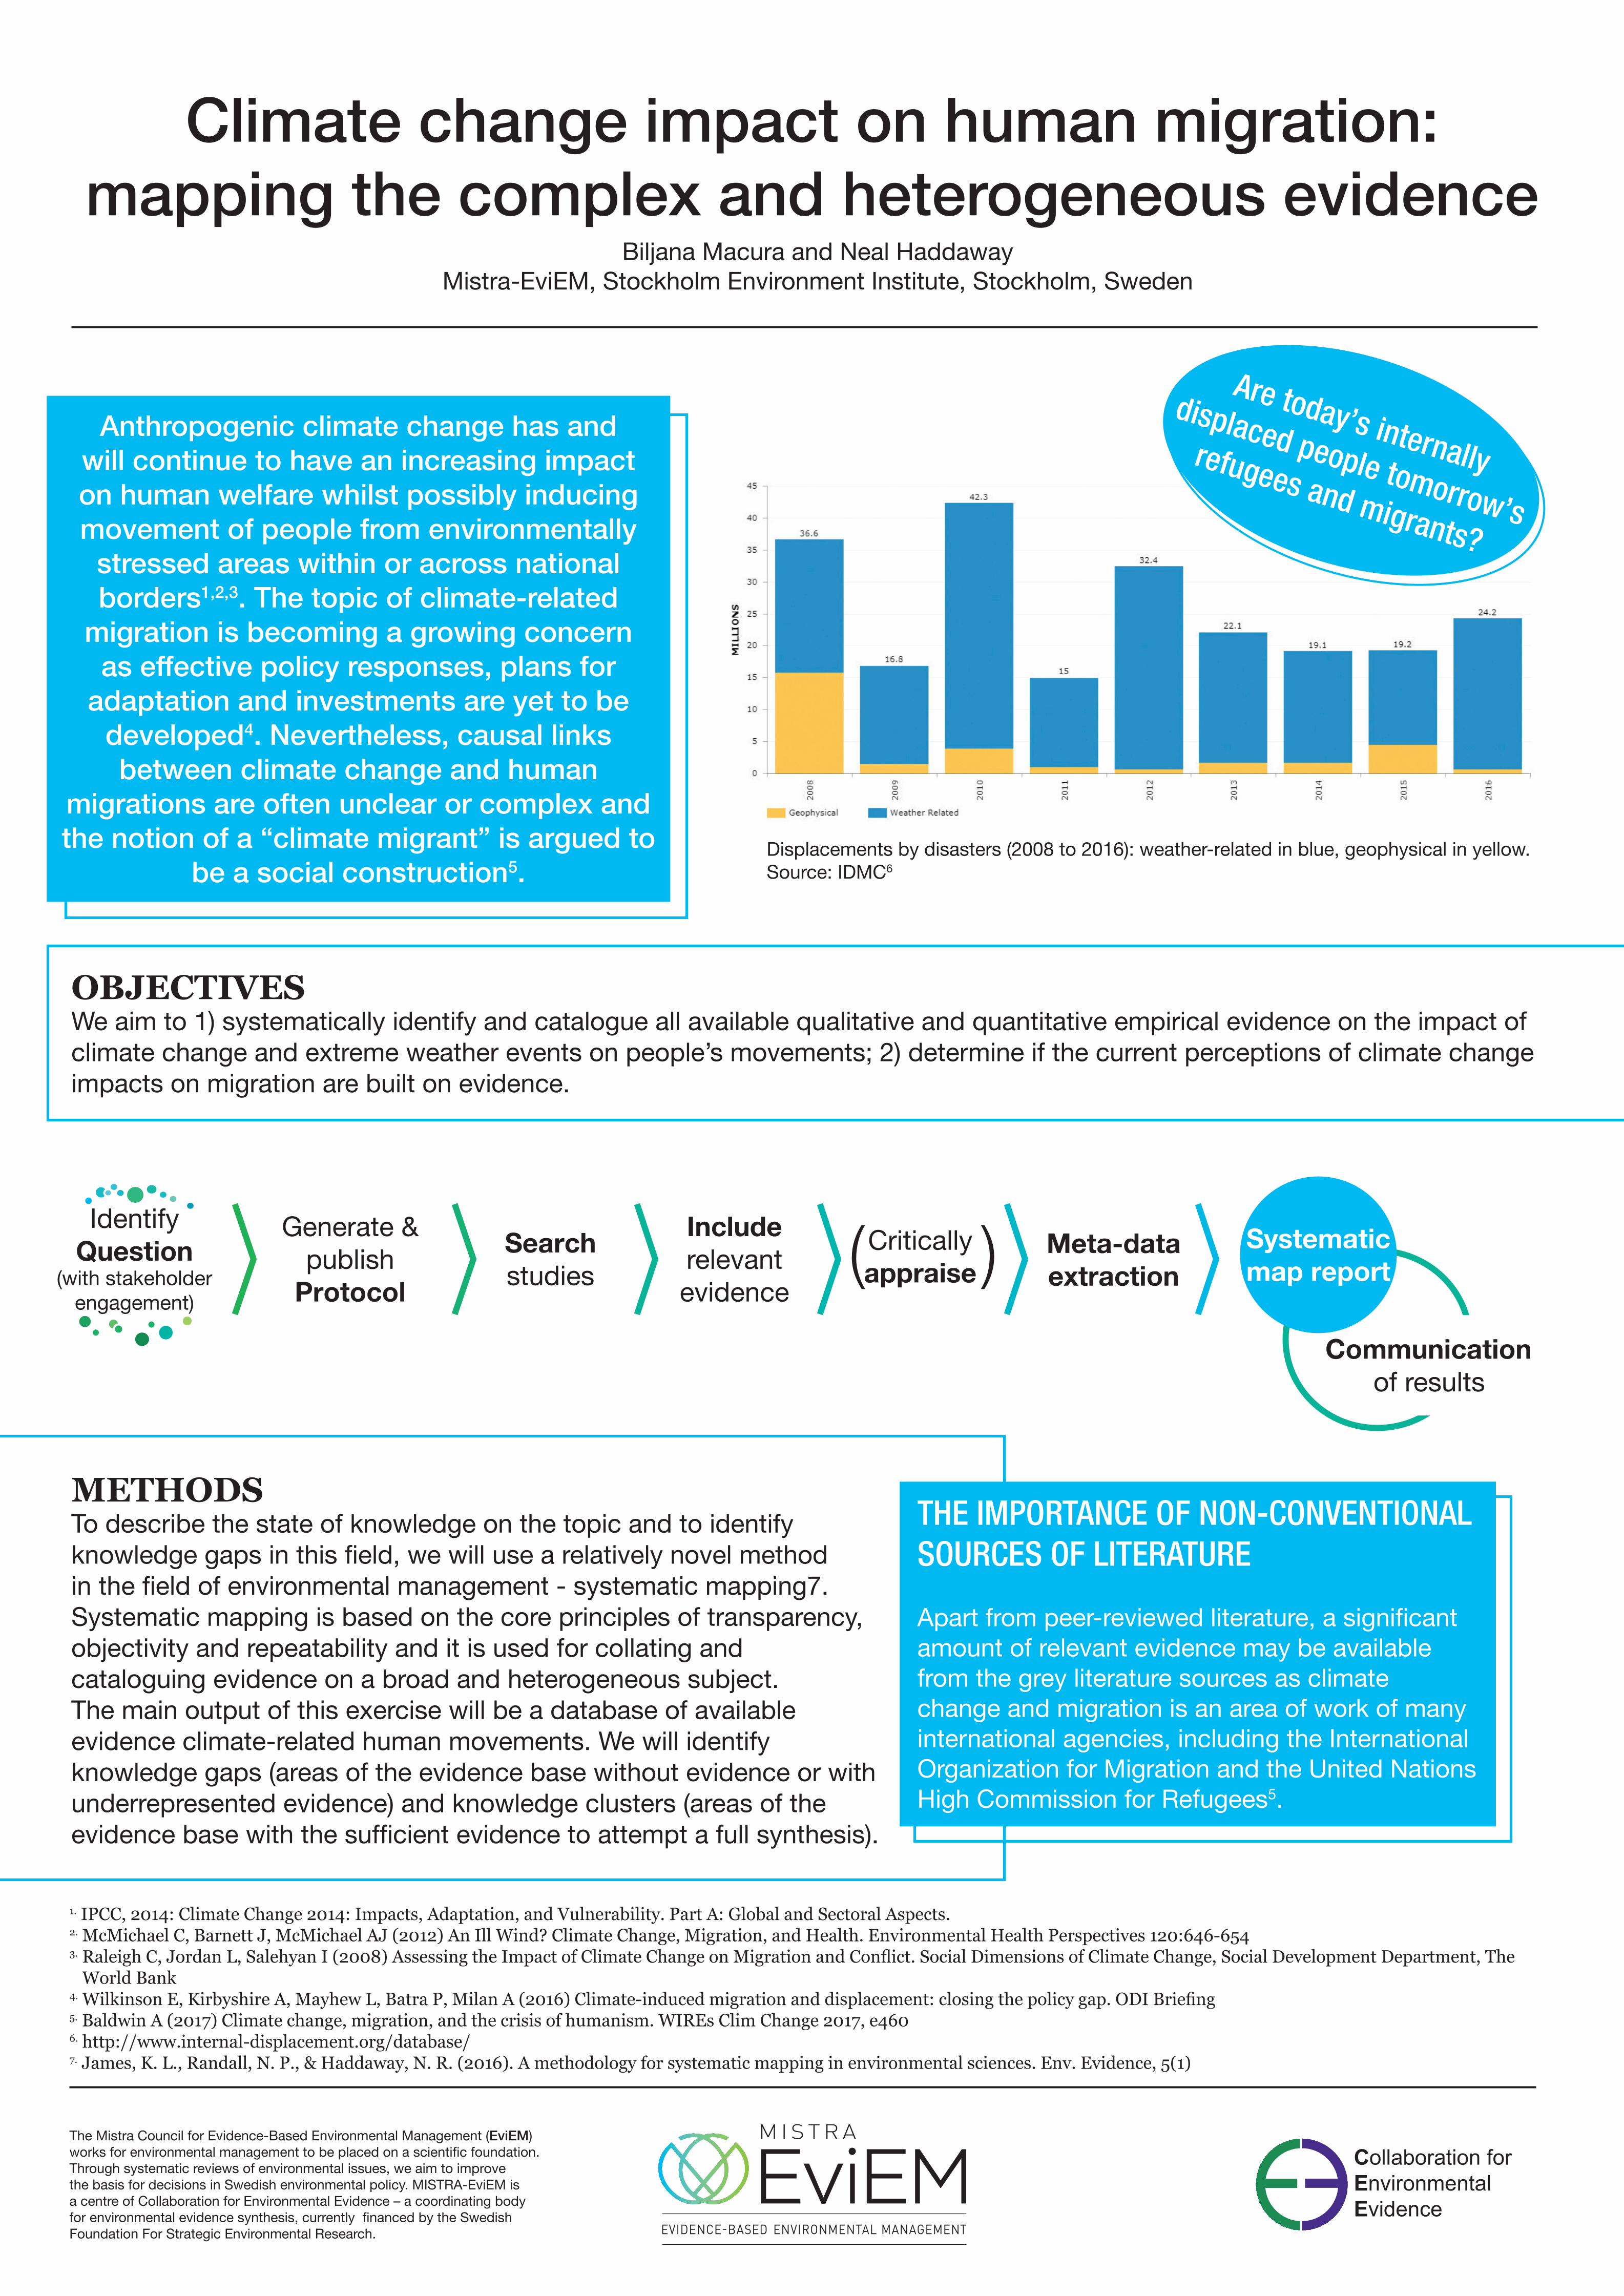
Anthropogenic climate change has and will continue to have an increasing impact on human welfare whilst possibly inducing movement of people from environmentally
stressed areas within or across national borders1,2,3. The topic of climate-related
migration is becoming a growing concern as effective policy responses, plans for
adaptation and investments are yet to be developed4. Nevertheless, causal links between climate change and human
migrations are often unclear or complex and the notion of a “climate migrant” is argued to
be a social construction5.
Climate change impact on human migration: mapping the complex and heterogeneous evidence
METHODSTo describe the state of knowledge on the topic and to identify knowledge gaps in this field, we will use a relatively novel method in the field of environmental management - systematic mapping7. Systematic mapping is based on the core principles of transparency, objectivity and repeatability and it is used for collating and cataloguing evidence on a broad and heterogeneous subject. The main output of this exercise will be a database of available evidence climate-related human movements. We will identify knowledge gaps (areas of the evidence base without evidence or with underrepresented evidence) and knowledge clusters (areas of the evidence base with the sufficient evidence to attempt a full synthesis).
THE IMPORTANCE OF NON-CONVENTIONAL SOURCES OF LITERATURE
Apart from peer-reviewed literature, a significant amount of relevant evidence may be available from the grey literature sources as climate change and migration is an area of work of many international agencies, including the International Organization for Migration and the United Nations High Commission for Refugees5.
OBJECTIVESWe aim to 1) systematically identify and catalogue all available qualitative and quantitative empirical evidence on the impact of climate change and extreme weather events on people’s movements; 2) determine if the current perceptions of climate change impacts on migration are built on evidence.
Biljana Macura and Neal HaddawayMistra-EviEM, Stockholm Environment Institute, Stockholm, Sweden
1. IPCC, 2014: Climate Change 2014: Impacts, Adaptation, and Vulnerability. Part A: Global and Sectoral Aspects. 2. McMichael C, Barnett J, McMichael AJ (2012) An Ill Wind? Climate Change, Migration, and Health. Environmental Health Perspectives 120:646-6543. Raleigh C, Jordan L, Salehyan I (2008) Assessing the Impact of Climate Change on Migration and Conflict. Social Dimensions of Climate Change, Social Development Department, The World Bank4. Wilkinson E, Kirbyshire A, Mayhew L, Batra P, Milan A (2016) Climate-induced migration and displacement: closing the policy gap. ODI Briefing5. Baldwin A (2017) Climate change, migration, and the crisis of humanism. WIREs Clim Change 2017, e4606. http://www.internal-displacement.org/database/7. James, K. L., Randall, N. P., & Haddaway, N. R. (2016). A methodology for systematic mapping in environmental sciences. Env. Evidence, 5(1)
Are today’s internally
displaced people tomorrow’s
refugees and migrants?
Identify Question
(with stakeholder engagement)
Generate & publish
Protocol
Meta-data extraction
Criticallyappraise
Include relevant evidence
Search studies
Displacements by disasters (2008 to 2016): weather-related in blue, geophysical in yellow. Source: IDMC6
( )Communication
of results
Systematic map report
Collaboration forEnvironmental Evidence
The Mistra Council for Evidence-Based Environmental Management (EviEM) works for environmental management to be placed on a scientific foundation. Through systematic reviews of environmental issues, we aim to improve the basis for decisions in Swedish environmental policy. MISTRA-EviEM is a centre of Collaboration for Environmental Evidence – a coordinating body for environmental evidence synthesis, currently financed by the Swedish Foundation For Strategic Environmental Research.
The known knowns and known unknowns: A database of evidence gaps and clusters in
environmental management
ResultsThe database contains over 50 evidence gaps and 39 evidence clusters collated from all 13 systematic maps in following broad subject areas: forestry, fisheries, agriculture, and ecological, social and economic aspects of biodiversity conservation. Four maps could not identify any evidence clusters as evidence base on their subjects was too limited, but they highlighted several gaps and provided recommendations for more primary research.
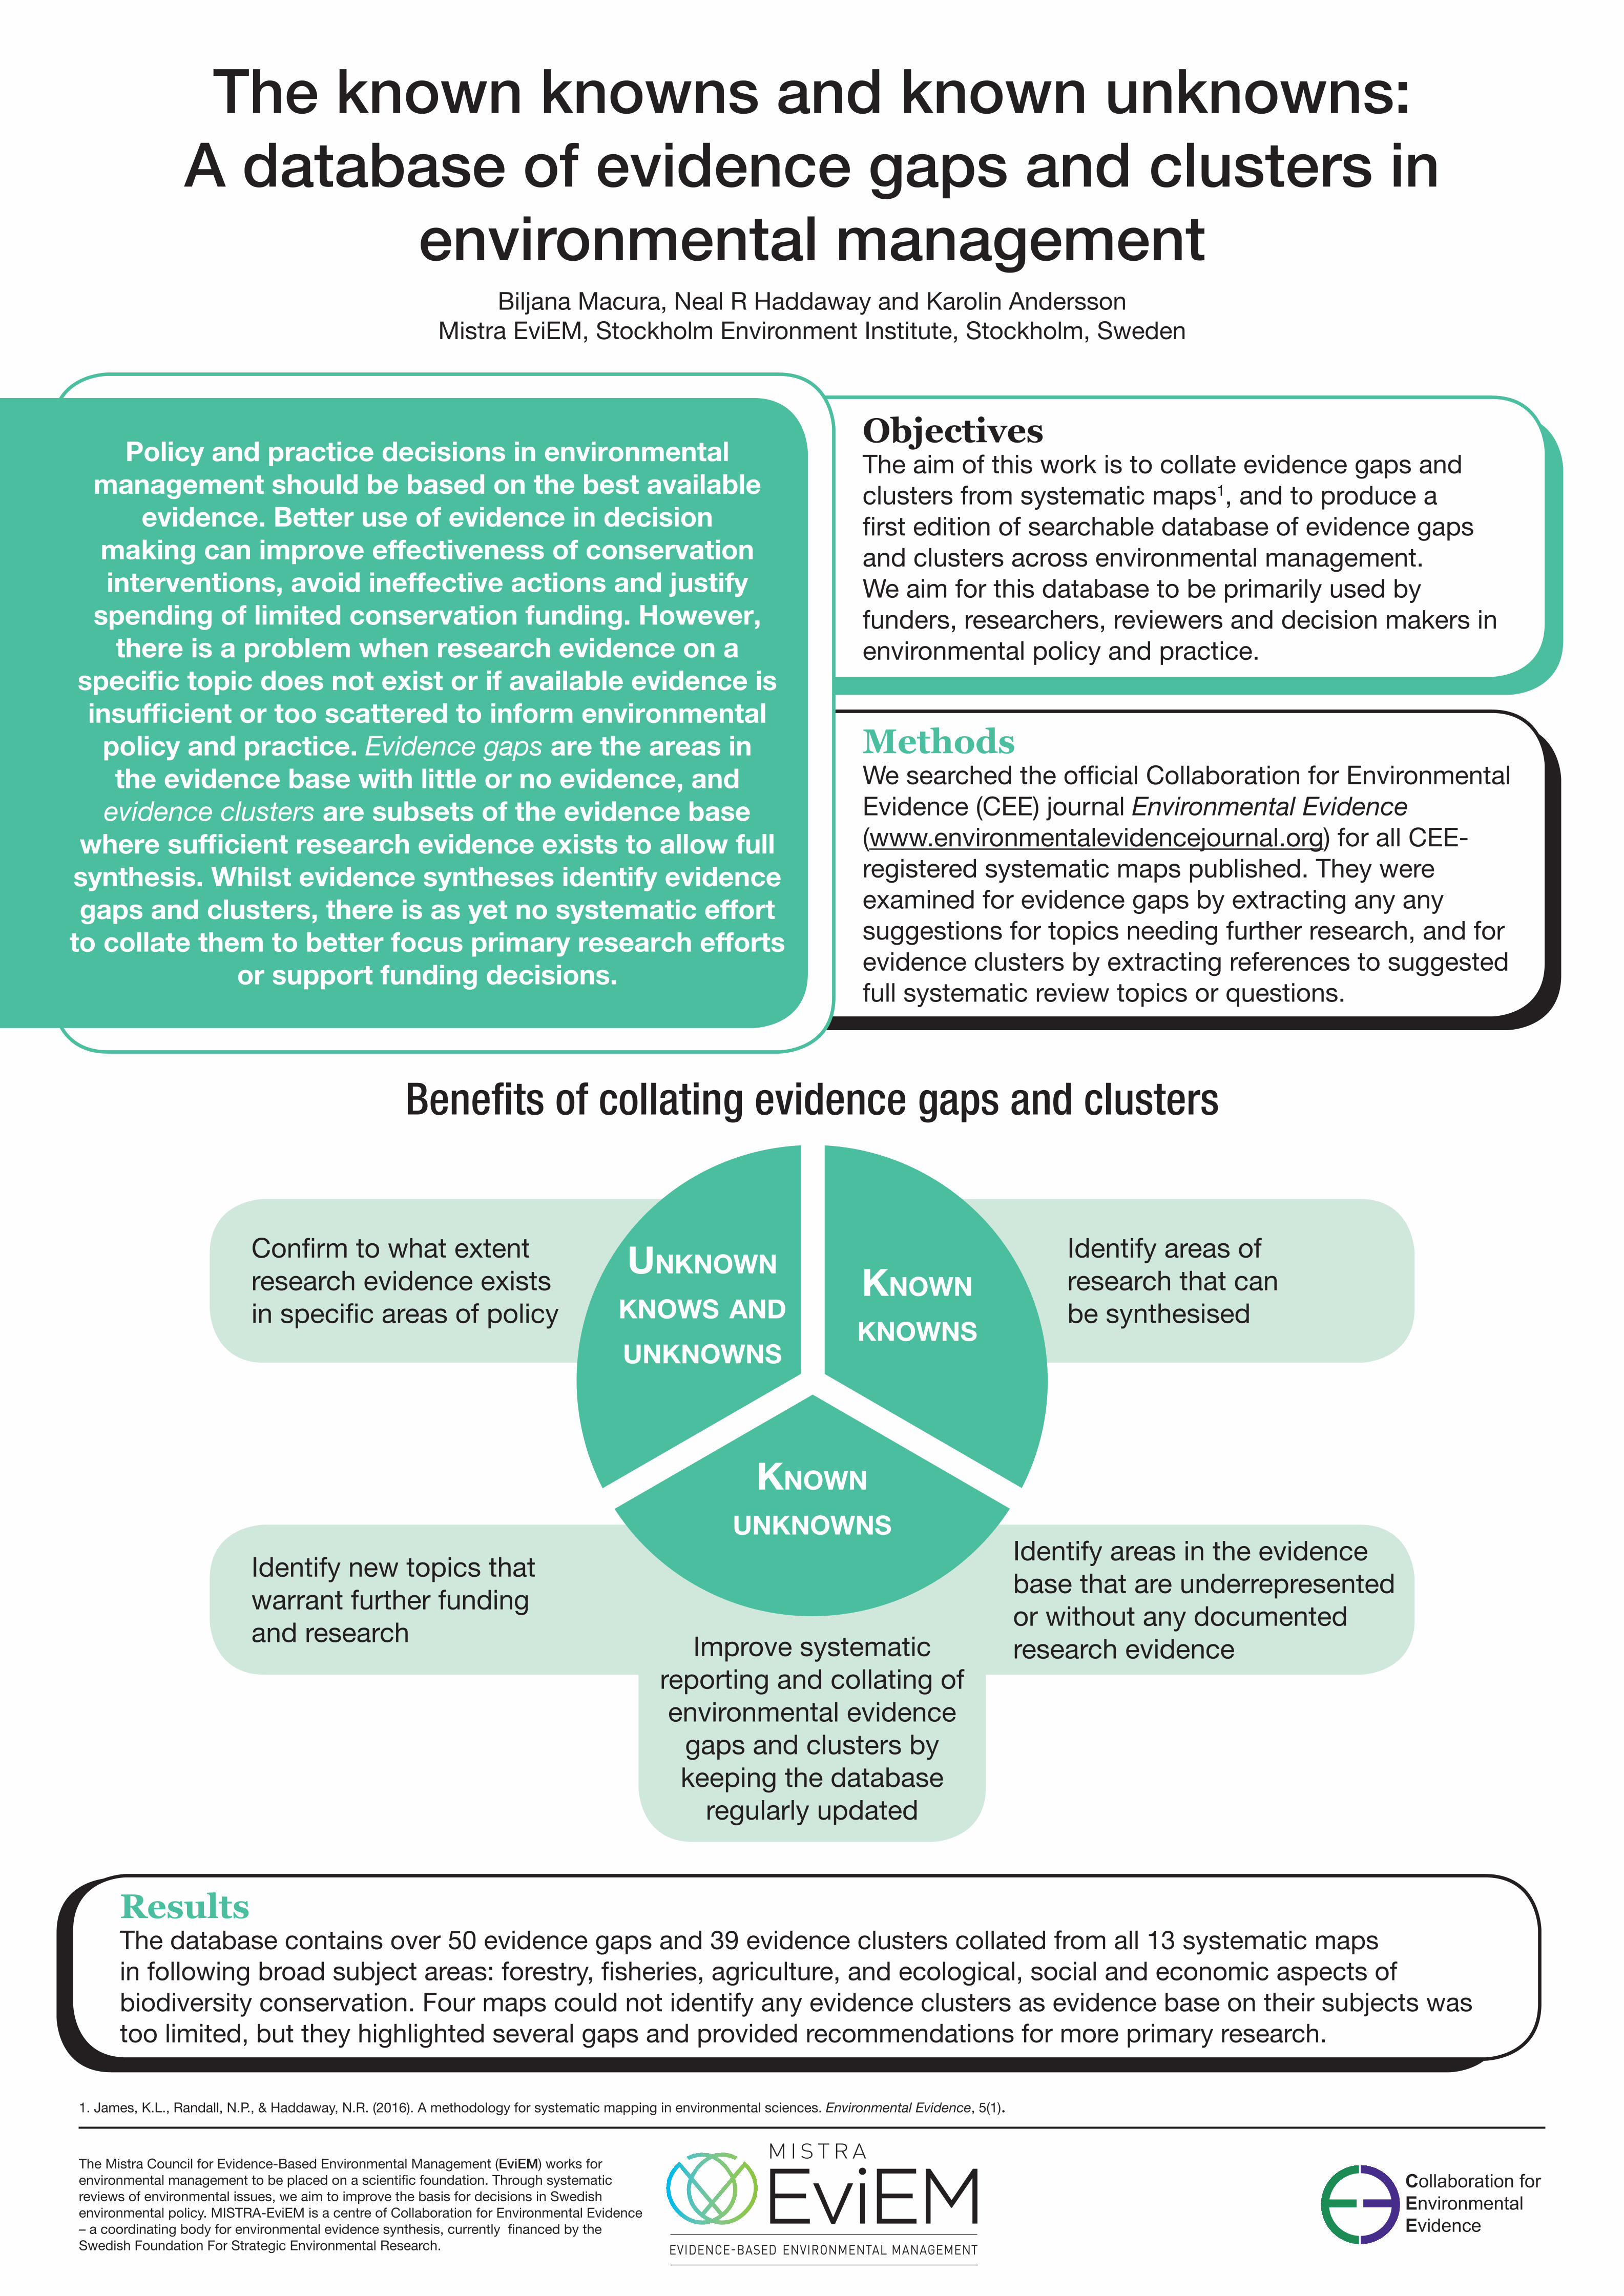
Benefits of collating evidence gaps and clusters
ObjectivesThe aim of this work is to collate evidence gaps and clusters from systematic maps1, and to produce a first edition of searchable database of evidence gaps and clusters across environmental management. We aim for this database to be primarily used by funders, researchers, reviewers and decision makers in environmental policy and practice.
MethodsWe searched the official Collaboration for Environmental Evidence (CEE) journal Environmental Evidence (www.environmentalevidencejournal.org) for all CEE-registered systematic maps published. They were examined for evidence gaps by extracting any any suggestions for topics needing further research, and for evidence clusters by extracting references to suggested full systematic review topics or questions.
Biljana Macura, Neal R Haddaway and Karolin AnderssonMistra EviEM, Stockholm Environment Institute, Stockholm, Sweden
1. James, K.L., Randall, N.P., & Haddaway, N.R. (2016). A methodology for systematic mapping in environmental sciences. Environmental Evidence, 5(1).
Unknown knows and Unknowns
known Unknowns
known knowns
Identify areas of research that can be synthesised
Identify areas in the evidence base that are underrepresented or without any documented research evidence
Identify new topics that warrant further funding and research Improve systematic
reporting and collating of environmental evidence
gaps and clusters by keeping the database
regularly updated
Confirm to what extent research evidence exists in specific areas of policy
Policy and practice decisions in environmental management should be based on the best available
evidence. Better use of evidence in decision making can improve effectiveness of conservation interventions, avoid ineffective actions and justify
spending of limited conservation funding. However, there is a problem when research evidence on a
specific topic does not exist or if available evidence is insufficient or too scattered to inform environmental policy and practice. Evidence gaps are the areas in the evidence base with little or no evidence, and
evidence clusters are subsets of the evidence base where sufficient research evidence exists to allow full synthesis. Whilst evidence syntheses identify evidence gaps and clusters, there is as yet no systematic effort
to collate them to better focus primary research efforts or support funding decisions.
The Mistra Council for Evidence-Based Environmental Management (EviEM) works for environmental management to be placed on a scientific foundation. Through systematic reviews of environmental issues, we aim to improve the basis for decisions in Swedish environmental policy. MISTRA-EviEM is a centre of Collaboration for Environmental Evidence – a coordinating body for environmental evidence synthesis, currently financed by the Swedish Foundation For Strategic Environmental Research.
Collaboration forEnvironmental Evidence
The not-so-systematic reviews:challenges with misunderstanding
definitions in environmental sciences
When conducted well, systematic reviews can offer ‘gold standard’ evidence for use in decision-making. However, when done badly or when misunderstood, the evidence from a not-so-systematic review could be biased and incorrect. Here we discuss the problem with sub-standard reviews in conservation and environment management.
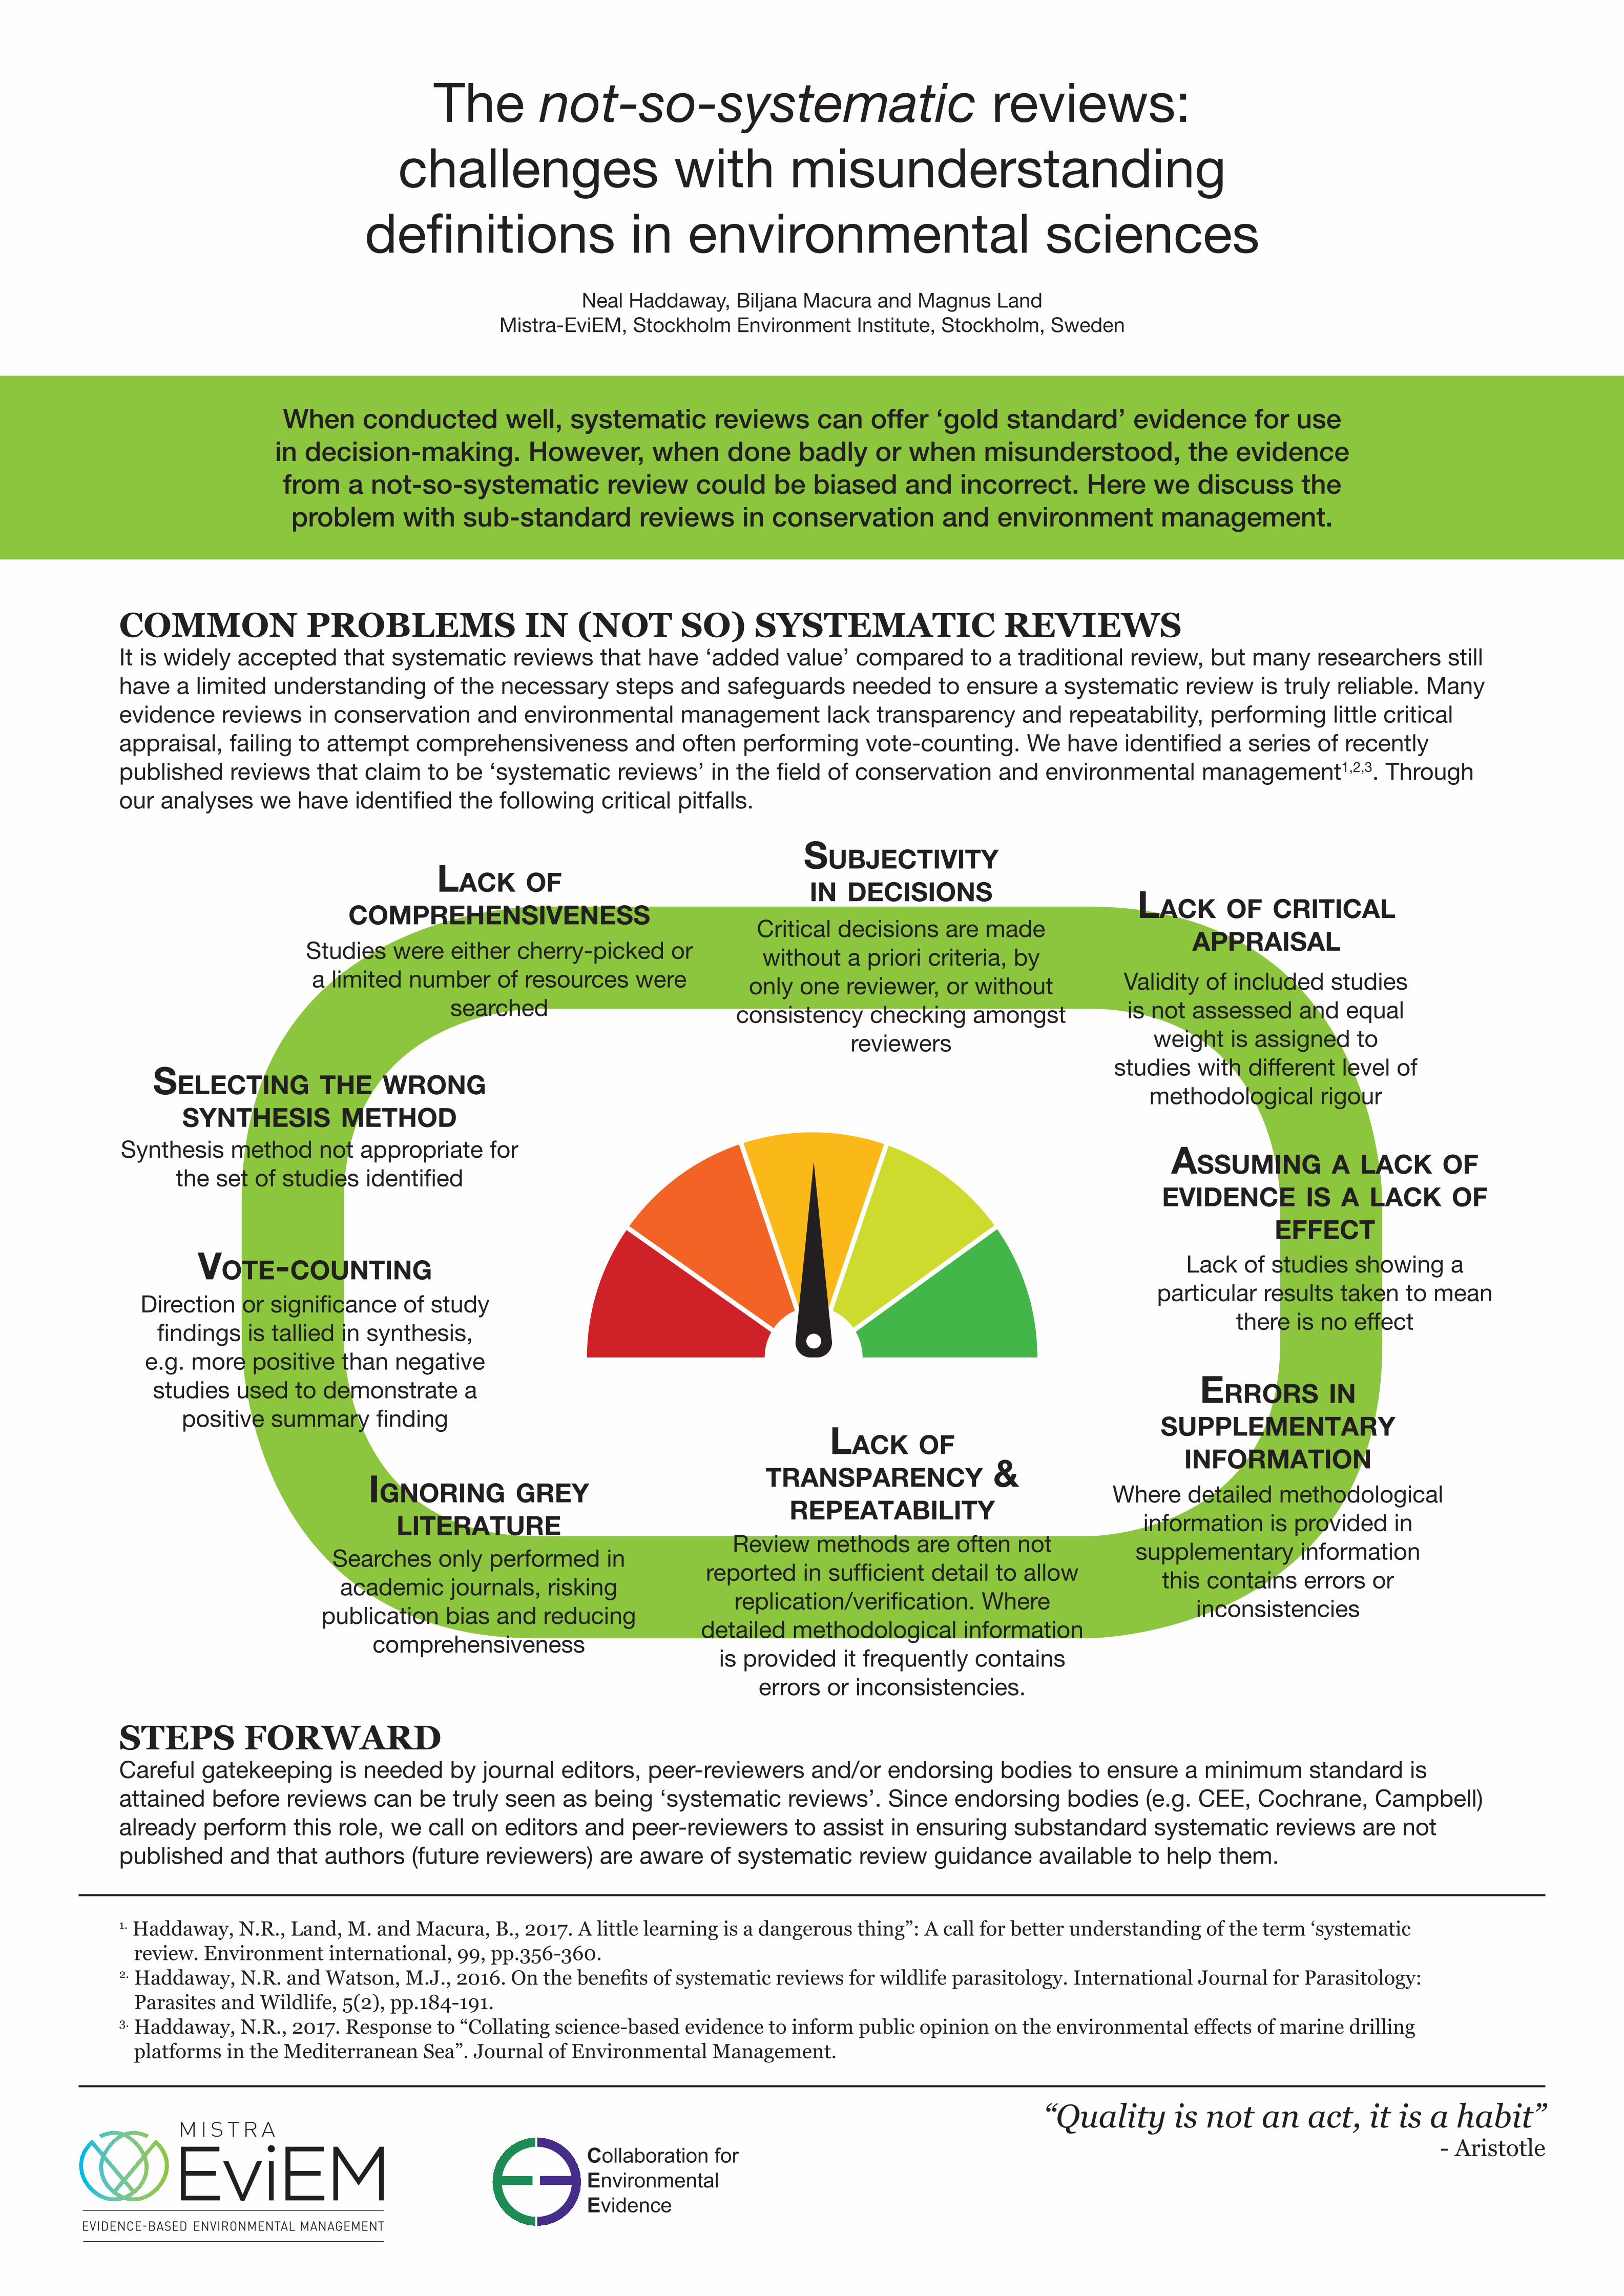
COMMON PROBLEMS IN (NOT SO) SYSTEMATIC REVIEWSIt is widely accepted that systematic reviews that have ‘added value’ compared to a traditional review, but many researchers still have a limited understanding of the necessary steps and safeguards needed to ensure a systematic review is truly reliable. Many evidence reviews in conservation and environmental management lack transparency and repeatability, performing little critical appraisal, failing to attempt comprehensiveness and often performing vote-counting. We have identified a series of recently published reviews that claim to be ‘systematic reviews’ in the field of conservation and environmental management1,2,3. Through our analyses we have identified the following critical pitfalls.
STEPS FORWARDCareful gatekeeping is needed by journal editors, peer-reviewers and/or endorsing bodies to ensure a minimum standard is attained before reviews can be truly seen as being ‘systematic reviews’. Since endorsing bodies (e.g. CEE, Cochrane, Campbell) already perform this role, we call on editors and peer-reviewers to assist in ensuring substandard systematic reviews are not published and that authors (future reviewers) are aware of systematic review guidance available to help them.
Neal Haddaway, Biljana Macura and Magnus LandMistra-EviEM, Stockholm Environment Institute, Stockholm, Sweden
1. Haddaway, N.R., Land, M. and Macura, B., 2017. A little learning is a dangerous thing”: A call for better understanding of the term ‘systematic review. Environment international, 99, pp.356-360.2. Haddaway, N.R. and Watson, M.J., 2016. On the benefits of systematic reviews for wildlife parasitology. International Journal for Parasitology: Parasites and Wildlife, 5(2), pp.184-191.3. Haddaway, N.R., 2017. Response to “Collating science-based evidence to inform public opinion on the environmental effects of marine drilling platforms in the Mediterranean Sea”. Journal of Environmental Management.
Lack of comprehensiveness
“Quality is not an act, it is a habit”- Aristotle
Studies were either cherry-picked or a limited number of resources were
searched
subjectivity in decisions
Critical decisions are made without a priori criteria, by
only one reviewer, or without consistency checking amongst
reviewers
Lack of criticaL appraisaL
Validity of included studies is not assessed and equal
weight is assigned to studies with different level of
methodological rigour
assuming a Lack of evidence is a Lack of
effect Lack of studies showing a
particular results taken to mean there is no effect
errors in suppLementary
information Where detailed methodological
information is provided in supplementary information
this contains errors or inconsistencies
Lack of transparency &
repeatabiLity Review methods are often not
reported in sufficient detail to allow replication/verification. Where
detailed methodological information is provided it frequently contains
errors or inconsistencies.
ignoring grey Literature
Searches only performed in academic journals, risking
publication bias and reducing comprehensiveness
vote-countingDirection or significance of study
findings is tallied in synthesis, e.g. more positive than negative studies used to demonstrate a
positive summary finding
seLecting the wrong synthesis method
Synthesis method not appropriate for the set of studies identified
Collaboration forEnvironmental Evidence
What is the effect of phasing out long-chain per- and polyfluoroalkyl substances (PFAS) on the concentrations of
perfluoroalkyl acids and their precursors in humans?Magnus Land1*, Cynthia A. de Wit2, Anders Bignert3, Ian T. Cousins2, Dorte Herzke4, Jana H. Johansson2, Jonathan W. Martin2,5
1) Mistra EviEM, Stockholm Environment Institute, Box 24218, SE-104 51 Stockholm, Sweden, 2) Department of Environmental Science and Analytical Chemistry,Stockholm University, Sweden, 3) Swedish Museum of Natural History, Stockholm, Sweden, 4) Norwegian Institute for Air Research, Tromsø, Norway, 5) Division of
Analytical and Environmental Toxicology, University of Alberta, Edmonton, Canada. *Corresponding author
ReferenceLand, M., de Wit, C.A., Cousins, I.T., Herzke, D., Johansson, J., Martin , J.W., 2015. What is the effect of phasing out long-chain per- and polyfluoroalkyl substances on the concentrations of perfluoroalkyl acids and their precursors in the enironment? A systematic review protocol. Environmental Evidence 4, 1-13.
Collaboration forEnvironmental Evidence
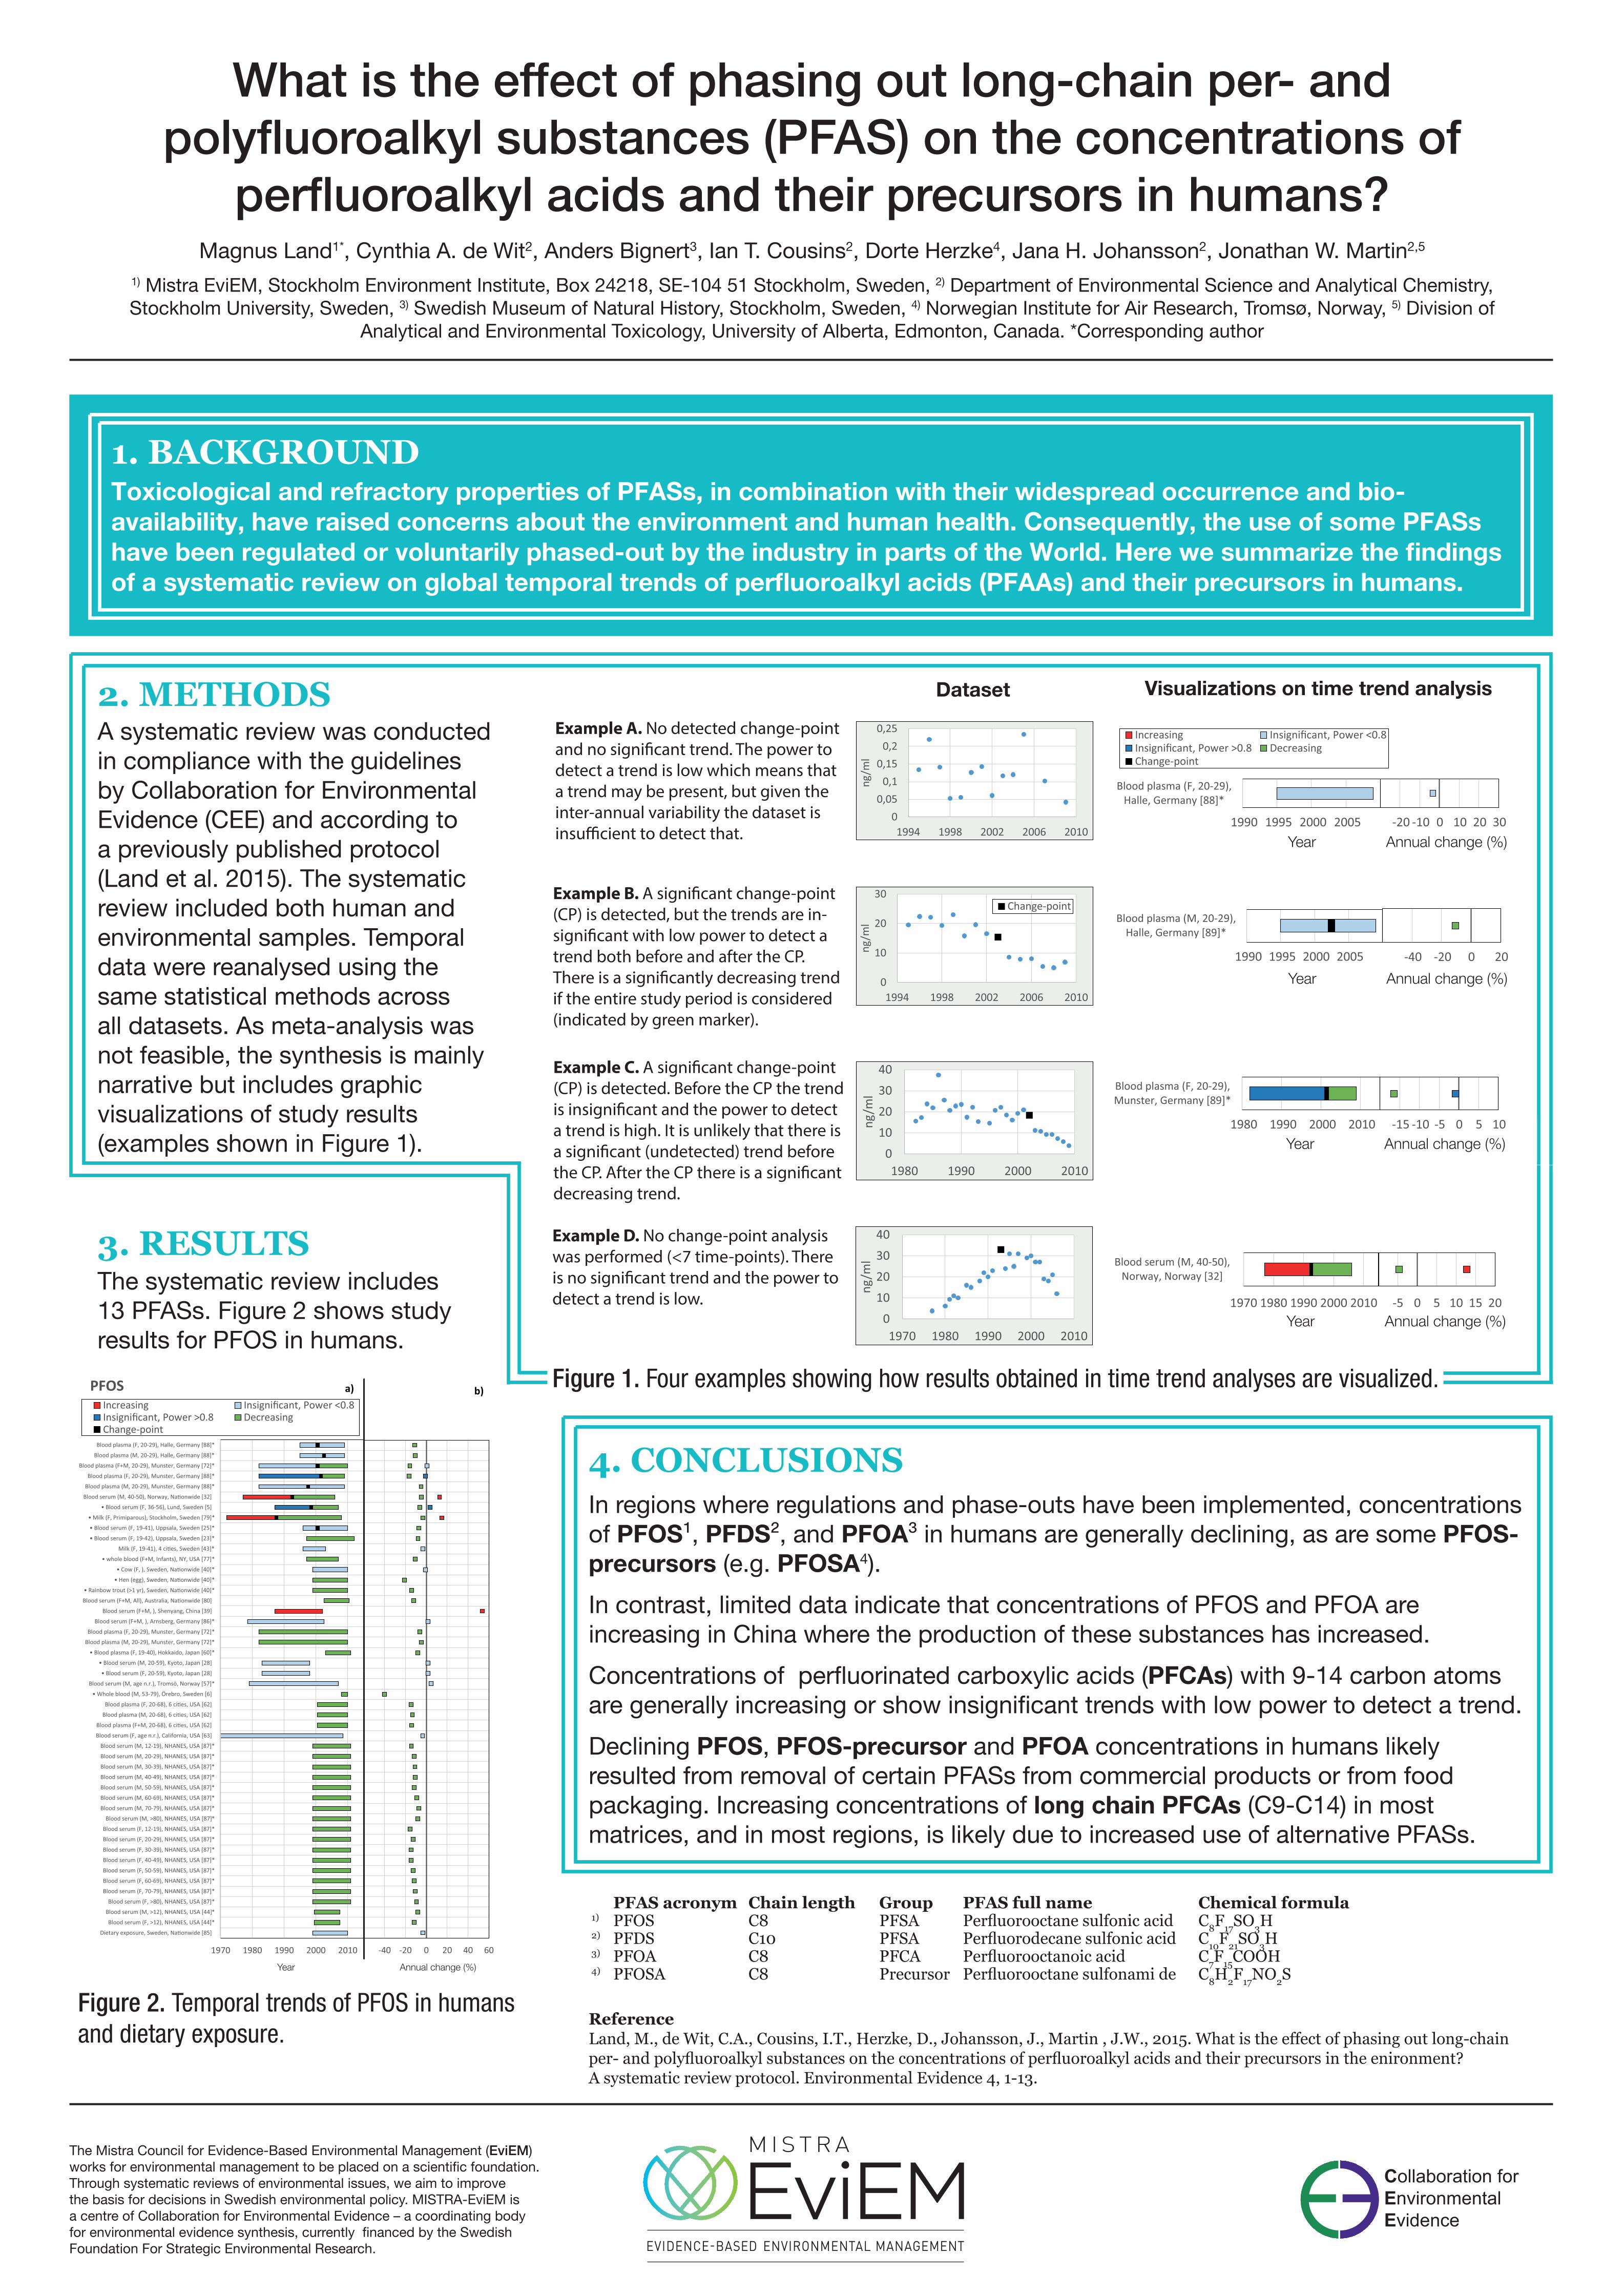
Figure 2. Temporal trends of PFOS in humans and dietary exposure.
2. METHODSA systematic review was conducted in compliance with the guidelines by Collaboration for Environmental Evidence (CEE) and according to a previously published protocol (Land et al. 2015). The systematic review included both human and environmental samples. Temporal data were reanalysed using the same statistical methods across all datasets. As meta-analysis was not feasible, the synthesis is mainly narrative but includes graphic visualizations of study results (examples shown in Figure 1).
Figure 1. Four examples showing how results obtained in time trend analyses are visualized.
010203040
1970 1980 1990 2000 2010
ng/m
l
010203040
1980 1990 2000 2010
ng/m
l
00,05
0,10,15
0,20,25
1994 1998 2002 2006 2010
ng/m
l
1990 1995 2000 2005
Blood plasma (F, 20-29),Halle, Germany [88]*
IncreasingDecreasing
Change-point
-20 -10 0 10 20 30Year Annual change (%)
Dataset Visualizations on time trend analysis
0
10
20
30
1994 1998 2002 2006 2010
ng/m
l
Change-point
1990 1995 2000 2005
Blood plasma (M, 20-29),Halle, Germany [89]*
Year Annual change (%)
-40 -20 0 20
-15 -10 -5 0 5 10Year Annual change (%)
1980 1990 2000 2010
Blood plasma (F, 20-29),Munster, Germany [89]*
1970 1980 1990 2000 2010
Blood serum (M, 40-50),Norway, Norway [32]
-5 0 5 10 15 20Year Annual change (%)
4. CONCLUSIONSIn regions where regulations and phase-outs have been implemented, concentrations of PFOS¹, PFDS², and PFOA³ in humans are generally declining, as are some PFOS-precursors (e.g. PFOSA4).
Declining PFOS, PFOS-precursor and PFOA concentrations in humans likely resulted from removal of certain PFASs from commercial products or from food packaging. Increasing concentrations of long chain PFCAs (C9-C14) in most matrices, and in most regions, is likely due to increased use of alternative PFASs.
In contrast, limited data indicate that concentrations of PFOS and PFOA are increasing in China where the production of these substances has increased.
Concentrations of perfluorinated carboxylic acids (PFCAs) with 9-14 carbon atoms are generally increasing or show insignificant trends with low power to detect a trend.
PFAS acronym Chain length Group PFAS full name Chemical formula1) PFOS C8 PFSA Perfluorooctane sulfonic acid C8F17SO3H2) PFDS C10 PFSA Perfluorodecane sulfonic acid C10F21SO3H3) PFOA C8 PFCA Perfluorooctanoic acid C7F15COOH4) PFOSA C8 Precursor Perfluorooctane sulfonami de C8H2F17NO2S
Toxicological and refractory properties of PFASs, in combination with their widespread occurrence and bio-availability, have raised concerns about the environment and human health. Consequently, the use of some PFASs have been regulated or voluntarily phased-out by the industry in parts of the World. Here we summarize the findings of a systematic review on global temporal trends of perfluoroalkyl acids (PFAAs) and their precursors in humans.
1. BACKGROUND
The systematic review includes 13 PFASs. Figure 2 shows study results for PFOS in humans.
3. RESULTS
The Mistra Council for Evidence-Based Environmental Management (EviEM) works for environmental management to be placed on a scientific foundation. Through systematic reviews of environmental issues, we aim to improve the basis for decisions in Swedish environmental policy. MISTRA-EviEM is a centre of Collaboration for Environmental Evidence – a coordinating body for environmental evidence synthesis, currently financed by the Swedish Foundation For Strategic Environmental Research.
-40 -20 0 20 40 60
b)
1970 1980 1990 2000 2010
Blood plasma (F, 20-29), Halle, Germany [88]*
Blood plasma (M, 20-29), Halle, Germany [88]*
Blood plasma (F+M, 20-29), Munster, Germany [72]*
Blood plasma (F, 20-29), Munster, Germany [88]*
Blood plasma (M, 20-29), Munster, Germany [88]*
• Blood serum (F, 36-56), Lund, Sweden [5]
• Milk (F, Primiparous), Stockholm, Sweden [79]*
• Blood serum (F, 19-41), Uppsala, Sweden [25]*
• Blood serum (F, 19-42), Uppsala, Sweden [23]*
• whole blood (F+M, Infants), NY, USA [77]*
Blood serum (F+M, ), Shenyang, China [39]
Blood serum (F+M, ), Arnsberg, Germany [86]*
Blood plasma (F, 20-29), Munster, Germany [72]*
Blood plasma (M, 20-29), Munster, Germany [72]*
• Blood plasma (F, 19-40), Hokkaido, Japan [60]*
• Blood serum (M, 20-59), Kyoto, Japan [28]
• Blood serum (F, 20-59), Kyoto, Japan [28]
Blood serum (M, age n.r.), Tromsö, Norway [57]*
• Whole blood (M, 53-79), Örebro, Sweden [6]
Blood serum (F, age n.r.), California, USA [63]
Blood serum (M, 12-19), NHANES, USA [87]*
Blood serum (M, 20-29), NHANES, USA [87]*
Blood serum (M, 30-39), NHANES, USA [87]*
Blood serum (M, 40-49), NHANES, USA [87]*
Blood serum (M, 50-59), NHANES, USA [87]*
Blood serum (M, 60-69), NHANES, USA [87]*
Blood serum (M, 70-79), NHANES, USA [87]*
Blood serum (M, >80), NHANES, USA [87]*
Blood serum (F, 12-19), NHANES, USA [87]*
Blood serum (F, 20-29), NHANES, USA [87]*
Blood serum (F, 30-39), NHANES, USA [87]*
Blood serum (F, 40-49), NHANES, USA [87]*
Blood serum (F, 50-59), NHANES, USA [87]*
Blood serum (F, 60-69), NHANES, USA [87]*
Blood serum (F, 70-79), NHANES, USA [87]*
Blood serum (F, >80), NHANES, USA [87]*
Blood serum (M, >12), NHANES, USA [44]*
Blood serum (F, >12), NHANES, USA [44]*
PFOSIncreasing
DecreasingChange-point
a)
Year Annual change (%)