story arc the ohio state university - john glenn college of...
TRANSCRIPT
The Ohio State University
Jon JohnsonWalton College Professorship of Sustainability
Sam M. Walton College of Business
Story Arc
1
Vision
To advance science to drive a new generation of innovative products and supply networks that address environmental, social, and economic imperatives
Mission
To design and implement credible, transparent and scalable science-based measurement and reporting systems accessible for all producers, retailers, and users of consumer products
The Sustainability Consortium (TSC)
Enabling the consumer goodsindustry to do things that matter
about things that matter.
The Basics
• Founded (2009) by UA and ASU• Membership organization (~100 members)
– Corporate, academic, NGO, commercial associations, government• >20 FTE staff, plus students and contractors
– Kara Hurst, CEO– Jon Johnson (UA-Walton College) & Kevin Dooley (ASU-Carey School),
Academic Directors– Internationally dispersed
• Expanding from knowledge/metrics creation Action

Board of Directors
Administering Universities
Corporate Advisory Council
Civil Society Advisory Council
Academic Advisory Council
TSC’s multi-stakeholder approach allows for pre-competitive collaboration…
TSC’s Board of Directors represent all stakeholder groups across several industries…
Governance AcademicPartners
CivilSociety
OrganizationsCorporations
TSC’s membership represent over $1.5 trillion in revenue…
And is growing… Academic collaborators include…
Industry partners contribute to the success of TSC everyday…
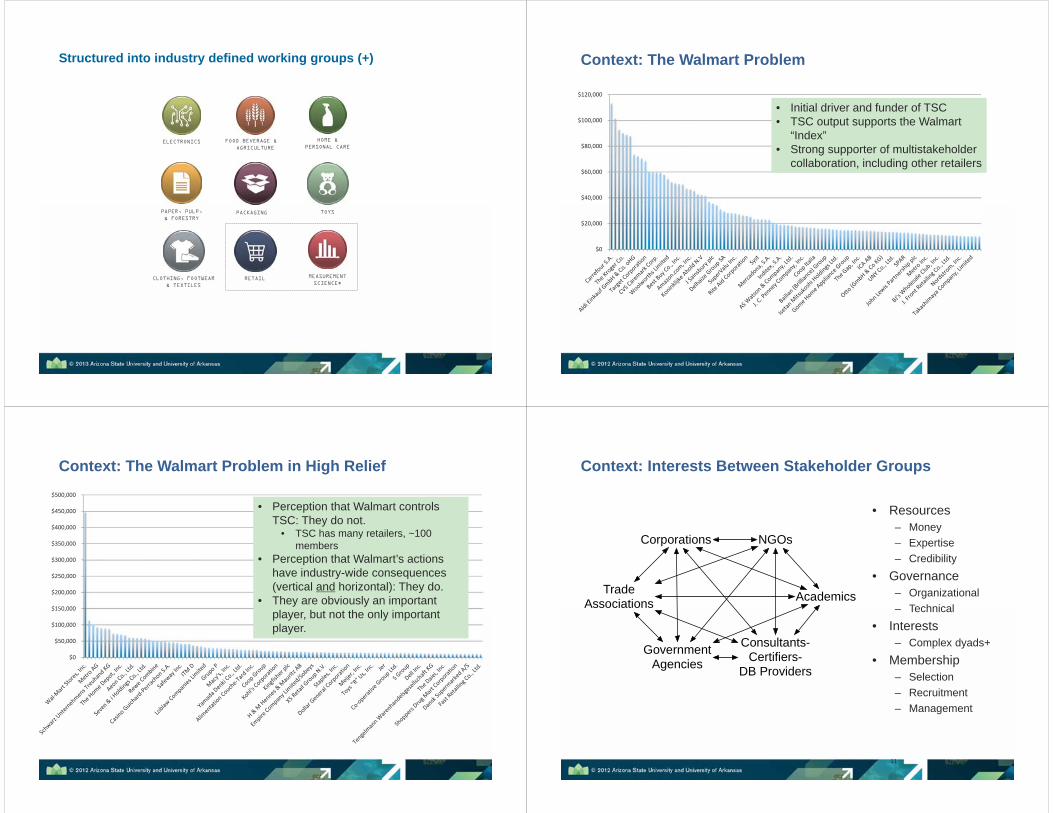
Structured into industry defined working groups (+)
ELECTRONICS FOOD BEVERAGE &AGRICULTURE
HOME & PERSONAL CARE
PAPER, PULP, & FORESTRY
PACKAGING TOYS
RETAIL MEASUREMENT SCIENCE*
CLOTHING, FOOTWEAR & TEXTILES
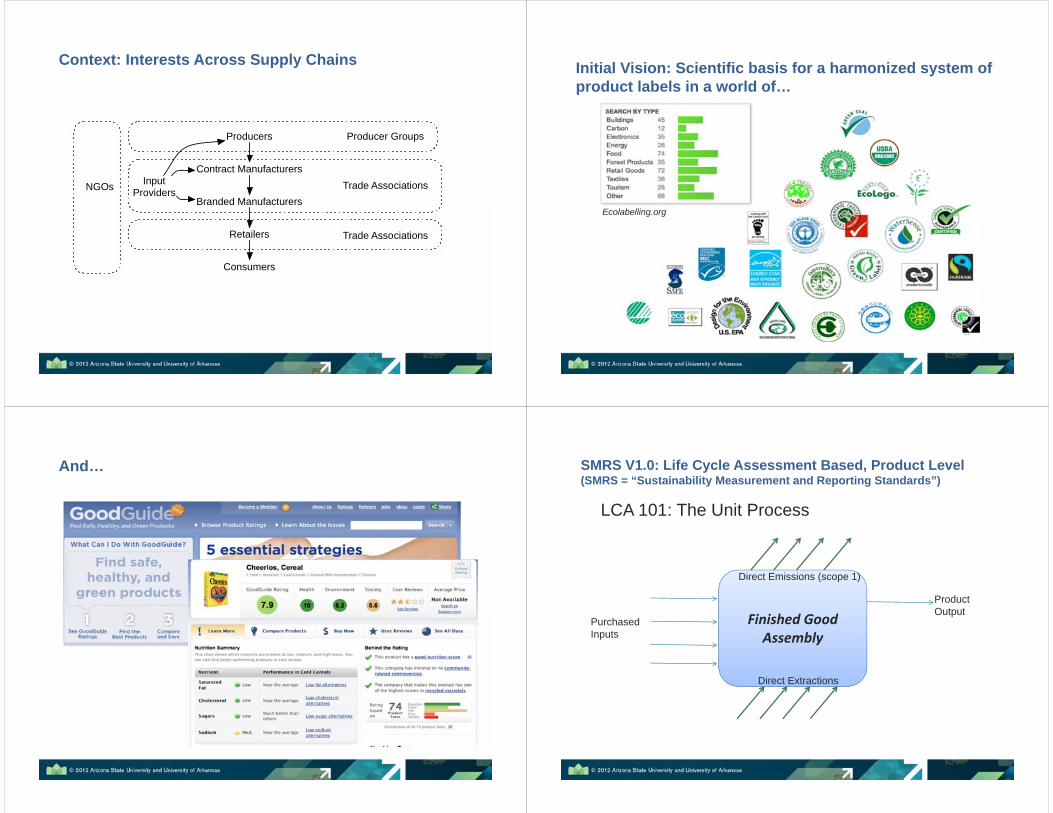
Context: The Walmart Problem
$0
$20,000
$40,000
$60,000
$80,000
$100,000
$120,000
• Initial driver and funder of TSC• TSC output supports the Walmart
“Index”• Strong supporter of multistakeholder
collaboration, including other retailers
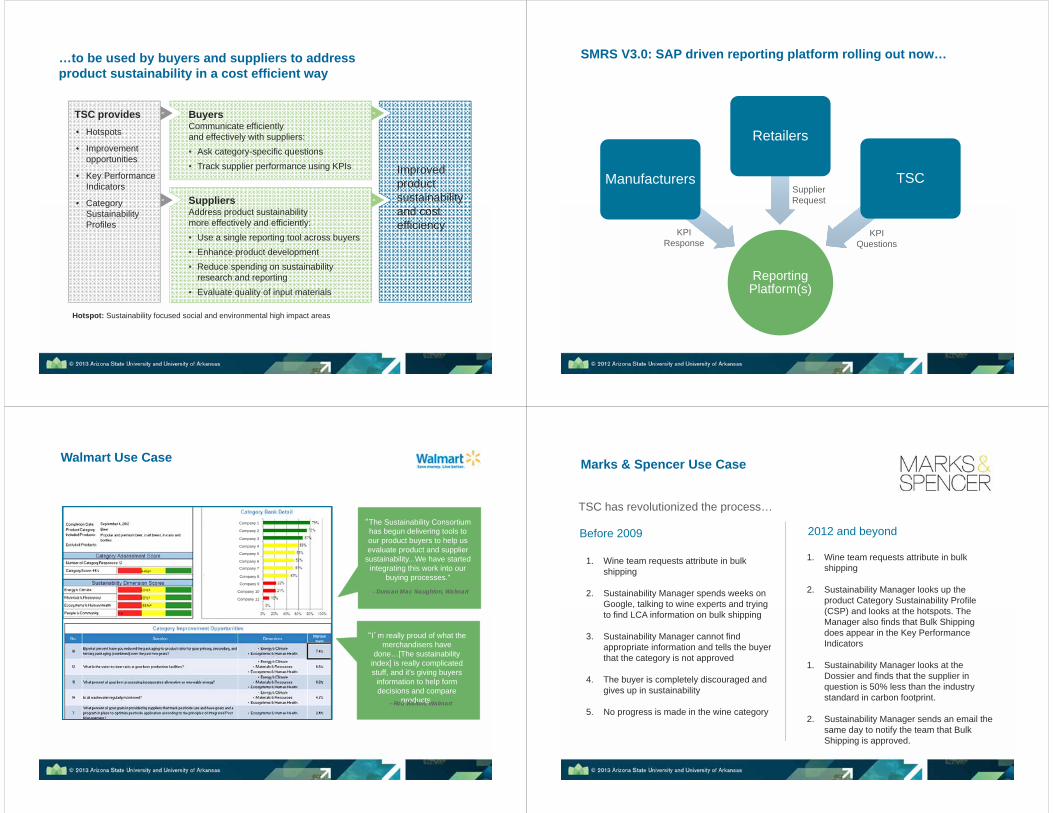
Context: The Walmart Problem in High Relief
$0
$50,000
$100,000
$150,000
$200,000
$250,000
$300,000
$350,000
$400,000
$450,000
$500,000
• Perception that Walmart controls TSC: They do not.
• TSC has many retailers, ~100 members
• Perception that Walmart’s actions have industry-wide consequences (vertical and horizontal): They do.
• They are obviously an important player, but not the only important player.
Context: Interests Between Stakeholder Groups
• Resources– Money– Expertise– Credibility
• Governance– Organizational– Technical
• Interests– Complex dyads+
• Membership– Selection– Recruitment– Management
11
Corporations NGOs
AcademicsTradeAssociations
GovernmentAgencies
Consultants-Certifiers-
DB Providers
Context: Interests Across Supply Chains
12
Producers
Branded Manufacturers
Retailers
Consumers
InputProviders
Producer Groups
Trade Associations
Trade Associations
NGOs
Contract Manufacturers
Initial Vision: Scientific basis for a harmonized system of product labels in a world of…
Ecolabelling.org
And… SMRS V1.0: Life Cycle Assessment Based, Product Level(SMRS = “Sustainability Measurement and Reporting Standards”)
Finished GoodAssembly
Direct Emissions (scope 1)
Direct Extractions
Purchased Inputs
Product Output
LCA 101: The Unit Process

SMRS V1.0: Unit Processes Product Life Cycles SMRS V1.0: Life Cycles Span Supply Networks
SMRS V1.0: LCA Based, Product Level
18
TSC SCOPE
SMRS V2.0: A hybrid approach(SMRS: “Sustainability Measurement and Reporting Systems”)
A pure LCA approach is not economically scalable across all consumer products
A pure "best practices" approach lacks precision and tends to weigh each best practice equally, regardless of impact
19
BASELINE LCAMODEL FORPRODUCTCATEGORY
SUSTAINABILITYPERFORMANCE
DRIVERS(VARIABLES & ATTRIBUTES)
PRIMARYDATA
IMPACTS

SMRS V2.0: Three step reporting
20
Reporting Category 1
Reporting Category 2
Reporting Category 3
Reporting Category 4
:
PRIMARY DATAAND THEIRIMPACTS
BASELINELCAFOR
PRODUCTCATEGORY
PRE-DEFINEDSUSTAINABILITY PERFORMANCE
DRIVERSAND THEIR IMPACTS
1. Every product has same scores
2. Every product with same attributes has same scores
3. Every product potentially has different scores
(optional)
http://www.open-io.org
SMRS V2.0: US Tax Code analogy
1040EZ
1040LONG FORM
OtherSchedules &
forms
1040
BASELINE MODEL SUSTAINABILITYPERFORMANCE
DRIVERS
PRIMARY OR PROPRIETARY DATA
REQUIREDOPTIONAL FOR
POSITIVE DRIVERSOPTIONAL
A SMRS should support all three reporting alternatives
21
SMRS V3.0: Product Category Level
Category Dossier
Collection of evidence onproduct category and its supply chain, environmental and social hotspots, and improvement opportunities
Category Sustainability Profile (CSP)
Synthesis of product sustainability knowledge and improvement opportunities
Key Performance Indicators (KPIs)
Metrics / questions to measure and track product category sustainability
• Knowledge products aimed at B2B actors, focused on product categories• Entirely new system and processes
SMRS V3.0: Process Flow
TSC members, invited experts form Panel to address a set of categories
DOSSIERList of hypothesized hotspots and
improvement opportunities
Panel is surveyed, generates hotspots and improvement opportunities
TSC staff aggregate hotspot survey data, published research, and relevant previous work
CSPList of assessed hotspots and improvement opportunities
TSC staff assess published research classify as hotspot, additional issue, stakeholder concern; document in Dossier and final CSP
Develop KPI’s through workshops
KPI’s
11
22
33 44
55
BuyersCommunicate efficiently and effectively with suppliers:• Ask category-specific questions• Track supplier performance using KPIs
SuppliersAddress product sustainability more effectively and efficiently:• Use a single reporting tool across buyers• Enhance product development• Reduce spending on sustainability
research and reporting• Evaluate quality of input materials
vv
vv
…to be used by buyers and suppliers to address product sustainability in a cost efficient way
Improved product sustainability and cost efficiency
• Hotspots
• Improvement opportunities
• Key Performance Indicators
• Category Sustainability Profiles
TSC provides v vvvvvv vv
Hotspot: Sustainability focused social and environmental high impact areas
SMRS V3.0: SAP driven reporting platform rolling out now…
Reporting Platform(s)
Manufacturers
Retailers
TSC
KPI Questions
KPI Response
Supplier Request
Walmart Use Case
Company 1
Company 2
Company 3
Company 4
Company 5
Company 6
Company 7
Company 8
Company 9
Company 10
Company 11
“The Sustainability Consortium has begun delivering tools to our product buyers to help us evaluate product and supplier
sustainability...We have started integrating this work into our
buying processes.”
– Duncan Mac Naughton, Walmart
“I’m really proud of what the merchandisers have
done…[The sustainability index] is really complicated stuff, and it's giving buyers
information to help form decisions and compare
products. – Rob Walton, Walmart
Marks & Spencer Use Case
TSC has revolutionized the process…
Before 2009
1. Wine team requests attribute in bulk shipping
2. Sustainability Manager spends weeks on Google, talking to wine experts and trying to find LCA information on bulk shipping
3. Sustainability Manager cannot find appropriate information and tells the buyer that the category is not approved
4. The buyer is completely discouraged and gives up in sustainability
5. No progress is made in the wine category
2012 and beyond
1. Wine team requests attribute in bulk shipping
2. Sustainability Manager looks up the product Category Sustainability Profile (CSP) and looks at the hotspots. The Manager also finds that Bulk Shipping does appear in the Key Performance Indicators
1. Sustainability Manager looks at the Dossier and finds that the supplier in question is 50% less than the industry standard in carbon footprint.
2. Sustainability Manager sends an email the same day to notify the team that Bulk Shipping is approved.

Ahold Use Case
ProactiveInnovation
The Future
Key environmental and social hotspots
After establishing the SMRS knowledge base…
• Update and maintain SMRS
• Shift focus to “action projects”--multistakeholder, supply chain wide collaborations that build on SMRS
• Expand services (e.g., training, analytics, consultation)
After establishing the SMRS knowledge base…
• Update and maintain SMRS
• Shift focus to “action projects”--multistakeholder, supply chain wide collaborations that build on SMRS
• Expand services (e.g., training, analytics, consultation)
Transparent, standardized
and harmonized systems
"There is space for everyone at The Sustainability Consortium no matter what point along the sustainability journey you are on."
Brandon Tidwell, Darden Restaurants
On-going Challenges
• Long term structure, governance and decision making
• Academic engagement• Diversified revenue model• International expansion
30
Membership Dues Contributions
Corporations
Tier I$100,000 Annually (companies with more than $500m annual revenue)
$25,000 Annually (fewer than 500 employees and/or less than $500m in revenue)
Tier II$50,000 Annually(companies with more than $500m annual revenue)
$10,000 Annually(fewer than 500 employees and/or less than $500 in revenue)
Tier I$25,000 Annually (non-profits with assets more than $50M US)
$10,000/Year (assets less than $50M US)
Tier II$10,000 Annually(non-profits with assets more than $50M US)
$5,000 Annually (assets less than $50M US)
All Members$10,000 annually
NOTE: All dues contributions are paid through a 501c3, institution of higher education. Consult a tax professional about the tax deductibility.
Civil Society Organizations Regulatory Entities
