storage system for harvested energy in iot...
TRANSCRIPT

Page | 1
Independent thesis, 15 HE credits, for Degree of Bachelor Programme in
Computer Science and Engineering, specialization in Embedded
Systems Spring semester 2018
Faculty of Natural Sciences
Storage System for Harvested Energy in
IoT Sensors
Author: Saif Alhuttaitawi

Page | 2
Författare/Author
Saif Alhuttaitawi
Titel/Title Storage System for Harvested Energy in IoT Sensors
Handledare/Supervisor (University) Dawit Mengistu
Handledare/Supervisor (Company) Lars Jönsson, Magnus Abrahamsson
Examinator/Examiner Fredrik Frisk
Abstract
This work presents an energy system design for wireless sensor networks (WSNs) after
applying our design the WSN should theoretically have an infinite lifetime. Energy harvesting
sources can provide suitable energy for WSN nodes and reduce their dependence on battery.
In this project, an efficient energy harvesting and storage system is proposed. By using (two
supercapacitors and four DC/DC converters with step up /step down capabilities) all of them
controlled by Microcontroller via switches to consider the best way to save energy to keep the
WSN alive as long as possible. The usage of supercapacitors as an energy buffer to supply the
sensor components (microcontroller and radio) with energy it needs to work. We could control
the energy flow according to a specific voltage levels in supercapacitors to guaranty the full
functionality for WSN with minimizing the loss of energy, and that’s leads to long time life for
the wireless sensor node WSN. Another important thing we find in our experiment that is the
inner leakage of the supercapacitor and how it has a critical effect on how long it can serve our
system with energy. This paper contains on two theoretical sections (Part one and part two)
which are based on literature reviews, and one experimental section (Part three) based on
experimental building the prototype, coding and testing.
Keywords
Renewable energy, Power management, Energy harvesting, Energy storage, Super capacitor
Page | 3
Contests
1 Introduction ......................................................................................................................... 4
1.1 Research Questions: .................................................................................................... 5
1.2 Motivation ................................................................................................................... 5
1.3 Background ................................................................................................................. 6
1.4 Related Work............................................................................................................... 7
2 Medothology ....................................................................................................................... 8
2.1 Storage Unit for Harvested Energy ............................................................................. 8
2.1.1 Supercapacitor vs Rechargeable Battery ........................................................... 10
2.1.2 Theories.............................................................................................................. 12
2.2 System Topology and Component Selection ............................................................ 14
2.2.1 Supercapacitor Behaviour: ................................................................................. 14
2.2.2 DC/DC converter ............................................................................................... 14
2.2.3 Energy flow control ........................................................................................... 15
2.3 Implementation of Proposed System (The experiment was done at Sensative AB) . 16
2.3.1 Experiment setups .............................................................................................. 17
3 Results ............................................................................................................................... 24
3.1 Results for RQ1 ......................................................................................................... 24
3.2 Results for RQ2 ......................................................................................................... 25
3.2.1 Determine the DC/DC converter ....................................................................... 25
3.2.2 Energy flow control among system components ............................................... 26
3.3 Results for RQ3 ......................................................................................................... 30
4 Discussion ......................................................................................................................... 35
4.1 Observations from results.......................................................................................... 35
4.2 Future Work .............................................................................................................. 36
5 Conclusion ......................................................................................................................... 37
6 References ......................................................................................................................... 39

Page | 4
1 Introduction
Carried out in collaboration with Sensative AB – Lund, Sweden, the company has a main
field is producing smart home sensors called strips sensors [1], this project presents a study and
create a prototype for energy management system, for the new generation of strips sensors.
Now days the power unit used to supply strips sensors with energy is Li-on Battery (Figure 1),
that battery has 3Volts as voltage level and current supply 480mAh, theoretically it can provide
their sensor with energy for 10 years.
Figure 1 (Strips Sensor)
Our task in the company is to replace the energy storage system they have with storage system
for harvested energy (Figure 2), in this paper we assume we have a solar cells that intend to
provide 0.2mA current, the sensor has two loads, the first load is the microcontroller (MC)
which has an operational voltage 1.8V – 3.6V and consume 5mA current in 5mS, the
microcontroller will operate every Second to check if there is any change in sensor value, the
second load is the wireless radio (RF) which has an operational voltage 2.5V – 3.6V and
consume 50mA current in 50mS, the radio will operate every 30 minutes to send signals and
alarms.
Figure 2 (Energy System overview)
In this paper we will take only the highlighted area in (Figure 2), which is the energy storage
and the power distribution, with respect of energy we get from solar cells as input and store the
energy to distribute it to the MC and RF as an output.

Page | 5
1.1 Research Questions:
To achieve the objectives of this study, the work is divided to parts to address the following
research questions:
1. What are the architectural requirements of the storage unit for harvested energy in
sensors?
2. What hardware components are available to realize the storage in a way that
minimizes loss of energy?
3. How can an efficient monitoring and control system be being built?
1.2 Motivation
An essential part of Internet of Things (IoTs) is the wireless sensor network (WSN). These
networks have been widely used in various civilian and military applications. Few application
examples include: emergency recovery, patient health monitoring, air quality monitoring etc.
One of the most critical problems of wireless sensor networks is that they operate with limited
battery lifetime. Therefore, the (energy harvesting and storing) is recognized as the most
important factor in WSN. Sensor energy storing units must be energy efficient.
There are also additional problems associated with use of batteries with limited lifetime in
WSN:
• Unnoticed power failures on nodes degrade the system reliability and may lead to total
system failure.
• From economic point of view, replacing exhausted batteries frequently incurs
additional cost of material and labour on the owners. However, self-powered WSNs
can operate indefinitely without human intervention.
• The disposal of exhausted and expired batteries with hazardous chemical contributes to
serious problems to the environment.
Recognizing the need for energy harvesting solutions for WSN, a company called Sensitive
AB initiated this project. The company is based in Lund-Sweden, with main specialization is
the manufacturing of sensors. The company wants to develop sensors called strips sensors [1].
These sensors are used for temperature, water leakage and light intensity. At present, strips
sensors use normal Li-On battery as energy source.
Page | 6
The goal of this project is to replace the Li-On battery with efficient storage system for
harvested energy, to extend the lifetime of the sensors (longevity). To test our findings, we
shall use a simple and flexible platform that is easily implemented with commercial off-the-
shelf (COTS) components.
1.3 Background
In the past few years, Wireless Sensor Networks (WSN) technology has moved from the
research domain to providing commercial solutions for many real-world applications.
Currently, several WSN products have already been deployed in large volumes in commercial
applications. By monitoring artificial lighting, temperature, carbon dioxide level, relative
humidity, positioning of external shading devices, and, a considerable percentage of energy
can be saved, and human comfort levels can be improved. Another example of WSN is alarm
systems used to secure our homes, shops and other buildings from fire, theft and accidents.
However, one major bottleneck for all WSN deployments that is yet to be solved is, the limited
system lifetime due to the insufficient energy capacity of the small form factor battery power
supply. The battery lifetime is worsened due to leakage currents, temperature fluctuations,
environmental humidity, and other variable factors.
With the increasing deployment scale of devices in WSN systems, the market demands a
“deploy and forget” solution requiring the elimination of a battery replacement and
maintenance cycle. Energy harvesting technology could lead to the possibility of self-
sustaining power supply with “infinite” lifetime. This is becoming a significant focus area in
WSN research in recent years because of the necessity or bridging the gap between the
continuous power consumption and the limited available energy from the battery technology
[2].
Potential application scenario for “deploy and forget” solution could be fluorescent lighting in
a hospital or an industrial environment, where the energy source for room monitoring systems
can be built with energy harvesting WSNs. This kind of energy source can provide a continuous
energy, because the indoor lights are usually switched on all the time.

Page | 7
1.4 Related Work
Many publications detailing researches and theories on energy-harvesting power
management and its incorporation on WSNs can be found, we find three of them (Heliomote,
Prometheus and Everlast). Papers focused on energy harvesting circuits for WSN don’t address
networking and communication aspects of WSN. In Heliomote they use the rechargeable
battery as main energy harvesting storage, However the booting time for this method takes
many hours. In Prometheus they use a combination of supercapacitor and rechargeable battery,
they take the advantage of half-million deep charging and discharging cycles in supercapacitor
and use it as a first energy buffer, the main energy buffer was the rechargeable battery, however
this method they use is good but not good enough, though this solution failed, because of the
rechargeable battery it needs a lot of energy in order to start to work, plus the supercapacitor
cannot hold the energy radio needed in order to operate. Everlast use only supercapacitor, they
could have the system up for 20 years, but the booting time takes more than an hour. More
investigation on theories we include in this paper in chapter medothology.
Energy sources for WSNs should be clean, cheap and always available. The most widely
proposed sources until now are sun, wind and vibration. Among them, solar energy is the
nearest to “always available” paradigm. However, in cloudy days or at night, it is difficult to
harvest solar energy. Thus, solar energy needs to be transformed and buffered in a well-
designed power management system to guarantee nodes functionality [3].
Researches for the new power management systems that based on supercapacitor do not focus
on an important obstacle (when the WSN exhausted all the buffered harvested energy) the
booting time from exhausting for WSN, however they failed to reach a good booting time for
the WSN microcontroller, some of WSNs took couple of hours before it boots even when there
is good amount of energy stored in the supercapacitor, because it has to reach enough amount
of voltage as well.

Page | 8
2 Medothology
This section contains on three sub sections,
Chapter 2.1 is a literature study, it will be our approach to tackle the first research question.
Chapter 2.2 we use a literature study and the results from previous chapter to answer the
second research question.
Last research question we will address it by an experimental work and testing, all we include
in chapter 2.3.
2.1 Storage Unit for Harvested Energy
In this section, we will investigate the most suitable storage unit for the harvested energy. We
researched resources on the internet to find out the best way to store the harvested energy,
focusing on cycles of recharging, size, effect on the environment and price, the section will
include two comparisons to determine the best storage unit for our system.:
- Between Capacitor and Supercapacitor
- Between regular battery and rechargeable battery
Later, we will make a comparison between the best choices of the two comparisons to pick the
best choice. We didn’t compare all the 4 storage units together in same time to make it clear
and simple to the reader. Later in this section, we will include information about our storage
system choice.
Capacitor and Supercapacitor
The capacitor is made of 2 close conductors (usually plates) that are separated by a dielectric
material. The plates accumulate electric charge when connected to power source. One plate
accumulates positive charge and the other plate accumulates negative charge. The capacitance
is the amount of electric charge that is stored in the capacitor at voltage of 1 Volt. The
capacitance is measured in units of Farad” (F) [4] [5].
A supercapacitor has higher energy density than a normal capacitor. Thus, the energy capacity
of the supercapacitor is hundreds of times larger than the normal capacitor (when they have the
same volume) [6].

Page | 9
Factor Capacitor Supercapacitor
Energy
density
Lower than supercapacitor Much higher than normal capacitor
Energy
capacity
Lower than supercapacitor hundred times larger than normal capacitor.
Price Cheaper More expensive
Table 1 Comparation between Capacitor and Supercapacitor
We can summarize from Table 1 that the supercapacitor is more suitable for a WSN project,
because it can store more energy in the same volume.
Regular Batteries and Rechargeable Batteries
Many people do not realize the internal differences of normal and rechargeable batteries. “Both
batteries produce energy through an electrochemical reaction that involves an anode, cathode,
and electrolyte. When the battery is discharging, the anode is the negative terminal and the
cathode is the positive terminal. These two components, referred to as electrodes, occupy the
most space in a battery and are also where the chemical reactions occur. When they are
connected to an electrical conductor, an electrical charge flows freely between them, from
anode to cathode. When this occur, the electricity will flow into the medium” [7].
The difference between both batteries is that the chemical reaction is reversible with a
rechargeable battery: when electrical energy from an external source (e.g., a charger) is applied
to the battery’s secondary cell, the negative-to-positive electron flow that occurs during
discharge gets reversed. As this happens, the cell’s charge gets restored [7].
Factor Battery Rechargeable battery
Usability Can be used one time Can be recharged up to 500 times
For
environment
Less friendly, due the expired batteries
with hazardous chemical contributes.
Friendlier because it can be used rather
than changing many regular batteries.
Price Cheaper More expensive
Table 2
Summary: the rechargeable battery is more suitable than regular battery as a solution for
WSN.
Page | 10
2.1.1 Supercapacitor vs Rechargeable Battery
We will compare two main storage units that are commonly used Wireless sensor networks,
i.e., supercapacitors and rechargeable batteries.
Amount of charge cycles
A supercapacitor has a much higher number of charge-discharge cycles than any current
rechargeable battery technology. Normally, it has over one million full charge-discharge cycles
(deep cycles) compared to a rechargeable battery which has less than 1000 cycles [8].Thus, for
supercapacitors, replacement is unlikely to be required over its operational lifetime.
Economic aspects
We use a simple example as follows: take a 350F capacitor with a capacity of 240 mAh from
Maxwell Technologies costing $20 each. Rechargeable battery with similar specifications cost
$90 per unit. Since a single supercapacitor will outlive half a dozen batteries with total cost
exceeding $90. Furthermore, the supercapacitor has the reduced maintenance advantage. With
anticipated price drop and mass production, the cost of supercapacitors is expected to be
significantly lower the overall cost of operating the sensor network [9, 10].
Power density
Supercapacitors have higher power density than the rechargeable battery. The higher power
density allows the supercapacitor to be charged more quickly than the rechargeable battery,
and that mean faster WSN booting time from exhausting mode [11].
Energy density
The energy density of supercapacitors is less than rechargeable batteries by an order of
magnitude. However, when used in conjunction with a suitable solar cell, the supercapacitor
should be able to sufficiently power the node when there is not enough sunlight in the
environment. Well-designed power management techniques should also be able to build the
energy density gap between supercapacitors and batteries [9].

Page | 11
Circuit complexity
The charging circuit for a rechargeable battery is more complicated than those required for
supercapacitors. “This increase in system complexity is more significant in solar panel-based
harvesters, since the solar panel’s intrinsic voltage limited current source characteristics make
it difficult to charge the battery with a constant current. In addition, the Li-ion battery also
requires a deep-discharge protection circuit, further increasing the system complexity” [11, 8].
Self-Impedance
An important factor to calculate is the impedance, since impedance effects on consuming
energy, when the impedance is high the consuming of energy is high too. The supercapacitor
has a lower impedance compared with the rechargeable batteries [8].
(Charge / Discharge) temperature
The supercapacitor can charge under temperature –40 to 65°C (–40 to 149°F) and discharge
under same temperature while the rechargeable battery can be charged under 0 to 45°C (32°to
113°F), discharge on temperature –20 to 60°C (–4 to 140°F). Here there is also an advantage
for using the supercapacitor over the rechargeable battery in our WSN due the functional
temperature range is higher than the rechargeable battery [8, 10].
Effects on environment
From environment perspective, the disposal of exhausted and expired batteries with hazardous
chemical contributes to serious problems. Such a problem we don’t face when we use
supercapacitor since they are more environment friendly [10].

Page | 12
A summary for comparation between supercapacitor and rechargeable battery in table 3.
Factor Supercapacitor Rechargeable battery
Amount of charge
cycles
Up to one million times of deep
charging / discharging
Can be recharged up to 500
times
Environment friendly Friendlier Less friendly
Price Cheaper Expensive
Functional temperature Work under wider range
temperature compared with
Rechargeable battery
Work under more narrow
range of temperature
compared with SC
Power density High power density makes it
faster to charge
Less power density, slower to
be charged
Energy density Low energy density, this issue
can be attacked with a good
power management system
High energy density
Circuit complexity Simple circuit design Complex circuit design
Impedance
(Inner resistance)
Low High
Table 3 Summery comparation between Supercapacitor and Rechargeable battery
2.1.2 Theories
By studying some theories deals with energy harvesting system, we could have some ideas
about the storage unit architecture for the energy we harvested. Some of those theories are:
• Heliomote
This theory is about system that containing on photovoltaic cells directly connected to two AA-
type NiMH batteries as its energy storage with a diode to protect the photovoltaic cells from
back energy flow from the rechargeable battery.
This platform was simple and easy to implement but it has some disadvantages such as:
1. Due The limited recharge cycles for rechargeable batteries, the system lifetime is
reduced to less than two years [12].
2. The harvested energy is only reserved when the output voltage from the Photovoltaic
is 0.7 volts higher than the battery due the diode voltage drops.

Page | 13
• Prometheus
This has a design like Heliomote, but with a hybrid energy storage system. It is a combination
of a rechargeable battery and supercapacitor to overcome the limited system lifetime When the
supercapacitor is fully charged, the surplus energy charges the battery. Otherwise, when the
supercapacitor voltage is below a predefined threshold voltage for the WSN, the demanded
energy is driven from the battery. This way, the energy consumed by the WSN node is mostly
served by the supercapacitor and reduces access to the rechargeable battery. This solution takes
advantage of more than half a million recharge cycles of a supercapacitor Therefore, the battery
lifetime can be extended up to four years under an average of 10% load [10].
• Everlast
This method takes advantage of use supercapacitors. Using this method makes it possible for
the system to operate for an estimated lifetime of 20 years without any maintenance. “The
novelty of this system lies in the feed-forward, pulse-frequency modulated (PFM) converter
and open-circuit solar voltage method for maximum power point tracking (MPPT) [9]”, it
enables the solar cell to efficiently charge the supercapacitor and power the WSN.
Experimental results show that Everlast can achieve low power consumption, long operational
lifetime, and high transmission rates [9].
Page | 14
2.2 System Topology and Component Selection
Based on results for first research questions we should study the behaviour of the
supercapacitor and we do search on our system topology and which components who fit to the
topology.
The components we are going to use in a way that minimize the loss of energy and can
distribute the energy for sensor loads which are the Microcontroller [13] Operational voltage
(1.8V-3.6V), and the transceiver [14], operational voltage (2.5V-3.6V) to work in good
condition. Energy calculations for both loads are included in (appendix 2).
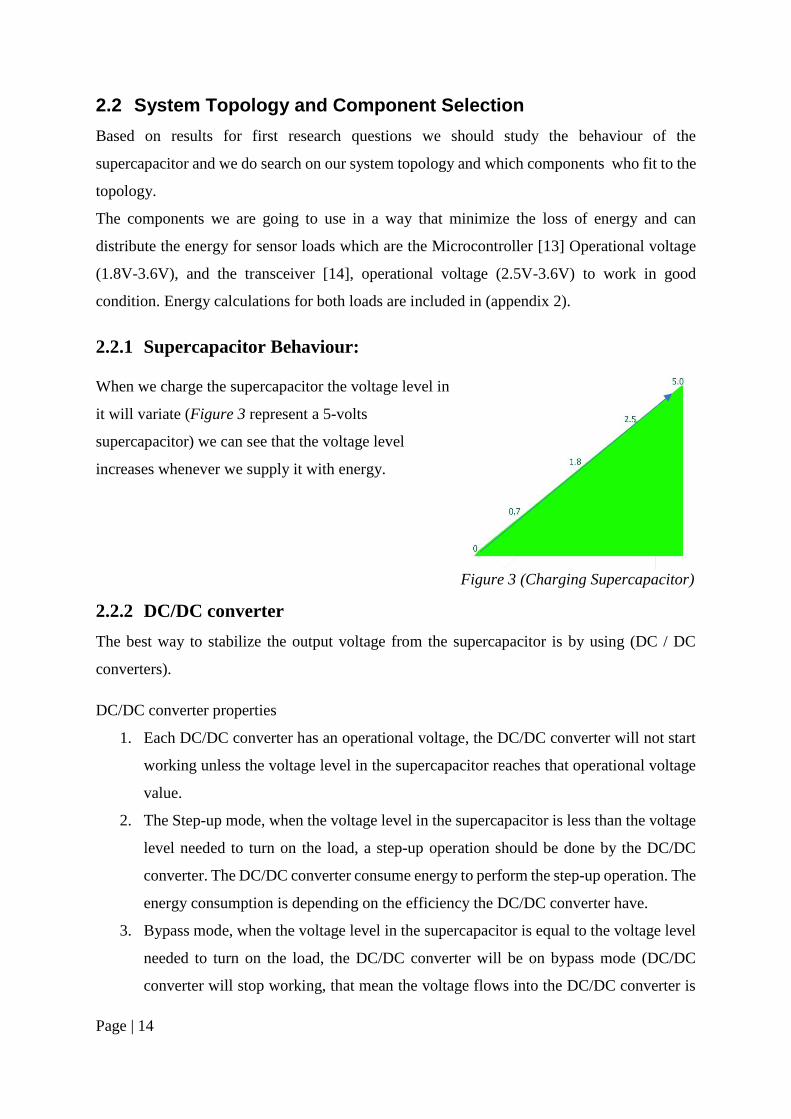
2.2.1 Supercapacitor Behaviour:
When we charge the supercapacitor the voltage level in
it will variate (Figure 3 represent a 5-volts
supercapacitor) we can see that the voltage level
increases whenever we supply it with energy.
2.2.2 DC/DC converter
The best way to stabilize the output voltage from the supercapacitor is by using (DC / DC
converters).
DC/DC converter properties
1. Each DC/DC converter has an operational voltage, the DC/DC converter will not start
working unless the voltage level in the supercapacitor reaches that operational voltage
value.
2. The Step-up mode, when the voltage level in the supercapacitor is less than the voltage
level needed to turn on the load, a step-up operation should be done by the DC/DC
converter. The DC/DC converter consume energy to perform the step-up operation. The
energy consumption is depending on the efficiency the DC/DC converter have.
3. Bypass mode, when the voltage level in the supercapacitor is equal to the voltage level
needed to turn on the load, the DC/DC converter will be on bypass mode (DC/DC
converter will stop working, that mean the voltage flows into the DC/DC converter is
Fi
gu
re
Ch
ar
gi
ng
Su
pe
rc
ap
aci
tor
Figure 3 (Charging Supercapacitor)

Page | 15
equal to its output voltage). No energy will be consumed by the DC/DC converter in
this mode.
4. The Step-down mode, when the voltage level in the supercapacitor is higher than the
voltage level needed to turn on the load, a step-down operation will be done by the
DC/DC converter. The DC/DC converter consume energy to perform the step-down
operation. The energy consumption is depending on the efficiency the DC/DC
converter have.
We do comparison among four DC/DC converters to determine which one is the most suitable
for our system. In our comparison we depend on many factors such as the operational voltage
for the DC/DC converter, what is the supported output voltage and the output efficiency during
the step-up / step-down phase. The comparison applied on (0.1F, 5V) supercapacitor, we will
choose further on the DC/DC converter who can supply our system with maximum amount of
energy.
Factor \Model TPS6122x TPS61099x TPS61098 TPS62743
Input Voltage 0.7 - 5.5 0.7 - 5.5 0.7 - 4.5 2.15 - 5.5
Output Voltage 1.8 - 6 1.8 - 5.5 2.2 - 4.3 1.2 - 3.3
Efficiency (Step Up) 90% 70% 78% None
Efficiency (Step Down) None 90% None 95%
Table 4 DC/DC converter comparison
2.2.3 Energy flow control
We study the mosfet switches to control the energy flow in the system. The switches are
controlled by the microcontroller, the microcontroller will base the switches control on the
voltage of SC1 and SC2.

Page | 16
2.3 Implementation of Proposed System
In this section we will tackle the third research question, we Build and test the prototype
components, the implementation in this chapter is based on the results from the previous two
chapters as it described in (Figure 4). The experiment was done at Sensative AB lab.
Figure 4 Method for research question 3
Many experiment setups we did will be included in this chapter…
The supercapacitor we use in those setups are the supercapacitor provided by the company
Sensative which are:
1. (0.1F,5V) supercapacitor we will use it as SC1 primary supercapacitor
2. (0.47F,5V) supercapacitor will be used as SC2 main Supercapacitor
Note that all the other components used in the system are designed and built by us, we use the
circuit printer in the lab of University of Kristianstad and we solider and test the components
in the company Sensative lab.
Figure 5 (Supercapacitor 1)
Figure 6 (Supercpacitor 2)
Page | 17
Experiment setups will be explained in this chapter…
2.3.1 Experiment setups
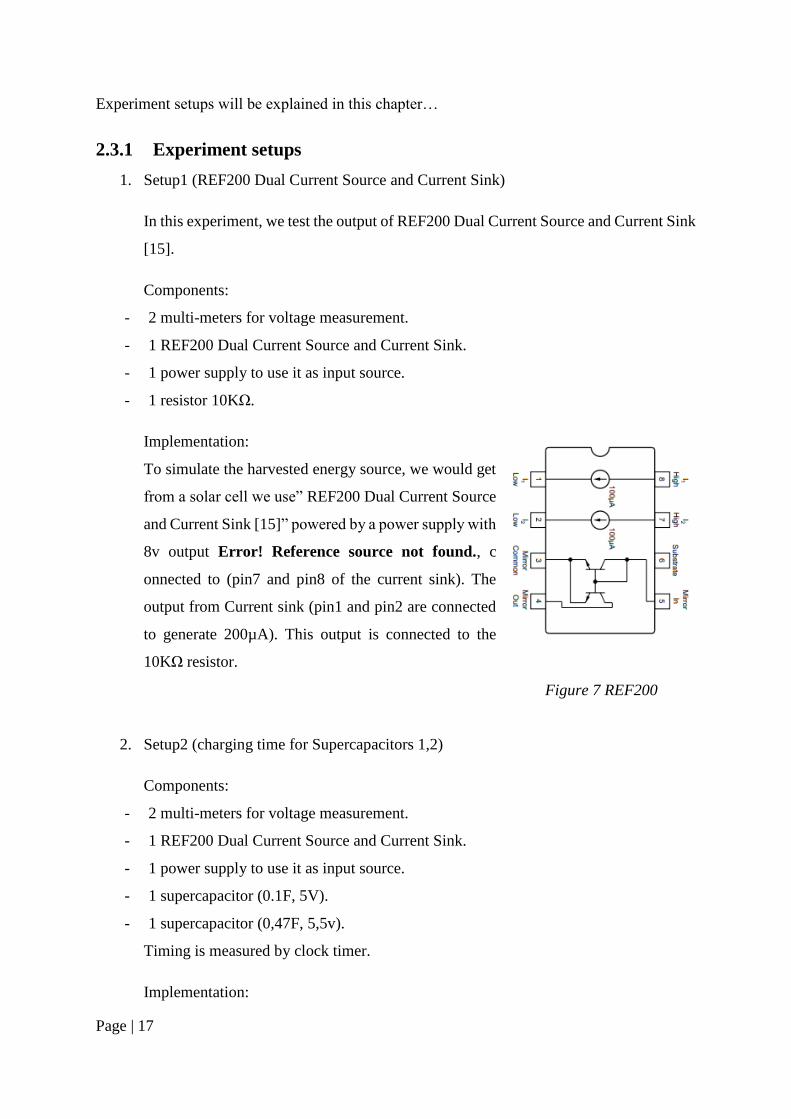
1. Setup1 (REF200 Dual Current Source and Current Sink)
In this experiment, we test the output of REF200 Dual Current Source and Current Sink
[15].
Components:
- 2 multi-meters for voltage measurement.
- 1 REF200 Dual Current Source and Current Sink.
- 1 power supply to use it as input source.
- 1 resistor 10KΩ.
Implementation:
To simulate the harvested energy source, we would get
from a solar cell we use” REF200 Dual Current Source
and Current Sink [15]” powered by a power supply with
8v output Error! Reference source not found., c
onnected to (pin7 and pin8 of the current sink). The
output from Current sink (pin1 and pin2 are connected
to generate 200µA). This output is connected to the
10KΩ resistor.
2. Setup2 (charging time for Supercapacitors 1,2)
Components:
- 2 multi-meters for voltage measurement.
- 1 REF200 Dual Current Source and Current Sink.
- 1 power supply to use it as input source.
- 1 supercapacitor (0.1F, 5V).
- 1 supercapacitor (0,47F, 5,5v).
Timing is measured by clock timer.
Implementation:
Figure 7 REF200

Page | 18
We connect SC1(0.1F) and SC2(0.47F) separately (not in the same time) to current
sink to see how long it will take to charge them.
3. Setup 3 (DC/DC converter step-up to 1.8volts)
Experiment made on DC/DC converter TPS61099x to see how it works as a step-up
regulator to 1.8v.
Components:
- 2 multi-meters for voltage measurement.
- 1 TPS61099x DC/DC converter [16].
- 1 inductor 1µH.
- 3 capacitors 10µF.
- 1 resistor 640KΩ used as R1, one resistor 750KΩ used as R2 (as in Figure 8).
Implementation:
The circuit is built as in the (Figure
8), provided in TPS61099x DC/DC
converter datasheet [16]. One
multimeter probe connected to Vin,
other multimeter probe connected to
Vout.
From the DC/DC converter data sheet we use the equation 𝑉𝑜𝑢𝑡 = Vref ∗R1+R2
R2 to
determine the size of R1, R2.
Figure 8 (TPS61099x)

Page | 19
4. Setup 4 (DC/DC converter step-up to 2.5volts)
Experiment made on DC/DC converter TPS61099x to see how it works as a step-up
regulator to 2.5v.
Components:
- 2 multi-meters for voltage measurement.
- 1 TPS61099x DC/DC converter [16].
- 1 inductor 1µH.
- 3 capacitors 10µF.
- 1 resistor 840KΩ used as R1, one resistor 540KΩ used as R2 (as in Figure 8).
Implementation:
The circuit is built as in the (Figure 8), figure we get from TPS61099x DC/DC
converter datasheet [16], one multimeter connected to Vin, other multimeter connected
to Vout.
From the DC/DC converter data sheet we use the equation 𝑉𝑜𝑢𝑡 = Vref ∗R1+R2
R2 to
determine the size of R1, R2.
5. Setup 5 (DC/DC converter step-down to 1.8volts)
Experiment made on DC/DC converter TPS62743 to see how it work as a step-down
regulator to 1.8v.
Components:
- 2 multi-meters for voltage
measurement.
- TPS62743 DC/DC converter [17].
- 1 inductor 2.2µH.
- 1 capacitor 10µF.
- 1 capacitor 4.7µF.
Implementation: The circuit is built as in the (Figure 9), figure we get from TPS62743
DC/DC converter datasheet [17], one multimeter connected to GND and Vin, other
multimeter connected to Vout and GND.
Figure 9 (TPS62743 Step down to 1.8V)

Page | 20
6. Setup 6 (DC/DC converter step-down to 2.5volts)
Experiment made on DC/DC converter TPS62743 to see how it work as a step-down
regulator to 2.5v.
Components:
- 2 multi-meters for voltage
measurement.
- TPS62743 DC/DC converter [17].
- 1 inductor 2.2µH.
- 1 capacitor 10µF.
- 1 capacitor 4.7µF.
Implementation:
The circuit is built as in the (Figure 10), figure we get from TPS62743 DC/DC
converter datasheet [17], We edit on our connection, we connect VSEL3 to VIN and
grounded VSEL1, VSEL2, one multimeter connected to GND and Vin, other
multimeter connected to Vout and GND.
7. Setup 7 (Supercapacitors Leakage)
Experiment to demonstrate the leakage in Supercapacitor1 and Supercapacitor2.
Components:
- 2 multi-meters for voltage measurement.
- 1 Supercapacitor (0.1F, 5V).
- 1 Supercapacitor (0.47F, 5V).
Timing is measured by clock timer.
Implementation:
We read the voltage in SC1(0.1F) and SC2(0.47F) separately (not in the same time)
each hour or some hours to see how much the voltage will drop due the inner leakage
in both supercapacitors.
Figure 10 (TPS62743 Step down to 2.5V)
Page | 21
8. Setup 8 our proposed solution (the energy system)
Experiment to demonstrate the result of this project.
Components:
- 2 multi-meters for voltage measurement.
- 1 Supercapacitor (0.1F, 5V).
- 1 Supercapacitor (0.47F, 5V).
- 1 REF200 Dual Current Source and Current Sink (the one we use in experiment 1).
- 1 DC/DC converter TPS61099x (we use in experiment 3).
- 1 DC/DC converter TPS61099x (we use in experiment 4).
- 1 DC/DC converter TPS62743(we use in experiment 5).
- 1 DC/DC converter TPS62743(we use in experiment 6).
- 8 Switches Infineon IRLIB9343PbF [18].
- 1 Power supply.
- 1 Arduino Uno at mega 328p.
- Green LED.
- Yellow LED.
Software used:
- Atmel studio 7 to make the program, C language.
- Edwin XP for schematic.
Implementation:
In software the program code for this system is attached with thesis as a text file.
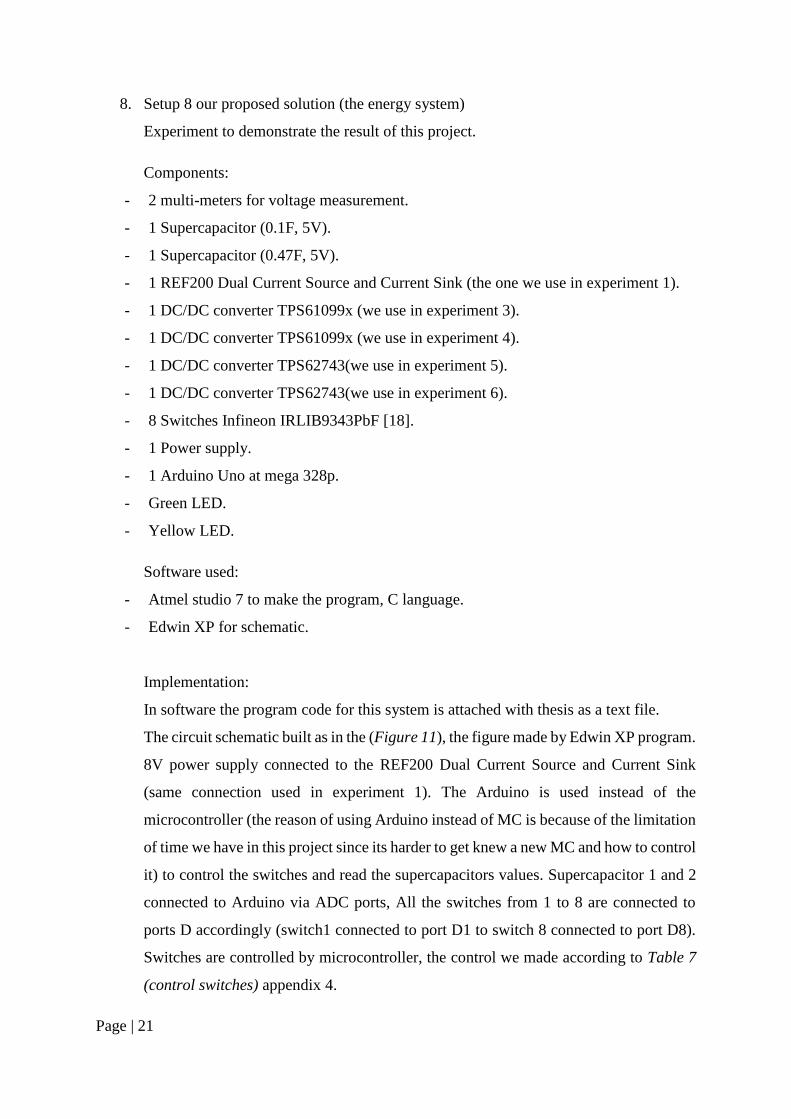
The circuit schematic built as in the (Figure 11), the figure made by Edwin XP program.
8V power supply connected to the REF200 Dual Current Source and Current Sink
(same connection used in experiment 1). The Arduino is used instead of the
microcontroller (the reason of using Arduino instead of MC is because of the limitation
of time we have in this project since its harder to get knew a new MC and how to control
it) to control the switches and read the supercapacitors values. Supercapacitor 1 and 2
connected to Arduino via ADC ports, All the switches from 1 to 8 are connected to
ports D accordingly (switch1 connected to port D1 to switch 8 connected to port D8).
Switches are controlled by microcontroller, the control we made according to Table 7
(control switches) appendix 4.
Page | 22
Figure 11 (System Schematic)
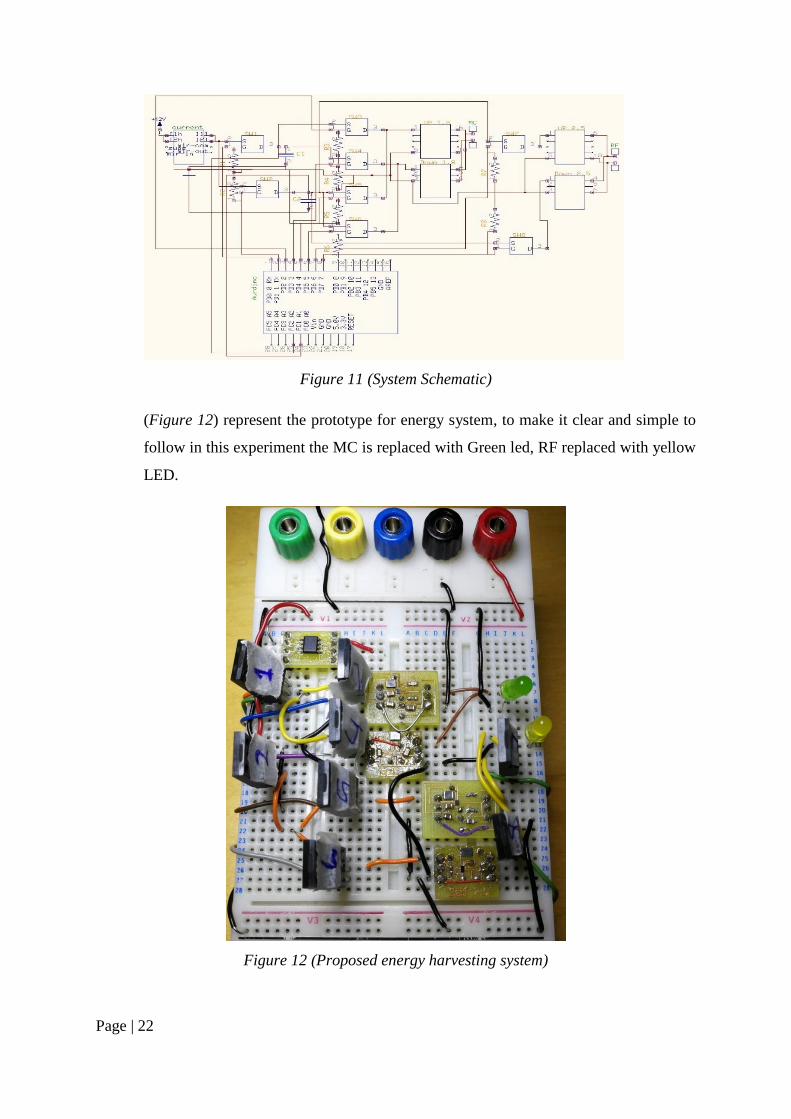
(Figure 12) represent the prototype for energy system, to make it clear and simple to
follow in this experiment the MC is replaced with Green led, RF replaced with yellow
LED.
Figure 12 (Proposed energy harvesting system)

Page | 23
9. Setup 9 (How long SC1, SC2 can hold WSN working without energy source)
Experiment to demonstrate how long Supercapacitor1 can hold the MC working (when
the energy in it is full and there is no energy source available, also this experiment
demonstrates how long Super capacitor 2 can hold both MC and RF working (when the
energy in SC2 is full and there is no energy source available).
Components:
- 2 multi-meters for voltage measurement.
- 1 Supercapacitor (0.1F, 5V).
- 1 Supercapacitor (0.47F, 5V).
- 1 DC/DC converter TPS61099x (we use in experiment 3).
- 1 DC/DC converter TPS61099x (we use in experiment 4).
- 1 DC/DC converter TPS62743(we use in experiment 5).
- 1 DC/DC converter TPS62743(we use in experiment 6).
- 8 Switches Infineon IRLIB9343PbF [18].
- 1 Arduino Uno at mega 328p.
Timing is measured by clock timer.
Implementation:
We read the voltage from SC1(0.1F) and SC2(0.47F) separately (not in the same time)
each hour or some hours to see how much the voltage will drop in them, to circuit
connection we use the same as (Figure 11), but without power source.

Page | 24
3 Results
3.1 Results for RQ1
From Table 3 we conclude that the best storage unit for the WSN is the supercapacitor. It can
achieve WSN long-life operation. With low cost price, maintenance and environment
perspective as well. Also, since a single supercapacitor will outlive half a dozen batteries, this
drastically reduces maintenance costs and lower the overall cost of operating the sensor
network [9, 19].
The factors Recharge cycles, along with fast charging and the effect on the environment, make
supercapacitors an attractive power sources than rechargeable batteries in wireless sensor
network applications [10, 8, 11].
From theories we study we decide to use two supercapacitors, the first one has small capacity
and the second has bigger capacity. We suppose the second supercapacitor capacity is five
times larger than the first supercapacitor.

Page | 25
3.2 Results for RQ2
3.2.1 Determine the DC/DC converter
From comparison Table 4, and the energy calculation for supercapacitor after applying each
of DC/DC converters (Appendix 1) we get the results
Table 5.
TPS6122x TPS61099x TPS61098 TPS62743
Energy in Joule 0.69975 1.066 0.67565 0.51875
Table 5 DC/DC converter results
The energy in supercapacitor can be divided to
five areas according to the energy we can
conclude from the supercapacitor after we apply
the DC/DC converter on it. As it shows in (Figure
13), the energy areas are decided by the voltage
levels, we use (TPS61099x datasheet [16] as a
step-up DC/DC converter) and we use ( TPS62743
datasheet [17] as step-down DC/DC converter).
Voltage levels of Sc1 and Sc2.
The maximum voltage level for SC1, SC2 will be 5 Volts, there are many reasons as following:
1. Calculate the maximum energy according to the energy equation E = 0.5 ∗ CV2
Equation 6 (Equation for calculating the energy for supercapacitor). Since voltage is
squared in this equation.
2. More energy can be gained through the step-down phase. From (Figure 13), we find
that the step-down phase is the largest phase that contains energy that can be utilized.
3. Our online searches show that there is no difference in price between 5.0v
supercapacitor and others who has lower voltage levels.
Figure 13 (Supercapacitor energy
areas)

Page | 26
3.2.2 Energy flow control among system components
To control the energy flow in to the system we use switches, the microcontroller will control
those opening and closing of those switches according to the voltage level in both
supercapacitors.
1. When system is charging (system is booting from exhausting mode).
The energy delivered from Energy harvesting source to current (REF200 Dual Current Source
and Current Sink [15]), at the beginning the priority will be given to Sc1 to be charged first
(Switch1 will be closed then the energy will flow into SC1 in order to charge it (Figure 14).
Figure 14 (Vsc1 less 0.7V)
2. Voltage in Sc1 is over 0.7V and less than 2.5V
This is voltage level that DC1 will start work in step up mode, the voltage will be converted
from 0.7V to 1.8V, at that voltage level the MC will start working (Energy will be transmitted
via switch 3, Figure 15).
Figure 15 (Vsc1 higher 0.7V and less 2.5V)

Page | 27
3. Voltage in Sc1 is over 2.5V and less than 5V
At this voltage level the DC2 converter will start work in step-down mode, the voltage will be
converted from 2.5V to 1.8V, the MC will continue working as normal (Energy will be
transmitted via switch 4, Figure 16).
Figure 16 (Vsc1 higher 2.5V and less 5V)
4. SC1 get fully charged
When SC1 gets fully charged, the switches will change the flow direction start filling Sc2 (by
open switch1 and close switch2) it is important here to notice that switch 4 will continue being
closed, that mean SC1 will continue supply MC with energy (Figure 17).
Figure 17 (SC1 fully charged)

Page | 28
5. Voltage in Sc2 is over 0.7V and less than 2.5V
Now the main system energy buffer will take the lead to provide the system with energy at this
voltage level same procedure will be applied like point 2, that DC1 will start work in step up
mode, the voltage will be converted from 0.7V to 1.8V, one more thing will be added here that
every 30 minutes the DC/DC converter will step up the voltage to 2.5 in order to operate the
radio (Switch 7 will be closed in same time Figure 18).
Figure 18 (Vsc2 higher 0.7V and less 2.5V)
6. Voltage in Sc1 is over 2.5V and less than 4.5V
At this voltage level the DC2 converter will start work in step-down mode, the voltage will be
converted from 2.5V to 1.8V, the MC will continue working as normal in same time, every 30
minutes the DC 2 will provide the RF with energy needed to operate, the DC2 will work in
Bypass mode, energy delivered via switch 8 as it shows in (Figure 19).
Figure 19 (Vsc2 higher 2.5V and less 4.5V)

Page | 29
7. Voltage in Sc2 is over 4.5V
When SC2 being almost fully charged, switch 1 and 2 will be closed in order to charge both
supercapacitors in parallel, SC2 will still have the same procedure as in point 6 (Figure 20).
Figure 20 (Parallelly charging SC1 and SC2)

Page | 30
3.3 Results for RQ3
1. Setup1:
We put the probe on the resistor legs and read the voltage and got 2.002V.
To test the output from our current sink is correct a 10Kohm resistor is connected to the
current sink output to measure the voltage across it.
According Ohms law V=I*R ➔ V=0.00002*10000 = 2V.
From results we get 2,002V which is correct value.
2. Setup2:
(Figure 21 and Figure 22) Represents a comparison in time needed to charge SC1 and
SC2 (theoretically and in experiment), the theoretical results are explained in apendix3.
Figure 21 (Charging time for SC1)
Figure 22 (Charging time for SC2)
350900
1250
2500
367
10651576
4141
0.7V 1.8V 2.5V 5V
0
1000
2000
3000
4000
5000
VOLTAGE LEVEL
TIM
E IN
SEC
ON
DS
Charging time for SC1
Theoratical Experiment
16454230
5875
12925
2370
7010
10740
23241
0.7V 1.8V 2.5V 5V
0
5000
10000
15000
20000
25000
VOLTAGE LEVEL
TIM
E IN
SEC
ON
DS
Charging time for SC2
Theoratical Experiment

Page | 31
3. Setup3:
When input voltage is (0,7-1,8V) The output voltage theoretically was 1.853333V,
more experiments in (Figure 23).
Figure 23 (Result for experiment setup 3)
4. Setup4:
When input voltage is (0,7-2,5V) The output voltage theoretically was 2.555556V. In
our experiment we get 2.533V as an output voltage when we have 0.4Vas an input
voltage, more experiment in (Figure 24).
Figure 24 (Result for experiment setup 4)
5. Setup5:
0
1.8 1.8 1.82
2.5
2 1.907 1.93 2 2
2.633
0.4 1 1.5 1.8 2 2.5
OU
TPU
T V
OLT
AG
E
INPUT VOLTAGE
TPS61099x Step-Up 1.8V
Theoretical experimental
0 0
2.5 2.5 2.5 2.52.534 2.552.7 2.588 2.595 2.605
0
0.5
1
1.5
2
2.5
3
0.4 1 1.5 1.8 2 2.5
OU
TPU
T V
OLT
AG
E
INPUT VOLTAGE
TPS61099x Step-Up 2.5V
Theoretical Experimental

Page | 32
When input voltage is (0-1.9V) The output voltage theoretically was 0V, while in our
experiment we get same results as the theoretical. more experiment in (Figure 25).
Figure 25 (Result for experiment setup 5)
6. Setup6:
When input voltage is (0-1.9V) The output voltage theoretically was 0V, while in our
experiment we get same results as the theoretical. more experiment in (Figure 26).
Figure 26 (Result for experiment setup 6)
0
1.8 1.8 1.8 1.8 1.8
0
2 2 2 2 2
1,9 2 2,5 3 3,5 5
INPUT VOLTAGE
OU
TPU
T V
OLT
AG
ETPS62743 Step-Down to 1.8V
Theoretical experimental
0
2.1
2.5 2.5 2.5 2.5
0
2.1
2.6 2.506 2.509 2.512
0
0.5
1
1.5
2
2.5
3
1 2 3 4 5 6
OU
TPU
T V
OLT
AG
E
INPUT VOLTAGE
TPS62743 Step-Down to 2.5V
Theoretical experimental

Page | 33
7. Setup7:
Leakage comparison between SC1 and SC2 represented in (Figure 27).
Figure 27 (Leakage SC1, SC2)
8. Setup8:
The switches working in a tune with the voltage level in both SC1 and SC2, we make
a table for them to demonstrate them work, table is in appendix4. In every voltage level
we use the multimeter to read the value of the gate in the mosfet, to check if everything
working the way it should. (voltage in gate should be 0 in order to allow the current to
flow out from the mosfet, otherwise its 5V).
Supercapacitors charges fine, we notice the time is almost the same time we have in
experiment 2 results.
5
4.24 4.053.82 3.75 3.69 3.64 3.59 3.55
3.32
5
4.01 3.833.51 3.37 3.3 3.24 3.18 3.12
2.81
0 1 2 4 5 6 7 9 10 18
0
1
2
3
4
5
6
TIME IN HOUR
VO
LTA
GE
LEV
EL
Leakage effect on SC1,SC2
Voltage SC1 Voltage SC2

Page | 34
9. Setup9:
The time that SC1, SC2 can hold the system working (without energy source available is
explained in Figure 28).
Figure 28 (Time that can SC1, SC2 holds the WSN)
853.22
400
22.5
485
25.72
Theoretical Experiment
0
100
200
300
400
500
600TI
ME
HO
UR
S
SC1 (0.1F, 5V) SC2 (0.47F, 5V) Total
Page | 35
4 Discussion
4.1 Observations from results
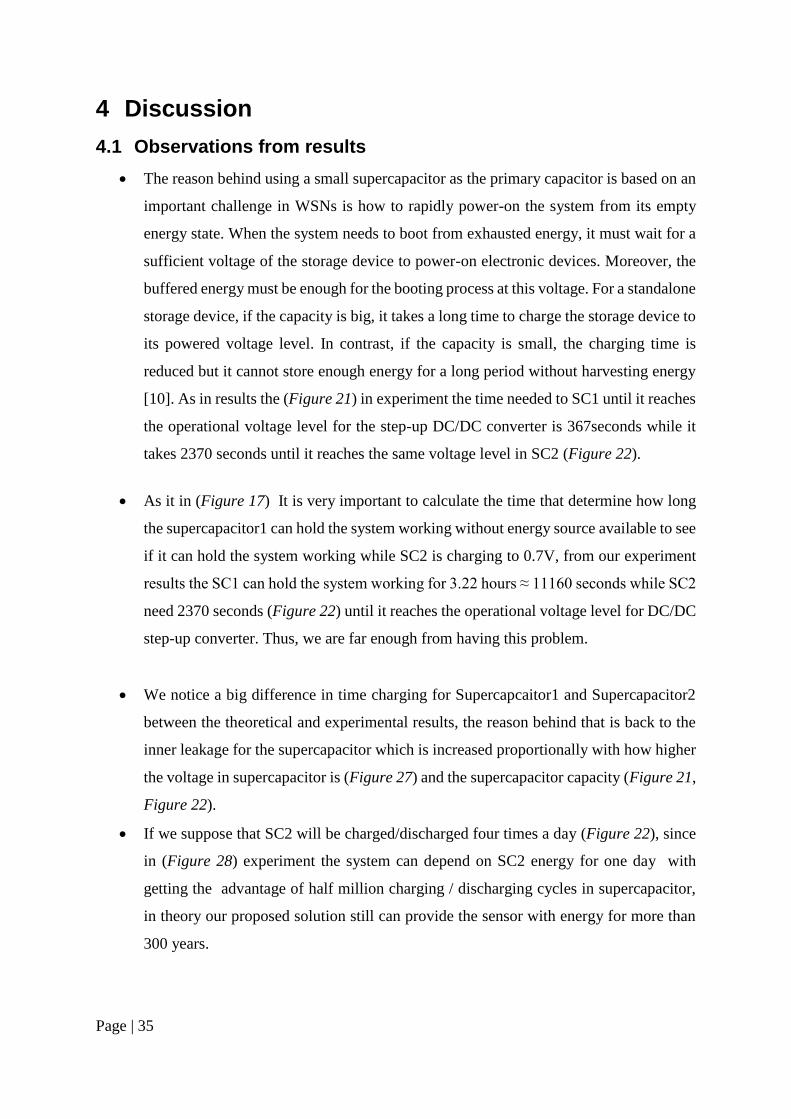
• The reason behind using a small supercapacitor as the primary capacitor is based on an
important challenge in WSNs is how to rapidly power-on the system from its empty
energy state. When the system needs to boot from exhausted energy, it must wait for a
sufficient voltage of the storage device to power-on electronic devices. Moreover, the
buffered energy must be enough for the booting process at this voltage. For a standalone
storage device, if the capacity is big, it takes a long time to charge the storage device to
its powered voltage level. In contrast, if the capacity is small, the charging time is
reduced but it cannot store enough energy for a long period without harvesting energy
[10]. As in results the (Figure 21) in experiment the time needed to SC1 until it reaches
the operational voltage level for the step-up DC/DC converter is 367seconds while it
takes 2370 seconds until it reaches the same voltage level in SC2 (Figure 22).
• As it in (Figure 17) It is very important to calculate the time that determine how long
the supercapacitor1 can hold the system working without energy source available to see
if it can hold the system working while SC2 is charging to 0.7V, from our experiment
results the SC1 can hold the system working for 3.22 hours ≈ 11160 seconds while SC2
need 2370 seconds (Figure 22) until it reaches the operational voltage level for DC/DC
step-up converter. Thus, we are far enough from having this problem.
• We notice a big difference in time charging for Supercapcaitor1 and Supercapacitor2
between the theoretical and experimental results, the reason behind that is back to the
inner leakage for the supercapacitor which is increased proportionally with how higher
the voltage in supercapacitor is (Figure 27) and the supercapacitor capacity (Figure 21,
Figure 22).
• If we suppose that SC2 will be charged/discharged four times a day (Figure 22), since
in (Figure 28) experiment the system can depend on SC2 energy for one day with
getting the advantage of half million charging / discharging cycles in supercapacitor,
in theory our proposed solution still can provide the sensor with energy for more than
300 years.

Page | 36
4.2 Future Work
This work can be further improved by:
1. Finding better DC/DC converter to make it more efficient, or so that it can start from a
voltage level lower than what we had in this project. It would be beneficial if we can find
one that can do both step up and step down, so that there will be no need to add more
DC/DC converters.
2. Internal leakage for the Supercapacitors was not included in the calculations. The results
can be more accurate when we factor in this in our calculations.
3. In this project a current REF200 Dual Current Source and Current Sink used as an energy
source to simulate the energy we get from a solar cell. It would be beneficial to test the
system in a real setting with a solar cell and solar energy source.
4. Better supercapacitors quality is recently arrived at the company to use in further
researches, there were no time to test them for better simulation.

Page | 37
5 Conclusion
To summarize the work, we did in this project, we performed literary research about
the best way to store the harvested energy and found out that the supercapacitor is the best
solution for the purpose. Our proposed solution is environment friendly, cheaper, with more
than 500,000 recharging cycles, and can work under wide temperature range.
The best energy storage unit will contain two super capacitors, 1st small size and 2nd relatively
big size, the second supercapacitor could be also small size but with less leakage, leakage effect
should have the priority in calculations both theoretically and in experiments.
A new contribution of this project is that we use two supercapacitors instead of one, a small
supercapacitor has been added to the system, so we get faster booting time. Another advantage
of this solution is to use it as an emergency energy buffer in case if there is no energy in the
main buffer.
To build the system we use DC/DC converters to adjust the amount of energy for each unit in
the WSN node (In this work we had a Microcontroller which has a functional voltage 1,8-3,6V
and a transceiver with a functional voltage 2.5-3.6V). Another advantage for DC/DC converters
was to utilize the energy stored in supercapacitor through the step-up and step-down operations.
the system communicates and interacts by using the microcontroller, reading the
supercapacitors voltages and based on that and by using the mosfet switches we controls’ the
energy flow in the system.
The big difference (between the theoretical and experimental results) on how long the SC1,
SC2 can hold the system work without energy source available (Figure 28) is the efficiency of
the DC/DC converters. Theoretically we could gain one day extra if we were using a step-up
with efficiency 90%. Also, the operational voltage for the DC/DC step-up converter now we
use 0.7V, while if we were using one with 0.3V we could gain half day of energy.
This work presents an energy system design for wireless sensor networks (WSNs) after
applying our design the WSN should theoretically have an infinite lifetime, recently energy
harvesting (EH) techniques have been considered as promising solutions for this purpose, from
the experiment setup8 in this work, theoretically we could depend on the supercapacitors for
more than 300years.

Page | 38
Acknowledgement
The authors would like to thank Dr. Dawit Magistu for facilitating this research. In addition,
the authors would thank Lars Jönsson and Magnus Abrahamsson for giving the opportunity to
do industrial training in Sensative AB, Lund/Sweden.
Page | 39
6 References
[1] “stripsbysensative,” Sensative AB, [Online]. Available:
https://www.stripsbysensative.com/. (Accessed on 14-Jun-2018).
[2] Cesare Alippi, Giuseppe Anastasi, Mario Di Francesco and Manuel Roveri, “Energy
Management in Wireless Sensor Networks with Energy-hungry Sensors,” IEEE
Instrumentation and Measurement Magazine, pp. 16-23 , 2 April 2009.
[3] Antonio Sánchez, Salvador Climent, Sara Blanc, Juan Vicente Capella and Ignacio
Piqueras, “WSN with energy-harvesting: modeling and simulation based on a
practical architecture using real radiation levels,” Proceeding, pp. 17-24, 31 Okt 2011.
[4] “www.electronics-tutorials.ws,” [Online]. Available: https://www.electronics-
tutorials.ws/capacitor/cap_1.html. (Accessed on 14-Jun-2018).
[5] “www.rapidtables.com,” [Online]. Available:
https://www.rapidtables.com/electric/capacitor.html. (Accessed on 14-Jun-2018).
[6] “www.electronics-tutorials.ws,” [Online]. Available: https://www.electronics-
tutorials.ws/capacitor/ultracapacitors.html. (Accessed on 14-Jun-2018).
[7] “electronicproducts,” 14 10 2011. [Online]. Available:
https://www.electronicproducts.com/Power_Products/Batteries_and_Fuel_Cells/Rech
argeable_battery_vs_regular_battery.aspx. (Accessed on 14-Jun-2018).
[8] S. L. Christian Tallner, “Batteries or supercapacitors as energy storage in HEVs?,”
Lund University, Lund / Sweden, 2005.
[9] Farhan Simjee and Pai H. Chou, “Everlast: long-life, supercapacitor-operated wireless
sensor node,” Proceedings of the 2006 international symposium on Low power
electronics and design, pp. 197-202, 2006.
[10] TRONG NHAN LE, ALAIN PEGATOQUET, OLIVIER BERDER, OLIVIER
SENTIEYS and ARNAUD CARER, “Energy-Neutral Design Framework for
Supercapacitor-Based Autonomous Wireless Sensor Networks,” Emerging
Technologies in Computing Systems (JETC), vol. 12, no. 2, p. 19, 2015.
[11] W. S. WANG, T. O’DONNELL, N. WANG and M. HAYES, “Design Considerations
of Sub-mW Indoor Light Energy Harvesting for Wireless Sensor Systems,” Emerging
Technologies in Computing Systems (JETC), vol. 6, p. 6, 2 June 2010.

Page | 40
[12] Aman Kansal, Jason Hsu, Sadaf Zahedi and Mani B. Srivastava, “Power management
in energy harvesting sensor networks,” ACM Transactions on Embedded Computing
Systems (TECS), vol. 6, no. 4, p. Article No. 32 , September 2007.
[13] S. Labs, “www.silabs.com,” Silicon Labs, 2017. [Online]. Available:
https://www.silabs.com/documents/public/data-sheets/C8051F99x.pdf. (Accessed on
14-Jun-2018).
[14] Sigma, “static6.arrow.com,” Sigma, 12 2016. [Online]. Available:
http://static6.arrow.com/aropdfconversion/9c56142b00c822a4ee444d28ff709b665b02
a1df/zm5101a-cme3r.pdf. (Accessed on 14-Jun-2018).
[15] “http://www.ti.com/lit/ds/symlink/ref200.pdf,” ti company, [Online]. Available:
http://www.ti.com/lit/ds/symlink/ref200.pdf. (Accessed on 14-Jun-2018).
[16] S. Labs, “http://www.ti.com/lit/ds/symlink/tps61099.pdf,” [Online]. Available:
http://www.ti.com/lit/ds/symlink/tps61099.pdf. (Accessed on 14-Jun-2018).
[17] http://www.ti.com/lit/ds/symlink/tps62743.pdf. [Online]. Available:
http://www.ti.com/lit/ds/symlink/tps62743.pdf. (Accessed on 14-Jun-2018).
[18] “Infineon,” [Online]. Available: https://eu.mouser.com/datasheet/2/196/Infineon-
IRLIB9343-DS-v01_02-EN-1227614.pdf. (Accessed on 14-Jun-2018).
[19] Brendan O'Flynn, S. Bellis, K. Delaney, J. Barton, S. C. O'Mathuna, Andre Melon
Barroso, J. Benson, U. Roedig and C. Sreenan, “The development of a novel
minaturized modular platform for wireless sensor networks,” IPSN '05 Proceedings of
the 4th international symposium on Information processing in sensor networks, p. 49,
24 - 27 April 2005.
[20] “www.unitjuggler.com,” 2016. [Online]. Available:
https://www.unitjuggler.com/convert-energy-from-J-to-Wh.html. (Accessed on 14-
Jun-2018).
[21] “www.rapidtables.com,” [Online]. Available:
https://www.rapidtables.com/convert/electric/Volt_to_Watt.html. (Accessed on 14-
Jun-2018).
[22] “electronics.stackexchange.com,” [Online]. Available:
https://electronics.stackexchange.com/questions/190718/how-long-to-charge-a-super-
capacitor-with-lm317. (Accessed on 14-Jun-2018).
Page | 41
[23] “https://www.electronics2000.co.uk/,” [Online]. Available:
https://www.electronics2000.co.uk/calc/capacitor-charge-calculator.php. (Accessed
on 14-Jun-2018).
[24] T. Instruments, “www.farnell.com,” 2014. [Online]. Available:
http://www.farnell.com/datasheets/1857936.pdf. (Accessed on 14-Jun-2018).
[25] “www.tecategroup.com,” [Online]. Available:
https://www.tecategroup.com/ultracapacitors-supercapacitors/ultracapacitor-FAQ.php.
(Accessed on 14-Jun-2018).
[26] “microchip.com,” microchip, [Online]. Available:
http://ww1.microchip.com/downloads/en/DeviceDoc/40001420D.pdf. (Accessed on
14-Jun-2018).
[27] T. Instruments, “tps610982,” [Online]. Available:
http://www.ti.com/lit/ds/symlink/tps610982.pdf. (Accessed on 14-Jun-2018).
[28] “www.powerfilmsolar.com,” www.powerfilmsolar.com, [Online]. Available:
http://www.powerfilmsolar.com/products/?ll337&show=product&productID=284197
&productCategoryIDs=6573. (Accessed on 14-Jun-2018).
[29] S. Labs, “http://www.ti.com,” [Online]. Available:
http://www.ti.com/lit/ds/symlink/tps61099.pdf. (Accessed on 14-Jun-2018).

Page | 42
Appendix
1. Determine how much energy the Super Capacitor 1 Can deliver… (also calculations
for DC/DC converter 1).
1 J = 0. 28 mWh Equation 1, (source [20]) 1Joule of energy is equivalent to
0.28mWh.
I =P
V Equation 2 (source [21])
From Equation 2 and Equation 3 and we give the maximum voltage for Sc1 is 5.5
volts
1J =0.28mWh
5.5v = 0.051mAh Equation 3 (The amount of energy that one joule can
deliver).
To calculate the amount of energy per day that one joule can deliver
1J = 0.051 ∗ 24 = 1.221mAh Equation 4 .
From our calculation for MC power consumption, it needs 0.367mAh in a day.
Thus, one joule can feed microcontroller with energy for approximately
1.221mAh
0.367mAh = 3.327 days
So, in one day we need 1
3.327 = 0.3 J Equation 5
We have 0.1F,5V supercapacitor and apply our calculations on it.
E = 0.5 ∗ CV2 Equation 6 (Equation for calculating the energy for supercapacitor).
To be more accurate when we calculate the capacitance, we divide the capacitor to five
parts according to the voltage level in it. For more info check (Figure 13).
• First part the unusable voltage in Capacitor from 0V-0.7V, because in that voltage
range the (DC/DC converter 1) can’t work (Figure 13)
According to E = 0.5 ∗ CV2 Equation 6 (Equation for calculating the energy for
supercapacitor).
E unused = 0.5*0.1*0.72 = 0.0245J cannot exclude any energy from.
• Second part from 0.7V-1.8V in that range the (DC/DC converter 1) will work in step
up mode, to step the voltage up from 0.7V to 1.8V, so the microcontroller will start
working properly. This operation consumes energy for (DC/DC converter 1 to operate
according to its efficiency), according to DC/DC1 datasheet [16], we knew that
DC/DC2 has 70% efficiency.

Page | 43
E = 0.5 ∗ CV2 Equation 6 (Equation for calculating the energy for supercapacitor).
E1 = 0.5*0.1*(V12-Vmin
2) *0.7 = 0,0963 J
• Third part from 1.8V to 2.2V, the DC/DC2 will operate on bypass mode, in this mode
DC/DC2 will not consumes energy to operate. So, no energy will be reduced, but all
the energy range will be only up to 1.8V (the second yellow area in Figure 13)
E = 0.5 ∗ CV2 Equation 6 (Equation for calculating the energy for supercapacitor).
E1 = 0.5*0.1*(V22-V1
2) – 0.5*0.1*(V2-V1) 2 = 0,126J
• Forth part from 2.2V-5.5V in that range the (DC/DC converter 2) will work in step
down mode, to step the voltage down from 2.2-5.5V to 1.8V, This operation consumes
energy for (DC/DC converter 2 to operate according to its efficiency) , according to
DC/DC2 datasheet [16], we knew that DC/DC2 has 90% efficiency in step down mode.
E = 0.5 ∗ CV2 Equation 6 (Equation for calculating the energy for supercapacitor).
E1 = 0.5*0.12*(Vmax2-V2
2) *0.9 = 0,8438J
Thus, the total Energy for this capacitor is: 0,0963J +0,126J +0,8438J = 1.066 Joule.
From So, in one day we need 1
3.327 = 0.3 J Equation 5 we know that in one day the
WSN consume 0.3J. Thus, theoretically this supercapacitor can hold our WSN on for
3,5 days.

Page | 44
2. From microcontroller (8051) datasheet [13] we calculate the energy consumption for
the microcontroller. The microcontroller turns on each second, the time for active mode
is 5mS and it consume 3mA, Time for microcontroller in sleep mode is 995ms and it
consume 300nA, the calculation is clearly explained below
3mA*5mS = 15µA.s Power consumption for microcontroller in active mode
300nA*995ms = 298500pA.s Power consumption for microcontroller in sleep mode
=<15,2985µAs Mc power consumption in 1 second
15,2985µAs *3600= 55075µA.s power seconds in 1 hour
55,075mA.h *24 = 1321.8 mA.s power seconds in one day
1321,8mA.s/3600 = 0,36716mA.h power hours in one day
The transceiver usage 40mA in 50mS every 30 minutes:
40mA*50mS= 200µA.s power in 30 minutes
200µA.s*48 = 9.6mA.s power in one day
9.6mA.s/3600=0,0027mA.h power in one day
Total power consumed by WSN (for both MC and RF) = 0.36716+0.0027 ≈ 0.
367mA.h day
Page | 45
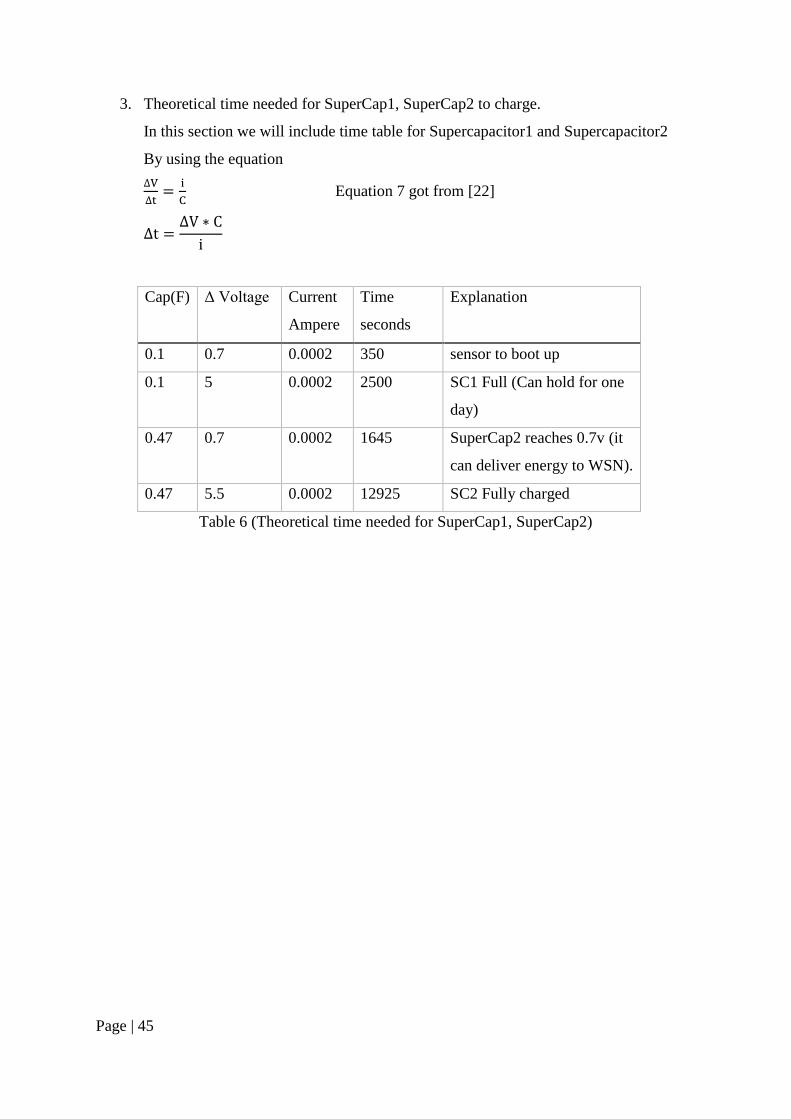
3. Theoretical time needed for SuperCap1, SuperCap2 to charge.
In this section we will include time table for Supercapacitor1 and Supercapacitor2
By using the equation
∆V
∆t=
i
C Equation 7 got from [22]
∆t =∆V ∗ C
i
Cap(F) Δ Voltage Current
Ampere
Time
seconds
Explanation
0.1 0.7 0.0002 350 sensor to boot up
0.1 5 0.0002 2500 SC1 Full (Can hold for one
day)
0.47 0.7 0.0002 1645 SuperCap2 reaches 0.7v (it
can deliver energy to WSN).
0.47 5.5 0.0002 12925 SC2 Fully charged
Table 6 (Theoretical time needed for SuperCap1, SuperCap2)

Page | 46
4.
Proces
s No.
Statement Sw
1
Sw
2
Sw
3
Sw
4
Sw5 Sw
6
Sw
7
Sw8 TPS6109
9x
TPS627
43
1. Vsc1 > 0.7v 1 0 0 0 0 0 0 0 - -
2. Vsc1 ≥ 0.7v 1 0 1 0 0 0 0 0 Step up/
Bypass
-
3. Vsc1 ≥ 2.5v 1 0 0 1 0 0 0 0 - Step
down
4. Vsc1 ≥ 4.5v 0 1 0 1 0 0 0 0 - Step
down
5. Vsc2 ≥ 0.7v 0 1 0 0 1 0 0/1 0 Step up -
6. Vsc2 ≥ 1.8v 0 1 0 0 1 0 0/1 0 Bypass /
Step up
-
7. Vsc2 ≥ 2.5v 0 1 0 0 0 1 0 0/1 - Bypass/
Stepdow
n
8. Vsc2 ≥ 5.4v 1 1 0 0 0 1 0 0/1 - Step
down
9. Vsc1 ≥ 4.9v
& Vsc2 ≥
4.9v
0 0 0 0 0 1 0 0/1 - Step
down
Table 7 (control switches)