storage phosphors for medical imaging - mdpi.com
TRANSCRIPT

Materials 2011, 4, 1034-1086; doi:10.3390/ma4061034
materials ISSN 1996-1944
www.mdpi.com/journal/materials
Review
Storage Phosphors for Medical Imaging
Paul Leblans 1,*, Dirk Vandenbroucke
1 and Peter Willems
2
1 Agfa HealthCare NV, Septestraat 27, B-2640 Mortsel, Belgium;
E-Mail: [email protected] 2 Industrial Scientific and Computing BVBA, Hellestraat 55, B-9190 Stekene, Belgium;
E-Mail: [email protected]
* Author to whom correspondence should be addressed; E-Mail: [email protected];
Tel.: +32-3-444-2880; Fax: +32-3-444-7655.
Received: 24 March 2011; in revised form: 30 May 2011 / Accepted: 7 June 2011 /
Published: 9 June 2011
Abstract: Computed radiography (CR) uses storage phosphor imaging plates for digital
imaging. Absorbed X-ray energy is stored in crystal defects. In read-out the energy is set
free as blue photons upon optical stimulation. In the 35 years of CR history, several storage
phosphor families were investigated and developed. An explanation is given as to why
some materials made it to the commercial stage, while others did not. The photo stimulated
luminescence mechanism of the current commercial storage phosphors, BaFBr:Eu2+
and
CsBr:Eu2+
is discussed. The relation between storage phosphor plate physical
characteristics and image quality is explained. It is demonstrated that the morphology of
the phosphor crystals in the CR imaging plate has a very significant impact on
its performance.
Keywords: computed radiography; storage phosphor; X-ray; optically stimulated
lumi-nescence; BaFBr:Eu2+
; CsBr:Eu2+
; needle imaging plate; image quality
1. Introduction
1.1. Medical Radiography
Almost immediately following the discovery by W.C. Röntgen in 1895, X-rays have been in use in
medical imaging. In medical radiography, shadow images are made of the internal structures of the
OPEN ACCESS

Materials 2011, 4
1035
human body by placing the patient between an X-ray source and an X-ray image detector. Medical
X-ray spectra have quanta with energies between 10 and 150 keV, depending on the application. X-ray
imaging is based on the fact that the quanta are very penetrative and that different materials have large
differences in intrinsic absorption. In the medical energy range the X-ray absorption
cross-section of materials is proportional to their density and to the 4th power of the atomic number of
their elements. Bones, having a large Ca content, have a much higher intrinsic absorption than
soft tissue.
Another consequence of the very high penetration power is that X-ray film with its about 5 thick
active silver halide (AgX) layer has a very low X-ray sensitivity. A very small fraction of the quanta
interacts with the AgX crystals of the film emulsion. Only in non-destructive testing (NDT) are X-ray
images made directly on film. The doses needed to make a useful image directly on film are much too
high for medical imaging.
1.2. Screen/Film Radiography
In screen/film radiography, therefore, the AgX film is sandwidged between 2 phosphor
screens (Figure 1).
Figure 1. Screen / film detector, used in conventional radiography.
X-ray phosphors are inorganic luminescent crystalline powders that convert X-rays into visible
light. Visible photons are generated in three steps. X-ray energy is absorbed and dissipated into the
material. Depending on the X-ray quantum energy, dissipation may result from the photoelectric
effect, from Compton scattering or from pair production. In each case the energy is finally converted
into phonons and in mobile electrons and holes. When these free charge carriers have given up enough
energy to the lattice they can combine to form excitons. The excitons transfer their energy to a
luminescent center, where it is converted into a photon.
In order to have a high X-ray interaction cross-section, X-ray phosphors contain high atomic
number elements and have densities of 5 g/cm3 or more. The phosphor transforms the X-ray image into
a light image, which creates a latent image in the photographic film. The first step in making the X-ray
image is to expose the screen/film sandwich in a light-tight cassette to the X-ray beam that has passed
through the patient. After X-ray exposure, the photographic film is taken out of the cassette, introduced
automatically into a development machine and developed into a so-called hard-copy image.

Materials 2011, 4
1036
1.3. Computed Radiography (CR)
About 20 years ago, X-ray radiography was the only non-digital medical imaging technique.
Technically, fluoroscopy was not digital either, but since it produces moving images it is considered
separate. X-ray images had to be stored in voluminous file cabinets and separate, inefficient image
retrieval procedures were needed. Image exchange was impractical. Apart from efficient storage and
retrieval, advantages of digital imaging are the possibility of image processing for detail visibility
improvement. Further, thanks to the fact that digital detectors have a much wider dynamic range than
film, under- or over-exposure is avoided. This eliminates the need for retakes that occurs with
screen/film systems [1].
The search for digital radiographic technologies started in the seventies of last century. Kodak had
the luck to patent the principle of computed radiography (CR) in the middle of this decade [2]. CR is
often compared to direct radiography (DR). Where CR generally involves the use of a cassette, like in
traditional screen/film systems, DR typically captures the image directly onto a flat panel detector.
Most DR detectors have a phosphor screen to convert the X-ray image into a visible light image. The
light creates a digital output signal in an a-Si photodiode layer. The digital signal is then read out by
thin film transistors.
In CR, the conventional X-ray phosphor screen + film detector is replaced by a storage phosphor
plate. Evidently, the storage phosphor is responsible for substantial X-ray absorption. Unlike what
happens in conventional phosphors, in a storage phosphor, part of the electron/hole pairs do not
recombine to transfer their energy to a luminescent center. A considerable fraction is trapped in
metastable states. A simplified non-detailed general model of the storage process is shown in Figure 2.
As long as the phosphor is not exposed to light or heat, recombination is not possible and the electrons
and holes remain trapped. The spatial distribution of the trapped charges in a plate containing storage
phosphor crystals makes up the latent image in CR.
Figure 2. Energy diagram showing electron and hole trapping in a storage phosphor.
The trapped electrons are sensitive to light. In an efficient storage phosphor, a red or near-infrared
photon supplies sufficient energy to escape. Subsequently, recombination with a trapped hole is
possible, followed by energy release initiating luminescence as in a conventional phosphor (Figure 3).
The photons emitted by the storage phosphor have higher energy than the photons stimulating the
trapped electrons, i.e., the process is anti-Stokes. It is called photo-stimulated luminescence (PSL) in

Materials 2011, 4
1037
contrast to the conventional luminescence, where a lower energy photon is generated by a higher
energy photon and which is called excited luminescence.
Figure 3. Energy diagram showing photo-stimulated luminescence in a storage phosphor.
In the CR work-flow a storage phosphor plate is exposed in a light-tight cassette as in screen/film
radiography. After X-ray exposure and patient identification, the cassette is introduced in a scanner for
read-out (Figure 4).
Figure 4. CR storage phosphor plate exposure and read-out.
The imaging plate (IP) is taken out of the cassette for scanning. A red laser beam is moved over the
plate in the ―fast-scan direction‖ by a scanning galvanometer or rotating mirror. Simultaneously, the
plate moves slowly in the ―slow-scan direction‖. In this way, the pixels of the storage phosphor plate
are stimulated one by one. The local storage phosphor emission is proportional to the local X-ray
absorption in the plate. A light guide transfers the emitted light to a photomultiplier tube (PMT). A
filter in front of the PMT absorbs the reflected laser light and transmits the phosphor emission light
(Figure 4). In the PMT, the light signal is transformed into an electrical signal, amplified, digitized and
stored in a computer file. After erasure the plate is re-inserted into the cassette for re-use.

Materials 2011, 4
1038
2. CR Phosphor Requirements
A good storage phosphor for medical CR must meet the following requirements [3]:
1. It should have a high X-ray absorption for medical X-ray spectra, i.e., for energies ranging
from 20 keV to 140 keV.
2. It should have high conversion efficiency. The amount of energy stored per unit X-ray
energy should be high. This implies that a large fraction of the mobile charge carriers
created by the absorbed X-ray quanta is converted into trapped electrons and holes forming
defect aggregates leading to PSL. The energy needed to create a trapped electron and hole in
the storage phosphors in commercial use is estimated to be:
100 eV in BaFBr:Eu2+
67 eV in CsBr:Eu2+
.
This means that one absorbed 50 keV X-ray quantum (general radiography) creates 500 to
750 trapped charge pairs an one absorbed 20 keV quantum (mammography) 200 to 300.
3. The image information stored in the phosphor should have slow fading in dark at room
temperature, i.e., electron- and hole traps should be stable. In practice, the so-called
dark-decay of the stored image in a CR plate is between 10 and 25% in the first hour after
X-ray exposure.
4. The stimulation spectrum should be in the range covered by inexpensive solid state lasers.
Currently laser diodes are commercially available with wavelengths ranging from 375 nm to
1800 nm, but red and IR lasers exhibit the best price/performance ratio. In addition, the
stimulation light should not produce free charges that can give rise to PSL. This excludes
lasers with wavelengths in the blue and UV parts of the spectrum. Finally, the stimulation
light and the stimulated emission should be spectrally separable. This is necessary since the
emitted light is between 105 and 10
9 times weaker than the stimulation light, depending on
X-ray spectrum and dose used to make the image. Color filters are applied to block the
stimulation wavelength and transmit the emission light. Since the slope of the filter curves is
finite, a stimulated emission with a wavelength close to that of the laser will also be
attenuated. Altogether, this means that efficient stimulation of the trapped charges should be
possible in the wavelength range between 500 and 1,500 nm. However, it is unlikely that
trapped charges that can be stimulated with 1,000 to 1,500 nm light are stable at room
temperature in the dark.
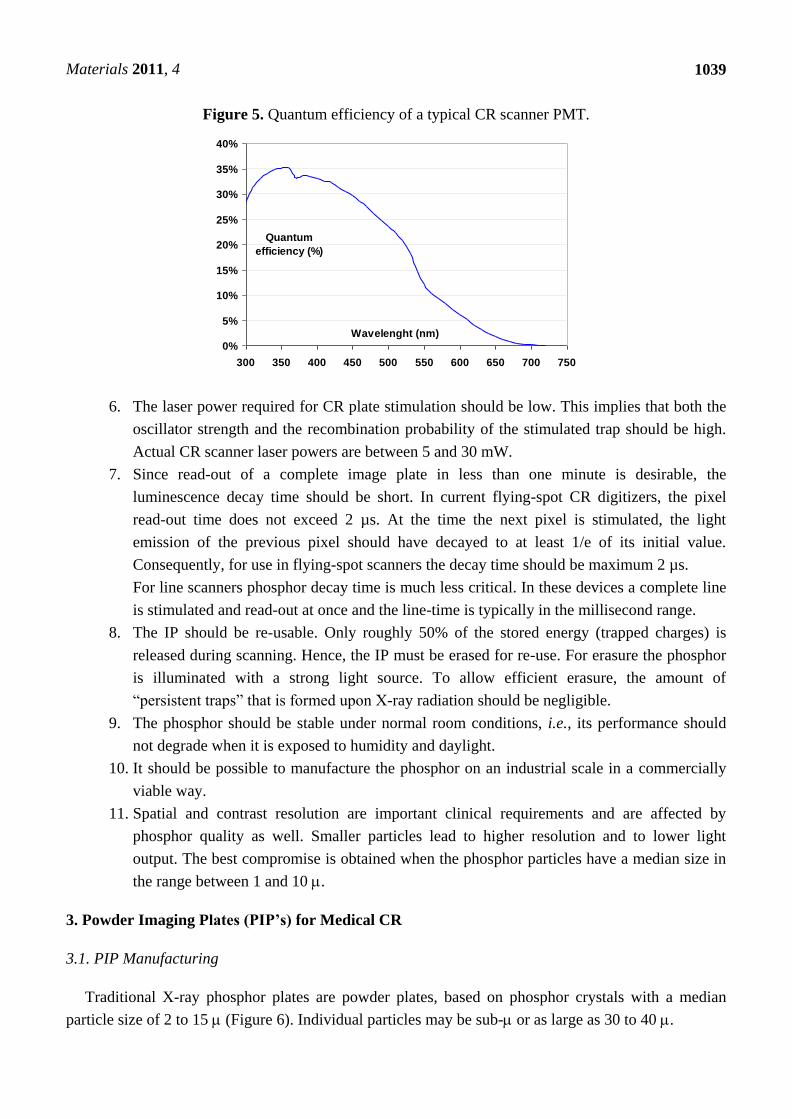
5. The CR phosphor emission should match the sensitivity spectrum of the light detector
(Figure 5). In flying-spot scanners with a PMT light detector, the emission is preferable
below 500 nm and most preferably in the range between 350 and 450 nm.
Materials 2011, 4
1039
Figure 5. Quantum efficiency of a typical CR scanner PMT.
6. The laser power required for CR plate stimulation should be low. This implies that both the
oscillator strength and the recombination probability of the stimulated trap should be high.
Actual CR scanner laser powers are between 5 and 30 mW.
7. Since read-out of a complete image plate in less than one minute is desirable, the
luminescence decay time should be short. In current flying-spot CR digitizers, the pixel
read-out time does not exceed 2 µs. At the time the next pixel is stimulated, the light
emission of the previous pixel should have decayed to at least 1/e of its initial value.
Consequently, for use in flying-spot scanners the decay time should be maximum 2 µs.
For line scanners phosphor decay time is much less critical. In these devices a complete line
is stimulated and read-out at once and the line-time is typically in the millisecond range.
8. The IP should be re-usable. Only roughly 50% of the stored energy (trapped charges) is
released during scanning. Hence, the IP must be erased for re-use. For erasure the phosphor
is illuminated with a strong light source. To allow efficient erasure, the amount of
―persistent traps‖ that is formed upon X-ray radiation should be negligible.
9. The phosphor should be stable under normal room conditions, i.e., its performance should
not degrade when it is exposed to humidity and daylight.
10. It should be possible to manufacture the phosphor on an industrial scale in a commercially
viable way.
11. Spatial and contrast resolution are important clinical requirements and are affected by
phosphor quality as well. Smaller particles lead to higher resolution and to lower light
output. The best compromise is obtained when the phosphor particles have a median size in
the range between 1 and 10 .
3. Powder Imaging Plates (PIP’s) for Medical CR
3.1. PIP Manufacturing
Traditional X-ray phosphor plates are powder plates, based on phosphor crystals with a median
particle size of 2 to 15 (Figure 6). Individual particles may be sub- or as large as 30 to 40 .
0%
5%
10%
15%
20%
25%
30%
35%
40%
300 350 400 450 500 550 600 650 700 750
Wavelenght (nm)
Quantum
efficiency (%)

Materials 2011, 4
1040
Figure 6. SEM image of BaFBr:Eu2+
storage phosphor powder.
Phosphors are crystalline host materials, almost always containing a trace amount of an activator
element. The activator molecules can be incorporated into the matrix material by diffusion at a
temperature, close to the matrix melting temperature (firing) [4]. To avoid oxidation, firing often must
take place in inert atmosphere. Often, as is the case for BaFBr:Eu2+
, also the host material is formed in
the firing process by reaction between raw materials. BaFBr can be made in a solid state reaction by
firing a mixture of BaF2 and BaBr2 or by a solid-gas reaction between BaF2 and NH4Br or between
BaBr2 and NH4F. Since the phosphor particle size is an important quality parameter, milling may be an
essential step in powder phosphor manufacturing. The first step in PIP manufacturing is making a
lacquer, based on phosphor powder. A polymer binder is dissolved in a solvent (mixture). Next, the
phosphor powder is dispersed in the solution, which gives a thick, white, phosphor ―paint‖. This
―paint‖ is coated on a substrate (often a PET film) and the solvents are evaporated. The dried layer
consists of phosphor particles, held together by a binder. Since the phosphor layer is vulnerable and
must be cleanable with liquid it is covered with a scratch-resistant protective coating (Figure 7).
Figure 7. Drawing of typical PIP cross-section.
3.2. The BaFBr:Eu2+
Storage Phosphor
At the time CR was invented a sufficiently performant storage phosphor was lacking. BaFCl:Eu2+
and BaFBr:Eu2+
had been of the first rare-earth X-ray phosphors for screen/film radiography [5]. The
BaFX matrix is a layered material with a tetragonal PbFCl or Matlockite structure [6]. The Eu activator
substitutes Ba for a small amount. Even today, BaFBr:Eu2+
is still in use in intensifying screens.
Originally, however, the BaFX:Eu2+
phosphors were suffering from a high degree of
after-glow [5]. This indicates that, after X-ray exposure, charges are trapped in the phosphor that
slowly leak away to give rise to delayed luminescence. In hindsight, it is no surprise, therefore, that the
NIP side
view
Plastic substrate
Phosphor layer
Top-coat
Anti-halo layer

Materials 2011, 4
1041
most important phosphors for medical CR are of the BaFX:Eu2+
family. It was at the end of the
seventies that Fuji discovered that BaFBr:Eu2+
is an excellent storage phosphor for use in medical
radiography [7]. It has a density of about 5 g/cm3, a K-edge of 37 keV that is well suited for general
radiography (Figure 8) and the Eu2+
excited state lifetime of about 800 nsec allows sufficiently fast
scanning in a CR digitizer. The discovery of this material started the development of CR and a cascade
of patents followed. It took about 15 years to develop a market ripe product. CR was introduced
around 1985 [8,9] by Fuji and found entrance on a significant scale in the 90’s of the previous century.
In the period from 1992 to 1994 also Agfa, Kodak and Konica launched CR.
Figure 8. Overlay of the mass attenuation coefficient of BaFBr0.85I0.15 and a typical general
radiography X-ray spectrum.
4. BaFBr:Eu2+
PSL Mechanism
As was pointed out, X-rays generate electrons and holes that can move freely through the phosphor
lattice. When a significant portion of these charge carriers is trapped in lattice defects, and when these
traps are stable at room temperature, the phosphor is capable of storing X-ray images. Storage and
read-out processes are shown schematically in Figures 2–3. Usually, the trapped electron is
photo-excited and recombines with the trapped hole. The recombination energy is transferred to an
electron of a luminescent impurity center, in the phosphor crystal lattice: the activator. When the
activator electron returns to the ground state a photon is emitted in the PSL process.
In BaFBr:Eu2+
the activator, obviously, is Eu2+
. The different theories proposed for explaining
energy storage and release will now be highlighted.
From the start it was claimed that X-rays generate F centers as electron traps. An F center is an
electron trapped in an anion vacancy. In the Matlockite structured BaFBr, Ba2+
layers are alternately
interspaced by two Br− layers and single F
− layer (Figure 9a). Hence, F(Br
−) and F(F
−) centers are
created as electron traps (Figure 9b).
0
0.2
0.4
0.6
0.8
1
10 30 50 70
Energy (keV)
Rel # X-ray
Quanta
1
10
100
Mass
attenuation
BaFBrxI1-x

Materials 2011, 4
1042
Figure 9. Model of the BaFBr lattice cell (a) with F(Br−) and F(F
−) centers (b).
In [10], it is shown that both centers are generated and contribute to PSL. However F(F−) centers are
only generated above 200 K, and the generation process has not yet been understood [11]. For practical
stimulation with a HeNe laser (633 nm) or diode lasers (650 nm–680 nm) the contribution of F(F−)
centers to PSL is negligible [12]. Nevertheless, the stimulation spectrum of BaFBr:Eu2+
has two
stimulation bands. The reason is that the F center has tetragonal symmetry in BaFCl and BaFBr. For
the electrical vector of the stimulation light E c axis, the F(Br−) absorption has its maximum at about
590 nm, and for E c axis at about 500 nm in BaFBr [13]. The absorption ratio is due to the statistical
distribution of parallel and perpendicular crystal orientation wrt. the stimulation light electrical vector.
A similar observation had been made earlier for BaFCl [6].
4.1. Electron and Hole Center Production
A first mechanism for the PSL process was proposed by Takahashi [9,14]. It is based on the
assumption that Br− vacancies are present within the virgin lattice. The electrons are trapped in the
vacancies by which F(Br−) centers are created. It is, further, assumed that the holes are trapped by Eu
2+
ions, which are thus oxidized to Eu3+
(Equation (1)). Takahashi argues that the F center electrons enter
the conduction band and recombine with Eu3+
ions upon photo stimulation of the F(Br−) center.
Recombination results in an excited Eu2+
ion (4f65d
1 state), that decays emitting the characteristic 390
nm luminescence.
32
-
-Br
Eu Eu
)F(Br V
rayX
rayX
(1)
An alternative mechanism proposed for alkali halides [15] was adopted by von Seggern et al. for
BaFBr:Eu2+
[12]. According to this model, X-rays generate excitons which upon decay may displace a
Br− ion from its lattice position leaving the electron behind, i.e., forming an F(Br
−) center. The Br atom
then combines with a Br− ion at an adjacent lattice position. A so-called H center is created: a
negatively charged halide molecule that occupies a single halide lattice position (Equation (2)). In this
model there is no need to assume that anion vacancies are present in the virgin material. Upon F center

Materials 2011, 4
1043
photo stimulation the released electron may recombine with the H center hole trap. This excites the
Eu2+
activator, resulting in PSL.
)()F(Br )/(e
)/(e h
2
--
-
BrHexcitonh
excitonh
rayX
rayX (2)
However, none of the scientific groups that investigated the BaFBr:Eu2+
PSL mechanism has been
able to demonstrate an increase in Eu3+
concentration or the presence of H centers after X-ray
exposure. The lack of experimental support for the described models gave rise to a third proposal for
the formation of defect centers by Spaeth et al. [16-20]. This model equally assumes that vacancies are
already present in the virgin lattice. The origin of the Br− vacancies in BaFBr is discussed in
4.4. Spaeth et al. proved experimentally that X-ray exposure of BaFBr single crystals results in the
formation of F(Br−) and VK center pairs.
)()F(Br 2
- BrVV K
rayX
Br (3)
The electron is trapped in an anion vacancy and the holes by two adjacent Br− lattice ions. As a
result both Br− ions shift slightly towards each other into the interstitial space. The resulting Br2
−
dumbbell is a called a VK center (Figure 10). Recombination of the F(Br−) electron with a VK center
upon photo stimulation releases energy that excites the Eu2+
activator resulting in PSL. Although the
hole trap has not yet been identified spectroscopically, this model is until now not contradicted
by experiment.
Figure 10. Model of the BaFBr lattice cell with VK (Br2−) center.
4.2. Recombination of Trapped Electrons and Holes
After excitation of the F center electron the F center environment undergoes a lattice relaxation due
to the different charge distribution in the ground and excited states [21-23]. The energy of the electron
in the relaxed excited state (RES) is very close to that of the conduction band. For release into the
conduction band a thermal energy of 35 meV is needed [21]. Hence, the probability for escape into the
conduction band is determined by the lattice temperature.

Materials 2011, 4
1044
Alternatively, the electron may tunnel to the hole center. Only for centers separated by a few lattice
constants this process has non-zero probability. In case neither of the above processes happens during
the intrinsic lifetime of the RES, the electron falls back to its ground state and emits an IR photon with
0.9 eV energy.
Electron transport via the conduction band can be ruled out as charge transfer process and tunneling
should be considered as the only possibility. The decay of PSL under continuous stimulation is
temperature independent [24]. If the PSL process would require thermal energy to inject the electrons
into the conduction band this would clearly not be the case. Also efficient PSL has been detected down
to temperatures of 1.5 K. This cannot be explained by a model that relies on electron transport via the
conduction band.
In order to transfer the recombination energy to the Eu2+
activator the electron and hole traps should
be spatially correlated with it. For efficient PSL the electron and hole traps need to be spatially
correlated with each other (tunneling probability) and with the Eu2+
activator (energy transfer). Hence,
triple defect aggregates are required for efficient PSL. Within such a triple aggregate the distances
between the individual defect centers should be only a few lattice constants.
4.3. Spatial Correlation of Defects
The electron-hole pair concentration resulting from exposure to a medical X-ray dose is extremely
low, i.e., <1013
per cm3. The concentration of F/Vk centers will be even lower as a significant portion
of the electron hole pairs will recombine before being trapped. The activator concentration is
approximately four orders of magnitude higher i.e., 1017
per cm3, but this is still very low .These low
concentrations make it very unlikely that the F(Br−)/VK center pair will be created in the vicinity of a
Eu2+
ion.
Nevertheless, efficient PSL is still observed, at 1.5 K. At this temperature the mobility of the F and
VK centers is practically zero. The measured PSL at 1.5 K indicates that triple aggregates are already
formed at these low temperatures. Experimentally a spatial correlation between F/VK centers and Eu2+
was indeed found [19,25]. Although it has not strictly been proven, one may assume that the exciton
decay causing the formation of the F/VK centers preferentially occurs in the vicinity of the Eu2+
activator site.
Initially, the F(Br−)/VK center pair is spatially correlated but at room temperature the centers may
diffuse away from each other, since the VK center is mobile above 120 K, and the F(Br−) center above
200 K [19,20].
At higher temperatures the formation of triple aggregates is assumed to be a dynamic equilibrium.
As a consequence of the defect mobility, some aggregates will be broken while others will be formed.
This assumption is supported by the replenishment effect. At low temperature, a phosphor crystal is
stimulated until it is exhausted. When it is next heated to a temperature above 200 K, it can be
stimulated again [15].
4.4. The Formation of Bromine Vacancies in the BaFBr Lattice
BaFBr powders produced by firing stoichiometric ratios of BaF2 and BaBr2 or single crystals grown
from a melt of such mixtures are all contaminated with oxygen, probably because of the hygroscopic

Materials 2011, 4
1045
nature of BaBr2. Spaeth et al. demonstrated experimentally that oxygen is incorporated in the fluoride
sub lattice, substituting for F−, i.e., forming OF
2− centers. For charge compensation an anion vacancy is
needed. This anion vacancy proved to be a Br- vacancy [11,17,18].
Above 120 K the OF2−
center may react with the VK center to form a new hole center OF−
(Figure 11).
F
rayX
F
F
rayX
F
OBrO
OBrFBrO
)F(Br )(V
)()(V V
-
K
2
2
KBr
2-
(4)
Figure 11. Energy diagram showing photo-stimulated luminescence in BaFBr:Eu2+
and the
relation with the stimulation, excitation and emission spectrum of the material.
5. BaFBr:Eu2+
Engineering
Storage phosphors used in CR depend on efficient trapping and storage of free electrons and holes.
Hence, changing the storage center characteristics has been the subject of most of BaFBr:Eu2+
storage
phosphor engineering. The Mollwo-Ivey relation, based on the particle-in-a-box model, relates the
peak F center absorption wavelength to the defect size: the absorption wavelength is proportional to
d1.84
, where d is the nearest neighbor distance [26]. The model was derived for a vacancy with cubic
symmetry, but it can be used to explain in a qualitative way the impact of lattice changes on F-center
characteristics. Partial or complete replacement of Ba and/or Br in the BaFBr lattice changes the
F center dimensions and the stimulation spectrum of the storage phosphor. One particular change of
the phosphor composition produced a change in the nature of the hole trap.
Materials 2011, 4
1046
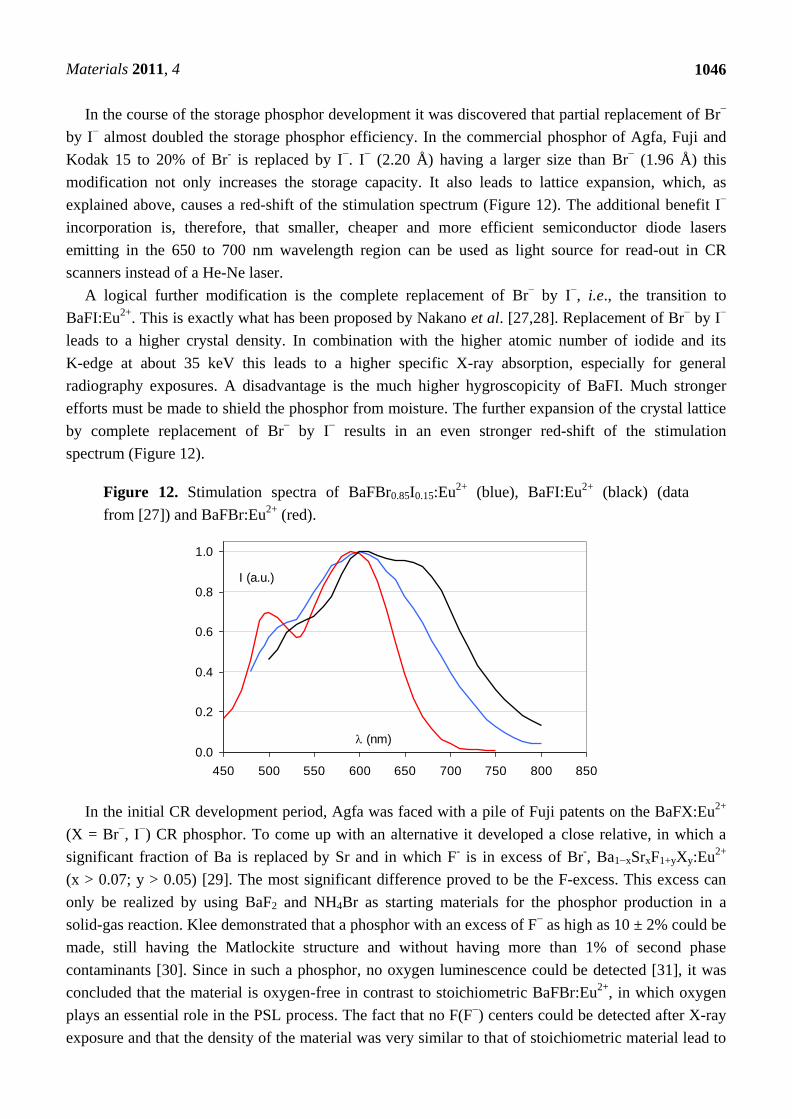
In the course of the storage phosphor development it was discovered that partial replacement of Br−
by I− almost doubled the storage phosphor efficiency. In the commercial phosphor of Agfa, Fuji and
Kodak 15 to 20% of Br- is replaced by I
−. I
− (2.20 Å) having a larger size than Br
− (1.96 Å) this
modification not only increases the storage capacity. It also leads to lattice expansion, which, as
explained above, causes a red-shift of the stimulation spectrum (Figure 12). The additional benefit I−
incorporation is, therefore, that smaller, cheaper and more efficient semiconductor diode lasers
emitting in the 650 to 700 nm wavelength region can be used as light source for read-out in CR
scanners instead of a He-Ne laser.
A logical further modification is the complete replacement of Br− by I
−, i.e., the transition to
BaFI:Eu2+
. This is exactly what has been proposed by Nakano et al. [27,28]. Replacement of Br− by I
−
leads to a higher crystal density. In combination with the higher atomic number of iodide and its
K-edge at about 35 keV this leads to a higher specific X-ray absorption, especially for general
radiography exposures. A disadvantage is the much higher hygroscopicity of BaFI. Much stronger
efforts must be made to shield the phosphor from moisture. The further expansion of the crystal lattice
by complete replacement of Br− by I
− results in an even stronger red-shift of the stimulation
spectrum (Figure 12).
Figure 12. Stimulation spectra of BaFBr0.85I0.15:Eu2+
(blue), BaFI:Eu2+
(black) (data
from [27]) and BaFBr:Eu2+
(red).
In the initial CR development period, Agfa was faced with a pile of Fuji patents on the BaFX:Eu2+
(X = Br−, I
−) CR phosphor. To come up with an alternative it developed a close relative, in which a
significant fraction of Ba is replaced by Sr and in which F- is in excess of Br
-, Ba1−xSrxF1+yXy:Eu
2+
(x > 0.07; y > 0.05) [29]. The most significant difference proved to be the F-excess. This excess can
only be realized by using BaF2 and NH4Br as starting materials for the phosphor production in a
solid-gas reaction. Klee demonstrated that a phosphor with an excess of F− as high as 10 ± 2% could be
made, still having the Matlockite structure and without having more than 1% of second phase
contaminants [30]. Since in such a phosphor, no oxygen luminescence could be detected [31], it was
concluded that the material is oxygen-free in contrast to stoichiometric BaFBr:Eu2+
, in which oxygen
plays an essential role in the PSL process. The fact that no F(F−) centers could be detected after X-ray
exposure and that the density of the material was very similar to that of stoichiometric material lead to
0.0
0.2
0.4
0.6
0.8
1.0
450 500 550 600 650 700 750 800 850
l (nm)
I (a.u.)

Materials 2011, 4
1047
the speculation that the non-stoichiometric phosphor has F− antisites, i.e., F
− on Br
− sites. The
existence of such antisites was established by magic angle spinning nuclear magnetic resonance
(MAS-NMR), a technique that allows distinguishing between F- on regular sites and on Br
−
sites [32,33]. An EPR study lead Schweizer et al. to the conclusion that PSL in the non-stoichiometric
phosphor is based on a new hole trap, different from the OF2−
center that is converted to OF− upon hole
trapping in stoichiometric BaFBr:Eu2+
. It was established that X-ray exposure created besides the
expected F(Br−) centers as electron traps F2
− molecular centers or H-centers in the F
− sub lattice
(Figure 13). Hence, charge separation in the non-stoichiometric phosphor is realized by the process of
electron trapping in the Br− sub lattice and hole trapping in H centers in the F
− sub lattice.
Figure 13. Model of the BaFBr lattice cell with H (F2−) center.
Figure 14 demonstrates that the partial replacement of Ba2+
by Sr2+
causes a broadening of the
stimulation spectrum. This has been attributed to an inhomogeneous distribution of Sr2+
and Ba2+
neighbors around the F centers [34]. F centers neighboring an impurity ion are called FA centers and
their absorption spectrum is influenced by the presence of the foreign ion. The FA(Br−) centers in
Ba0.82Sr0.18F1+xBr1−x:Eu2+
have a Sr2+
neighbor with a size of 1.12 Å replacing a Ba2+
ion with 1.34 Å
size. They are larger than F(Br−) centers, which explains the red-shift of a part of the stimulation
spectrum. A study by Batentschuk et al. [35] further demonstrated that Sr doping not only gives rise to
FA(Br−) center formation, but that it also increases the PSL-response in the bands ascribed to F(Br
−)
centers. The increased PSL response has been explained by the fact that the Sr2+
ions stabilize the hole
centers at room temperature in a similar way as Eu2+
[36]. FA(Br−) centers seem to be less stable than
unperturbed F(Br−) centers. The red-shift of the stimulation spectrum disappears upon thermal
activation above room temperature [37]. The thermally activated change of the stimulation spectrum is
also observed when in the so-called ―replenishment‖ effect in Ba0.82Sr0.18F1+xBr1−x:Eu2+
(Figure 15).
After X-ray exposure and exhausting read-out, the stimulation spectrum gradually recovers to some
extent when the electrons that are still trapped, redistribute themselves over the trapping centers. The
recovered stimulation spectrum is that of stoichiometric BaFBr:Eu2+
.

Materials 2011, 4
1048
Figure 14. Stimulation spectrum of Ba0.82Sr0.18FBr:Eu2+
(gold) (data from [34]) and
BaFBr:Eu2+
(red).
.
Figure 15. Stimulation spectrum measured at 300 K after X-ray exposure of
Ba0.88Sr0.12F1.09Br0.91:Eu2+
(a), and after erasure and 2 (b), 4 (c) and 8 (d) h replenishment.
Ca2+
Incorporation has a similar effect as Sr2+
incorporation (Figure 16). It results in a broadened
stimulation spectrum due to the presence of a Ca2+
induced FA(Br−,Ca
2+) center with stimulation
maxima at 540 and 680 nm [38]. It was shown that the X-ray sensitivity, i.e., the number of storage
centers formed per unit of absorbed X-ray energy, increases up to a doping level of 1 mole%. In
addition, it was shown that FA centers are formed far beyond the statistical probability corresponding
to the Ca2+
doping level. The estimated ratio of FA to unperturbed F centers was approximately 3:1 for
a doping level of 2%. The sensitivity drops rapidly at higher concentrations of Ca, probably because
the much smaller Ca2+
ions (size = 0.99 Å) can replace Ba2+
only to a small extent without bringing too
much stress in the BaFBr lattice.
The 37.4 keV Ba K-edge is well suited for high specific X-ray absorption in general radiography,
where X-ray spectra are used having a maximum at about 50 keV. A typical mammography X-ray
spectrum, however, is in the range from 15 to 30 keV (Figure 17).
0.0
0.2
0.4
0.6
0.8
1.0
450 500 550 600 650 700 750 800
l (nm)
I (a.u.)
0.0
0.2
0.4
0.6
0.8
1.0
450 500 550 600 650 700 750 800
l (nm)
I (a.u.)a
b
c
d

Materials 2011, 4
1049
Figure 16. Stimulation spectra of Ba0.99Ca0.01FBr:Eu2+
(purple) (data from [39]) and
BaFBr:Eu2+
(red).
Figure 17. Overlay of the mass attenuation coefficient of SrFBr and a typical
mammography X-ray spectrum.
As a consequence, SrFBr:Eu2+
containing Sr with its K-edge at 16.1 keV is more suited for this
application. As a matter of fact, in spite of its slightly lower density of 4.7 g/cm3 and in spite of the
lower atomic number of Sr, SrFBr:Eu2+
has a higher specific X-ray absorption than BaFBr:Eu2+
in the
range of 16.1 to 37.4 keV (Figure 17). Hosoi et al. demonstrated that the Sr-based phosphor leads to
very good image quality in mammography [40]. Due to the smaller cation size, SrFBr has smaller
lattice constants than BaFBr. This entails smaller F-centers after X-ray exposure requiring higher
energy to release the trapped electrons in the read-out process. Efficient stimulation requires light in
the 500–550 nm, instead of the 570–630 nm range (Figure 18). At the time of the investigation lasers
emitting in this range showed poor stability and were much more expensive than lasers emitting in the
600–700 nm range. Another disadvantage is that SrFBr:Eu2+
is much more hygroscopic than
BaFBr:Eu2+
. Hence, a much larger effort is needed to stabilize the IP’s. This may explain why the
material never made it to the commercial stage.
0.0
0.2
0.4
0.6
0.8
1.0
450 500 550 600 650 700 750 800
l (nm)
I (a.u.)
0
0.2
0.4
0.6
0.8
1
10 15 20 25 30
Energy (keV)
Rel # X-ray
Quanta
1
10
100
Mass
attenuation
SrFBr

Materials 2011, 4
1050
Figure 18. Stimulation spectrum of SrFBr:Eu2+
(green) (data from [40]) and
BaFBr:Eu2+
(red).
6. Alternative Storage Phosphors for Medical CR
BaFX:Eu2+
(X = Br, I) complies remarkably well with all CR phosphor requirements. There were
two main motives to search for alternatives. The first was simply the pile of Fuji patents on this CR
phosphor family. The second was an evolution in radiographic 2D medical imaging. A newer and
promising imaging technology, direct radiography (DR) based on flat panel arrays, was launched in the
mid-nineties. Since, at that point, this technology allowed a lower patient dose compared to CR, it was
a challenge to make CR more dose efficient. Translated to storage phosphor characteristics this means
higher X-ray absorption and more light output for the same absorbed dose. This can be realized by
using a different phosphor compound with a higher specific X-ray absorption, or, alternatively, by
making the phosphor layer thicker without compromising spatial resolution. Thicker phosphor coatings
can be realized using phosphor compounds that can be grown into needles. Needle phosphor will be
dealt with in paragraph 7. Another way to manufacture a useful thicker phosphor layer is by using
semi-transparent storage phosphor glass ceramics.
This overview shortly deals with:
- the most promising candidates to replace BaFBr:Eu2+
- storage phosphors having high X-ray absorption or useable for manufacturing thicker and,
therefore, more absorbing phosphor screens.
It was not intended to be complete.
Storage phosphors are compared based on the following quality parameters [41]:
Conversion efficiency (CE): the total energy of stimulated light per unit area and per unit of
X-ray dose produced by the phosphor in pJ/mm2/mR,
Stimulation energy (SE): the laser energy per unit area required to release 63% of the stored
energy in µJ/mm2.
Often the Figure of Merit (FOM) is used as an overall quality measure of a storage phosphor. This
only makes sense, however, when phosphors are compared that have stimulation energies in the
same range.
0.0
0.2
0.4
0.6
0.8
1.0
450 500 550 600 650 700 750 800
l (nm)
I (a.u.)
Materials 2011, 4
1051
6.1. BaFBr:Eu2+
Alternatives
Bariumbromosilicate, Ba5SiO4Br6:Eu2+
, was first synthesized and characterized by
Blasse et al. [41,42] in 1989. The material was doped with Eu2+
and co-doped with a trivalent rare
earth element from the group: Y, La, Gd and Lu. The stimulated emission peaks at 440 nm. The
stimulation spectrum consists of two stimulation bands: one with a maximum below 500 nm and one
with a maximum at 610 nm. Stimulation with green light (500 nm ≤ l ≤ 550 nm) is approximately
twice as efficient as stimulation with red light from a He-Ne laser (l = 633 nm). The SE was
40 J/mm2 for green stimulation and 70 J/mm
2 for red stimulation, respectively. Since the SE of
BaFBr:Eu2+
is of the order of 15 J/mm2 higher laser power is needed for stimulation of this phosphor.
The CE of the storage phosphor was of the same order of magnitude as that of the contemporary
BaFBr:Eu2+
reference, i.e., 3.8 pJ/mm2/mR. At this level, however, that the X-ray energy needed to
create a stimulable defect center is still 6 to 7 times higher than for optimized BaFX:Eu2+
phosphors.
An advantage of bariumbromosilicate resides in the fact that it is much less hygroscopic than
BaFBr:Eu2+
. Ba5SiO4Br6:Eu2+
phosphors were also optimized for IR stimulation and were patented for
this [43]. Based on the level of the PSL properties, however, Agfa decided to develop
Ba0.82Sr0.18F1+xBr1−x:Eu2+
for commercial use and not bariumbromosilicate.
Storage properties of rare earth doped phosphates were investigated by Blasse et al. [44,45].
Ba3(PO4)2:Eu2+
powder phosphor was made together with the co-doped material Ba3(PO4)2:Eu2+
,La3+
.
All samples exhibited PSL with an emission peaking at 410 nm. The stimulation spectrum peaks at
about 475 nm but has a tail extending to 800 nm. It was found that co-doping with a trivalent ion
enhanced the CE. The first non-optimized samples showed a promising storage capacity: the CE of the
co-doped sample was 20% of that BaFBr:Eu2+
. The main disadvantage was the SE that was much
higher than that of BaFBr:Eu2+
: 5 mJ/mm2 versus 15 J/mm
2. This was attributed to the low absorption
strength of the trap or to the low re-combination probability.
6.2. Higher Intrinsic Absorption
With its density of 9.4 g/cm3 terbium doped Lu2O3, Lu2O3:Tb
3+, was a candidate storage phosphor
with higher intrinsic absorption. A sintered ceramic of this material was demonstrated to have storage
phosphor properties [46]. The PSL has the strongest lines between 540 and 560 nm. It can be
stimulated either with IR (980 nm) or with a red (647 nm) light. The red stimulation is more efficient
but is more difficult to separate from the stimulated emission. The emission wavelengths of
Lu2O3:Tb3+
, clearly, do not match well with the conversion efficiency spectrum of a PMT.
6.3. Elpasolite Storage Phosphor
Cs2NaYF6:Ce3+
is a compound with a cubic elpasolite structure that has storage phosphor capacities
and that can be grown into needles [47]. It was patented by Agfa [48]. PSL peaks at 360 nm and the
stimulation spectrum at 550 nm. Therefore, it must be excited with a green laser, as, e.g., a frequency
doubled Nd:YAG laser, emitting at 532 nm. These lasers are more expensive than red diode lasers with
the same power. When excited at 532 nm the conversion efficiency is 15 pJ/mm2/mR and the
Materials 2011, 4
1052
stimulation energy 90 J/mm2. Fading of the stored energy is still acceptable: approximately 30% is
lost in the first hour [47].
6.4. Alkaline Earth Sulfide Storage Phosphors
Rare earth doped alkaline earth sulfides are efficient scintillators. Chakrabarti [49,50] showed that
MgS:Ce3+
:Sm3+
, MgS:Eu2+
:Sm3+
and CaS:Ce3+
:Sm3+
also exhibit storage phosphor characteristics. The
low X-ray absorption of these materials disqualifies them as medical detector materials. However, they
are well suited for dosimeter applications.
Intense PSL was also found in SrS:Eu2+
:Sm3+
[51], a compound with acceptable X-ray absorption
for mammography. The stimulated emission peaks at 600 nm, and the stimulation spectrum extends
from 800 nm to 1700 nm, with a peak close to the wavelength of a Nd:YAG laser (1.06 µ).
A similar material, SrS:Ce3+
:Sm3+
, was patented and commercialized by Liberty Technologies [52].
This material showed a stimulated emission at 485 nm. The stimulation spectrum shows peaks at 590
and 970 nm. The yellow peak (590 nm) is approximately twice the size of the IR peak (970 nm).
What is interesting about this class of storage phosphors is that a ―redox couple‖ of rare earths is
used for energy storage and PSL. One of the rare earths serves as hole trap; the other as electron trap.
For example, following charge transitions are believed to take place in SrS:Ce3+
;Sm3+
:
3324
2433
Ce
e Sm
SmSmCe
SmCCe
PSL
rayX
(5)
A general approach for the development of storage phosphors, based on this principle, has been
proposed by Dorenbos. Empirical models have been developed that predict accurately the location of
lanthanide energy levels within the forbidden gap of inorganic compounds. These models have been
used to locate the 5d excited and 4f ground states relative to the conduction and valence band of host
compound [53]. A suitable electron trapping lanthanide can be selected and combined with a suitable
recombination center. This makes it possible to control what lanthanides are storing what type of
charge carrier and how deep they are stored. Deliberate design of lanthanide based electron storing
phosphors is achievable in this way and might lead to alternative classes of storage phosphors.
6.5. Storage Phosphor Glass Ceramics
Bromine and europium co-doped fluorobromozirconate glass ceramics exhibit weak PSL. This
effect is strongly enhanced after thermal annealing [54]. The glasses contain 20% of BaF2. Annealing
results in BaBr2 nano-crystals that are incorporated in the glass material. Hence the designation glass
ceramic. After annealing the transparent glass is transformed into a semi-opaque material. This is due
to a phase transition of the metastable hexagonal BaBr2 nano-crystals to larger stable orthorhombic
BaBr2 crystals. These crystals exhibit more efficient PSL properties. The stimulated emission has its
maximum at 404 nm and the stimulation spectrum at 580 nm.
PSL efficiency was reported to be 9% of that of the BaFBr:Eu2+
reference. When correction is made
for the small fraction that the crystallites constitute (7%), the PSL is nearly 1.3 times that of
BaFBr:Eu2+
.
Materials 2011, 4
1053
7. Needle Storage Phosphors for Medical CR
7.1. Needle Plate Manufacturing
An alternative technology to produce phosphor layers is through physical vapor deposition (PVD).
The most common PVD technique is thermal vapor deposition, but deposition via electron beam
sputtering is equally possible. In thermal vapor deposition, the phosphor raw materials, mostly a
simple salt and an activator compound, containing the luminescent element, are heated to above the
melting temperature in a vacuum chamber. This happens by resistive heating of metal crucibles
containing the raw materials. In vacuum a gas cloud is produced above the liquid salt, which then
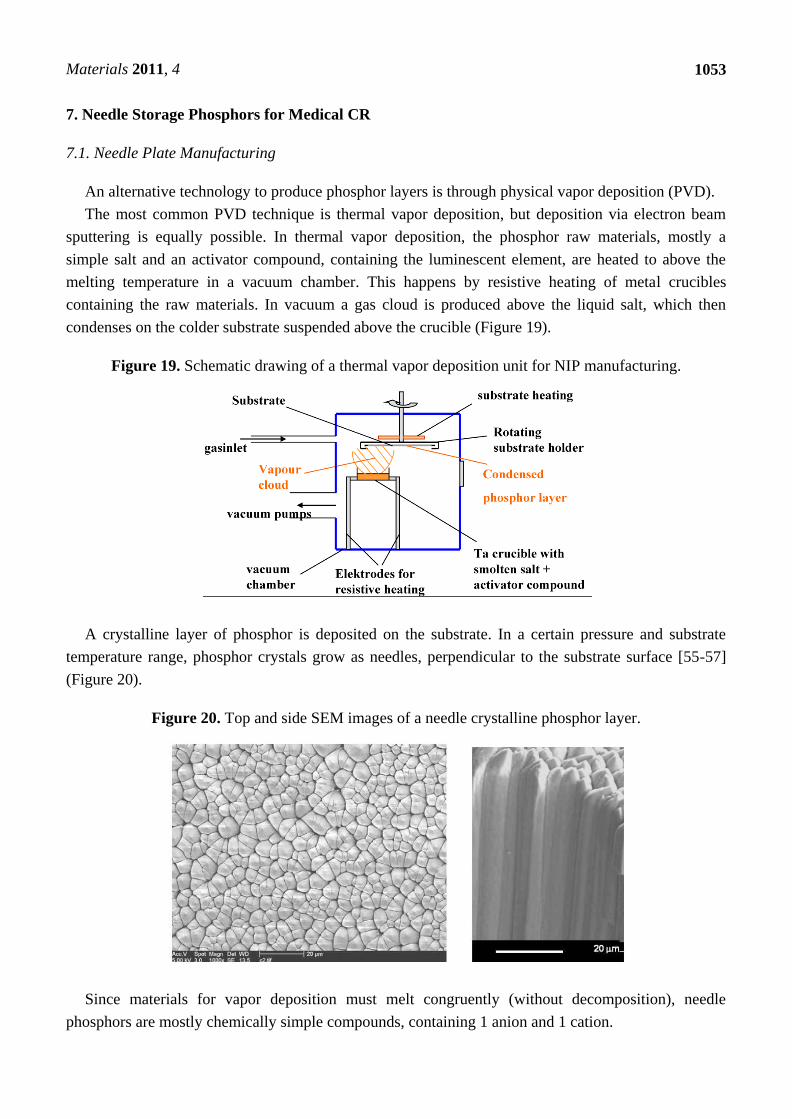
condenses on the colder substrate suspended above the crucible (Figure 19).
Figure 19. Schematic drawing of a thermal vapor deposition unit for NIP manufacturing.
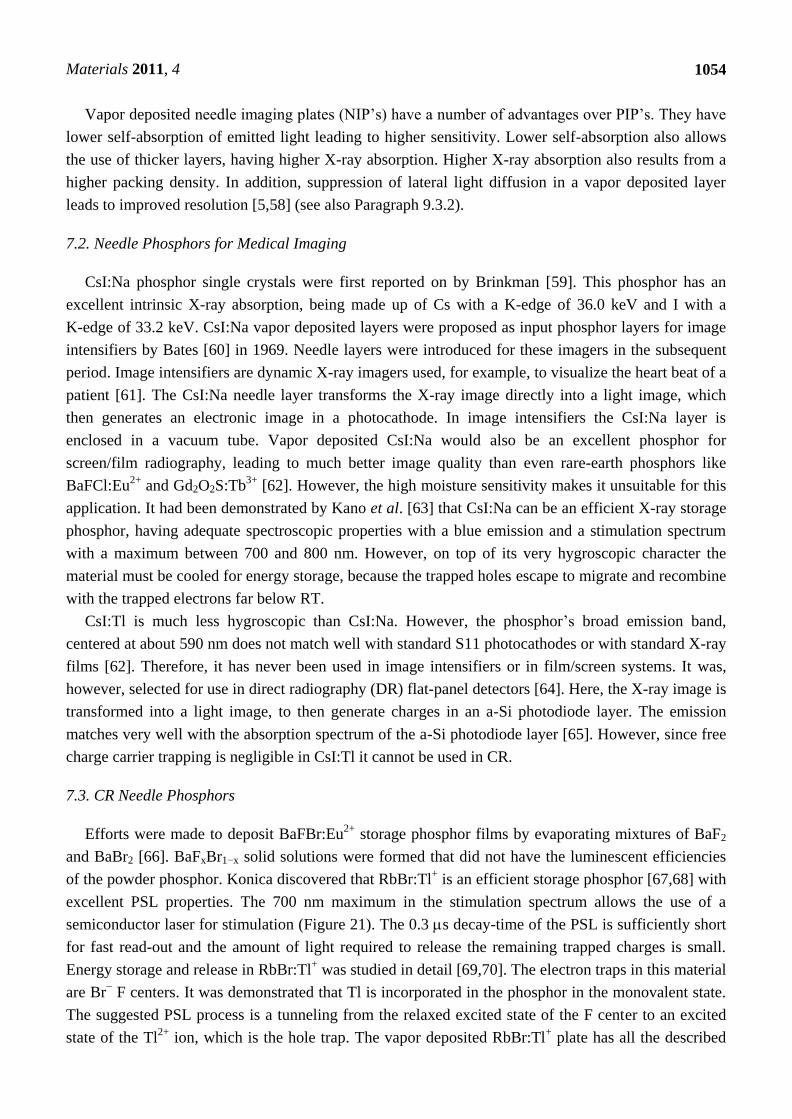
A crystalline layer of phosphor is deposited on the substrate. In a certain pressure and substrate
temperature range, phosphor crystals grow as needles, perpendicular to the substrate surface [55-57]
(Figure 20).
Figure 20. Top and side SEM images of a needle crystalline phosphor layer.
Since materials for vapor deposition must melt congruently (without decomposition), needle
phosphors are mostly chemically simple compounds, containing 1 anion and 1 cation.
Materials 2011, 4
1054
Vapor deposited needle imaging plates (NIP’s) have a number of advantages over PIP’s. They have
lower self-absorption of emitted light leading to higher sensitivity. Lower self-absorption also allows
the use of thicker layers, having higher X-ray absorption. Higher X-ray absorption also results from a
higher packing density. In addition, suppression of lateral light diffusion in a vapor deposited layer
leads to improved resolution [5,58] (see also Paragraph 9.3.2).
7.2. Needle Phosphors for Medical Imaging
CsI:Na phosphor single crystals were first reported on by Brinkman [59]. This phosphor has an
excellent intrinsic X-ray absorption, being made up of Cs with a K-edge of 36.0 keV and I with a
K-edge of 33.2 keV. CsI:Na vapor deposited layers were proposed as input phosphor layers for image
intensifiers by Bates [60] in 1969. Needle layers were introduced for these imagers in the subsequent
period. Image intensifiers are dynamic X-ray imagers used, for example, to visualize the heart beat of a
patient [61]. The CsI:Na needle layer transforms the X-ray image directly into a light image, which
then generates an electronic image in a photocathode. In image intensifiers the CsI:Na layer is
enclosed in a vacuum tube. Vapor deposited CsI:Na would also be an excellent phosphor for
screen/film radiography, leading to much better image quality than even rare-earth phosphors like
BaFCl:Eu2+
and Gd2O2S:Tb3+
[62]. However, the high moisture sensitivity makes it unsuitable for this
application. It had been demonstrated by Kano et al. [63] that CsI:Na can be an efficient X-ray storage
phosphor, having adequate spectroscopic properties with a blue emission and a stimulation spectrum
with a maximum between 700 and 800 nm. However, on top of its very hygroscopic character the
material must be cooled for energy storage, because the trapped holes escape to migrate and recombine
with the trapped electrons far below RT.
CsI:Tl is much less hygroscopic than CsI:Na. However, the phosphor’s broad emission band,
centered at about 590 nm does not match well with standard S11 photocathodes or with standard X-ray
films [62]. Therefore, it has never been used in image intensifiers or in film/screen systems. It was,
however, selected for use in direct radiography (DR) flat-panel detectors [64]. Here, the X-ray image is
transformed into a light image, to then generate charges in an a-Si photodiode layer. The emission
matches very well with the absorption spectrum of the a-Si photodiode layer [65]. However, since free
charge carrier trapping is negligible in CsI:Tl it cannot be used in CR.
7.3. CR Needle Phosphors
Efforts were made to deposit BaFBr:Eu2+
storage phosphor films by evaporating mixtures of BaF2
and BaBr2 [66]. BaFxBr1−x solid solutions were formed that did not have the luminescent efficiencies
of the powder phosphor. Konica discovered that RbBr:Tl+ is an efficient storage phosphor [67,68] with
excellent PSL properties. The 700 nm maximum in the stimulation spectrum allows the use of a
semiconductor laser for stimulation (Figure 21). The 0.3 s decay-time of the PSL is sufficiently short
for fast read-out and the amount of light required to release the remaining trapped charges is small.
Energy storage and release in RbBr:Tl+ was studied in detail [69,70]. The electron traps in this material
are Br− F centers. It was demonstrated that Tl is incorporated in the phosphor in the monovalent state.
The suggested PSL process is a tunneling from the relaxed excited state of the F center to an excited
state of the Tl2+
ion, which is the hole trap. The vapor deposited RbBr:Tl+ plate has all the described

Materials 2011, 4
1055
NIP benefits. However, Rb with its K-edge of 15.2 keV has a relatively low intrinsic X-ray absorption.
Therefore, the X-ray absorption of the two times thicker—and more expensive—NIP was even slightly
below that of the BaFBr:Eu2+
PIP. In addition, RbBr:Tl+ is much more hygroscopic than BaFBr:Eu
2+.
This made the use of RbBr:Tl+ plates in a cassette system, in which the atmospheric conditions cannot
be controlled and where the protective coating can be damaged, risky. Konica used the RbBr:Tl+ plates
only in wall-stands as the Regius
model 330 and 530 ―direct digitizer‖ systems, in which the phosphor
plates together with the read-out optics and erasure unit were incorporated in a closed casing [71].
Figure 21. Emission (violet) and stimulation (red) spectrum of RbBr:Tl+ storage phosphor
(data from [67]).
PSL was investigated in several In+, and Ga
+ doped alkali halides [72-74]. The characteristics of
these materials are given in Table 1.
Table 1. PSL characteristics of In+ and Ga
+ doped alkali halide storage phosphors in
comparison with standard BaFBr:Eu2+
.
Phosphor Stimulating laser
wavelength (nm)
Peak PSL
wavelength (nm)
Peak stimulation
wavelength (nm)
CE
pJ/mm2/mR
SE
J/mm2
BaFBr:Eu2+
633 390 550 20 16
BaFBr:Eu2+
680 390 550 14 28
RbBr:In+
680 490 700 2 25
RbBr:Ga+ 680 550 705 6 4
CsBr:In+ 680 504 700 3 23
CsBr:Ga+ 680 515 685 6 4
An interesting feature of these materials is that the peak of the stimulation spectrum practically
coincides with the emission of a 680 nm diode laser. The PSL spectrum matches well with the solid
state photodiodes. The RbBr compounds suffer from the same weaknesses as RbBr:Tl+. Their intrinsic
X-ray absorption is insufficient and they are very moisture sensitive. These deficits are not shared by
the CsBr based phosphors. In view of the reasonable CE and very low SE CsBr:Ga+ was proposed as
storage phosphor for a NIP in 1999 [75]. The decay-time of the Ga+ luminescence is of the order of
0.0
0.2
0.4
0.6
0.8
1.0
250 350 450 550 650 750 850 950
l (nm)
I (a.u.)

Materials 2011, 4
1056
20 s [76]. For this reason and in view of its PSL wavelength of 515 nm, this phosphor must be used
in a line scanner [77], in which the phosphor plate is stimulated line by line (Figure 22). In a line
scanner efficient read-out is possible with a line scanning time of the order of 1 ms.
Figure 22. Schematic diagram of line-scanning principle (adapted from [77]).
It soon became clear, however, that Eu2+
is the dopant of choice in CsBr [78,79]. Figure 23 shows
the emission spectrum, centered at about 440 nm which allows efficient conversion with a
photomultiplier tube.
Figure 23. Emission and stimulation spectrum of CsBr:Eu2+
(data from [78]).
The short Eu2+
characteristic decay-time makes fast read-out possible and the material has a
convenient stimulation spectrum maximum at 680 nm.
CsBr:Eu2+
has a light output per absorbed dose that is higher than that of BaFX:Eu2+
. The CE is about
35 pJ/mm2/mR vs. about 25 pJ/mm
2/mR for the best BaFX:Eu
2+ materials. Less light is needed to stimulate
the phosphor, allowing the use of a less powerful laser and erasure source in the scanner (Figure 24).
0
0.2
0.4
0.6
0.8
1
300 400 500 600 700 800 900
l(nm)
I(a.u.)

Materials 2011, 4
1057
Figure 24. Read-out depth as a function of read-out energy for CsBr:Eu2+
and BaFBr:Eu2+
(data from [78]).
The stimulation energy is only 4 J/mm2 as for CsBr:Ga
+. CsBr:Eu
2+ needle imaging plates have
been introduced for general radiography by Agfa in 2005. More recently, NIP’s became available for
mammography as well [80].
8. The CsBr:Eu2+
PSL Mechanism
CsBr has a primitive cubic lattice in which both atoms have eightfold coordinations. The Br- ions
are positioned on the lattice points at the edges of the cube, while the Cs+ ions fill the cubes’ center.
This structure is shared with CsCl and CsI.
Before discussing the CsBr:Eu2+
PSL mechanism it is necessary to highlight the effect of annealing.
The PSL efficiency can be greatly enhanced by heating vapor deposited CsBr:Eu2+
[81] or the
phosphor powder [81,82]. Hackenschmied reported that a thermal treatment at 190 °C for a few hours
(annealing) increases the PSL output by a factor 9 for CsBr:Eu2+
powder [82]. Annealing for longer
times or at higher temperatures (overannealing) reduces the PSL output again to almost zero. Similar
behavior is observed for vapor deposited CsBr:Eu2+
needles plates. Only weak PSL properties are
observed after production by thermal vapor deposition and a strong enhancement is realized by annealing
in the temperature range of 30–180 °C for a length of time depending on the temperature [81,83]. The
annealing atmosphere plays an important role.
Annealing was performed in different atmospheres at 170 °C for 4 hours [84]. The results, shown in
Figure 25, indicate that the PSL build-up is coupled with the presence of humidity. The presence of O2
is not sufficient and not even required. In moist air or O2, but also in moist N2 and N2 + H2 a stronger
PSL increase is achieved than in dry air. Recently, Appleby et al. confirmed the essential role of water
by demonstrating that the PSL capacity increases in high relative humidity conditions, even at RT [85].
The conformity of the CsBr:Eu2+
stimulation spectrum with the CsBr F-center absorption spectrum
indicates that the mobile electrons produced in X-ray exposure are trapped in Br− vacancies to form
F(Br−) centers [86]. The CsBr F-center absorption band of is at 633 nm at 4 K [87]. Taking into
account the spectral broadening and red-shift in the transition to RT [87] the stimulation spectrum of
CsBr:Eu2+
conforms very well to the F-center absorption band.
0
20
40
60
80
100
0 10 20 30 40 50
Stimulation energy per unit area (J/cm^2)
Read-out
depth (%)

Materials 2011, 4
1058
Figure 25. PSL enhancement following annealing at 170 °C for 4 hours in different
atmospheres [84] (reproduced with permission from Martina Weidner).
There is more discussion on the nature of the hole trap and on the involvement of the Eu2+
activator
and of impurities in the PSL process. Hackenschmied et al. prepared CsBr:Eu2+
crystals in a single step
process having 1 to 5 mol% Eu concentrations. XRD spectra show the formation of additional phases
during annealing that were believed to be CsEuBr3 and Cs4EuBr6 [88,89]. The hypothesis was that at
least one of these second phases plays a role in hole stabilization. It was suggested that a
Eu2+
-O− center within the precipitates acts as hole trap. A later publication claimed that the foreign
phases can be detected in vapor deposited CsBr:Eu2+
by means of electron microscopy and that they are
present even at Eu-concentrations as low as 50–200 ppm [90]. According to the same study, the presence
of the ferroelectric CsEuBr3 Perovskite phase makes CsBr:Eu2+
measurably ferroelectric [90,91]. It was
suggested that the ferromagnetic precipitates stabilize charge separation via their electric field. Thus,
exciton formation becomes less likely, which leads to more efficient charge trapping. An alternative
explanation given is that the interaction of Eu-VacCs centers with the dipole moment of the
precipitations would positively influence PSL efficiency by suppressing the formation of PSL-inactive
trimers. In later studies, however, the observation of additional phases by electron microscopy could
not be repeated [92]. More doubt was cast on the involvement of second phases, when it was
demonstrated that, even in ambient conditions, CsEuBr3 undergoes a fast temporal phase change to
Cs2EuBr5.10H2O which contains Eu3+
rather than Eu2+
. This change makes them PSL inactive [93,94].
It was further demonstrated that the PSL yield is not proportional to the concentration of the
segregated compound and that the XRD spectrum of the foreign phases corresponds to the XRD
spectrum of Cs2EuBr5.10H2O rather than to the XRD spectrum of CsEuBr3 [93].
Weidner studied the luminescence centers in CsBr:Eu2+
NIP’s [84]. She demonstrated that different
Eu2+
based emission centers exist in non-annealed plates. One with a characteristic vibronic low
temperature spectrum is produced by annealing and disappears again upon over-annealing [83]. It was
concluded, therefore, that this is the only PSL relevant center. During annealing centers are destroyed
which exhibit luminescence that is shifted to slightly longer wavelengths but are not PSL-active.
Annealing transforms them into the characteristic ―vibronic‖ centers. The build-up of the luminescence

Materials 2011, 4
1059
of the ―vibronic‖ centers is correlated with the build-up of PSL activity during annealing in humid
atmosphere. Upon overannealing the ―vibronic‖ centers are destroyed and transformed into a third type
of center with a slightly higher energy photoluminescence emission and which is not PSL active. No
information is presented, however, on the nature of the different centers.
The study further demonstrates that the number of PSL-active traps is reduced by overannealing.
After over-annealing, more direct recombination of charge carriers occurs upon X-ray exposure and
more charges are stored in parasitic traps in which trapping is metastable at RT. The overall conclusion
is that overannealing leads to destruction of the PSL-active luminescence centers and that the
formation of PSL relevant trapping centers is less effective. The correlation between humidity during
annealing and PSL build-up leads Weidner to the hypothesis that Eu-H2O or Eu-hydrogen aggregates
could be the origin of the vibronic emission. An alternative suggestion is that aggregates of multiple
Eu-centers are formed, whereby water or hydrogen promotes the diffusion of single Eu2+
ions.
Loncke et al. studied the nature of the luminescence center(s) involved in CsBr:Eu2+
PSL by EPR
and ENDOR [95-99]. Models are presented for the Eu based defects, in the different annealing stages
that explain many features. Non-annealed, annealed and over-annealed vapor deposited CsBr:Eu2+
were studied. Different EPR signals were observed in different stages of the annealing cycle. For
samples annealed in the region between RT and 300°C a signal (Figure 26a) was observed with an
intensity that increased proportionally to the PSL activity (Figure 27). This signal was assumed to be
coupled, therefore, with a defect involved in energy storage and release.
Figure 26. Normalized Q band spectra with magnetic field to the plate (<100> spectrum)
of an annealed Agfa NIP at RT (a) and at 4 K (b) and of a commercial NIP at 4 K (c) [98]
(reproduced with permission from Frank Loncke).

Materials 2011, 4
1060
Figure 27. Intensity of the characteristic EPR signal vs. PSL activity for samples of the
same NIP treated in different ways [98] (reproduced with permission from Frank Loncke).
The signal could not be obtained in CsBr:Eu2+
single crystals. Based on the observation that the
room temperature EPR spectrum of annealed CsBr:Eu2+
needle plates is due to a single paramagnetic
center with S = 7/2 which exhibits a large zero field splitting it is concluded that the defect is Eu2+
centered [96]. The defect has its main tetragonal axis along a crystal <100> direction. The EPR
spectrum made at 4 K (Figure 27b) can be explained by the presence of 2 defects, one with tetragonal
and one with nearly extreme rhombic symmetry [97]. The LT spectrum undergoes drastic changes in
the 30–40 K range. It gradually evolves into the RT spectrum dominated by one type of tetragonal Eu2+
center beyond 40 K. For both defects, all principal axes are again oriented along <100> directions. A
thorough analysis of the EPR spectrum demonstrates that in the 2 defects, Eu2+
is associated with a H-
containing impurity. In both centers the Eu2+
-H interconnection line is found close to a <100>
direction. Moreover, the 1H HF coupling strength suggests that the proton belongs to a H2O ligand of
the Eu2+
ion (Figure 28).
Figure 28. Model for the Eu2+
-H2O couple in CsBr:Eu2+
, consistent with the EPR spectrum
of annealed CsBr:Eu2+
NIP’s [98] (reproduced with permission from Frank Loncke).
Materials 2011, 4
1061
Expressing the ZFS parameters for the three EPR type defects (including the RT variant) in a
common axis system, taking the Eu-OH2 axis as the z axis, reveals striking similarities. It is, therefore,
assumed that they have a common core, differing only in the position of an additional perturbing lattice
defect. The Eu2+
ion and H2O molecule are believed to (approximately) occupy nearest-neighbor Cs+
positions and to exhibit an important relaxation toward one another.
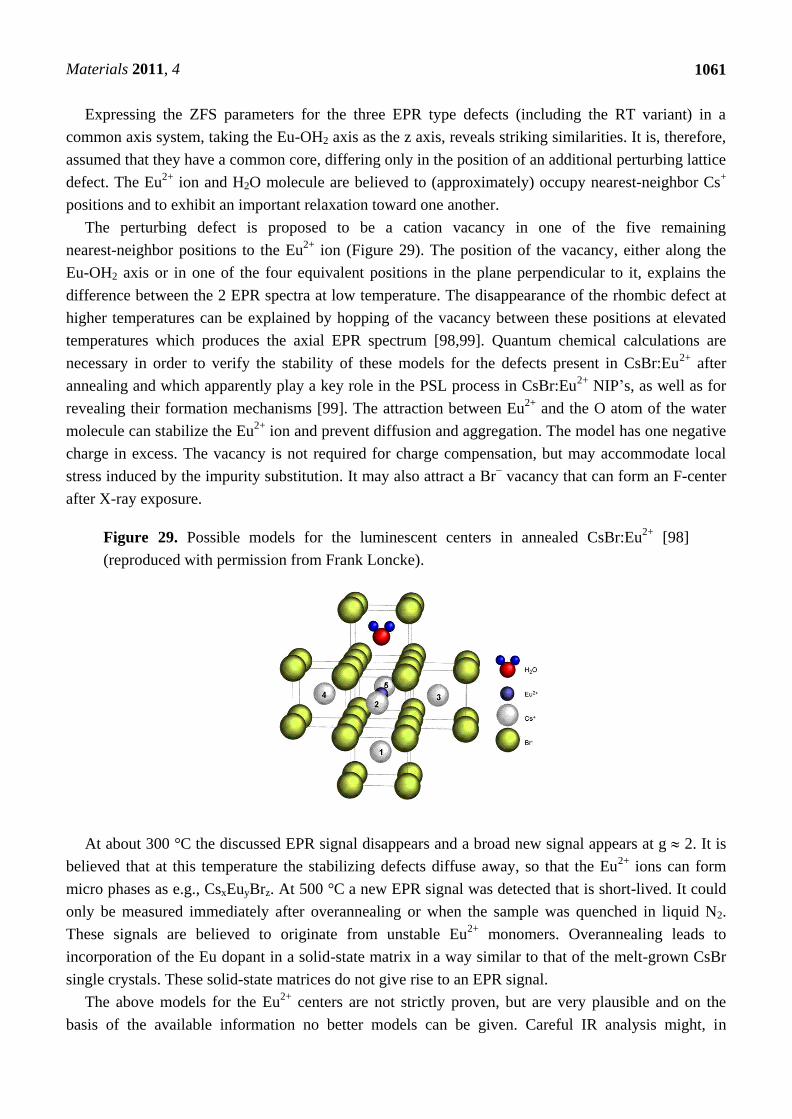
The perturbing defect is proposed to be a cation vacancy in one of the five remaining
nearest-neighbor positions to the Eu2+
ion (Figure 29). The position of the vacancy, either along the
Eu-OH2 axis or in one of the four equivalent positions in the plane perpendicular to it, explains the
difference between the 2 EPR spectra at low temperature. The disappearance of the rhombic defect at
higher temperatures can be explained by hopping of the vacancy between these positions at elevated
temperatures which produces the axial EPR spectrum [98,99]. Quantum chemical calculations are
necessary in order to verify the stability of these models for the defects present in CsBr:Eu2+
after
annealing and which apparently play a key role in the PSL process in CsBr:Eu2+
NIP’s, as well as for
revealing their formation mechanisms [99]. The attraction between Eu2+
and the O atom of the water
molecule can stabilize the Eu2+
ion and prevent diffusion and aggregation. The model has one negative
charge in excess. The vacancy is not required for charge compensation, but may accommodate local
stress induced by the impurity substitution. It may also attract a Br− vacancy that can form an F-center
after X-ray exposure.
Figure 29. Possible models for the luminescent centers in annealed CsBr:Eu2+
[98]
(reproduced with permission from Frank Loncke).
At about 300 °C the discussed EPR signal disappears and a broad new signal appears at g 2. It is
believed that at this temperature the stabilizing defects diffuse away, so that the Eu2+
ions can form
micro phases as e.g., CsxEuyBrz. At 500 °C a new EPR signal was detected that is short-lived. It could
only be measured immediately after overannealing or when the sample was quenched in liquid N2.
These signals are believed to originate from unstable Eu2+
monomers. Overannealing leads to
incorporation of the Eu dopant in a solid-state matrix in a way similar to that of the melt-grown CsBr
single crystals. These solid-state matrices do not give rise to an EPR signal.
The above models for the Eu2+
centers are not strictly proven, but are very plausible and on the
basis of the available information no better models can be given. Careful IR analysis might, in

Materials 2011, 4
1062
principle, help discriminate between OH− and H2O as neighbors to Eu
2+ in the annealed CsBr:Eu
2+
lattice. However, CsBr:Eu2+
very rapidly attracts surface water that is very difficult to remove, even by
heating in vacuum. The surface water IR signal hides the signal of OH− and/or H2O impurities
incorporated in the CsBr crystal. It must also be stressed that it is very unlikely that OH− can substitute
for Cs+ in the CsBr lattice. OH
− would probably replace Br
−, but this substitution would lead to <111>
as main symmetry axis, possibly further lowered by additional perturbations and then leading to
monoclinic or triclinic symmetry.
It is known that incorporation of Eu2+
in alkali halides leads to neighboring cation vacancies [100].
However, based on the assumption that the presence of O2 during annealing is essential for the PSL
enhancement [85], Hesse et al. suggested that not Eu2+
-VCs dipoles are involved in the PSL process,
but that oxygen must play a role [94]. Later it was proposed that the hole trap is a [Eu2+
-O2−
] dipole. In a
subsequent study, CsBr:Eu2+
was annealed in an H2S atmosphere and it was shown that this produced at
least the same PSL increase as annealing in O2 atmosphere [93]. It was claimed that [Eu2+
-S2−
]
dumbbells are created as PSL active sites. Measurements indicated a slightly reduced PSL lifetime for
the sulfur treated materials compared to the oxygen treated ones indicating a spatial correlation
between the sulfur ion and the Eu2+
ion. The dumbbells or dipoles exhibit strong dipole moments and
are claimed to be responsible for better charge separation of the electron/hole pairs after X-ray
exposure. The improved PSL activity after annealing is explained by the fact that annealing increases
the number of [Eu2+
-O2−
] (or [Eu2+
-S2−
]) dipoles. O2−
(or S2−
) also charge compensates for Eu2+
in the
CsBr lattice. When it was later realized that the presence of water, and not oxygen, is essential in the
annealing process, two different explanations for its role were given. One is that H2O may be an even
better source for the creation of [Eu2+
-O2−
] dipoles than O2 as a result of the following reactions during
annealing [85]:
2CsBr EuO
2Cs OH CsBr 2
22
22
OCsEuBr
HBrO (6)
In addition, the hypothesis was presented that water is incorporated in the CsBr lattice, to the extent
that up to one molecule of H2O is absorbed per unit cell [85]. The H2O molecules are oriented by the
[Eu2+
-O2−
] dipoles. This enhances the electric field around the dipoles, and, as a consequence, the
charge trapping efficiency.
The fact that H2S annealing has a similar effect as annealing in (humid) air and that S is
incorporated in the vicinity of Eu2+
as asserted by Hesse et al. [93], is also consistent with the
luminescent center model, proposed by Loncke et al. [98], in which H2S may replace H2O. It must be
remarked that H2S is rather an analogue of H2O than of O2. The [Eu2+
-O2−
] dipoles proposed by
Hesse et al. [93] have both ions placed on neighboring cation/anion positions (Figure 30). This results
in a <111> oriented dipole. The orientation of the defect center coupled with the CsBr:Eu2+
PSL
activity according to the study by Loncke [97] is oriented along the <100> direction. The [Eu2+
-O2−
]
dipole model is not consistent with the annealed CsBr:Eu2+
EPR and ENDOR results.

Materials 2011, 4
1063
Figure 30. [Eu2+
-O2−
] dipole orientation in the CsBr lattice [98] (reproduced with
permission from Frank Loncke).
9. Image Quality of CR Systems
In order explain image quality in terms of phosphor plate quality a mathematical model is derived
containing parameters that can be correlated with phosphor plate physical characteristics. It should be
pointed out, however, that the ultimate test of image quality in medical imaging is diagnostic accuracy.
Therefore, reference is made to results of clinical studies in Paragraph 9.4.
9.1. Definition of Medical Radiography System’s Image Quality
9.1.1. Signal-to-Noise Ratio (SNR)
The X-ray quanta used as image carriers in radiography can be considered as independent random
events in time and space. Therefore, the number of quanta per unit area and time fluctuates according
to Poisson statistics. When making a flat-field image (without any object on the detector) the number
of quanta incident per unit area has a mean (signal), and a variance (noise). Poisson statistics allows
calculation of SNR based on the photon fluence. The mean number of incident quanta equals the
fluence, while the variance is the square root of the fluence. Hence, SNR2 is equal to the fluence or the
average number of quanta incident on the detector. This is the highest value of image SNR2 that can be
reached with this number of quanta by any X-ray imaging system.
9.1.2. Detective Quantum Efficiency (DQE)
Since the incoming SNR is proportional to the square root of the dose and since the dose to which a
patient is exposed should be as low as possible, the best radiography system is the one that degrades
incoming SNR the least, i.e., the system that has the highest SNRout for a given SNRin. In this sense,
detective quantum efficiency (DQE), defined as:
22 / inout SNRSNRDQE (7)

Materials 2011, 4
1064
Expresses how effectively a system captures the information content of an X-ray image. DQE is
between 0 and 100% and is widely used in scientific, regulatory and commercial communities as a
fundamental measure of an X-ray imaging system’s performance.
9.1.3. Noise Sources
CR systems, as all radiography systems, have a number of noise sources that degrade DQE. Only
incoming photons that interact with the active layer of the detector produce signal and contribute to the
noise. If the storage phosphor layer’s absorption equals , SNR2 is reduced to Q, where Q is the
quantum fluence. In medical radiography this is often the most important reason for image quality
degradation. CR plates can have absorptions as low as 25–30% depending on plate type and X-ray
spectrum. By this, the DQE is reduced to maximum 25% to 30%.
Apart from quantum noise, resulting from the finite number of quanta per unit area interacting with
the plate, there are a number of other noise sources.
Electronic noise is produced by the electronic components in an imaging system. Examples in CR
are fluctuation of the scanning laser output and fluctuation of signal amplification in the PMT. The IP
does not contribute to this type of noise and electronic noise in a CR system should be at a very low
level and should not play a role at the medical doses. It has been illustrated, however, that in the line
scan digitizer with CCD detector, DX-S
, a minor contribution of electronic noise is present. For
flying spot digitizers, it can further be disregarded.
Secondary quantum noise or amplification noise is related to the conversion process from X-ray
quanta to photo-electrons in the PMT or CCD of the scanner. The light photons produced in the PSL
process can also be considered as random events, following Poisson statistics and will add noise. The
higher the gain of the CR system, i.e., the higher the number of photo-electrons in the scanner detector
per absorbed X-ray quantum in the CR plate, the less secondary quantum noise will be prominent.
System gain must be higher than 5 to limit the impact of secondary quantum noise. Even then it will
affect small detail visibility.
So-called Poisson excess noise is the collection of a number of noise contributions. One origin is the
fact that different layers in the detector have different contributions to the final image. Due to the
turbid character of the IP, the intensity of the stimulation light diminishes with the depth in the
phosphor layer. In addition, emission photons from the deeper layer have lower probability to reach the
detector. A more transparent phosphor layer will lead to a smaller contribution of this noise type.
Poisson excess noise has also an X-ray component. The X-ray spectrum is not monochromatic and the
K-photons produced in the interaction with the phosphor crystals have a certain probability of escape
from the IP, also depending on the location of the interaction in the phosphor layer. As a result, the
energy deposited by an absorbed X-ray quantum varies, which again adds noise.
Fixed pattern noise or screen-structure noise is very much related to IP quality. The IP light
scattering behavior varies slightly from pixel to pixel due to internal structures in the phosphor layer
and in substrate and top-coat. As a result, the direction in which the laser beam is deflected in the
scanning process varies slightly as well as the size of the halo produced in the phosphor layer. It is
clear that substrate and top-coat should have as little structure as possible in order to keep
screen-structure noise minimal. Since screen-structure noise is proportional to the X-ray dose whereas

Materials 2011, 4
1065
quantum noise is proportional to the square-root of the dose, screen-structure noise increases in
importance with increasing dose level. Therefore, it has a larger contribution in mammography where
higher doses are used than in general radiography.
9.1.4. Noise as a Function of Spatial Frequency
Variance is a poor measure of noise in a medical image. It does not account for the spatial
distribution of the noise.
Different noise types have different spatial distributions. Quantum noise is white noise, meaning
that the noise power is identical for all spatial frequencies. Screen-structure noise, on the other hand,
can have almost any distribution sometimes with maxima at specific spatial frequencies related to
periodic structures in the IP originating from the coating process. For that reason, it is important to use
the noise power spectrum or Wiener spectrum (W) that represents the variance of the signal, but
distributed as a function of spatial frequency, . Noise in an image has contributions of all spatial
frequencies and the Wiener spectrum, W, gives the amplitude of each of these contributions (Figure 31).
It shows at which frequencies variations are strong and at which frequencies variations are weak.
Spatial frequency is a measure of how often sinusoidal components (obtained by Fourier transform) of
an image signal repeat per unit of distance. A unit of spatial frequency is cycles per millimeter. In
radiography, the unit of line pairs per millimeter (l p/mm) is incorrectly used, where cycles per
millimeter is meant (strictly, l p/mm relates to a square wave and not to a sinusoidal wave).
Figure 31. Schematic representation of Wiener spectrum concept.
9.1.5. Resolution and Modulation Transfer Function (MTF)
The function of a radiography system is to translate the modulations of the X-ray beam transmitted
by the patient into a visible image and to reproduce them faithfully to clearly visualize the details of
body parts. However, any radiography system not only degrades image quality by introducing extra
noise. It also reduces the modulations, thereby blurring the image. The laser beam used to scan the
image in medical CR, generally, has a diameter between 50 and 100 μ. In the phosphor layer a halo is

Materials 2011, 4
1066
produced which may become several hundred micrometers wide. It is clear that this will cause a
significant reduction in signal height for image details smaller than the laser halo in the phosphor layer.
The reduction of the modulation is expressed by the modulation transfer system (MTF). The MTF is
the ratio of the modulation of a sinusoidal signal leaving to that entering an imaging device and
decreases with increasing spatial frequency (Figure 32).
Figure 32. Schematic representation of the MTF concept.
Unsharpness will reduce both the useful signal amplitude as the noise amplitude. The signal
amplitude will be more affected, however, because the signal is blurred in every step of the imaging
chain, while noise introduced in a certain step is blurred only by the subsequent steps and not by the
previous ones. Hence, only X-ray quantum noise is reduced to the same extent as the signal by the
system MTF, because it is present from the first stage in the imaging chain. All other noise
components are reduced to a lesser extent. Therefore, unsharpness degrades the DQE, especially at
higher spatial frequencies.
9.1.6. DQE as a Function of Spatial Frequency
Since signal and noise vary as a function of spatial frequency, DQE is spatial frequency,
, dependant:
( ) ( ) ( )22/ inout SNRSNRDQE (8)
A CR system is not isotropic and leads to differences in noise and MTF between fast- and
slow-scan directions. This makes DQE vary differently in these 2 fundament directions. It must be
expressed as a functional of the spatial frequencies in those 2 directions, u and v:
( ) ( ) ( )22,/,, inout uSNRuSNRuDQE (9)

Materials 2011, 4
1067
The signal produced by the CR system is reduced by the MTF. Replacing SNR(u,)in2 by Q, this
leads to:
( )( )( )
,
,,
22
uWQ
uMTFSuDQE
out
(10)
A CR system is a linear detector with zero intercept. Standard procedure for such a system is to
determine the relation between the output signal and the exposure in number of quanta per unit area:
QcS (11)
This relationship gives the following DQE equation:
( )( )
( )
,
,,
22
uW
uMTFQcuDQE
out
(12)
The IEC standard expression is:
( )( )
,
,2
uW
uMTFQDQE
out
(13)
where it must be understood that W is obtained from images that have been linearized to quanta per
unit area at detector input.
As a conclusion, DQE measurement implies measurement of MTF(u,) and noise power spectrum,
Wout(u,), and of the number of X-ray quanta incident on the detector per unit area, Q.
In practice, the following relation is used to determine the quantum fluency:
2
ina SNRKQ (14)
where Ka is the air kerma, measured with an ionization chamber and the SNR2 values are tabulated for
well-defined exposure conditions [101].
9.2. Measurement of Image Quality
9.2.1. Measurement of MTF
Since MTF represents the reduction of the modulation of a sinusoidal signal by the imaging system,
the easiest way to measure it is to expose the detector trough a phantom with sinusoidal absorption
variation. Manufacturing of such a phantom is, however, not practical. The standard way of measuring
MTF is, therefore, by analyzing an edge image.
All lines of the edge image, perpendicular to the edge are scanned and averaged with leveling due to
zero intensity. Thus, the edge spread function or edge profile function is obtained. The distances in
pixels are corrected depending on the angle of edge slope. The edge should be sloped for smooth
averaging. Next the first derivative from edge spread function is taken. The result is the line spread
function. By applying discrete Fourier transform to the line spread function the MTF is obtained [102].
The procedure is schematically shown in Figure 33.

Materials 2011, 4
1068
Figure 33. Schematic presentation of MTF measurement with edge phantom.
9.2.2. Measurement of W
For the measurement of W several homogeneously exposed images or flat-field images are
recorded. The images are converted to obtain pixel values proportional to the exposed number of
quanta (9.1.6). A 2-dimensional 2nd order polynomial is fitted to the image and this function is used
for de-trending of the low frequency profile due to exposure inhomogeneity (Heel effect). The central
part of the image is divided in overlapping areas of 256 pixels by 256 pixels wide and in each
sub-image the Wiener spectrum is calculated [101,103,104]. W(u,) is obtained by averaging the
samples of all the spectra of the sub-images. A minimum number of independent pixels must be used
to guarantee good experimental accuracy. The conversion of the 2D Wiener spectrum to 1D Wiener
spectra in both fundamental orientations is in the IEC62220-1 [101] defined in a region of
14 rows/columns around both axes.
9.2.3. Measurement of Air Kerma and Translation to Number of Quanta
Kerma originates from the acronym, KERMA, for Kinetic Energy Released per unit Mass (of air).
Air Kerma is a measure of the amount of radiation energy, in Joules (J), absorbed in a unit mass (kg)
of air. Therefore, it is expressed in the units of J/kg or Gray (G). It is measured with an ionization
chamber. Since the ionization produced in air by radiation is proportional to the energy released,
ionization chambers can be used to measure exposure: a conversion factor, , can be used to convert
air kerma to exposure values. The conversion factor can be obtained from X-ray spectral
modelling [101]:
dEEn
dEEfEn
)(
)()( (15)
where n(E) is the relative number of quanta in an X-ray spectrum of energy E and f(E) is the number
of quanta per area per Air Kerma at energy E. Since different models can lead to different results, the

Materials 2011, 4
1069
IEC standard defined the conversion factor. An ―official‖ DQE is measured under standard conditions,
whereby use is made of the defined conversion factor. For example, a standard general radiography
exposure condition is RQA 5, for which a general radiography source is used with 21 mm thick
external Al filtering. The X-ray spectrum should have an Al half-value layer of 7.1 mm and leads to a
conversion factor of 30.17 quanta/(mm2.nGy).
9.3. Relation between Imaging Plate Characteristics and Image Quality (DQE)
9.3.1. Simple DQE Model
A simplified model is derived that allows qualitative explanation of the relation between DQE and
the physical characteristics of the CR IP.
As explained, quantum noise in CR images is partly X-ray quantum noise and partly amplification
noise. An IP with absorption , leads to an amount of X-ray quantum noise equal to:
QNQ (16)
This noise contribution is reduced by the CR system MTF and amplified with the gain of the
system. Quantum noise is multiplied by the ―Poisson excess‖ factor, (1 + )1/2
[105,106], which
represents the effect of the depth-dependence of the gain factor. According to this approach quantum
noise on signal level is equal to:
( ) ( ) ( ) MTFGQNQ 1 (17)
Amplification noise, due to fluctuation of the number of photo-electron per absorbed X-ray
quantum, is, based on Poisson statistics, equal to:
( ) GQN A (18)
Since screen-structure noise can, in principle, have any frequency dependence, and since its
contribution is proportional to the dose, a general expression for this noise is:
( ) ( ) ssSS WQN 22 (19)
Based on Equations (17–19), total image noise power is:
( ) ( ) ( ) ssssAQT WQMTFGGQNNNN 222222]11[ (20)
This leads to the following expression for SNRout2:
( )
( ) ( )( )
ssout WQ
MTFG
MTFQSNR
112
2
2
(21)

Materials 2011, 4
1070
Or
( )( )( )22
2
11
MTFG
WQ
MTFG
QSNR
ssout
(22)
SNRin2 being Q, the following DQE formula is obtained:
( )( )
( )22
11
MTFG
WQ
MTFG
DQEss
(23)
9.3.2. Relation between DQE and IP Characteristics
DQE is proportional to X-ray absorption, (Equation (23)). In commercial CR IP’s high absorption
is achieved by using high density materials having a K-edge at suitable X-ray energy. The use of high
phosphor layer thickness or coating weight also contributes. There are limitations to the useful
thickness, however. The intensity of the laser light used to scan the IP diminishes with depth. It does
not penetrate indefinitely in the phosphor layer. A powder phosphor layer scatters the light
isotropically and has a maximum useful thickness of 250 to 300 μ. F-centers produced in deeper layers
are not reached by stimulation light and light emitted by deeper layers would not reach the scanner
light detector. For general radiography, this limits the useful X-ray absorption to about 30%. In the
NIP phosphor layer stimulation and emission light is preferentially scattered in forward direction.
Light travels through the phosphor layer over much larger distances in this direction. As a result, the
Genrad NIP phosphor layer can be twice as thick as the PIP phosphor layer. In addition, the needles
are grown on a substrate without the need for a binder. The phosphor volume content of the active
layer is about 90% vs. only about 70% in a powder screen. Both factors together allow the use of
Genrad NIP’s with more than twice the X-ray absorption of Genrad PIP’s. Equation (23) demonstrates
that this, in itself, is sufficient to double DQE.
Screen-structure noise is the only noise component in Equation (23) that increases with increasing
dose. In the general radiography dose range its impact on DQE is small if a decent IP is used. For the
higher doses used in mammography screen-structure noise has a measurable impact on DQE. In many
NDT applications screen-structure noise is the most important noise source. Exposures are used for
which SNR saturates. The saturation level is determined by the degree of screen-structure noise
(Equation (22)). For PIP, screen-structure noise, generally, diminishes with decreasing phosphor
particle size. The quality of the lacquer coating and drying processes obviously are important as well.
The NIP PVD production process leads to more homogeneous layers than the powder phosphor
coating process. As a result, NIP images have less screen-structure noise, which is a more important
benefit for mammography.
When screen-structure noise is disregarded, a simplified DQE equation results:
( )2
11
MTFG
DQE
(24)
Materials 2011, 4
1071
To assess the impact of gain, G and MTF, the product G.MTF2 in Equation (24) should be as high
as possible in order to maximize DQE. However, modifications in IP build-up that improve MTF
generally reduce G and vice versa. They can be used to tune the IP for a specific application but hardly
affect the overall quality level. To clearly visualize large details with small contrast it is better to have
a higher gain. By this, DQE will be higher at low spatial frequencies, but it will suffer at high spatial
frequencies, because MTF will be reduced. For better visibility of small details it is best to go for a
higher MTF at the cost of G. The lower gain will lead to more back-ground noise.
Storage phosphors continue to emit light for a short time after stimulation is stopped. The
luminescence decay time depends on the phosphor activator. The light collected from the current
position of the laser is mixed with the remaining emission from previous laser positions. This causes a
loss of resolution in the fast-scan direction when the laser dwell time per pixel approaches the
luminescence decay time. Since both commercial phosphors, BaFX:Eu2+
and CsBr:Eu2+
, have Eu2+
as
activator, the influence of this phenomenon depends on the read-out pixel time and not on the quality
or type of storage phosphor. The main factor limiting spatial resolution in CR is scattering of the
stimulation light in the turbid phosphor layer.
1. The diameter of the laser beam halo increases with the depth in the layer. Hence, spatial
resolution and MTF in CR decrease with increasing phosphor layer thickness.
2. Another factor of influence is the color of the substrate on which the phosphor layer is coated.
The more the substrate absorbs the stimulation light, the higher MTF will be, because reflected
stimulation light will diffuse further in the lateral direction, thereby increasing the size of the
stimulating halo.
3. Resolution can be improved by mixing anti-halo dye or pigment in the phosphor layer or
top-coat. This, obviously, limits lateral light diffusion.
4. The shorter the distance between two light scattering events, i.e., the shorter the mean free path
of the photons in the phosphor layer, the shorter will be the distance over which light can travel
before being absorbed. This explains why the resolution offered by PIP improves with
decreasing phosphor particle size and in NIP with decreasing needle diameter.
All described parameters have an impact on sharpness (MTF) in a similar way in PIP and NIP.
Since the needles tend to keep the stimulation light inside, travelling parallel to their axis the diameter
of the laser beam halo in the phosphor layer is strongly reduced. For equal phosphor layer thickness,
the halo will be much smaller in NIP than in PIP. As indicated, phosphor layer modifications that
improve MTF always have a negative effect on system gain, G. A reduction of the laser beam halo by
using a thinner phosphor layer, by using an absorbing substrate, by using anti-halo dye in phosphor
layer or top-coat or by using finer phosphor particles or thinner needles leads to stimulation of less
F-centers and less PSL emission and, therefore, to a lower number of photo-electrons in the scanner
PMT per absorbed X-ray quantum. The higher transparency of the needle layer leads to a higher
escape efficiency of the stimulated emission in NIP, and, as a consequence, to a higher gain in the
same scanner. General radiography NIP’s have been combined with a line-scanner (Agfa, DX-S
) with
a relatively low light collection efficiency. This compensates for the higher G.MTF2 product to which
NIP’s might give rise. Hence, in a line-scanner, DQE for NIP is not further improved beyond the factor
of 2, resulting from the higher X-ray absorption, above PIP + flying-spot scanner level. Since 2010 a
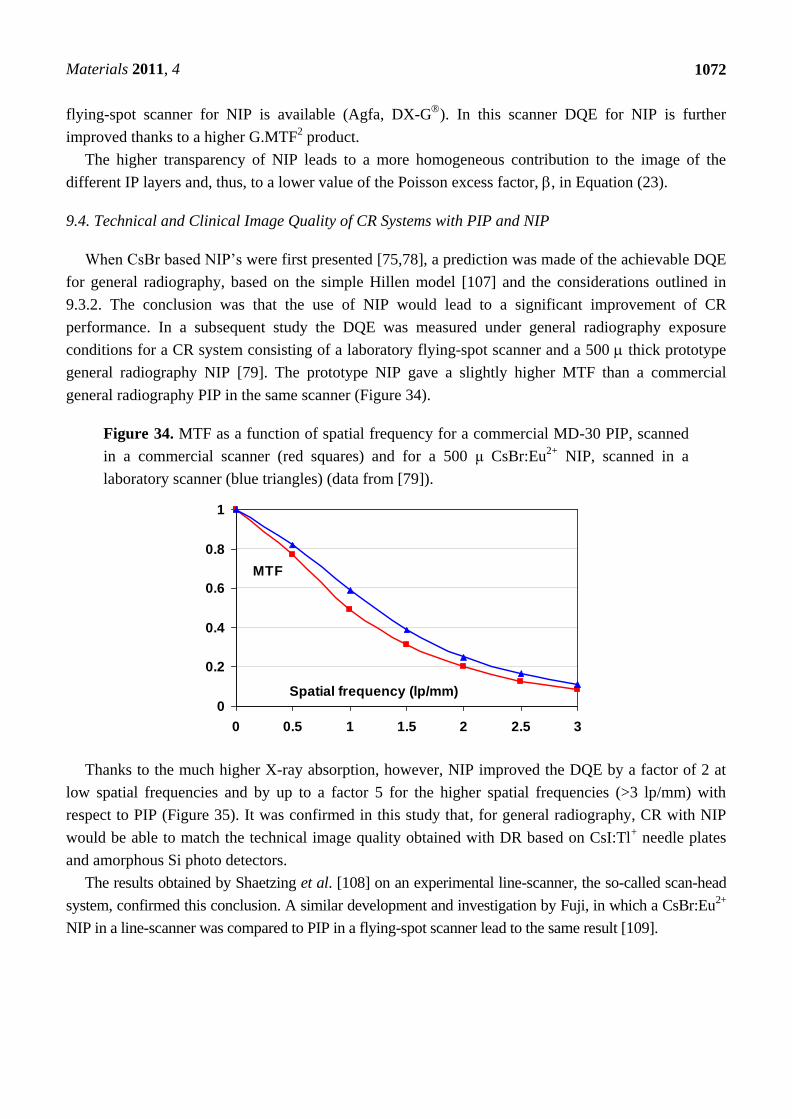
Materials 2011, 4
1072
flying-spot scanner for NIP is available (Agfa, DX-G
). In this scanner DQE for NIP is further
improved thanks to a higher G.MTF2 product.
The higher transparency of NIP leads to a more homogeneous contribution to the image of the
different IP layers and, thus, to a lower value of the Poisson excess factor, , in Equation (23).
9.4. Technical and Clinical Image Quality of CR Systems with PIP and NIP
When CsBr based NIP’s were first presented [75,78], a prediction was made of the achievable DQE
for general radiography, based on the simple Hillen model [107] and the considerations outlined in
9.3.2. The conclusion was that the use of NIP would lead to a significant improvement of CR
performance. In a subsequent study the DQE was measured under general radiography exposure
conditions for a CR system consisting of a laboratory flying-spot scanner and a 500 thick prototype
general radiography NIP [79]. The prototype NIP gave a slightly higher MTF than a commercial
general radiography PIP in the same scanner (Figure 34).
Figure 34. MTF as a function of spatial frequency for a commercial MD-30 PIP, scanned
in a commercial scanner (red squares) and for a 500 μ CsBr:Eu2+
NIP, scanned in a
laboratory scanner (blue triangles) (data from [79]).
Thanks to the much higher X-ray absorption, however, NIP improved the DQE by a factor of 2 at
low spatial frequencies and by up to a factor 5 for the higher spatial frequencies (>3 lp/mm) with
respect to PIP (Figure 35). It was confirmed in this study that, for general radiography, CR with NIP
would be able to match the technical image quality obtained with DR based on CsI:Tl+ needle plates
and amorphous Si photo detectors.
The results obtained by Shaetzing et al. [108] on an experimental line-scanner, the so-called scan-head
system, confirmed this conclusion. A similar development and investigation by Fuji, in which a CsBr:Eu2+
NIP in a line-scanner was compared to PIP in a flying-spot scanner lead to the same result [109].
0
0.2
0.4
0.6
0.8
1
0 0.5 1 1.5 2 2.5 3
Spatial frequency (lp/mm)
MTF

Materials 2011, 4
1073
Figure 35. DQE as a function of spatial frequency for state-of-the art CR with PIP (red
squares), for a 500 μ CsBr:Eu2+
NIP, scanned in a laboratory scanner (blue triangles) and
for DR with CsI:Tl (green diamonds) (data from [79]).
The first commercial CsBr:Eu2+
NIP system, DX-S
, was introduced by Agfa in 2005. It is a
general radiography system in which the plate is scanned with a line-scanner of the scan-head type
(Figure 22). Willems et al. demonstrated that the system does not make use of the full potential of
NIP [110]. In DX-S
the light emitted by the IP is guided to a CCD array for conversion in electrical
signals. The CCD detector has a high conversion efficiency of the order of 65%. However, the
numerical aperture of the lens system that projects the light emitted by the IP on the CCD is very low.
It is less than 10%, which is much lower than the transmission of the light guides used in flying-spot
scanners. This has a negative impact on the system gain, G, and on the DQE especially at higher
spatial frequencies (Equation 24). Nevertheless, the DQE of DX-S
is close to two times higher than
the DQE of a PIP based CR system in the spatial frequency range from 0 to 5 lp/mm (Figure 36),
which implies that, theoretically, similar image quality is obtained at only half the X-ray dose.
Figure 36. Ratio of NIP system-to-PIP system DQE (data from [93]).
A thorough analysis was done of the improvement in technical image quality of DX-S
with NIP
with respect to a PIP based CR system [111]. The conclusion was that the higher DQE of DX-S
is not
0
0.1
0.2
0.3
0.4
0.5
0.6
0.7
0 0.5 1 1.5 2 2.5 3
Spatial frequency (lp/mm)
DQE
0
0.5
1
1.5
2
2.5
0 1 2 3 4 5
Spatial frequency (lp/mm)
DQE ratio
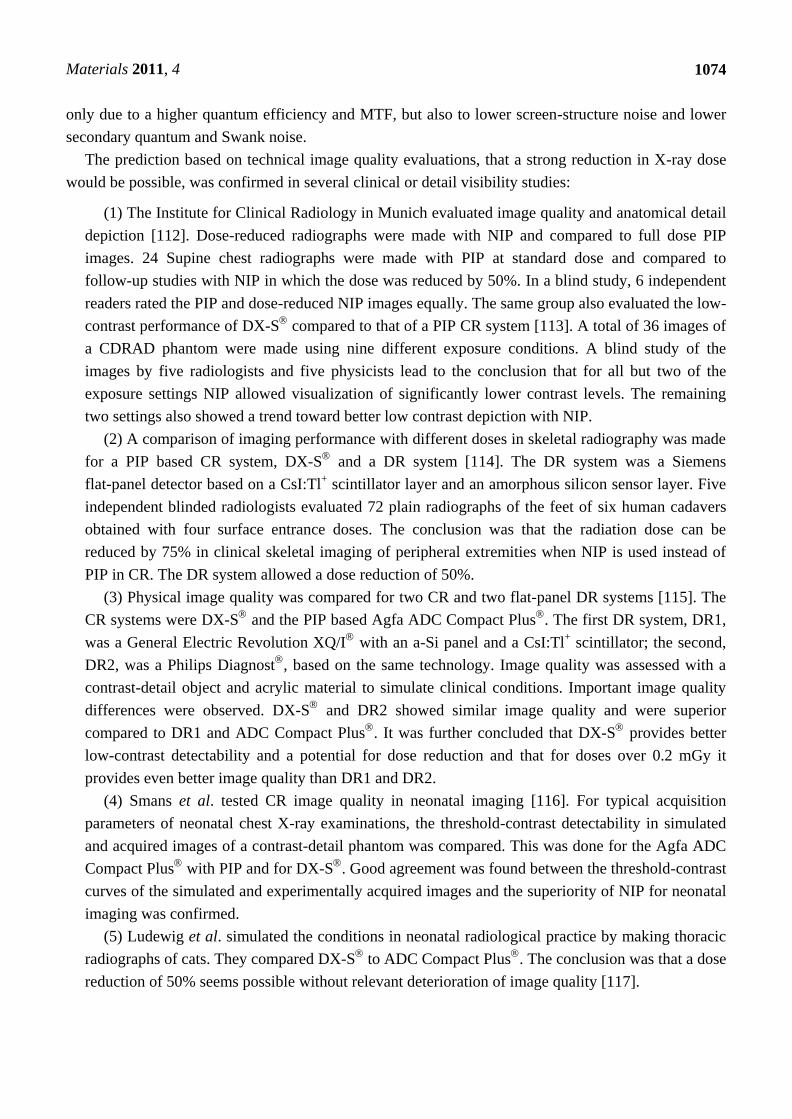
Materials 2011, 4
1074
only due to a higher quantum efficiency and MTF, but also to lower screen-structure noise and lower
secondary quantum and Swank noise.
The prediction based on technical image quality evaluations, that a strong reduction in X-ray dose
would be possible, was confirmed in several clinical or detail visibility studies:
(1) The Institute for Clinical Radiology in Munich evaluated image quality and anatomical detail
depiction [112]. Dose-reduced radiographs were made with NIP and compared to full dose PIP
images. 24 Supine chest radiographs were made with PIP at standard dose and compared to
follow-up studies with NIP in which the dose was reduced by 50%. In a blind study, 6 independent
readers rated the PIP and dose-reduced NIP images equally. The same group also evaluated the low-
contrast performance of DX-S
compared to that of a PIP CR system [113]. A total of 36 images of
a CDRAD phantom were made using nine different exposure conditions. A blind study of the
images by five radiologists and five physicists lead to the conclusion that for all but two of the
exposure settings NIP allowed visualization of significantly lower contrast levels. The remaining
two settings also showed a trend toward better low contrast depiction with NIP.
(2) A comparison of imaging performance with different doses in skeletal radiography was made
for a PIP based CR system, DX-S
and a DR system [114]. The DR system was a Siemens
flat-panel detector based on a CsI:Tl+ scintillator layer and an amorphous silicon sensor layer. Five
independent blinded radiologists evaluated 72 plain radiographs of the feet of six human cadavers
obtained with four surface entrance doses. The conclusion was that the radiation dose can be
reduced by 75% in clinical skeletal imaging of peripheral extremities when NIP is used instead of
PIP in CR. The DR system allowed a dose reduction of 50%.
(3) Physical image quality was compared for two CR and two flat-panel DR systems [115]. The
CR systems were DX-S
and the PIP based Agfa ADC Compact Plus
. The first DR system, DR1,
was a General Electric Revolution XQ/I
with an a-Si panel and a CsI:Tl+ scintillator; the second,
DR2, was a Philips Diagnost
, based on the same technology. Image quality was assessed with a
contrast-detail object and acrylic material to simulate clinical conditions. Important image quality
differences were observed. DX-S
and DR2 showed similar image quality and were superior
compared to DR1 and ADC Compact Plus
. It was further concluded that DX-S
provides better
low-contrast detectability and a potential for dose reduction and that for doses over 0.2 mGy it
provides even better image quality than DR1 and DR2.
(4) Smans et al. tested CR image quality in neonatal imaging [116]. For typical acquisition
parameters of neonatal chest X-ray examinations, the threshold-contrast detectability in simulated
and acquired images of a contrast-detail phantom was compared. This was done for the Agfa ADC
Compact Plus
with PIP and for DX-S
. Good agreement was found between the threshold-contrast
curves of the simulated and experimentally acquired images and the superiority of NIP for neonatal
imaging was confirmed.
(5) Ludewig et al. simulated the conditions in neonatal radiological practice by making thoracic
radiographs of cats. They compared DX-S
to ADC Compact Plus
. The conclusion was that a dose
reduction of 50% seems possible without relevant deterioration of image quality [117].
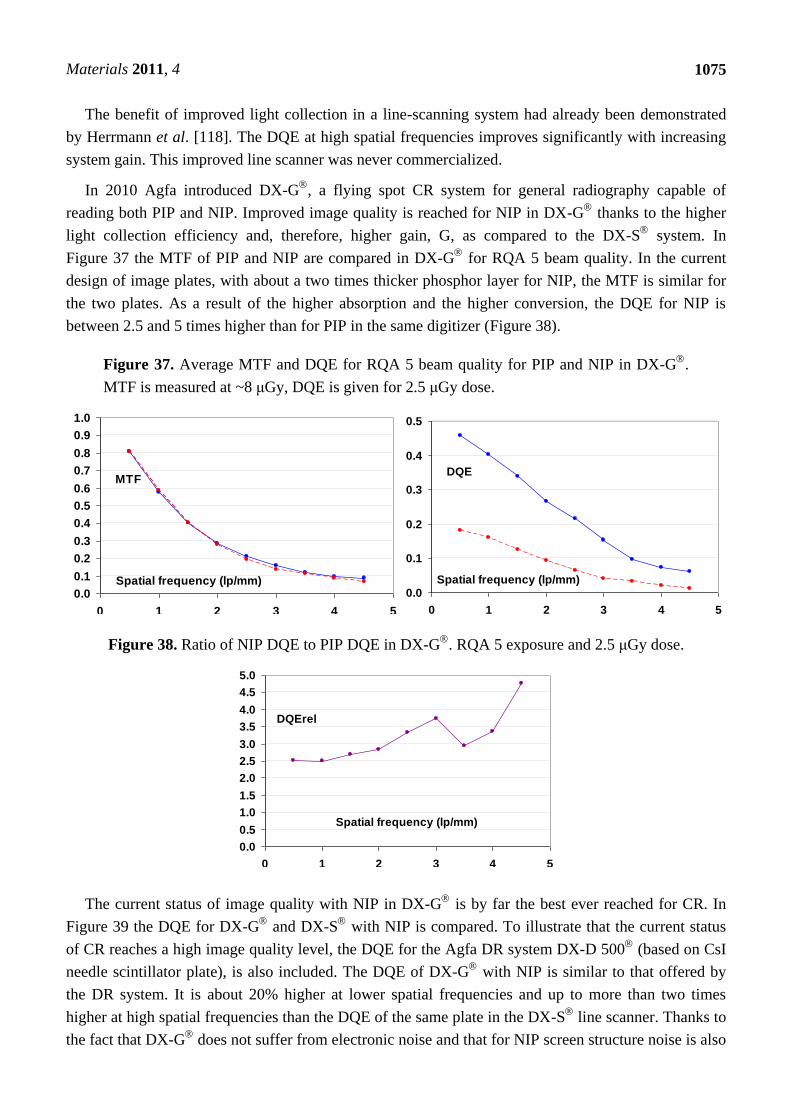
Materials 2011, 4
1075
The benefit of improved light collection in a line-scanning system had already been demonstrated
by Herrmann et al. [118]. The DQE at high spatial frequencies improves significantly with increasing
system gain. This improved line scanner was never commercialized.
In 2010 Agfa introduced DX-G
, a flying spot CR system for general radiography capable of
reading both PIP and NIP. Improved image quality is reached for NIP in DX-G
thanks to the higher
light collection efficiency and, therefore, higher gain, G, as compared to the DX-S
system. In
Figure 37 the MTF of PIP and NIP are compared in DX-G
for RQA 5 beam quality. In the current
design of image plates, with about a two times thicker phosphor layer for NIP, the MTF is similar for
the two plates. As a result of the higher absorption and the higher conversion, the DQE for NIP is
between 2.5 and 5 times higher than for PIP in the same digitizer (Figure 38).
Figure 37. Average MTF and DQE for RQA 5 beam quality for PIP and NIP in DX-G
.
MTF is measured at ~8 μGy, DQE is given for 2.5 μGy dose.
Figure 38. Ratio of NIP DQE to PIP DQE in DX-G
. RQA 5 exposure and 2.5 μGy dose.
The current status of image quality with NIP in DX-G
is by far the best ever reached for CR. In
Figure 39 the DQE for DX-G
and DX-S
with NIP is compared. To illustrate that the current status
of CR reaches a high image quality level, the DQE for the Agfa DR system DX-D 500
(based on CsI
needle scintillator plate), is also included. The DQE of DX-G
with NIP is similar to that offered by
the DR system. It is about 20% higher at lower spatial frequencies and up to more than two times
higher at high spatial frequencies than the DQE of the same plate in the DX-S
line scanner. Thanks to
the fact that DX-G
does not suffer from electronic noise and that for NIP screen structure noise is also
0.0
0.1
0.2
0.3
0.4
0.5
0.6
0.7
0.8
0.9
1.0
0 1 2 3 4 5
Spatial frequency (lp/mm)
MTF
0.0
0.1
0.2
0.3
0.4
0.5
0 1 2 3 4 5
Spatial frequency (lp/mm)
DQE
0.0
0.5
1.0
1.5
2.0
2.5
3.0
3.5
4.0
4.5
5.0
0 1 2 3 4 5
Spatial frequency (lp/mm)
DQErel

Materials 2011, 4
1076
very limited, the DQE for the DX-G
+ NIP system is quasi dose independent. This makes the DX-G
especially fit for low dose applications. DR systems have a high contribution of electronic noise which
deteriorates the DQE at low dose. At low dose, the DX-G
+ NIP system prevails even over
DR systems.
Figure 39. DQE of DX-S
with NIP (--•--) of DX-G
with NIP (•) and of DX-D 500
(▲) for 2.5 Gy exposure under RQA 5 (a) and RQA 3 (b) exposure conditions.
For RQA 3 beam quality, which typically represents extremity applications and the more critical
paediatric applications, the DQE of DX-G
with NIP significantly exceeds that of the best DR systems
(Figure 39b). Advantageous for the DX-G
+ NIP system are the higher X-ray absorption, higher
system gain and no electronic noise contributions. DR systems have an easier workflow in the hospital
and are known for their good image quality and are therefore strongly appreciated. Although the
workflow for CR is somewhat more demanding for the operators, the better image quality or lower
patient dose for the same image quality in some applications makes the new generation of CR systems
highly competitive and to some extend complementary to DR systems.
In 2010 Agfa introduced DX-M
, a CR system suitable for general radiography and mammography,
based on a flying-spot scanner and capable of reading both PIP and NIP. For mammography, technical
image quality parameters as MTF and DQE, were measured for both plate types and simulated using a
linear system approach [80]. DQE was 30% higher for NIP at low spatial frequencies and 50% higher
at 5 lp/mm (Figure 40). The MTF is only slightly higher and contributes only marginally to the better
image quality. Since with the low-energy mammography spectrum, X-ray absorption is high for both
PIP and NIP, there is not an important difference in X-ray quantum noise. The benefit of NIP for
mammo results from the higher transparency of the phosphor layer, allows higher read-out depths and
PSL escape efficiencies and, therefore, a higher system gain. The lower degree of screen-structure
noise also contributes. The expectation is that the mammo NIP will make a reduction in X-ray dose of
30 to 50% possible.
An investigation by Peloschek et al. [119] leads to the conclusion that the needle-based CR system
(DX-M
digitizer with CR HM 5.0
NIP detector) operates at a dose that is 40% higher than that of
existing DR systems (GE Essential
, Hologic-Dimensions
, Siemens-Inspiration
). However, in
comparison to CR systems with PIP the dose is 25 to 40% lower; and the system shows a significant
dose reduction for the screening-relevant population (50 years and older) compared to the previously
used screen-film system (Kodak MIN-R
).
(a)
0
0.1
0.2
0.3
0.4
0.5
0 1 2 3 4 5
Spatial frequency (lp/mm)
DQE
(b)
0.0
0.1
0.2
0.3
0.4
0.5
0.6
0 1 2 3 4 5
Spatial frequency (lp/mm)
DQE
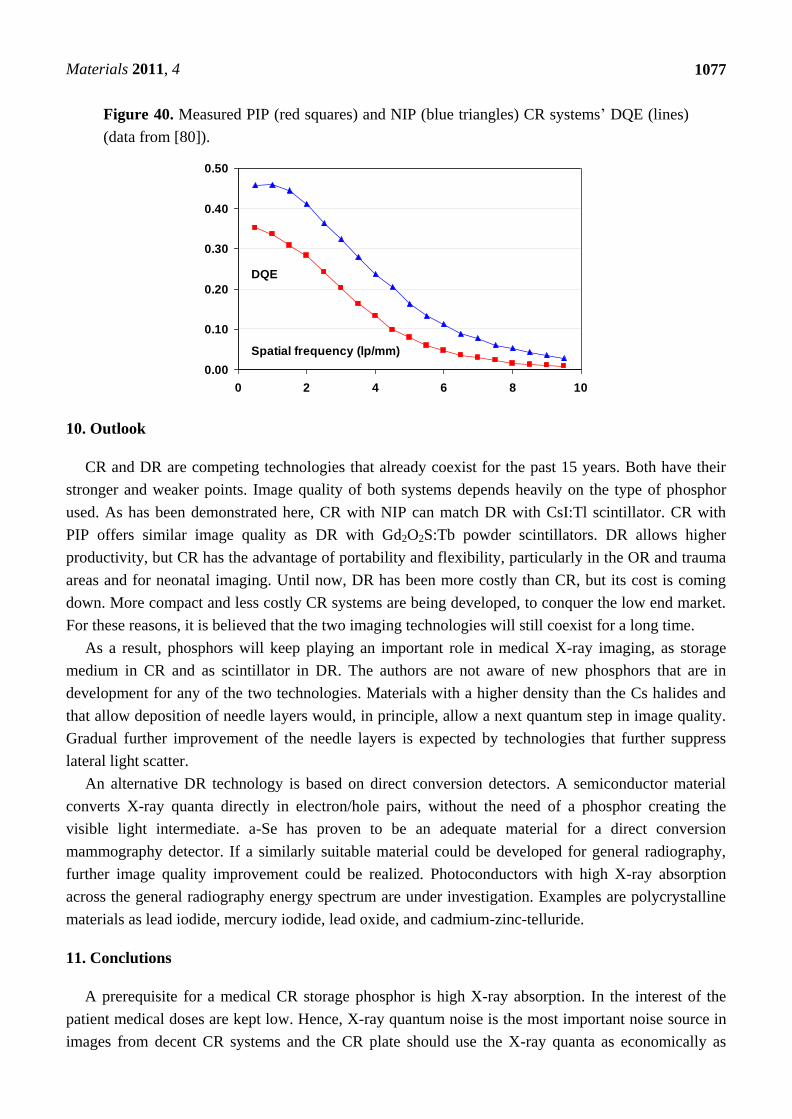
Materials 2011, 4
1077
Figure 40. Measured PIP (red squares) and NIP (blue triangles) CR systems’ DQE (lines)
(data from [80]).
10. Outlook
CR and DR are competing technologies that already coexist for the past 15 years. Both have their
stronger and weaker points. Image quality of both systems depends heavily on the type of phosphor
used. As has been demonstrated here, CR with NIP can match DR with CsI:Tl scintillator. CR with
PIP offers similar image quality as DR with Gd2O2S:Tb powder scintillators. DR allows higher
productivity, but CR has the advantage of portability and flexibility, particularly in the OR and trauma
areas and for neonatal imaging. Until now, DR has been more costly than CR, but its cost is coming
down. More compact and less costly CR systems are being developed, to conquer the low end market.
For these reasons, it is believed that the two imaging technologies will still coexist for a long time.
As a result, phosphors will keep playing an important role in medical X-ray imaging, as storage
medium in CR and as scintillator in DR. The authors are not aware of new phosphors that are in
development for any of the two technologies. Materials with a higher density than the Cs halides and
that allow deposition of needle layers would, in principle, allow a next quantum step in image quality.
Gradual further improvement of the needle layers is expected by technologies that further suppress
lateral light scatter.
An alternative DR technology is based on direct conversion detectors. A semiconductor material
converts X-ray quanta directly in electron/hole pairs, without the need of a phosphor creating the
visible light intermediate. a-Se has proven to be an adequate material for a direct conversion
mammography detector. If a similarly suitable material could be developed for general radiography,
further image quality improvement could be realized. Photoconductors with high X-ray absorption
across the general radiography energy spectrum are under investigation. Examples are polycrystalline
materials as lead iodide, mercury iodide, lead oxide, and cadmium-zinc-telluride.
11. Conclutions
A prerequisite for a medical CR storage phosphor is high X-ray absorption. In the interest of the
patient medical doses are kept low. Hence, X-ray quantum noise is the most important noise source in
images from decent CR systems and the CR plate should use the X-ray quanta as economically as
0.00
0.10
0.20
0.30
0.40
0.50
0 2 4 6 8 10
Spatial frequency (lp/mm)
DQE

Materials 2011, 4
1078
possible. That is, it should have an absorption that is as high as possible. It is not surprising that the
commercial CR phosphors today are phosphors of the BaFX:Eu2+
family and CsBr:Eu2+
. Both
materials have a relatively high density of about 5 g/cm3 and contain an element with a K-edge
between 35 and 40 keV, matching well with the X-ray spectra used in general radiography.
Most CR scanners are flying-spot scanners with a PMT light detector. Since amplification noise is a
second important noise source, also the photons emitted by the phosphor should be used as
economically as possible. The PMT conversion efficiency being higher for higher photon energies, the
UV to blue Eu2+
emission is very suitable for reaching a high gain in CR. In addition, the Eu2+
luminescence fulfils the requirement of having a decay-time short enough for efficient read-out in a
flying-spot scanner. In hindsight, it is no surprise that both important CR phosphor classes have Eu2+
as activator.
Suitable defects are required for PSL. F centers, based on vacancies of monovalent ions, are good
candidates to act as electron traps from which trapped electrons can be stimulated with relatively low
energy. A lower valence of the missing ion corresponds to a lower binding energy of the electron in the
vacancy and to longer stimulation wavelengths. The larger monovalent ions lead to larger F centers
and are, therefore, the preferred F center sources. This explains why red-stimulable F centers are
created in Br− containing compounds as BaFBr:Eu
2+ and CsBr:Eu
2+. I
− is even more preferred and
partial or complete replacement of Br− in BaFBr:Eu
2+ has lead to a further improvement of the storage
phosphor. For some reason, CsI seems to be no suitable host material for a room-temperature storage
phosphor. Further defects or impurities are required for PSL that can act as hole trap and, as it turns
out, as stabilizing agents. O2−
is incorporated in BaFBr:Eu2+
on a halide position and plays the role of
hole trap. In (Ba,Sr)F1+xBr1−x:Eu2+
this role is taken over by F− antisites, i.e., F
− ions on a Br
− lattice
positions. It is the only medical CR phosphor that does not rely on oxygen or water as essential
impurity. There is strong evidence that H2O plays an eminent role in CsBr:Eu2+
by stabilizing the Eu2+
monomers, and preventing their agglomeration. Agglomeration would make the material inactive as
storage phosphor. Since the hole trap has not been identified yet in CsBr:Eu2+
, it is not impossible that,
as in BaFBr:Eu2+
, O2−
serves as hole trap. It seems likely that a slightly hygroscopic character of the
mother lattice is a favorable material property to make a storage phosphor. It will help incorporating
the abovementioned impurities when the phosphor is produced in a solid state process.
As in image intensifiers and DR, the morphology of the phosphor crystals in the CR imaging plate
has a very significant impact on its performance. The light-guiding character of the crystals in NIP
leads to a large benefit over PIP. It allows the use of much thicker phosphor layers in general
radiography that have at least a two times higher X-ray absorption. The higher light transparency
further leads to a higher system gain and the IP’s are more homogeneous and lead to less
screen-structure noise. It has been demonstrated that, for many general radiography applications, NIP
leads to the same image quality as PIP at 50% or less of the X-ray dose. CR with NIP offers the same
image quality for most general radiography applications as DR with a CsI:Tl+ needle scintillator plate.
When small detail visibility is important and when a softer X-ray beam is used as in paediatry and
imaging of extremities, it even leads to significantly better image quality than this competing
technology. DQE comparisons and first clinical evaluations indicate that in mammography a reduction
in X-ray dose of 30 to 50% is possible with NIP.

Materials 2011, 4
1079
Acknowledgements
The authors thank Jean-Pierre Tahon for a discussion of the PSL mechanism of CsBr:Eu2+
.
References
1. Andriole, K.P. Computed Radiography Technology Overview. In RSNA Categorical Course in
Physics: Technology Update and Quality Improvement of Diagnostic X-ray Imaging Equipment;
Gould, R.G., Boone, J.M., Eds.; Radiological Society of North America Publication: Oak Brook,
IL, USA, 1996; pp. 141-152.
2. Luckey, G.W. Apparatus and method for producing images corresponding to patterns of high
energy radiation. US Patent 3,859,527, 1975.
3. Lakshmanan, A.R. Radiation induced defects and photostimulated luminescence process in
BaFBr:Eu2+
. Phys. Stat. Sol. (a) 1996, 153, 3-27.
4. Yen, W.M.; Weber, M.J. Inorganic Phosphors, Compositions, Preparation and Optical
Properties; CRC Press: Boca Raton, FL, USA, 2004.
5. Stevels, A.L.N.; Pingault, F. BaFCl:Eu2+
, a new phosphor for X-ray intensifying screens. Philips
Res. Repts. 1975, 30, 277-290.
6. Nicklaus, E.; Fischer, F. F-centres of two types in BaFCl crystals. Phys. Stat. Sol. (b) 1972, 52,
453-460.
7. Kotera, N.; Eguchi, S.; Miyahara, J.; Matsumoto, H.; Kato, H. Method and apparatus for
recording and reproducing a radiation image. US Patent 4,239,968, 1980.
8. Sonoda, M.; Takano, M.; Miyahara, J.; Kato, H. Computed radiography utilizing scanning laser
stimulated luminescence. Radiology 1983, 148, 833-838.
9. Takahashi, K.; Miyahara, J.; Shibahara, Y. Photostimulated luminescence (PSL) and color
centers in BaFX:Eu2+
(X=Cl,Br,I) phosphors. J. Electrochem. Soc. 1985, 132, 1492-1494.
10. Hangleiter, Th.; Koschnick, F.-K.; Spaeth, J.-M.; Eachus, R.S. Photo-stimulated emission of
X-irradiated BaFBr:Eu2+
. Radiat. Eff. Defects Solids 1991, 615, 119-121.
11. Koschnick, F.K. Magnetische Resonanzuntersuchungen am Röntgenspeicherleuchtstoff
BaFBr:Eu. PhD Thesis. Universität Paderborn: Paderborn, Germany, 1991.
12. von Seggern, H. Photostimulable X-ray storage phosphors: A review of present understanding.
Braz. J. Phys. 1999, 29, 255-268.
13. Ye, B.; Lin, J.-H.; Su, M.-Z. Two types of f-centers in BaFBr. J. Luminesc.1988, 40-41, 323-324
14. Takahashi, K.; Kohda, K.; Miyahara, J. Mechanism of photostimulated luminescence in BaFX:
Eu2+
(X = Cl, Br) phosphors. J. Luminesc. 1984, 31-32, 266-268.
15. Itoh, N. Creation of lattice defects by electronic excitation in alkali halides. Adv. Phys. 1982, 31,
491-551.
16. Hangleiter, Th.; Koschnick, F.K.; Spaeth, J.-M.; Nuttall, R.H.D.; Eachus, R.S. Temperature
dependence of the photostimulated luminescence of X-irradiated BaFBr:Eu2+
. J. Phys. Condens.
Matter 1990, 2, 6837-6846.

Materials 2011, 4
1080
17. Eachus, R.S.; Koschnick, F.K.; Spaeth, J.-M.; Nuttall, R.H.D. The roles of oxygen impurities and
defect aggregation in the performance of the storage phosphor BaFBr:Eu2+
. In Proceedings of
International Conference on Defects in Insulating Materials, Schloss Nordkirchen, Germany,
16–22 August 1992; Kanert, O., Spaeth, J.-M., Eds.; World Scientific: Singapore, 1992;
pp. 267-269.
18. Eachus, R.S.; Nuttall, R.H.D.; McDugle, W.G.; Koschnick, F.K.; Spaeth, J.M. The structure and
mechanism of formation of OF−, OCl
− and (O2
−)Cl centers in X and UV-irradiated BaFCl. In
Proceedings of International Conference on Defects in Insulating Materials, Nordkirchen,
Germany, 16–22 August 1992; Kanert, O., Spaeth, J.M., Eds.; World Scientific: Singapore,
1992; pp. 1172-1174.
19. Koschnick, F.K.; Spaeth, J.M.; Eachus, R.S.; McDugle, W.G.; Nuttall, R.H.D. Experimental
evidence for the aggregation of photostimulable centers in BaFBr:Eu2+
single crystals by cross
relaxation spectroscopy. Phys. Rev. Lett. 1991, 67, 3571-3574.
20. Eachus, R.S.; McDugle, W.G.; Nuttall, R.H.D.; Ohm, M.T.; Koschnik, F.K.; Hangleiter, T.;
Spaeth, J.M. Radiation-produced electron and hole centres in oxygen-containing BaFBr: I EPR
and ODEPR studies. J. Phys. Condens. Matter 1991, 3, 9327-9338.
21. Thoms, M.; von Seggern, H.; Winnacker, A. Spatial correlation and photostimulability of defect
centers in the X-ray storage phosphor BaFBr:Eu2+
. Phys. Rev. B Condens. Matter 1991, 44,
9240-9247.
22. von Seggern, H.; Voigt, T.; Knüpfer, W.; Lange, G. Physical model of the photostimulated
luminescence of X-ray irradiated BaFBr:Eu2+
. J. Appl. Phys. 1988, 64, 1405-1412.
23. von Seggern, H. X-ray storage phosphors: Physical mechanisms and applications. Cryst. Latt.
Def. Amorph. Mat. 1989, 18, 399-417.
24. de Leeuw, D.M.; Kovats, T.; Herko, S.P. Kinetics of Photostimulated Luminescence in
BaFBr:Eu. J. Electrochem. Soc.1987, 134, 491-493.
25. Koschnick, F.K.; Spaeth, J.M.; Eachus, R.S. Study of spatial correlations between radiation-induced
defects and the activator Eu2+
in the X-ray storage phosphor BaFBr:Eu2+
with optical detection of
electron paramagnetic resonance. J. Phys. Condens. Matter 1992, 4, 8919-8932.
26. Ivey, H.F. Spectral location of the absorption due to color centers in Alkali Halide crystals. Phys.
Rev. 1947, 72, 341-343.
27. Nanto, H.; Araki, T.; Daimon, M.; Kusano, E.; Kinbara, A.; Kawabata, K. Nakano, Y. Optically
Stimulated Luminescence in an Imaging Plate Using BaFI:Eu. Radiat Prot Dosimetry 2002, 100,
385-388.
28. Nakano, Y.; Gido, T.; Honda, S.; Maezawa, A.; Wakamatsu, H.; Yanagita, T. Improved
computed radiography image quality from a BaFI:Eu photostimulable phosphor plate. Med.
Phys. 2002, 29, 592-597.
29. Terrell, D.R.; Adriaensens, A.D.; Neyens, L.M.; Tecotzky, M.K.J.; Benjamin, S.D. Photostimulable
phosphor for use in radiography. US Patent 5,514,298, 1995.
30. Klee, R.J. An x-ray diffraction study of (Ba,Sr)F1+xBr1−x;Eu2+
, a new x-ray image receptor
material. J. Phys. D Appl. Phys. 1995, 28, 2529-2533.
31. Dietze, C.; Hangleiter, T.; Willems, P.; Leblans, P.J.R.; Struye, L.; Spaeth, J.M. Photostimulation
redshift for nonstoichiometric Ba1−x Srx FBr:Eu2+
. J. Appl. Phys. 1996, 80, 1074-1078.

Materials 2011, 4
1081
32. Schweizer, S.; Spaeth, J.M.; Bastow, T.I. Generation of F centres and hole centres in the
non-stoichiometric X-ray storage phosphor BaFBr. J. Phys. Condens. Matter 1998, 10, 9111-9122.
33. Schweizer, S. Physics and current understanding of X-ray storage phosphors. Phys. Stat. Sol. (A)
2001, 2, 335-393.
34. Meijerink, A. Photostimulated luminescence and thermally stimulated luminescence of
(Ba,Sr)F1+xBr1−x:Eu2+
. Mater. Chem. Phys. 1996, 44, 170-177.
35. Batentschuk, M.; Hackenschmied, P.; Winnacker, A. Optimization of mixed storage phosphors
of the type (Ba,Sr)F1+xBr1−x:Eu for digital radiography. Mat. Res. Soc. Symp. Proc. 1999, 560,
27-32.
36. Hackenschmied, P.; Li, H.; Epelbaum, E.; Fasbender, R.; Batentschuk, M.; Winnacker, A.
Energy transfer in Ba1−xSrxFBr:Eu storage phosphors as a function of Sr and Eu concentration.
Radiat. Meas. 2001, 33, 669-674.
37. Dietze, C.; Hangleiter, T.; Willems, P.; Leblans, P.; Struye, L.; Spaeth, J.M. Photostimulation
redshift for nonstoichiometric Ba1−xSrxFBr:Eu2+
. J. Appl. Phys. 1996, 80, 1074-1078.
38. Schweizer, S.; Willems, P.; Leblans, P.J.R.; Struye, L. Electron traps in Ca2+
- or Sr2+
-doped
BaFBr:Eu2+
X-ray storage phosphors. J. Appl. Phys. 1996, 79, 4157-4165.
39. Schlapp, M.; Bulur, E.; von Seggern, H. Photo-stimulated luminescence of calcium co-doped
BaFBr:Eu2+
x-ray storage phosphors. J. Phys. D Appl. Phys. 2003, 36, 103-108.
40. Hosoi, Y.; Saito, H.; Kojima, Y.; Arakawa, S.; Takahashi, K. Mammographic imaging properties
of an experimental SrFBr:Eu2+
imaging plate. Med. Imaging VI Instrum. 1992, 1651, 236-245.
41. Meijerink, A.; Blasse, G.; Struye, L. A new photostimulable phosphor: Eu2+
activated
bariumbromosilicate (Ba5SiO4Br6). Mater. Chem. Phys. 1989, 21, 261-270.
42. Meijerink, A. Luminescence of new X-ray storage phosphors. PhD Thesis. University of Utrecht:
Utrecht, The Netherlands, 1990; pp. 35-43.
43. Struye, L.; Leblans, P. Method for recording and viewing or reproducing a radiation image by
means of an infrared-stimulable phosphor. European Patent 0559258, 1993.
44. Meijerink, A.; Blasse, G. Photoluminescence and thermoluminescence properties of
Ca2PO4Cl:Eu2+
. J. Phys. Condens. Matter 1990, 2, 3619-3628.
45. Schipper, W.J.; Hamelink, J.J.; Langeveld, E.M.; Blasse, G. Trapping of electrons by H+ in the
X-ray storage phosphor Ba3(PO4)2:Eu2+
,La3+
. J. Phys. D. Appl. Phys. 1993, 26, 1487-1492.
46. Zych, E.; Trojan-Pieggza, J.; Hreniak, D.; Strek, W. Properties of Tb-doped vacuum sintered
Lu2O3 storage phosphor. J. Appl. Phys. 2003, 94, 1318-1324.
47. Pawlik, T.; Spaeth, J.M. Optical and magnetooptical investigation of the X-ray storage phosphor
Cs2NaYF6:Ce3+
. In Proceedings of International Conference on Inorganic Scintillators and Their
Applications SCINT95, Dorenbos, P., Van Eijk, C.W.E., Eds.; Delft University Press: Delft, The
Netherlands, 1996; pp. 392-395.
48. Leblans, P.; Willems, P.; Struye, L.; Spaeth, J.M; Pawlik, T. Class of high energy detecting
phosphors. European Patent 94201578, 1994.
49. Chakrabarti, K.; Mathur, V.K.; Thomas, L.A.; Abbundi, R.J. Charge trapping and mechanism of
stimulated luminescence in CaS:Ce,Sm. J. Appl. Phys. 1989, 65, 2021-2023.
50. Chakrabarti, K.; Mathur, V.K.; Rhodes, J.F.; Abbundi, R.J. Stimulated luminescence in rare-
earth doped MgS. J. Appl. Phys. 1989, 64, 1363-1366.

Materials 2011, 4
1082
51. Nanto, H.; Hirai, Y.; Ikeda, M.; Kadota, M.; Nishishita, J.; Nasu, S.; Douguchi, Y. A novel
image storage sensor using photostimulated luminescence in SrS:Eu,Sm phosphor for
electromagnetic waves such as X-rays, UV-rays and visible light. Sens. Actuators A 1996, 53,
223-226.
52. Soltani, P. System for reading a phosphor screen used in filmless radiography. World Patent
1998/02780, 1996.
53. Dorenbos, P. The 5d level positions of the trivalent lanthanides in inorganic compounds.
J. Lumin. 2000, 91, 155-176.
54. Secu, M.; Schweitzer, S.; Spaeth, J.M.; Edgar, A.; Williams, G.V.M.; Rieser, U. Photostimulated
luminescence from a fluorobromozirconate glass-ceramic and the effect of crystallite size and
phase. J. Phys. Condens. Matter 2003, 15, 1097-1108.
55. Thornton, J.A. Influence of substrate temperature and deposition rate on structure of thick
sputtered Cu coatings. J. Vac. Sci. Technol. 1975, 12, 830-835.
56. Thornton, J.A. High rate thick film growth. Annu. Rev. Mater. Sci. 1977, 7, 239-260.
57. Schmitt, B.; Fuchs, M.; Hell, E.; Knüpfer, W.; Hackenschmiedt, P.; Winnacker, A. Structured
alkali halides for medical applications. Nucl. Instrum. Methods Phys. Res. Sect. B 2002, 191,
800-804.
58. Stevels, A.L.N.; Schrama-de Pauw, A.D.M. Vapour-deposited CsI:Na layers, II, screens for
application in X-ray imaging devices. Philips Res. Rep. 1974, 29, 353-367.
59. Brinkman, P. CsI(Na) scintillation crystals. Phys. Lett. 1965, 15, 305.
60. Bates, C.W. Scintillation in Thin Films of CsI(Na) and CsI(Tl) due to Low Energy X-rays,
Electrons and Protons. Adv. Electron. Electron Phys. 1969, 28, 451-459.
61. Wang, J.; Blackburn, T.F. X-ray Image Intensifiers for Fluoroscopy. Radiographics 2000, 20,
1471-1477.
62. Stevels, A.L.N. New phosphors for X-ray screens. Med. Mundi 1975, 20, 12-22.
63. Kano, T.; Takahashi, T.; Okajima, K.; Umetani, K.; Ataka, S.; Yokouchi, H.; Suzuki, R.
Laser-stimulable transparant CsI:Na film for a high quality x-ray imaging sensor. Appl. Phys.
Lett. 1986, 49, 1117-1118.
64. Perez-Mendez, V. Digital Radiography: Present Detectors and Future Developments. Lawrence
Berkeley Laboratory Reports 29441. Berkeley, CA, USA, 1990.
65. Rowlands, J.A.; Yorkston, J. Flat Panel Detectors for Digital Radiography. In Handbook of
Medical Imaging, vol. 1 Physics and Psychophysics; Beutel, J., Kunel, H.L., Van Metter, R.L.,
Eds.; SPIE Publications: Bellingham, WA, USA, 2000; pp. 223-328.
66. Kobayashi, H.; Tanaka, S.; Iwase, N.; Yoshiyama, H. Photostimulated luminescence in
BaFBr:Eu2+
evaporated films. J. Lumin. 1988, 40/41, 819-820.
67. Amitani, K.; Kano A.; Tsuchino, H.; Shimada, F. X-ray Imaging System Utilizing New
Photostimulable Phosphor. In Proceedings of SPIE’s Conference and Exhibition: Electric
Imaging, 26th Fall Symposium, San Diego, CA, USA, October 1986; Printing of Paper
Summaries, pp. 180-183.
68. Amitani, K.; Kano, A.; Tsuchino, H.; Shimada, F. A new photostimulable phosphor detector for
digital radiography. Konica Tech. Rep. 1988, 1, 120-125.
Materials 2011, 4
1083
69. von Seggern, H.; Voigt, T.; Schwarzmichel, K. Physical mechanisms of photostimulation in
medical X-ray storage phosphors. Siemens Forsch. Entwickl. 1988, 17, 125-130.
70. von Seggern, H.; Meijerink, A.; Voigt, T.; Winnacker, A. Photostimulated mechanism of
x-ray-irradiated RbBr:Tl. J. Appl. Phys. 1989, 66, 4418-4424.
71. Sato, A.; Hara, H.; Kano, A. Development of x-ray direct digitizer Regius Model 530 and Regius
Model 330M. Konica Tech. Rep. 1999, 12, 117-120.
72. Rogulis, U.; Schweizer, S.; Assmann, S.; Spaeth, J.M. Ga2+
hole centers and photostimulated
luminescence in the x-ray storage phosphor RbBr:Ga+. J. Appl. Phys. 1998, 84, 4537-4542.
73. Rogulis, U.; Schweizer, S.; Assmann, S.; Spaeth, J.M. Photostimulated luminescence process in
the x-ray storage phosphor CsBr:Ga+. J. Appl. Phys. 2000, 8, 207-211.
74. Hangleiter, T.; Rogulis, U.; Dietze, C.; Spaeth, J.M.; Willems, P.; Leblans, P.J.R. The X-ray
Storage Phosphors RbI:Tl+ and KBr:In
+ and other In
+ and Ga
+ Doped Alkali Halides. In
Proceedings of International Conference on Inorganic Scintillators and Their Applications,
SCINT95; Delft, The Netherlands, 28 August–1 September 1995; Delft University Press: Delft,
The Netherland, 1996; pp. 452-455.
75. Leblans, P.; Struye, L.; Gebele, H. A new detector for digital radiography: The best of two
worlds. Phys. Med. 1999, XV, 301-304.
76. Niilisk, A.; Soovik, T.; Tatarly, V. Luminescence Decay Time for Ga+ Centres in Alkali Halides.
Phys. Stat. Sol. (B) 1974, 64, 135-138.
77. Frankenberger, J.; Mair, S.; Herrmann, C.; Lamotte, J.; Fasbender, R. Reflective and
Transmissive CR Scanhead Technology on Needle Image Plates. Proc. SPIE 2005, 5745,
499-510.
78. Leblans, P.; Struye, L.; Willems, P. New needle-crystalline CR detector. J. Digital Imaging
2000, 13, 117-120.
79. Leblans, P.J.R.; Struye, L.; Willems, P. New needle-crystalline CR detector. Proc. SPIE 2001,
4320, 59-67.
80. Vandenbroucke, D.A.N.; Leblans, P.J.R. CR mammography: Image quality measurement and
model calculation for needle vs. powder imaging plate. Lect. Notes Comput. Sci. 2010, 6136,
219-226.
81. Leblans, P.; Struye, S. A cesium bromide storage phosphor with narrow emission spectrum upon
UV-excitation. European Patent 1217633, 2001.
82. Hackenschmied, P.; Schierning, G.; Batentschuk, M.; Winnacker, A. Precipitation-induced
photostimulated luminescence in CsBr:Eu2+
. J. Appl. Phys. 2003, 93, 5109-5112.
83. Weidner, M.; Osvet, A.; Meister, F.; Batentschuk, M.; Winnacker, A.; Tahon, J.-P.; Leblans, P.
Luminescence spectroscopy of Eu2+
in CsBr:Eu needle image plates (NIPs). Radiat. Meas. 2007,
42, 661-664.
84. Weidner, M. Einfluss der Temperbedigungen auf Lumineszenz- und Speicherzentren in CsBr:Eu2+
Nadelbildplatten. PhD Thesis. Universität Erlangen-Nürnberg: Nürnberg, Germany, 2009.
85. Appleby, G.A.; Zimmerman, J.; Hesse, S.; Karg, O.; von Seggern, H. Sensitization of the
photostimulated X-ray storage-phosphor CsBr:Eu2+
following room-temperature hydration.
J. Appl. Phys. 2009, 20, 54-58.
Materials 2011, 4
1084
86. Schweizer, S.; Rogulis, U.; Assmann, S.; Spaeth, J.M. RbBr and CsBr doped with Eu2+
as new
competitive X-ray storage phosphors. Radiat. Meas. 2001, 33, 486-486.
87. Fowler, W.B. Physics of Color Centres; Academic Press: San Diego, CA, USA, 1968.
88. Hackenschmied, P.; Zeitler, G.; Batentschuk, M.; Winnacker, A.; Schmitt, B.; Fuchs, M.;
Hell, E.; Knüpfer, W. Storage performance of X-ray irradiated doped CsBr. Nucl. Instrum.
Methods Phys. Res. Sect. B 2002, 191, 163-167.
89. Hackenschmied, P. Funktion und Herstellung von Speicherleuchtstoffen für die digitale
Röntgendiagnostik. PhD Thesis. Universität Erlangen-Nürnberg: Nürnberg, Germany, 2002.
90. Schierning, G. Untersuchung von Nanophasen und deren Einfluss auf den Speichermechanismus
von CsBr:Eu. PhD Thesis, Diss. Universität Erlangen-Nürnberg: Nürnberg, Germany, 2005.
91. Schierning, G.; Batentschuk, M.; Winnacker, A.; Struye, L.; Tahon, J.-P.; Leblans, P. Correlation
of the dielectric constant and the PSL-sensitivity in CsBr:Eu image plates. In Proceedings of
LUMDETR 2006: European Conference on Luminescent Detectors and Transformers of Ionizing
Radiation No. 6, Lviv, Ukraine, 19–23 June 2007; Volume 42, pp. 657-660
92. Tahon, J.P. Project Manager Phosphors. Agfa HealthCare NV: Mortsel, België, Personal
communication, 2011.
93. Hesse, S.; Zimmerman, J.; von Seggern, H.; Ehrenberg, H.; Fuess, H. The role of segregations
and oxygen doping in the photostimulation mechanism of CsBr:Eu2+
. Radiat. Meas. 2007, 42,
638-643.
94. Hesse, S.; Zimmerman, J.; von Seggern, H.; Ehrenberg, H.; Fuess, H.; Fasel, C.; Riedel, R.
CsEuBr3: Crystal structure and its role in the photostimulation of CsBr:Eu2+
. J. Appl. Phys. 2006,
100, 083506:1-083506:5.
95. Loncke, F.; Vrielinck, H.; Matthys, P.; Callens, F.; Tahon, J.-P.; Leblans, P. Paramagnetic Eu2+
center as a probe for the sensitivity of CsBr x-ray needle image plates. Appl. Phys. Lett. 2008, 92,
204102:1-204102:3.
96. Loncke, F.; Vrielinck, H.; Matthys, P.; Callens, F.; Tahon, J.-P.; Leblans, P. Electron
paramagnetic resonance study of a Eu2+
related defect in CsBr:Eu needle imaging plates for
computed radiography. Spectrochmica Acta Part A 2008, 69, 1322-1326.
97. Loncke, F.; Vrielinck, H.; Matthys, P.; Callens, F.; Tahon, J.P.; Leblans, P. Temperature
dependence of Eu-related EPR spectra in CsBr:Eu needle image plates. Phys. Rev. B 2009, 79,
174102:1-174102:9.
98. Loncke, F. Magnetic Resonance Study of Dopant Related Defects in X-ray Storage Phosphors.
PhD Thesis. Faculteit Wetenschappen, Vakgroep Vastestofwetenschappen, Universiteit Gent:
Gent, Belgium, 2009.
99. Vrielinck, H.; Loncke, F.; Tahon, J.P.; Leblans, P.; Matthys, P.; Callens, F. Electron nuclear
double resonance study of photostimulated luminescence active centers in CsBr:Eu2+
medical
imaging plates. Phys. Rev. B 2011, 83, 054102:1-054102:9.
100. Lidiard, A.B. Handbuch der Physik; Flügge, S., Ed.; Springer: Berlin, Germany, 1957;
Volume 20, p. 246.
101. Granfors, P.R. Medical Electrical Equipment—Characteristics of Digital X-ray Imaging
Devices—Determination of the Detective Quantum Efficiency; IEC standard: IEC62220-1, IEC:
Geneva, Switzerland, 2003.

Materials 2011, 4
1085
102. Samei, E.; Flynn, M.J.; Reimann, D.A. A method for measuring the presampled MTF of digital
radiographic systems using an edge test device. Med. Phys. 1998, 25, 102-113.
103. Williams, M.B.; Mangiafico, P.A.; Simoni, P.U. Noise power spectra of images from digital
mammography detectors. Med. Phys. 1999, 26, 1279-1293.
104. Aufrichtig, R.; Su, Y.; Cheng, Y.; Granfors, P.R. Measurement of the noise power spectrum in
digital x-ray detectors. Proc. Spie 2001, 4320, 363-372.
105. Shaw, R.; Van Metter, R.L. An analysis of the fundamental limitations of screen-film systems for
x-ray detection: I. General theory. Proc. SPIE 1984, 454, 133-141.
106. Dick, C.E.; Motz, J.W. Image information transfer properties of X-ray fluorescent screens. Med.
Phys. 1981, 11, 37-46.
107. Hillen, W.; Schiebel, U.; Zaengel, T. Imaging performance of a digital storage phosphor system.
Med. Phys. 1987, 14, 744-751.
108. Schaetzing, R.; Fasbender, R.; Kersten, P. New high-speed scanning technique for computed
radiography. Proc. SPIE 2002, 4682, 511-522.
109. Shimada, K.; Yasuda, H.; Arakawa, S.; Kuwabara, T.; Takasu, A.; Iwabuchi, Y.; Katou, M.
Comparison in image quality and noise component of columnar phosphor plate and powder
phosphor plate. Proc. SPIE 2007, 6510, 651044.
110. Willems, P.; Leblans, P.J.R.; De Winter, B.M.F. Needle vs. Powder Imaging Plate for Computer
Radiography: Image quality Measurement and Model Calculation. In Proceedings of NIP21:
International Conference on Digital Printing Technologies, Baltimore, MD, USA, September
2005; Volume 21, pp. 657-660.
111. Mackenzie, A.; Honey, I.D. Characterization of noise sources for two generations of computed
radiography systems using powder and crystalline photostimulable phosphors. Med. Phys. 2007,
34, 3345-3357.
112. Körner, M.; Wirth, S.; Treitl, M.; Reiser, M.; Pfeifer, K.J. Initial Clinical Results with a New
Needle Screen Storage Phosphor System in Chest Radiograms. Fortschr. Röntgenstr. 2005, 177,
1491-1496.
113. Körner, M.; Treitl, M.; Schaetzing, R.; Pfeifer, K.J.; Reiser, M.; Wirth, S. Depiction of
low-contrast detail in digital radiography; comparison of powder- and needle-structured storage
phosphor systems. Invest. Radiol. 2006, 41, 593-599.
114. Wirth, S.; Treitl, M.; Reiser, M.F.; Körner, M. Imaging performance with different doses in
skeletal radiography: Comparison of a needle-structured and a conventional storage phosphor
system with a flat-panel detector. Radiology 2009, 250, 152-160.
115. Fernandez, J.M.; Ordiales, J.M.; Guibelalde, E.; Prieto, C.; Vano, E. Physical image quality
comparison of four types of digital detector for chest radiology. Radiat. Prot. Dosim. 2008, 129,
140-143.
116. Smans, K.; Vandenbroucke, D.; Pauwels, H.; Struelens, L.; Vanhavere, F.; Bosmans, H.
Validation of an image simulation technique for two computed radiography systems: An
application to neonatal imaging. Med. Phys. 2010, 37, 2092-2100.

Materials 2011, 4
1086
117. Ludewig, E.; Hirsch, W.; Bosch, B.; Gäbler, K.; Sorge, I.; Succow, D.; Werrmann, A.; Gosch, D.
Untersuchungen zur Qualität von Thoraxaufnahmen bei Katzen mit einem auf einer
Nadelstruktur basierenden Speicherfoliensystem—Modelluntersuchungen zur Bewertung der
Bildqualität bei Nuegeborenen. Fortschr. Röntgenstr. 2010, 182, 122-132.
118. Herrmann, C.; Frankenberger, J.; Reiser, G.; Lamotte, J. Optimization of a CR system
comprising line-scanning and needle image plate technology with respect to examinations of
extremities. Proc. SPIE 2007, 6510, 1-9.
119. Peloschek, P.; Langs, G.; Semturs, F. First experiences with a new, needle-based CR
mammography system: Evaluation of image quality and dose levels and comparison to other
currently available CR and DR systems and to a highly sensitive screen-film system. Presented at
the European Congress of Radiology in Vienna, Vienna, Austria, 4–8 March 2011; Poster C-1156.
© 2011 by the authors; licensee MDPI, Basel, Switzerland. This article is an open access article
distributed under the terms and conditions of the Creative Commons Attribution license
(http://creativecommons.org/licenses/by/3.0/).