storage and the electricity forward premium · storage and the electricity forward premium ......
TRANSCRIPT

Storage and the Electricity Forward Premium
Julia Popova* and Stratford Douglas
West Virginia University Department of Economics PO Box 6025
Morgantown, WV 26506-6025
October, 2006
Abstract: We develop and test a model describing the influence of natural gas storage on the
electricity forward premium. The model is constructed by linking the effect of gas storage
on the higher moments of the distribution of electricity prices to an established model of the
effect of those moments on the forward premium. The model predicts a (weakly) positive
effect of gas storage on the electricity forward premium when loads are light, but a sharply
negative effect when demand for electricity is high and demand for gas is low. The model
predicts a daily pattern of stronger effects in the afternoon. Empirical results, based on PJM
data, strongly support the model.
* Douglas: Associate Professor, [email protected], 304-293-7863. Popova: PhD Candidate, [email protected] . This research was supported in part by a state implementation grant from the US Department of Energy EPSCoR program at WVU’s Advanced Power & Electricity Research Center (APERC).

Storage and the Electricity Forward Premium
I. Introduction
The classical theory of pricing for commodity forward contracts relies on traders’ ability
to arbitrage the forward contract by purchasing and storing the commodity (e.g., Working
1948; Kaldor 1939). Electricity storage is too expensive and limited for effective arbitrage,
so the current theory of electricity forward contract pricing relies instead upon hedging
supply and demand by risk-averse electricity producers and retail load serving entities or
LSEs (Bessembinder and Lemmon, 2002). But because power plant fuels may be stored
(and power plant capacity reserved), arbitrage and conversion opportunities may still place
limits upon electricity forward prices. We find empirical evidence that in fact the electricity
forward premium is limited by the availability of gas storage, but only in times of relatively
high demand for electricity and low space-heating demand for gas.
The significance of this research is threefold. First, we offer an empirical model that
provides a better fit for the premium, and a better test of current theory, than is found in the
literature to date. The model provides a guide for practitioners who are seeking to model
and predict the forward premium in real time. Second, elucidation of the link between gas
storage and electricity market price risk can improve our ability to set a social value on gas
storage capacity. Third, improving our ability to predict the electricity forward premium
might improve predictions of the electricity price spikes that drive that premium. Because of
the financial importance of price spikes, any light we can shed on the determinants of their
occurrence should be of value to the marketplace.
The paper is organized into four sections, as follows. Following this introduction,
section II provides a brief description of electricity markets, an analysis of the current
theoretical literature on this subject, and provides the theoretical foundation for the
empirical work. Section III describes our empirical model and discusses the expected signs
of the coefficient estimates. Section IV describes the data we used and our empirical results.
Section V concludes, and suggests some directions for future research.

Popova/Douglas: Storage and Electricity Forward Premium
II. Theory and Literature
Wholesale electricity markets have undergone rapid and sometimes rocky development
worldwide over the past fifteen years. In contrast to U.S. retail electricity markets, which are
regulated at the state level and are still dominated by time-invariant regulated prices, U.S.
wholesale electricity markets are regulated by the Federal government, are organized
regionally, and have prices that vary rapidly throughout each day. There are three broad
classes of participants in wholesale markets for electrical energy: generators, final consumers,
and the retail load-serving entities (LSEs) that link the two. Some firms, including traditional
regulated utilities, integrate the generation and marketing functions within a single firm.
Electricity prices are characterized by positive skewness, heteroskedasticity with
volatility clustering, and mean reversion. Price spikes are a major issue in electricity markets.
Dramatic spikes are relatively common in electricity markets because demand is highly
inelastic and subject to sudden shifts, the cost of electricity production is also highly inelastic
when production is near capacity, and storage of electricity is very expensive. Price spikes
occur when demand outstrips supply, usually because of an extreme demand shift,
equipment failure, transmission congestion, or strategic withholding of capacity by
generators. Wholesale price spikes are the biggest source of market risk for LSEs, which
purchase power on the wholesale market and sell it on the retail market at the fixed,
regulated price. LSEs can lose large amounts of money when wholesale prices spike well
above retail prices, as was demonstrated forcefully during the California market crisis in
2000-01. Generators, on the other hand, face their greatest risk of loss when prices and
consumption fall, largely because it is costly to shut down and restart power plants.
In most wholesale power markets a day-ahead forward market is available to aid
participants in planning, price discovery, and hedging. Electricity forward market prices are
less volatile than real-time spot market prices, but their distributions are also skewed and
heteroskedastic. The day-ahead forward price for delivery on day t, designated Ft, also need
not be an unbiased predictor of the future spot price (St) at time t. Therefore, the forward
premium, defined as the excess of the forward price over the expected spot price,
Premt = Ft − E[St],
may differ systematically from zero.
2

Popova/Douglas: Storage and Electricity Forward Premium
Classically, the theory of the forward premium begins with the observation that a
physical hedge is available for the forward contract; specifically, the flows (of cash and
commodity) from a purchase of a forward contract can be duplicated by purchasing the
commodity on the spot market at time t-1 and storing it until time t. The existence of this
physical hedge provides an arbitrage opportunity that limits the distribution of the forward
price of storable commodities.
The high expense and technical inefficiency of electricity storage methods preclude
construction of a physical hedge of the kind contemplated in classical storage theory. Fuels
such as natural gas, however, are storable, and their cost composes most of the cost of
electricity, so a limited hedge may be constructed by purchasing and storing natural gas. The
effectiveness of such a hedge depends on the availability of generation capacity, emission
rights, and transmission capacity required to convert gas to electricity in time t and deliver
the power where it is needed. Because of the difficulties associated with this physical hedge,
current models of the electricity forward premium ignore the effect of stored natural gas.
But even if the hedge is imperfect, the lack of an available auxiliary supply of natural gas in
storage will increase the probability of a shortage of power availability from gas-fired plants,
which would increase the probability of an electricity price spike. Routledge, Seppi, and
Spatt (2001) provide a detailed theoretical model of this effect.
The availability of gas storage therefore affects the day-ahead perception of the
distribution of electricity prices, which affects the forward premium. The effect of the
anticipated distribution of electricity prices on the forward premium is relatively well-
established in the Finance literature. The leading paper on the subject, Bessembinder and
Lemmon (2002), hereafter referred to simply as “BL,” depicts an equilibrium in which risk
averse generation firms sell power to risk-averse LSEs in a wholesale spot market, and both
hedge their risk in the day-ahead forward market.
In BL’s model, the forward premium is driven by the relative supply and demand for
forward contracts to hedge risks. The generators and LSEs seek to maximize objective
functions that take into account both profit and uncertainty. Generators (who are usually
net suppliers in the forward market) seek to minimize their exposure to low prices or
demand shortfalls, and also seek to stabilize their revenues generally. LSEs (who are usually
net purchasers in the forward market) also desire to reduce their exposure to low sales and
3

Popova/Douglas: Storage and Electricity Forward Premium
stabilize their procurement costs, and they especially want to hedge their exposure to price
spikes.
The possibility of price spikes corresponds to positive skewness in the expected price
distribution. To avoid losses, LSEs react to increased spot price skewness by buying more
forward contracts, driving the forward price upward relative to the expected spot price and
increasing the forward premium (BL Hypothesis 2, page 1362). BL’s model also predicts
(Hypothesis 1, p. 1362) a negative relationship between the variance of the spot price and
the forward premium. This result follows from the positive correlation between sales and
wholesale price, which creates a positive profit exposure if the retail price of electricity
exceeds the expected spot price. The overall relationship between the moments of the spot
price distribution and the forward premium is summarized by equation (1), 1
Premt = αE[Var(St)] + γ E[Skew(St)], (1)
where α < 0 and γ > 0 are signed parameters in the model. Both parameters increase in
absolute value with risk aversion and with the convexity of the production cost function.
A secondary result obtained in the BL model, and emphasized in Ullrich (2005), is that
the coefficients α and γ in equation (1) increase (become less negative and more positive,
respectively) as the wholesale spot price of electricity increases relative to the fixed retail
price of electricity. Expressions in BL (p. 1359) indicate
α = Ω E[St]x-1(E[St] − PR) and (2) γ = 12 Ω xE[St]x-2{xE[St] – (x-1)PR}
where PR is the retail price of electricity, Ω is a parameter that does not depend on prices,
and x is a parameter whose value increases as the convexity of the production function
decreases. BL asserted that 0<x<1 on theoretical grounds and estimated its value to be
about 1/3.
The BL model as summarized in (1) and (2) does not address the question of what
factors cause the variance and skewness of the anticipated distribution of the spot price to
vary. A paper by Routledge, Seppi, and Spatt (2001), hereafter “RSS,” however, supplies the
4
Popova/Douglas: Storage and Electricity Forward Premium
requisite theory. When combined with BL, the RSS model provides testable hypotheses
regarding the relationship between fuel storage, fuel demand, and the electricity forward
premium. The primary purpose of the current paper is to link the RSS model to the BL
model, describe the testable implications of the combined model, and perform the empirical
tests.
The RSS (2001) model extends the model in the earlier Routledge, Seppi, and Spatt
(2000) paper published in the Journal of Finance. It captures cross-commodity price linkages,
and explicitly models the conversion of (storable) natural gas to (non-storable) electricity.
Prices for all commodities in the model are set by competititve market interactions among
risk-neutral agents. Prices of inputs, outputs, and input substitutes are linked through the
chain of production, but they become unlinked when constraints on conversion or storage
bind. Despite symmetric demand shocks, the model is able to generate the
heteroskedasticity, skewness, and reversion characteristics seen in electricity prices.
Constraints upon the supply of natural gas only affect electricity prices when gas would
be burned in the marginal plant in the absence of the constraint, according to RSS. Because
natural gas is often the marginal fuel during periods of high electricity demand, its availability
has the greatest impact upon price spikes. Because the availability of gas storage inventories
can relax a constraint on the availability of gas, the skewness of electricity prices will rise
when gas storage inventories become low or become unavailable for electricity production
(principally because the gas is needed for space-heating). In RSS’s model, however, the
effect of decreased gas inventories on electricity price variance is indeterminate.
To summarize, RSS derive conditions under which increasing the amount of gas in
storage will reduce the skewness of wholesale electricity prices by reducing the probability of
price spikes. In particular, according to RSS an increase in gas storage inventories will
decrease the skewness of the electricity price distribution if gas is the marginal fuel for
electricity production and the space-heating demand for gas is low. Because agents are risk-
neutral in the RSS model, forward prices equal expected spot prices and there is no forward
premium. In contrast, the BL model takes the distribution of spot prices as given, but allows
market participants to be risk-averse, and the forward premium increases with the risk
1 Corresponding to Bessembinder and Lemmon Equation 13, page 1358.
5

Popova/Douglas: Storage and Electricity Forward Premium
aversion of market participants and the positive skewness of the electricity distribution. In
our combined model, we therefore expect that a reduction in gas storage inventories will
increase the forward premium if gas is the marginal fuel and the space-heating demand for
gas is low.
III. Empirical Model
The current paper is the first to provide an empirical test of the effects of natural gas
storage on the electricity forward premium. RSS do not provide any empirical tests of their
model, nor do any empirical tests of this aspect of their model appear in the literature, so far
as we are aware. BL provide simulation results, but no empirical results, to support the
expected signs of the parameters α and γ in equation (1). Longstaff and Wang (2004)
provide some empirical support for the BL model, but their results are not compelling, as
they are based on a regression that employs only 24 observations (one for each hour of the
day). Ullrich (2005) refines the BL model and provides some simulations and empirical
estimates of the production function’s convexity, does not estimate the parameters α and γ
themselves.
Our model of the relationship between the skewness and variance of the electricity price
distribution and the electricity forward premium, equations (1) and (2), is taken from BL.
We build our empirical model of the expected skewness and variance of the electricity price
distribution using standard supply and demand analysis and insights from RSS. Supply and
demand diagrams of electricity markets typically depict a vertical but constantly shifting
demand curve moving against a “hockey-stick” supply curve (i.e., one that is relatively flat
over much of its length, then curves up sharply as production nears system capacity). The
supply curve, while less volatile than the demand curve, moves inward when transmission
lines fail, or when power plants go offline due to failure or scheduled maintenance. As
demand increases or supply decreases the probability of a price spike increases, which
increases both variance and skewness of the electricity price distribution in the standard
supply and demand analysis.
The temperature is the biggest single determinant of the position of the electricity
demand curve. High temperatures in particular raise the demand for electricity, as air
conditioning is nearly entirely powered by electricity. Low ambient temperatures cause a
6

Popova/Douglas: Storage and Electricity Forward Premium
smaller increase in the demand for electricity than do high temperatures because natural gas,
oil, and wood are also widely used for space heating. Low temperatures also increase the
space-heating demand for natural gas, which reduces the availability of natural gas in storage
to ameliorate electricity price spikes, according to RSS. Because of the asymmetrical effects
of high and low temperatures on electricity demand, we use separate measures for Heating
Degree Days (HDD) and Cooling Degree Days (CDD).2 CDD is zero when HDD is
positive, and vice versa. To allow for nonlinear effects, we use a quadratic form (see Engel et
al (1986) for a discussion of this point).
Other factors besides temperature and gas storage inventories affect agents’ perception
of the distribution of electricity spot price, primarily through the supply curve. We do not
attempt to model these, but simply assume that agents will derive some information about
the moments of the future distribution of electricity prices from the moments of its
immediate past distribution and the temperature. Including a measure of the moments of
the distribution in the recent past helps control for the effect of the position of the supply
curve, which does not change position as often as does the demand curve.
Premt = β0 + β1Vart-1(S) + β2Skewt-1(S) + β3GSt-1 +
+ β4(CDDt +τ1CDDt2 ) + β5
(HDDt +τ1HDDt2 ) + (3)
+ β6GSt-1*CDDt + β7GSt-1*HDDt + εt
Table 4: Predicted Effects of Variables on Electricity Price Moments and the Forward Premium Variable Description Effect on
Variance Effect on Skewness (RSS)
Effect on Premium (BL)
Vart-1(S) Recent Variance of Spot Price + 0 − Skewt-1(S) Recent Skewness of Spot Price 0 + + CDD, CDD2 Cooling Degree Days + Large + + HDD, HDD2 Heating Degree Days + Small + + GSt-1
* Beginning Gas Storage Inventories ? − or 0 − or 0* CDD*GSt-1 Interaction of Storage and CDD ? Large − Large − HDD*GSt-1 Interaction of Storage and HDD ? Small − or 0 Small − or 0 * The predicted partial derivative ∂Prem/∂GSt-1 < 0 if gas is the marginal fuel and HDD is low.
Our empirical model, along with the expected signs of derivatives, is summarized in
equation (3) and table 4. Periods of high heating and cooling load (and particularly the
latter) coincide with the periods of greatest risk of price spikes, and hence the greatest
2 Cooling Degree Day = max{0, T - 65}, and Heating Degree Day =max{0, 65 - T }where T is the day’s
average temperature in degrees Fahrenheit.
7
Popova/Douglas: Storage and Electricity Forward Premium
skewness of the anticipated electricity price distribution, hence the predictions in table 4 with
respect to HDD and CDD. Gas storage, according to RSS, should mitigate the risk of price
spikes, which, according to BL, should reduce the forward premium. Inclusion of the
interaction terms GSt-1*HDDt and GSt-1*CDDt in the empirical model allows the effect of
gas storage inventories on electricity price skewness to vary with demand, and for this
variability to depend on whether the increasing demand is due to heating or cooling load.
As RSS point out, gas storage inventories should reduce skewness only when gas is the
marginal fuel and the gas storage capacity is not fully diverted to serving the space heating
market. Note that the combined RSS/BL model provides no prediction on the sign of the
coefficient of GSt-1, β3; it only predicts that the partial derivative
∂Premium/∂GSt-1 = β3 + β6CDDt + β7HDDt
will be weakly negative; i.e., ∂Premium/∂GSt-1 ≤ 0, and that it will be negative when
electricity demand is high and space-heating demand for gas is low (i.e., when CDD>0).
The predictions of the combined RSS/GL model with respect to the interaction
coefficients β6 and β7, however, are quite strong, and indeed are the central predictions of
this research. RSS predicts that the availability of stored gas will reduce anticipated
electricity price skewness when gas-fired plants are the marginal producers, which occurs
primarily when electricity demand is relatively high, so we expect β6<0 and β7 ≤ 0. The
estimate of β6 should be greater than the estimate of β7 in absolute value for at least two
reasons. First, the value of gas for space heating is greater when HDD is high, so increased
gas storage may not be available to serve electricity production when HDD is high. Second,
because the PJM system load peaks in the summer, the skewness of peak-summer prices is
greater than peak-winter prices, which means that the scope for skewness reduction is
greater when CDD is high than when HDD is high, implying a relatively greater marginal
effect of gas storage when CDD is high.
Equation (2), which describes the dependence of α and γ on the expected spot price,
also has implications for our empirical equation (3). Because the values of α and γ rise and
fall with the expected spot price, the estimated coefficients should also rise and fall through
the day as the expected spot price moves through its daily cycle. More specifically, as shown
in table 1 (attached), mean spot prices are highest in the afternoon, and lowest in the early
8
Popova/Douglas: Storage and Electricity Forward Premium
morning hours. Therefore, we expect that the sensitivity of the forward premium to
increases in price variance (i.e., α from equation 1, which corresponds to β1 in equation 3)
should rise to near zero and perhaps even become positive, during the afternoon hours. By
the same token, the sensitivity of the forward premium to increases in skewness should be at
its peak in the afternoon, which means that the effect of CDD, (which is expressed as
β4[1+2τ1CDD] > 0 in equation 3), and the ameliorating effect of gas storage inventory (and
in particular β6 < 0 in equation 3) should increase in magnitude in the afternoon.
IV. Data and Estimates
Data
We estimate the empirical model in equation (3) using market data from the PJM
Interconnection. PJM is a regional transmission organization established in 1997 as the first
auction-based electricity market in the U.S., and the largest bulk power market in the world.
It coordinates the continuous buying and selling of energy in real-time spot and day-ahead
forward markets. PJM electricity prices use a locational marginal-cost pricing (LMP)
methodology, which means that they reflect not only generation supply and demand, but
also physical constraints and other characteristics of the system.
Since June 1, 2000 PJM has offered two basic types of markets in which market
participants can sell and buy electricity. The day-ahead market is a forward market in which
hourly prices are calculated for the next operating day based on demand bids, and generation
supply offers and bids. By 4:00 PM each day, the PJM announces the 24 clearing prices,
production schedules, and trades for the next day’s operation. In the next day’s real-time
market the PJM runs an electronic auction by matching bids and offers, determining market-
clearing prices every five minutes based on actual system operating conditions. Transactions
are settled hourly for both real time (load-weighted average price) and day-ahead markets.
The primary data set for this study consists of hourly real-time spot prices, and hourly
day-ahead forward prices on the PJM Interconnection from January 01, 2001 to December
31, 2004. For each of the 1461 days in the total sample, we have information on the PJM
market average spot and forward prices (quoted in dollars per megawatt hour, $/MWh) for
each of the 24 hours. The market average prices are load-weighted averages over all of the
nodes in the PJM Interconnection, and are provided directly from the PJM web-site:
9
Popova/Douglas: Storage and Electricity Forward Premium
www.pjm.com. Because the coefficients in the model can be expected to change throughout
the day, the data set is divided into 24 separate time series, and separate regressions are
estimated for each hour. Separate treatment of each hour is common in the literature (e.g.,
Longstaff and Wang (2004), Ramanathan et al (1997), Fay et al (2003)).
Our measures of the first, second, and third moments of the expected spot price
distribution (Et-1(St), Vart-1(S) and Skewt-1(S) in equation (4)) are calculated for each hourly
observation using the previous week’s spot price data from the same hour. Thus, Et-1(St) = 17∑i=2
8 St-i; Vart-1(St) = σ̂2 = 16∑i=2
8 (St-i− Et-1(St))2, and Skewt-1(S) = 1
6σ̂3∑i=2 8 (St-i− Et-1(St))3,
where St-i is the spot price from the same hour, i days in the past.
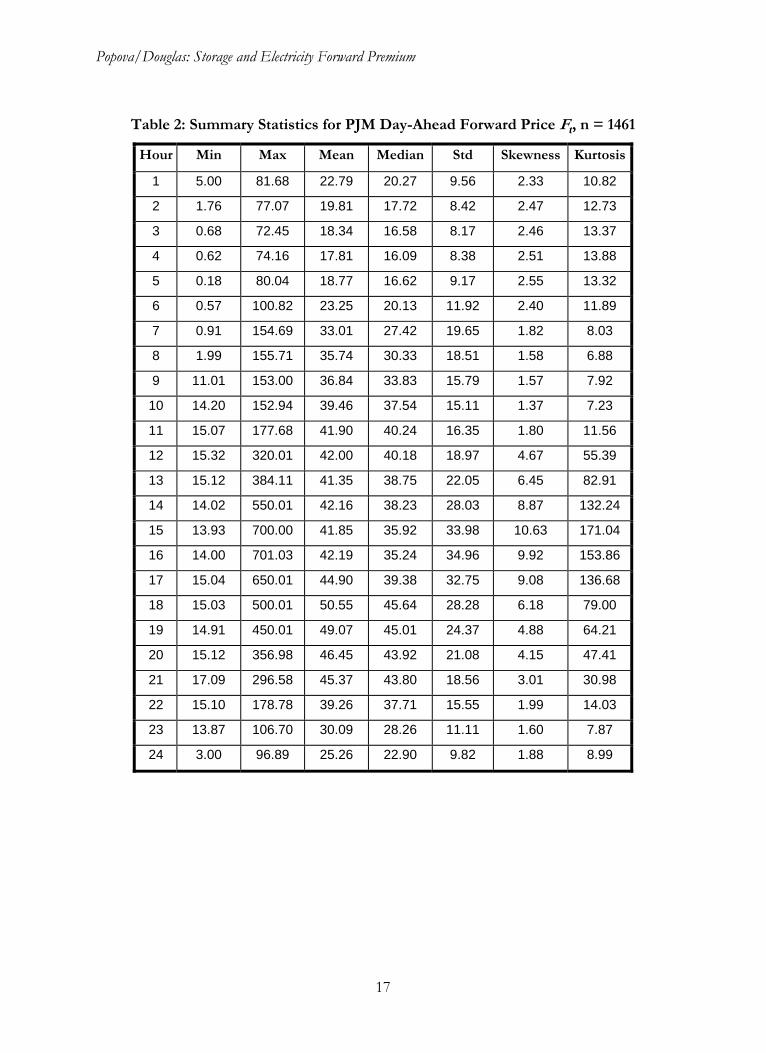
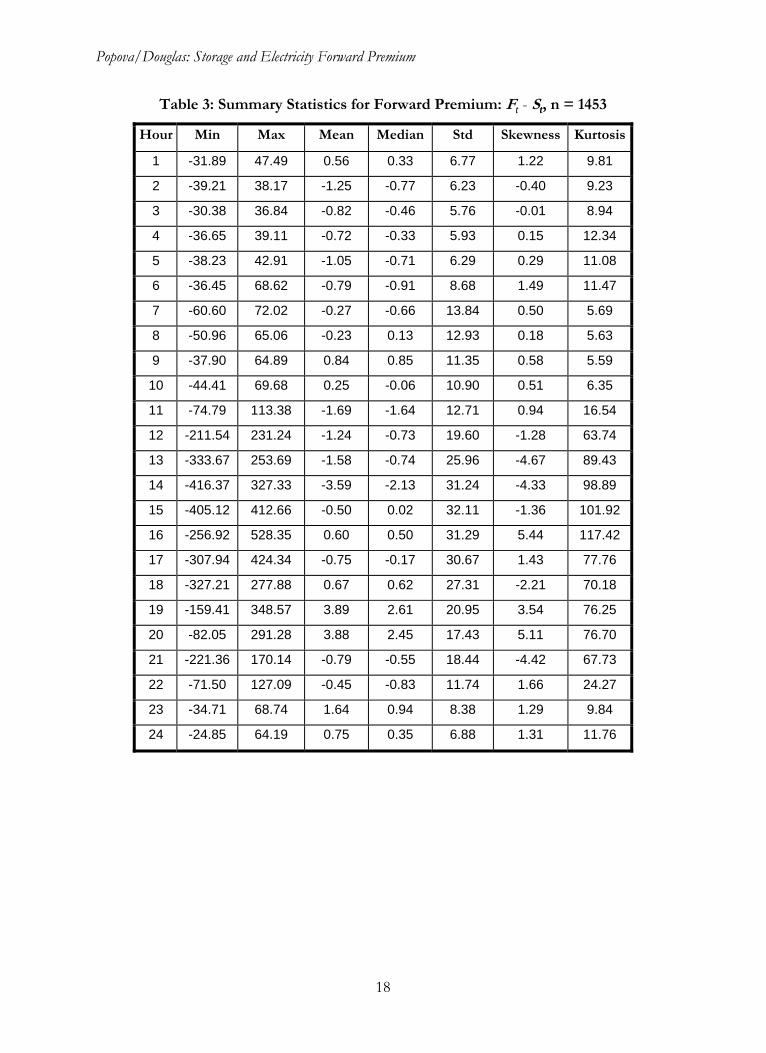
Tables 1-3 display summary statistics for electricity spot and forward prices, and
forward premia for each hour. Both spot and forward prices display significant positive
skewness, and leptokurtosis (fat tails), reflecting the incidence of price spikes. Electricity
price kurtosis, skewness, variance, and mean all vary in a daily cycle, and all are much higher
during the afternoon peak hours. Skewness is positive for both series and all hours.
Forward prices have lower variance, skewness, and kurtosis than spot prices, although their
means are nearly equal. The forward premium is much less skewed (it is in fact negatively
skewed over afternoon hours) and less leptokurtic than either price distribution. The mean
and median forward premium are both slightly negative in most hours, but the mean is less
than 0.2 standard errors from zero in all cases.
Our gas storage data are weekly data on the “Eastern Consumption Region” from the
Energy Information Administration. Before March 15, 2002, the storage data are estimated
by the EIA based on both EIA monthly survey data and AGA weekly survey data; after that
date, they are from the EIA weekly survey, EIA-912, “Weekly Underground Natural Gas
Storage Report.” The Heating Degree Day (HDD) and Cooling Degree Day (CDD) data
are averages, based on 24 hourly readings per day, from 13 weather stations located in the
PJM Interconnection. They are taken from Global Summary of the Day (GSOD) database
archived by the National Climatic Data Center (NCDC), and compiled by the University of
Dayton. After consulting with a professional utility load forecaster, we used day-ahead
measures of heating and cooling degree days, because peak heating and cooling load tend to
lag heating and cooling degree days.
10

Popova/Douglas: Storage and Electricity Forward Premium
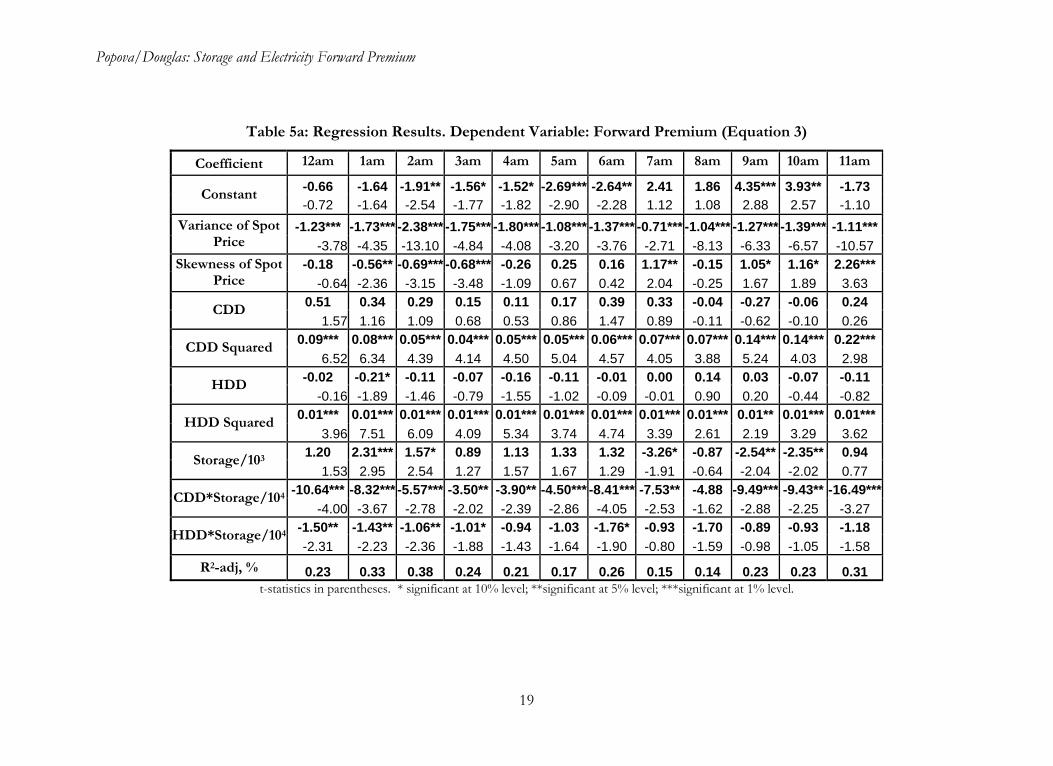
Regression Results
We estimate equation (3) using Ordinary Least Squares and report the results in tables
5a and 5b. Hypothesis tests used the Newey-West covariance matrix, which is robust to
heteroskedasticity and serial correlation. Adjusted R2 statistics suggest a reasonably good fit
of the regression over the entire period and for most hours, particularly during the crucial
afternoon hours when peak prices become more likely.
The results generally support the model’s important predictions, with correct and
statistically significant signs and a daily pattern that is consistent with the implications of
equation (2). The estimated effect of increased variance (α) is negative and statistically
significant in all hours, but it shows a distinct daily cyclical pattern that rises and falls with
the average spot price, as predicted in equation (2). Positive and significant coefficients on
CDD2 indicate that high temperatures drive the premium higher, as predicted, and as
predicted the effect is greater in the afternoon hours when spot prices are higher and
skewness is greater. The effect of HDD is much smaller than that of CDD, and does not
exhibit a strong daily pattern, which is also consistent with the predictions of the model.
Figure 1 provides a graphical illustration of the estimated effects of CDD (β4+2β4τ1CDD)
and HDD (β5+2β5τ2HDD) at different times of day, holding storage constant. Increased
CDD strongly increases the premium, especially in the afternoon, while increased HDD has
a smaller effect that does not vary through the day.
The novel predictions of the model in this paper, however, have to do with the effect of
natural gas storage inventories. Again, the empirical results strongly support the theoretical
predictions. The coefficient of the interaction term between CDD and storage is negative in
all 24 hours (and is statistically significant in 23 hours), supporting the hypothesis that gas
storage inventories significantly reduce the forward premium in a way that is consistent with
the RSS/BL model. The coefficients also follow the predicted daily pattern, being largest in
magnitude when the expected spot prices and skewness are highest. The HDD*Storage
coefficient estimates indicate a much smaller impact of heating load, as predicted by the RSS
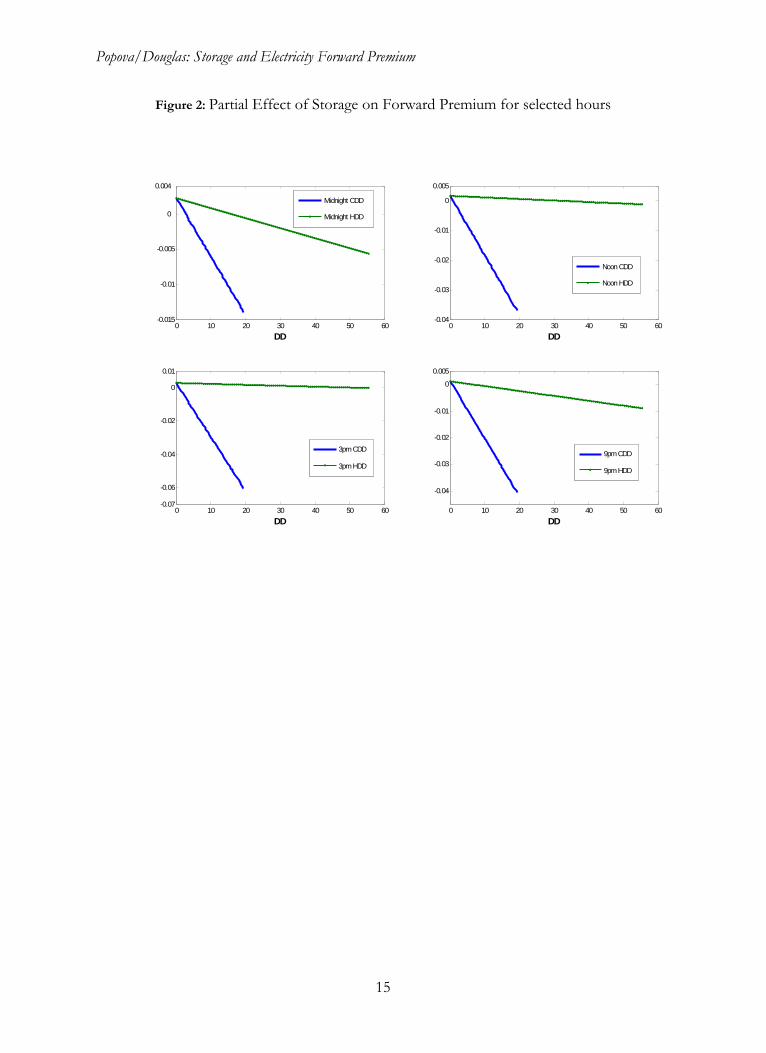
model. Figure 2 illustrates these results graphically, showing how ∂Premium/∂GSt-1 = β3 +
β6CDD + β7HDD falls as CDD and HDD increase separately for different times of day.
The total effect of storage is greater for CDD than HDD, and greatest in the afternoon.
11
Popova/Douglas: Storage and Electricity Forward Premium
V. Conclusions
This paper makes a case that any model of the electricity premium is incomplete unless
it includes information about natural gas storage inventories. Our model of the effect of gas
storage on the electricity forward premium combines the insights of Bessembinder and
Lemmon (2002) with those of Routledge, Seppi, and Spatt (2001). Our empirical results
reinforce and confirm the results reported in Longstaff and Wang (2004), while offering a
methodological improvement. Furthermore, they go beyond Bessembider and Lemmon and
Longstaff and Wang by showing strong support for the proposition that the availability of
stored gas has a measurable effect on the electricity forward premium, and that information
about gas storage inventories adds information to electricity price analysis beyond the
information available from the electricity price data series itself.
We have focused on the storage of natural gas in this study primarily because natural gas
is the marginal fuel during peak-demand periods (and because data are relatively easily
available on natural gas storage). An obvious avenue for further study is to determine the
effect of storage of other fuels on electricity prices, and to look for empirical confirmation of
some of the other implications of inter-commodity linkages modeled by Routledge, Seppi,
and Spatt.
Because the electricity forward premium is intimately related to the likelihood of
electricity price spikes, our explicit incorporation of natural gas storage information into the
model of electricity forward premia raises the possibility that we may be able to improve our
ability to forecast electricity price spikes. Clearly, we are far from this goal, but we believe
that this paper provides a significant encouragement for further study in this direction.
References
Bessembinder, H., and M. Lemmon (2002), “Equilibrium Pricing and Optimal Hedging in
Electricity Forward Markets,” Journal of Finance 57(3), 1347-82.
Engel, R. F., Granger, C. W. J., Rice, J., and A. Weiss (1986). “Semiparametric Estimates of
the Relationship Between Weather and Electricity,” Journal of American Statistical
Association 81(394), 310-320
12

Popova/Douglas: Storage and Electricity Forward Premium
Fay, D., Ringwood, J., Condon, M. and M. Kelly (2003), ‘24-Hour Electrical Load Data – a
Sequential or Parallel Time Series?’ Journal of Neurocomputing
Kaldor, Nicholas (1939), “Speculation and Economic Stability,” Review of Economic Studies 7,
1–27.
Longstaff, F.A., and A.W. Wang (2004). “Electricity Forward Prices: A High-Frequency
Empirical Analysis”. Journal of Finance 59(4): 1877-1901.
Ramanathan, R, Engel R., and C. W. J. Granger, and F. V. Araghi (1997), “Short-Run
Forecast of Electricity Load and Peaks”. International Journal of Forecasting 13, 161-174
Routledge, S., D.J. Seppi, and C.S. Spatt (2000), “Equilibrium Forward Curves for
Commodities,” Journal of Finance 55, 1297-338
Routledge, S., D.J. Seppi, and C.S. Spatt (2001). “The "Spark Spread": An Equilibrium
Model of Cross-Commodity Price Relationship in Electricity”. Working paper. Carnegie
Mellon University.
Ullrich, Carl J. “Constrained Capacity and Equilibrium Forward Premia in Electricity
Markets” (Nov. 18, 2005). Available at SSRN: http://ssrn.com/abstract=923082.
Working, Holbrook (1948), Theory of the inverse carrying charge in futures markets, Journal
of Farm Economics 30, 1–28.
13

Popova/Douglas: Storage and Electricity Forward Premium
Figure 1: Partial effect of CDD and HDD on Forward Premium for selected hour.
0 10 20-5
0
5
10
15
20
25
CDD
Partial Effect of CDD and HDD on Forward Premium1
12
15
20
0 28 56-0.5
0
0.5
1
1.5
HDD
1
6
12
15
20
14
Popova/Douglas: Storage and Electricity Forward Premium
Figure 2: Partial Effect of Storage on Forward Premium for selected hours
0 10 20 30 40 50 60-0.015
-0.01
-0.005
0
0.004
DD
Midnight CDD
Midnight HDD
0 10 20 30 40 50 60-0.04
-0.03
-0.02
-0.01
0
0.005
DD
Noon CDD
Noon HDD
0 10 20 30 40 50 60-0.07
-0.06
-0.04
-0.02
0
0.01
DD
3pm CDD
3pm HDD
0 10 20 30 40 50 60
-0.04
-0.03
-0.02
-0.01
0
0.005
DD
9pm CDD
9pm HDD
15

Popova/Douglas: Storage and Electricity Forward Premium
Table 1: Summary Statistics for PJM Real-Time Spot Electricity Price St, n = 1461
Hour Min Max Mean Median Std Skewness Kurtosis
1 1.29 100.12 22.23 18.61 11.65 2.31 10.95
2 -5.80 128.94 21.08 17.48 12.08 2.52 13.30
3 -3.75 94.58 19.17 16.51 11.37 2.77 14.46
4 -4.62 106.33 18.53 16.10 11.11 3.06 17.68
5 -1.94 125.07 19.81 16.76 12.00 3.31 18.87
6 0.56 139.70 24.03 19.62 13.96 2.33 11.27
7 0.93 152.13 33.21 26.70 22.31 1.73 6.81
8 0.71 166.40 35.92 28.75 23.32 1.76 7.00
9 6.20 180.12 35.92 31.04 19.36 1.81 8.15
10 13.83 142.46 39.15 35.02 19.26 1.50 6.30
11 13.72 210.99 43.54 39.81 21.68 1.54 7.80
12 12.89 623.01 43.23 38.18 30.26 8.91 151.50
13 12.90 916.68 42.91 36.25 40.31 13.38 262.45
14 9.42 931.43 45.73 38.61 46.50 11.27 180.20
15 8.53 931.53 42.34 33.49 47.38 11.89 198.14
16 10.23 931.93 41.57 32.23 45.61 11.51 187.90
17 11.83 932.27 45.58 37.83 47.54 11.48 186.88
18 6.23 932.25 49.77 42.77 43.49 11.80 224.53
19 6.81 692.92 45.05 38.75 31.21 7.22 131.77
20 5.49 375.45 42.47 37.64 23.95 2.96 29.87
21 13.47 909.08 46.06 41.63 32.63 13.53 340.81
22 13.50 325.04 39.65 35.09 20.88 2.76 27.65
23 9.47 112.53 28.43 24.66 13.25 1.80 7.73
24 0.78 109.91 24.45 20.43 11.82 2.13 9.94
16
Popova/Douglas: Storage and Electricity Forward Premium
Table 2: Summary Statistics for PJM Day-Ahead Forward Price Ft, n = 1461
Hour Min Max Mean Median Std Skewness Kurtosis
1 5.00 81.68 22.79 20.27 9.56 2.33 10.82
2 1.76 77.07 19.81 17.72 8.42 2.47 12.73
3 0.68 72.45 18.34 16.58 8.17 2.46 13.37
4 0.62 74.16 17.81 16.09 8.38 2.51 13.88
5 0.18 80.04 18.77 16.62 9.17 2.55 13.32
6 0.57 100.82 23.25 20.13 11.92 2.40 11.89
7 0.91 154.69 33.01 27.42 19.65 1.82 8.03
8 1.99 155.71 35.74 30.33 18.51 1.58 6.88
9 11.01 153.00 36.84 33.83 15.79 1.57 7.92
10 14.20 152.94 39.46 37.54 15.11 1.37 7.23
11 15.07 177.68 41.90 40.24 16.35 1.80 11.56
12 15.32 320.01 42.00 40.18 18.97 4.67 55.39
13 15.12 384.11 41.35 38.75 22.05 6.45 82.91
14 14.02 550.01 42.16 38.23 28.03 8.87 132.24
15 13.93 700.00 41.85 35.92 33.98 10.63 171.04
16 14.00 701.03 42.19 35.24 34.96 9.92 153.86
17 15.04 650.01 44.90 39.38 32.75 9.08 136.68
18 15.03 500.01 50.55 45.64 28.28 6.18 79.00
19 14.91 450.01 49.07 45.01 24.37 4.88 64.21
20 15.12 356.98 46.45 43.92 21.08 4.15 47.41
21 17.09 296.58 45.37 43.80 18.56 3.01 30.98
22 15.10 178.78 39.26 37.71 15.55 1.99 14.03
23 13.87 106.70 30.09 28.26 11.11 1.60 7.87
24 3.00 96.89 25.26 22.90 9.82 1.88 8.99
17
Popova/Douglas: Storage and Electricity Forward Premium
Table 3: Summary Statistics for Forward Premium: Ft - St, n = 1453
Hour Min Max Mean Median Std Skewness Kurtosis
1 -31.89 47.49 0.56 0.33 6.77 1.22 9.81
2 -39.21 38.17 -1.25 -0.77 6.23 -0.40 9.23
3 -30.38 36.84 -0.82 -0.46 5.76 -0.01 8.94
4 -36.65 39.11 -0.72 -0.33 5.93 0.15 12.34
5 -38.23 42.91 -1.05 -0.71 6.29 0.29 11.08
6 -36.45 68.62 -0.79 -0.91 8.68 1.49 11.47
7 -60.60 72.02 -0.27 -0.66 13.84 0.50 5.69
8 -50.96 65.06 -0.23 0.13 12.93 0.18 5.63
9 -37.90 64.89 0.84 0.85 11.35 0.58 5.59
10 -44.41 69.68 0.25 -0.06 10.90 0.51 6.35
11 -74.79 113.38 -1.69 -1.64 12.71 0.94 16.54
12 -211.54 231.24 -1.24 -0.73 19.60 -1.28 63.74
13 -333.67 253.69 -1.58 -0.74 25.96 -4.67 89.43
14 -416.37 327.33 -3.59 -2.13 31.24 -4.33 98.89
15 -405.12 412.66 -0.50 0.02 32.11 -1.36 101.92
16 -256.92 528.35 0.60 0.50 31.29 5.44 117.42
17 -307.94 424.34 -0.75 -0.17 30.67 1.43 77.76
18 -327.21 277.88 0.67 0.62 27.31 -2.21 70.18
19 -159.41 348.57 3.89 2.61 20.95 3.54 76.25
20 -82.05 291.28 3.88 2.45 17.43 5.11 76.70
21 -221.36 170.14 -0.79 -0.55 18.44 -4.42 67.73
22 -71.50 127.09 -0.45 -0.83 11.74 1.66 24.27
23 -34.71 68.74 1.64 0.94 8.38 1.29 9.84
24 -24.85 64.19 0.75 0.35 6.88 1.31 11.76
18
Popova/Douglas: Storage and Electricity Forward Premium
Table 5a: Regression Results. Dependent Variable: Forward Premium (Equation 3)
Coefficient 12am 1am 2am 3am 4am 5am 6am 7am 8am 9am 10am 11am
-0.66 -1.64 -1.91** -1.56* -1.52* -2.69*** -2.64** 2.41 1.86 4.35*** 3.93** -1.73 Constant -0.72 -1.64 -2.54 -1.77 -1.82 -2.90 -2.28 1.12 1.08 2.88 2.57 -1.10
-1.23*** -1.73*** -2.38*** -1.75*** -1.80*** -1.08*** -1.37*** -0.71*** -1.04*** -1.27*** -1.39*** -1.11***Variance of Spot Price -3.78 -4.35 -13.10 -4.84 -4.08 -3.20 -3.76 -2.71 -8.13 -6.33 -6.57 -10.57
-0.18 -0.56** -0.69*** -0.68*** -0.26 0.25 0.16 1.17** -0.15 1.05* 1.16* 2.26***Skewness of Spot Price -0.64 -2.36 -3.15 -3.48 -1.09 0.67 0.42 2.04 -0.25 1.67 1.89 3.63
0.51 0.34 0.29 0.15 0.11 0.17 0.39 0.33 -0.04 -0.27 -0.06 0.24 CDD 1.57 1.16 1.09 0.68 0.53 0.86 1.47 0.89 -0.11 -0.62 -0.10 0.26
0.09*** 0.08*** 0.05*** 0.04*** 0.05*** 0.05*** 0.06*** 0.07*** 0.07*** 0.14*** 0.14*** 0.22***CDD Squared 6.52 6.34 4.39 4.14 4.50 5.04 4.57 4.05 3.88 5.24 4.03 2.98
-0.02 -0.21* -0.11 -0.07 -0.16 -0.11 -0.01 0.00 0.14 0.03 -0.07 -0.11 HDD -0.16 -1.89 -1.46 -0.79 -1.55 -1.02 -0.09 -0.01 0.90 0.20 -0.44 -0.82
0.01*** 0.01*** 0.01*** 0.01*** 0.01*** 0.01*** 0.01*** 0.01*** 0.01*** 0.01** 0.01*** 0.01***HDD Squared 3.96 7.51 6.09 4.09 5.34 3.74 4.74 3.39 2.61 2.19 3.29 3.62
1.20 2.31*** 1.57* 0.89 1.13 1.33 1.32 -3.26* -0.87 -2.54** -2.35** 0.94 Storage/103 1.53 2.95 2.54 1.27 1.57 1.67 1.29 -1.91 -0.64 -2.04 -2.02 0.77
-10.64*** -8.32*** -5.57*** -3.50** -3.90** -4.50*** -8.41*** -7.53** -4.88 -9.49*** -9.43** -16.49***CDD*Storage/104
-4.00 -3.67 -2.78 -2.02 -2.39 -2.86 -4.05 -2.53 -1.62 -2.88 -2.25 -3.27 -1.50** -1.43** -1.06** -1.01* -0.94 -1.03 -1.76* -0.93 -1.70 -0.89 -0.93 -1.18 HDD*Storage/104
-2.31 -2.23 -2.36 -1.88 -1.43 -1.64 -1.90 -0.80 -1.59 -0.98 -1.05 -1.58 R2-adj, % 0.23 0.33 0.38 0.24 0.21 0.17 0.26 0.15 0.14 0.23 0.23 0.31
t-statistics in parentheses. * significant at 10% level; **significant at 5% level; ***significant at 1% level.
19

Popova/Douglas: Storage and Electricity Forward Premium
Table 4b: Regression Results. Dependent Variable: Forward Premium (Equation 3)
Coefficient Noon 1pm 2pm 3pm 4pm 5pm 6pm 7pm 8pm 9pm 10pm 11pm
-2.60 -5.09*** -8.27*** -2.24 -4.69* -9.28*** -3.71* 2.32 5.06** -1.89 -0.53 0.27 Constant -1.63 -2.84 -3.90 -0.96 -1.84 -3.93 -1.90 1.03 2.77 -0.98 -0.35 0.22
-0.29*** -0.19*** -0.19*** -0.13*** -0.13*** -0.12*** -0.14*** -0.22*** -0.45*** -0.19*** -0.59*** -1.44***Variance of Spot Price -19.15 -15.17 -8.47 -2.91 -7.31 -5.77 -8.30 -13.75 -11.50 -12.73 -6.88 -3.03
1.15 1.13 0.93 1.17 1.33 2.08** 3.52*** 3.32*** 1.73** 0.86 0.70 0.84* Skewness of Spot Price 1.57 0.93 0.82 1.05 1.35 2.24 3.28 3.89 2.36 1.34 1.21 1.76
-0.50 -0.24 -0.99 -2.97 -3.26 -1.60 -1.95 -0.86 -0.09 0.06 -0.86 0.37 CDD -0.31 -0.12 -0.33 -0.82 -0.86 -0.47 -0.81 -0.42 -0.06 0.06 -1.00 0.91 0.33** 0.40** 0.54** 0.71** 0.73** 0.64** 0.52** 0.37** 0.33** 0.26*** 0.18*** 0.14***CDD Squared 2.42 2.33 2.05 2.13 2.23 2.15 2.45 2.19 2.30 3.22 2.86 5.27 -0.24 -0.29 -0.22 -0.33 -0.24 -0.03 0.06 -0.56** -0.04 0.05 -0.18 0.03 HDD -1.49 -1.63 -1.11 -1.41 -1.05 -0.12 0.30 -2.56 -0.22 0.36 -1.27 0.24
0.01*** 0.01*** 0.01** 0.01** 0.01** 0.01*** 0.01*** 0.02*** 0.01*** 0.01** 0.01*** 0.01** HDD Squared 2.63 2.80 1.96 2.30 2.27 2.83 2.73 3.42 2.51 2.75 2.76 2.35 1.68 3.88** 5.27*** 2.98 4.86** 6.47*** 2.99 -1.32 -4.22** 1.27 1.31 1.38 Storage/103
1.18 2.20 2.70 1.35 2.28 3.27 1.54 -0.72 -2.46 0.88 1.15 1.45 -19.94*** -26.96*** -31.98*** -32.49** -27.55** -33.28*** -21.56** -16.85** -18.97*** -21.51*** -6.09 -12.43***CDD*Storage/104
-3.06 -3.06 -2.85 -2.54 -2.23 -2.76 -2.28 -2.13 -3.46 -4.46 -1.47 -4.39 -0.51 -0.74 -0.66 -0.55 -0.99 -2.58*** -3.36*** 1.17 -0.12 -1.83** -0.93 -1.51**HDD*Storage/104
-0.59 -0.75 -0.76 -0.59 -1.03 -2.61 -2.93 1.17 -0.11 -2.11 -1.25 -2.02 R2-adj, % 0.54 0.62 0.53 0.38 0.39 0.43 0.49 0.40 0.39 0.58 0.28 0.24
t-statistics are in parentheses. * significant at 10% level; **significant at 5% level; ***significant at 1% level.
20