stonecrest estates sewage treatment plant 2019 annual report
TRANSCRIPT
0
2019
The Corporation of the City of
Quinte West
Public Works and Environmental Services
Stonecrest Estates Sewage Treatment Plant 2019 Annual Report
The Corporation of the City of Quinte West Public Works and Environmental Services
Water/Wastewater Division Stonecrest Estates Sewage Treatment Plant Annual Report
1
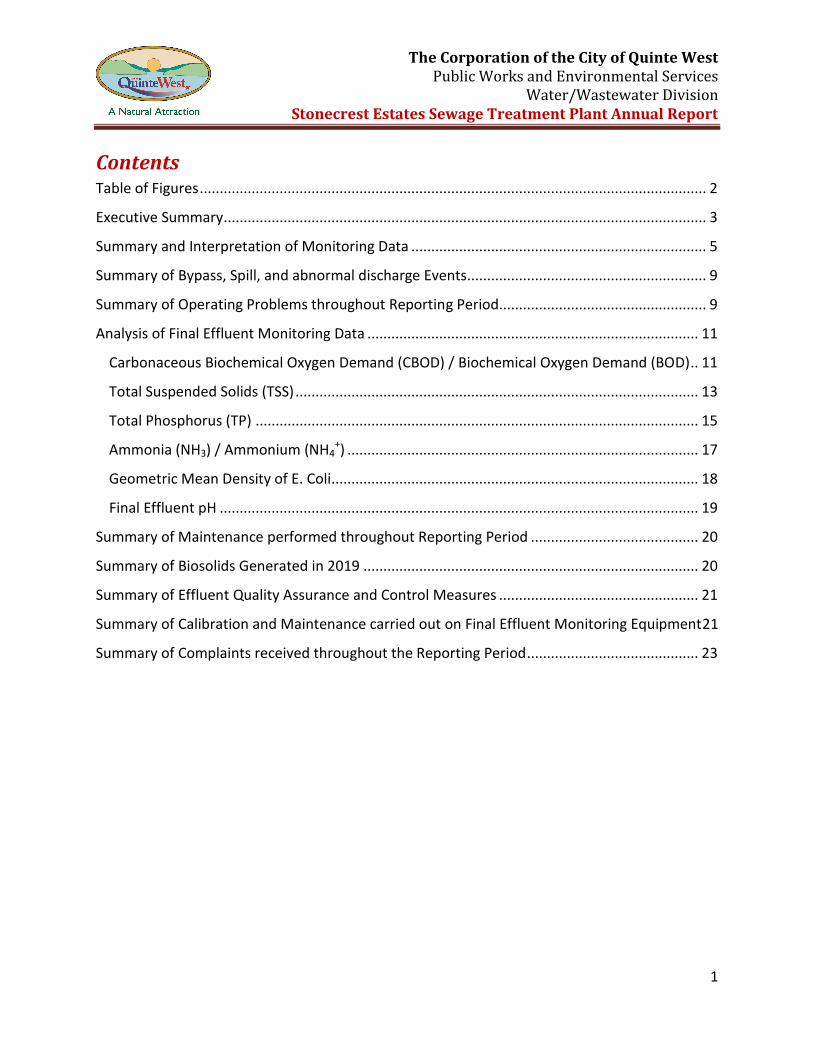
Contents Table of Figures ............................................................................................................................... 2
Executive Summary ......................................................................................................................... 3
Summary and Interpretation of Monitoring Data .......................................................................... 5
Summary of Bypass, Spill, and abnormal discharge Events............................................................ 9
Summary of Operating Problems throughout Reporting Period.................................................... 9
Analysis of Final Effluent Monitoring Data ................................................................................... 11
Carbonaceous Biochemical Oxygen Demand (CBOD) / Biochemical Oxygen Demand (BOD) .. 11
Total Suspended Solids (TSS) ..................................................................................................... 13
Total Phosphorus (TP) ............................................................................................................... 15
Ammonia (NH3) / Ammonium (NH4+) ........................................................................................ 17
Geometric Mean Density of E. Coli ............................................................................................ 18
Final Effluent pH ........................................................................................................................ 19
Summary of Maintenance performed throughout Reporting Period .......................................... 20
Summary of Biosolids Generated in 2019 .................................................................................... 20
Summary of Effluent Quality Assurance and Control Measures .................................................. 21
Summary of Calibration and Maintenance carried out on Final Effluent Monitoring Equipment21
Summary of Complaints received throughout the Reporting Period ........................................... 23
The Corporation of the City of Quinte West Public Works and Environmental Services
Water/Wastewater Division Stonecrest Estates Sewage Treatment Plant Annual Report
2
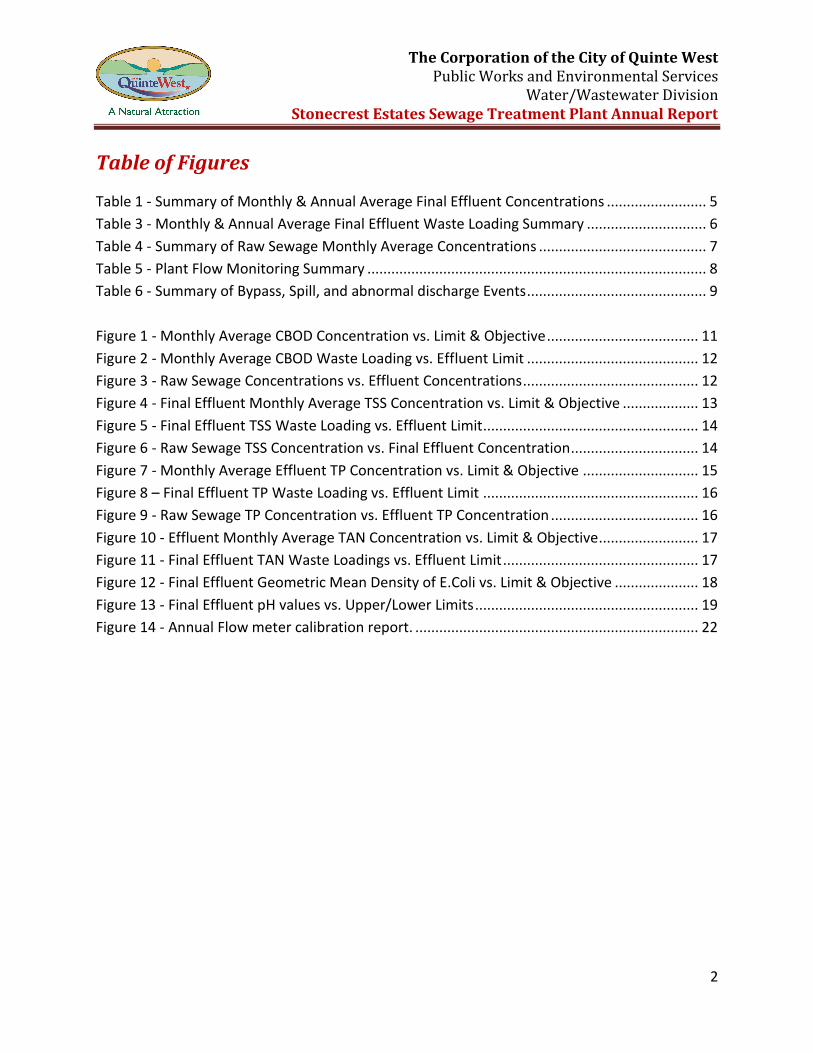
Table of Figures
Table 1 - Summary of Monthly & Annual Average Final Effluent Concentrations ......................... 5
Table 3 - Monthly & Annual Average Final Effluent Waste Loading Summary .............................. 6
Table 4 - Summary of Raw Sewage Monthly Average Concentrations .......................................... 7
Table 5 - Plant Flow Monitoring Summary ..................................................................................... 8
Table 6 - Summary of Bypass, Spill, and abnormal discharge Events ............................................. 9
Figure 1 - Monthly Average CBOD Concentration vs. Limit & Objective ...................................... 11
Figure 2 - Monthly Average CBOD Waste Loading vs. Effluent Limit ........................................... 12
Figure 3 - Raw Sewage Concentrations vs. Effluent Concentrations ............................................ 12
Figure 4 - Final Effluent Monthly Average TSS Concentration vs. Limit & Objective ................... 13
Figure 5 - Final Effluent TSS Waste Loading vs. Effluent Limit ...................................................... 14
Figure 6 - Raw Sewage TSS Concentration vs. Final Effluent Concentration ................................ 14
Figure 7 - Monthly Average Effluent TP Concentration vs. Limit & Objective ............................. 15
Figure 8 – Final Effluent TP Waste Loading vs. Effluent Limit ...................................................... 16
Figure 9 - Raw Sewage TP Concentration vs. Effluent TP Concentration ..................................... 16
Figure 10 - Effluent Monthly Average TAN Concentration vs. Limit & Objective......................... 17
Figure 11 - Final Effluent TAN Waste Loadings vs. Effluent Limit ................................................. 17
Figure 12 - Final Effluent Geometric Mean Density of E.Coli vs. Limit & Objective ..................... 18
Figure 13 - Final Effluent pH values vs. Upper/Lower Limits ........................................................ 19
Figure 14 - Annual Flow meter calibration report. ....................................................................... 22
The Corporation of the City of Quinte West Public Works and Environmental Services
Water/Wastewater Division Stonecrest Estates Sewage Treatment Plant Annual Report
3
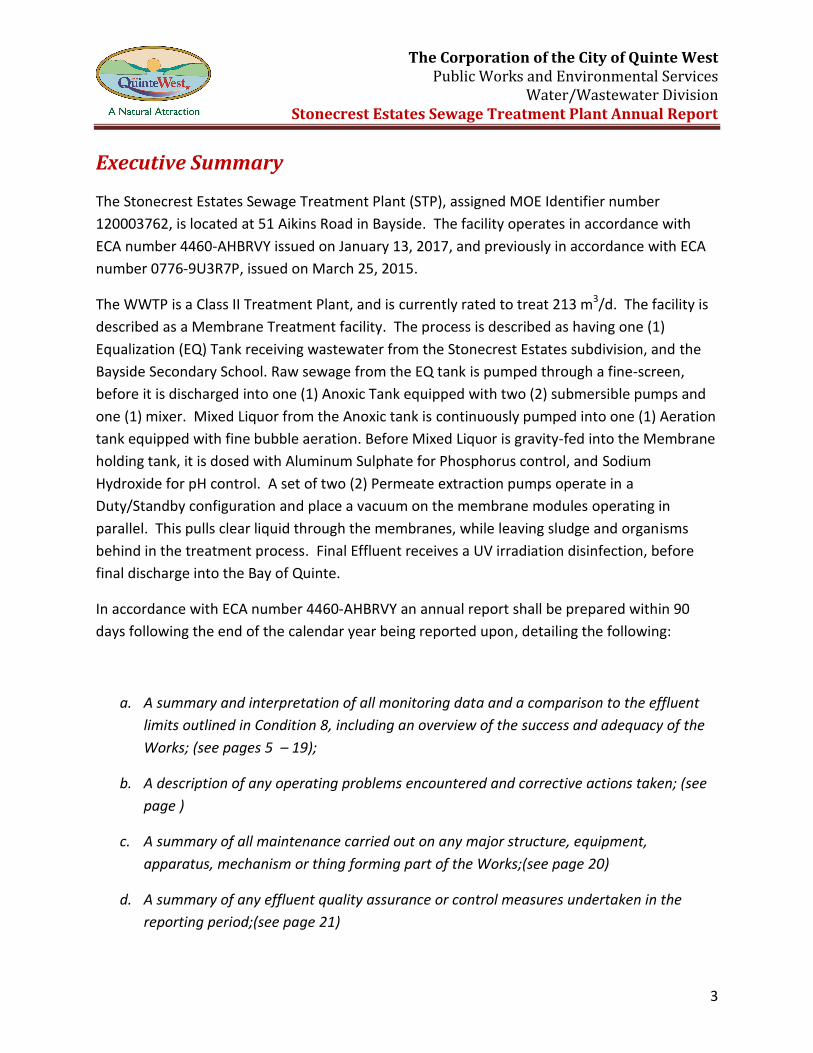
Executive Summary
The Stonecrest Estates Sewage Treatment Plant (STP), assigned MOE Identifier number
120003762, is located at 51 Aikins Road in Bayside. The facility operates in accordance with
ECA number 4460-AHBRVY issued on January 13, 2017, and previously in accordance with ECA
number 0776-9U3R7P, issued on March 25, 2015.
The WWTP is a Class II Treatment Plant, and is currently rated to treat 213 m3/d. The facility is
described as a Membrane Treatment facility. The process is described as having one (1)
Equalization (EQ) Tank receiving wastewater from the Stonecrest Estates subdivision, and the
Bayside Secondary School. Raw sewage from the EQ tank is pumped through a fine-screen,
before it is discharged into one (1) Anoxic Tank equipped with two (2) submersible pumps and
one (1) mixer. Mixed Liquor from the Anoxic tank is continuously pumped into one (1) Aeration
tank equipped with fine bubble aeration. Before Mixed Liquor is gravity-fed into the Membrane
holding tank, it is dosed with Aluminum Sulphate for Phosphorus control, and Sodium
Hydroxide for pH control. A set of two (2) Permeate extraction pumps operate in a
Duty/Standby configuration and place a vacuum on the membrane modules operating in
parallel. This pulls clear liquid through the membranes, while leaving sludge and organisms
behind in the treatment process. Final Effluent receives a UV irradiation disinfection, before
final discharge into the Bay of Quinte.
In accordance with ECA number 4460-AHBRVY an annual report shall be prepared within 90
days following the end of the calendar year being reported upon, detailing the following:
a. A summary and interpretation of all monitoring data and a comparison to the effluent
limits outlined in Condition 8, including an overview of the success and adequacy of the
Works; (see pages 5 – 19);
b. A description of any operating problems encountered and corrective actions taken; (see
page )
c. A summary of all maintenance carried out on any major structure, equipment,
apparatus, mechanism or thing forming part of the Works;(see page 20)
d. A summary of any effluent quality assurance or control measures undertaken in the
reporting period;(see page 21)

The Corporation of the City of Quinte West Public Works and Environmental Services
Water/Wastewater Division Stonecrest Estates Sewage Treatment Plant Annual Report
4
e. A summary of the calibration and maintenance carried out on all effluent monitoring
equipment; (see page 21) and,
f. A description of efforts made and results achieved in meeting the Effluent Objectives of
Condition 7. (see pages 5 – 19)
g. A tabulation of the volume of sludge generated in the reporting period and an outline of
anticipated volumes to be generated in the next reporting period and a summary of the
locations to where the sludge was disposed; (see page 20);
h. A summary of any complaints received during the reporting period and any steps taken
to address the complaints;(see page 23);
i. A summary of all by-pass, spill or abnormal discharge events; (see page 9);
j. A copy of all Notice of Modifications submitted to the Water Supervisor as a result of
Schedule B, Section 1, with a status report on the implementation of each modification;
(Not applicable);
k. A report summarizing all modifications completed as a result of Schedule B, Section 3;
(Not applicable); and,
l. Any other information the Water Supervisor requires from time to time.

The Corporation of the City of Quinte West Public Works and Environmental Services
Water/Wastewater Division Stonecrest Estates Sewage Treatment Plant Annual Report
5
Summary and Interpretation of Monitoring Data
Summary of Final Effluent Monthly Average & Annual Average Concentrations
Month
CBOD Monthly Average Concentration (mg/L) Objective: 5.0 mg/L
TSS Monthly Average Concentration (mg/L) Objective: 5.0 mg/L
TP Monthly Average Concentration (mg/L) Objective: 0.1 mg/L
TAN Monthly Average Concentration (mg/L) Objective: 2.0 mg/L
Geometric Mean Density of E.Coli (cfu/100mL) Objective: 150 cfu/100mL
Temperature (deg.C)
pH
Limit: 10.0 mg/L Limit: 10.0 mg/L Limit: 0.2 mg/L Limit: 3.0 mg/L Limit: 200 cfu/100mL
No Limit MIN Limit: 6.0
MAX Limit: 9.5
January 2.2 2.0 0.11 0.10 2.0 11.5 7.01 7.71
February 3.0 2.0 0.13 0.10 2.0 12.0 6.97 7.50
March 2.0 2.0 0.09 0.10 2.0 17.6 6.98 7.44
April 3.0 2.0 0.05 0.88 2.0 13.9 6.98 7.64
May 6.9 19.7 0.37 0.16 2.0 15.5 6.66 7.40
June 2.0 7.0 0.04 0.10 2.0 20.0 6.71 7.24
July 2.4 2.4 0.06 0.10 2.0 23.2 6.89 7.86
August 2.0 2.3 0.04 0.13 2.0 23.5 6.75 7.12
September 2.0 2.3 0.06 0.13 2.0 20.9 6.59 6.93
October 2.0 2.0 0.06 0.10 2.0 19.5 6.70 7.25
November 2.0 2.0 0.03 0.10 2.0 16.2 6.62 7.34
December 2.0 2.2 0.03 0.12 2.0 13.4 6.49 7.05
Annual Average 2.6 4.0 0.09 0.18 2.0 17.3 6.8 7.4 Table 1 - Summary of Monthly & Annual Average Final Effluent Concentrations
The Corporation of the City of Quinte West Public Works and Environmental Services
Water/Wastewater Division Stonecrest Estates Sewage Treatment Plant Annual Report
6
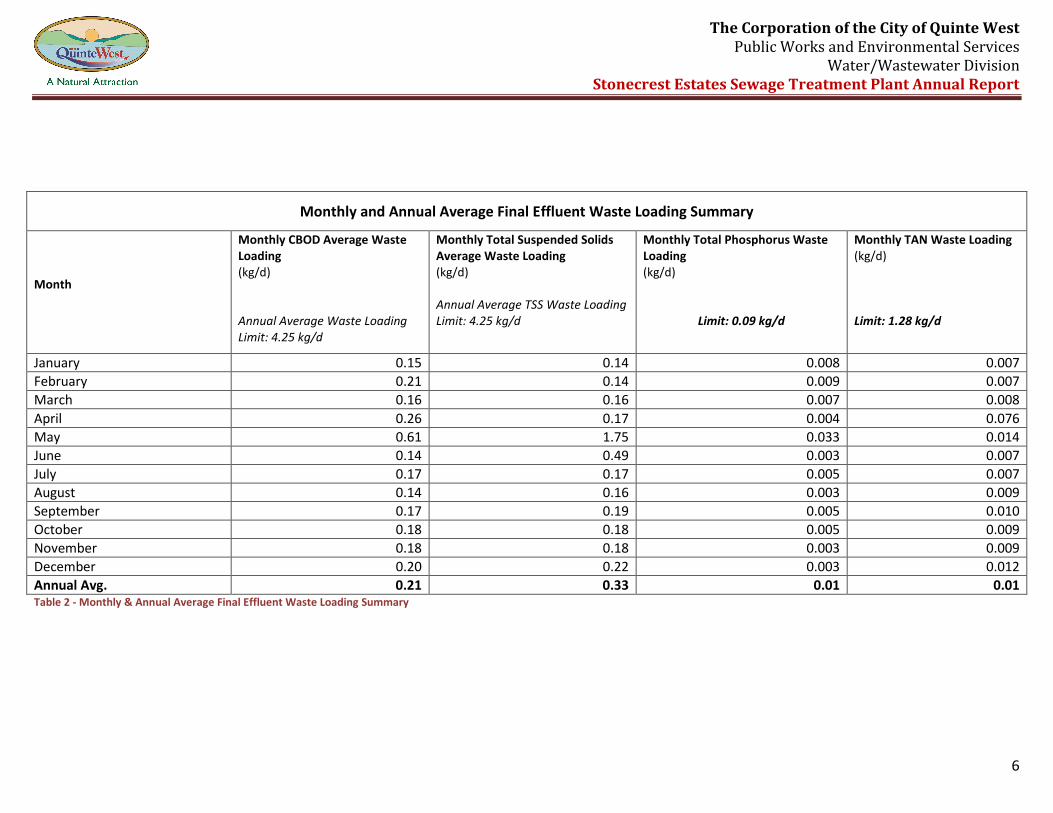
Monthly and Annual Average Final Effluent Waste Loading Summary
Month
Monthly CBOD Average Waste Loading (kg/d) Annual Average Waste Loading Limit: 4.25 kg/d
Monthly Total Suspended Solids Average Waste Loading (kg/d) Annual Average TSS Waste Loading Limit: 4.25 kg/d
Monthly Total Phosphorus Waste Loading (kg/d)
Limit: 0.09 kg/d
Monthly TAN Waste Loading (kg/d) Limit: 1.28 kg/d
January 0.15 0.14 0.008 0.007
February 0.21 0.14 0.009 0.007
March 0.16 0.16 0.007 0.008
April 0.26 0.17 0.004 0.076
May 0.61 1.75 0.033 0.014
June 0.14 0.49 0.003 0.007
July 0.17 0.17 0.005 0.007
August 0.14 0.16 0.003 0.009
September 0.17 0.19 0.005 0.010
October 0.18 0.18 0.005 0.009
November 0.18 0.18 0.003 0.009
December 0.20 0.22 0.003 0.012
Annual Avg. 0.21 0.33 0.01 0.01 Table 2 - Monthly & Annual Average Final Effluent Waste Loading Summary
The Corporation of the City of Quinte West Public Works and Environmental Services
Water/Wastewater Division Stonecrest Estates Sewage Treatment Plant Annual Report
7
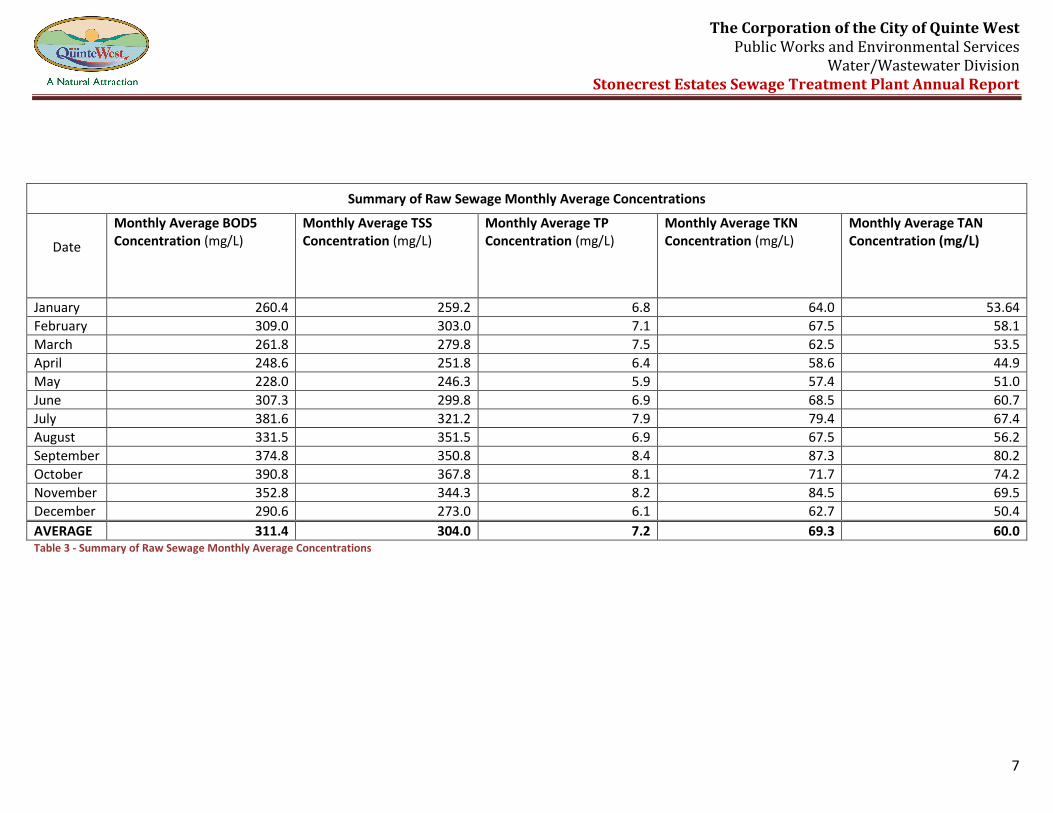
Summary of Raw Sewage Monthly Average Concentrations
Date
Monthly Average BOD5 Concentration (mg/L)
Monthly Average TSS Concentration (mg/L)
Monthly Average TP Concentration (mg/L)
Monthly Average TKN Concentration (mg/L)
Monthly Average TAN Concentration (mg/L)
January 260.4 259.2 6.8 64.0 53.64
February 309.0 303.0 7.1 67.5 58.1
March 261.8 279.8 7.5 62.5 53.5
April 248.6 251.8 6.4 58.6 44.9
May 228.0 246.3 5.9 57.4 51.0
June 307.3 299.8 6.9 68.5 60.7
July 381.6 321.2 7.9 79.4 67.4
August 331.5 351.5 6.9 67.5 56.2
September 374.8 350.8 8.4 87.3 80.2
October 390.8 367.8 8.1 71.7 74.2
November 352.8 344.3 8.2 84.5 69.5
December 290.6 273.0 6.1 62.7 50.4
AVERAGE 311.4 304.0 7.2 69.3 60.0 Table 3 - Summary of Raw Sewage Monthly Average Concentrations
The Corporation of the City of Quinte West Public Works and Environmental Services
Water/Wastewater Division Stonecrest Estates Sewage Treatment Plant Annual Report
8
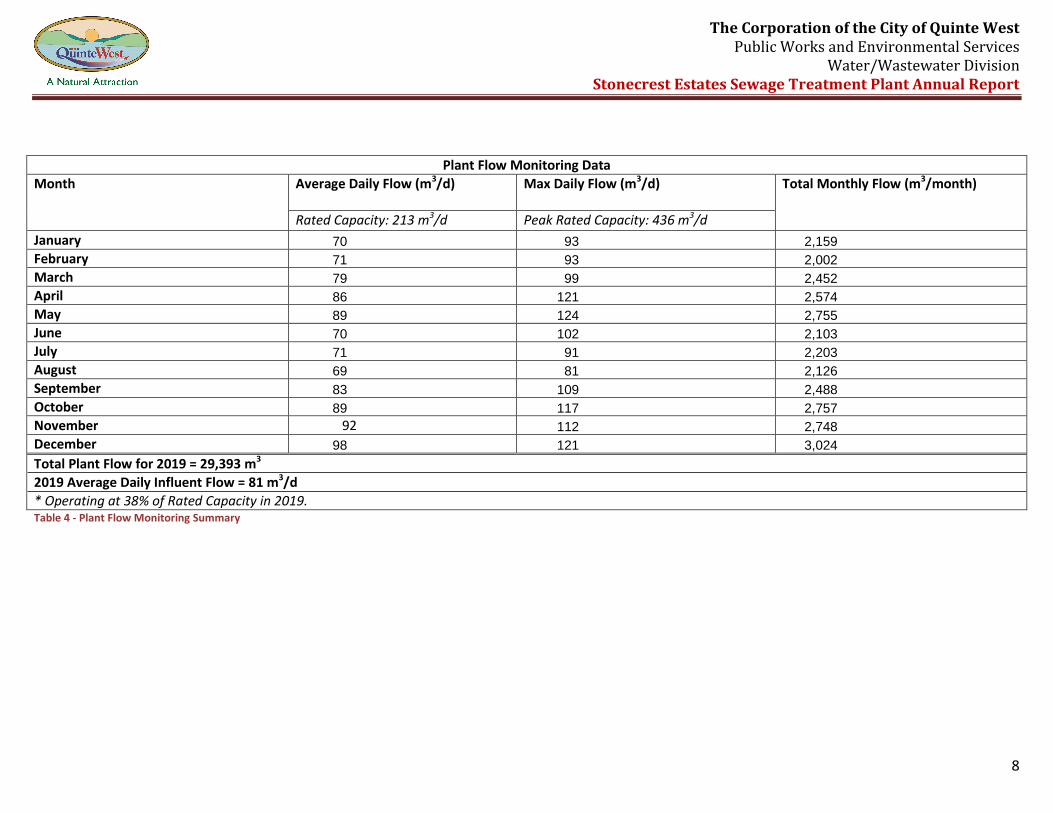
Plant Flow Monitoring Data
Month Average Daily Flow (m3/d)
Max Daily Flow (m3/d) Total Monthly Flow (m3/month)
Rated Capacity: 213 m3/d Peak Rated Capacity: 436 m3/d
January 70 93 2,159
February 71 93 2,002
March 79 99 2,452
April 86 121 2,574
May 89 124 2,755
June 70 102 2,103
July 71 91 2,203
August 69 81 2,126
September 83 109 2,488
October 89 117 2,757
November 92 112 2,748
December 98 121 3,024
Total Plant Flow for 2019 = 29,393 m3
2019 Average Daily Influent Flow = 81 m3/d
* Operating at 38% of Rated Capacity in 2019. Table 4 - Plant Flow Monitoring Summary

The Corporation of the City of Quinte West Public Works and Environmental Services
Water/Wastewater Division Stonecrest Estates Sewage Treatment Plant Annual Report
9
Summary of Bypass, Spill, and abnormal discharge Events
Table 5 - Summary of Bypass, Spill, and abnormal discharge Events
STONECREST ESTATES SEWAGE TREATMENT PLANT BYPASS AND SPILL SUMMARY
Month Date Duration (hours)
Type of Bypass/Spill,
Abnormal Discharge Event
Volume (m3)
Results
CBOD TSS TP TAN Geometric mean E. Coli
May
May 4 0.25 Unplanned Bypass Event: Breach in Membrane integrity
1.3 13 47 0.91 0.2 NT1
May 8 0.75 Unplanned Bypass Event: Breach in Membrane integrity
3.0 12 33 0.58 0.1 NT
Summary of Operating Problems throughout Reporting Period
In addition to the Bypass Events outlined in Table 6 above, the following Operating Problems were experienced at the facility:
As a result of the two (2) Events outlined in the table above, the allowable Monthly Average Concentration of Total Suspended Solids, and
Total Phosphorus was exceeded for the month of May, 2019. The Bypasses occurred as a result of membrane equipment failure,
specifically, faulty unions connecting the membrane skid to the suction discharge hosing. The parts were replaced while Raw Sewage was
hauled and disposed of in the Trenton Wastewater Collection System.
1 NT means Not Tested. Not enough sample volume was collected for E.Coli analysis.
The Corporation of the City of Quinte West Public Works and Environmental Services
Water/Wastewater Division Stonecrest Estates Sewage Treatment Plant Annual Report
10
On two separate occasions throughout the monitoring period, the City was required to take the plant offline and perform a chemical clean
on the Membrane Skids. While this maintenance activity was conducted, the City contracted a certified waste hauler to haul Raw Sewage
from the Equalization Tank for disposal in the Trenton Wastewater Collection System.
Over the course of the monitoring period extensive labour hours were committed to facility operation as a result of equipment/failures. The
City has been working with the OEM to develop operational solutions for decreasing the amount of intensive labour hours, and mechanical
failures. While some of these issues have generally not affected Effluent Quality, the City is working with the Developer and the OEM to
ensure the facility operates within the originally assured design intentions.
The Corporation of the City of Quinte West Public Works and Environmental Services
Water/Wastewater Division Stonecrest Estates Sewage Treatment Plant Annual Report
11
Analysis of Final Effluent Monitoring Data
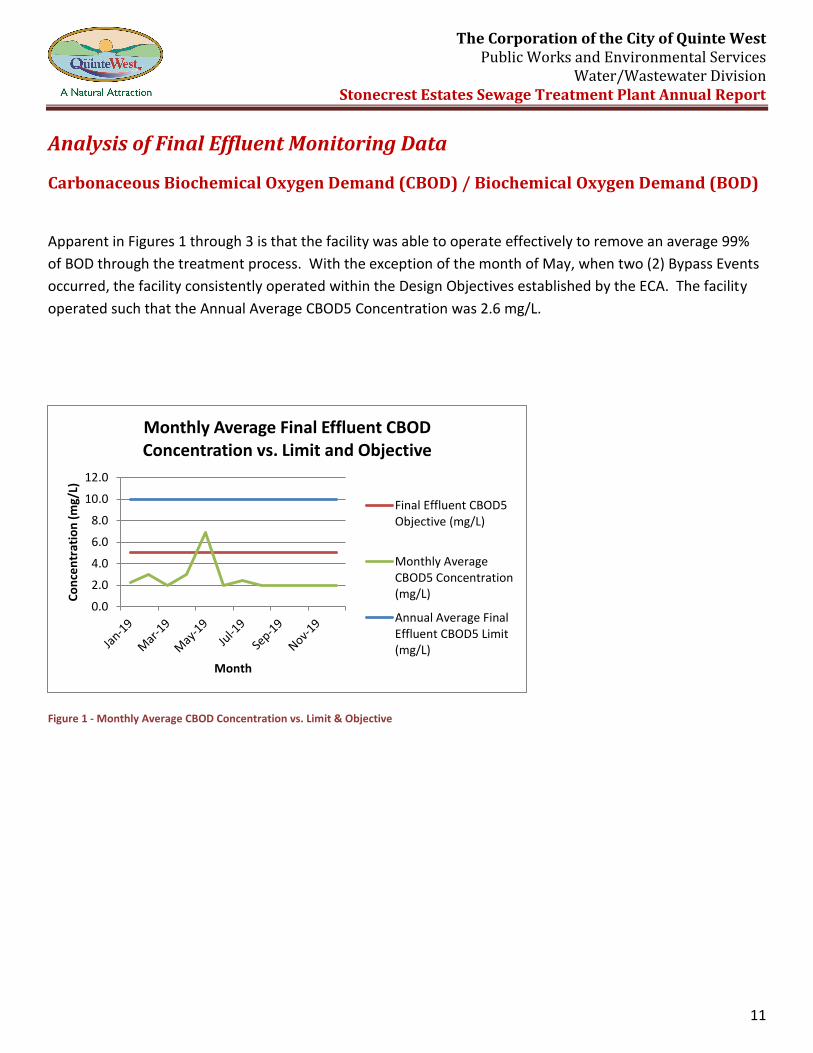
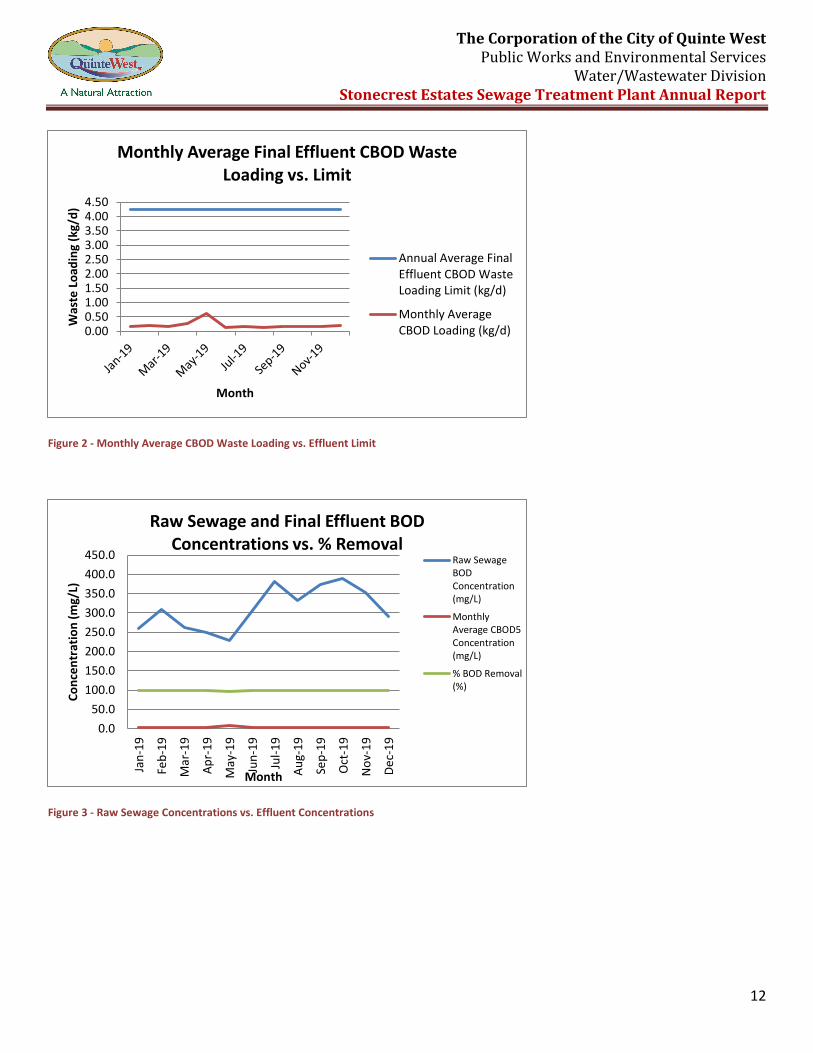
Carbonaceous Biochemical Oxygen Demand (CBOD) / Biochemical Oxygen Demand (BOD)
Apparent in Figures 1 through 3 is that the facility was able to operate effectively to remove an average 99%
of BOD through the treatment process. With the exception of the month of May, when two (2) Bypass Events
occurred, the facility consistently operated within the Design Objectives established by the ECA. The facility
operated such that the Annual Average CBOD5 Concentration was 2.6 mg/L.
Figure 1 - Monthly Average CBOD Concentration vs. Limit & Objective
0.0
2.0
4.0
6.0
8.0
10.0
12.0
Co
nce
ntr
atio
n (
mg/
L)
Month
Monthly Average Final Effluent CBOD Concentration vs. Limit and Objective
Final Effluent CBOD5Objective (mg/L)
Monthly AverageCBOD5 Concentration(mg/L)
Annual Average FinalEffluent CBOD5 Limit(mg/L)
The Corporation of the City of Quinte West Public Works and Environmental Services
Water/Wastewater Division Stonecrest Estates Sewage Treatment Plant Annual Report
12
Figure 2 - Monthly Average CBOD Waste Loading vs. Effluent Limit
Figure 3 - Raw Sewage Concentrations vs. Effluent Concentrations
0.000.501.001.502.002.503.003.504.004.50
Was
te L
oad
ing
(kg/
d)
Month
Monthly Average Final Effluent CBOD Waste Loading vs. Limit
Annual Average FinalEffluent CBOD WasteLoading Limit (kg/d)
Monthly AverageCBOD Loading (kg/d)
0.0
50.0
100.0
150.0
200.0
250.0
300.0
350.0
400.0
450.0
Jan
-19
Feb
-19
Mar
-19
Ap
r-1
9
May
-19
Jun
-19
Jul-
19
Au
g-1
9
Sep
-19
Oct
-19
No
v-1
9
De
c-1
9
Co
nce
ntr
atio
n (
mg/
L)
Month
Raw Sewage and Final Effluent BOD Concentrations vs. % Removal
Raw SewageBODConcentration(mg/L)
MonthlyAverage CBOD5Concentration(mg/L)
% BOD Removal(%)

The Corporation of the City of Quinte West Public Works and Environmental Services
Water/Wastewater Division Stonecrest Estates Sewage Treatment Plant Annual Report
13
Total Suspended Solids (TSS)
The following Figures provide a clear representation of the calculated Monthly Average Concentration of TSS
throughout the monitoring period. With the exception of May, the facility consistently operated such that
Effluent concentrations and waste loadings measured below the Design Objective and Limits established by
the ECA. The exceedance in May is a direct result of grab sample results obtained in response to two short
duration Bypass Events which occurred during the month. This facility’s ECA currently does not have provision
for calculating the Geometric Mean when there are Bypass Events impacting the monthly average. The facility
is still considered to have operated well throughout the monitoring period as it successfully removed an
average 99% of TSS through the facility.
Figure 4 - Final Effluent Monthly Average TSS Concentration vs. Limit & Objective
0.0
5.0
10.0
15.0
20.0
25.0
Co
nce
ntr
atio
n (
mg/
L)
Month
Monthly Average Final Effluent TSS Concentration vs. Limit and Objective
Annual Average FinalEffluent TSS Limit(mg/L)
Final Effluent TSSObjective (mg/L)
Monthly Average TSSConcentration (mg/L)

The Corporation of the City of Quinte West Public Works and Environmental Services
Water/Wastewater Division Stonecrest Estates Sewage Treatment Plant Annual Report
14
Figure 5 - Final Effluent TSS Waste Loading vs. Effluent Limit
Figure 6 - Raw Sewage TSS Concentration vs. Final Effluent Concentration
0.000.501.001.502.002.503.003.504.004.50
Was
te L
oad
ing
(kg/
d)
Month
Monthly Average Final Effluent TSS Waste Loading vs. Waste Loading Limit
Annual Average FinalEffluent TSS WasteLoading Limit (kg/d)
Monthly Average TSSLoading (kg/d)
88.0
90.0
92.0
94.0
96.0
98.0
100.0
102.0
050
100150200250300350400
Jan
-19
Feb
-19
Mar
-19
Ap
r-1
9
May
-19
Jun
-19
Jul-
19
Au
g-1
9
Sep
-19
Oct
-19
No
v-1
9
De
c-1
9
% R
em
ova
l (%
)
Co
nce
ntr
atio
n (
mg/
L)
Month
Raw Sewage and Final Effluent TSS Concentrations vs. % Removal
Raw SewageTSSConcentration(mg/L)
MonthlyAverage TSSConcentration(mg/L)
% TSSRemoval (%)

The Corporation of the City of Quinte West Public Works and Environmental Services
Water/Wastewater Division Stonecrest Estates Sewage Treatment Plant Annual Report
15
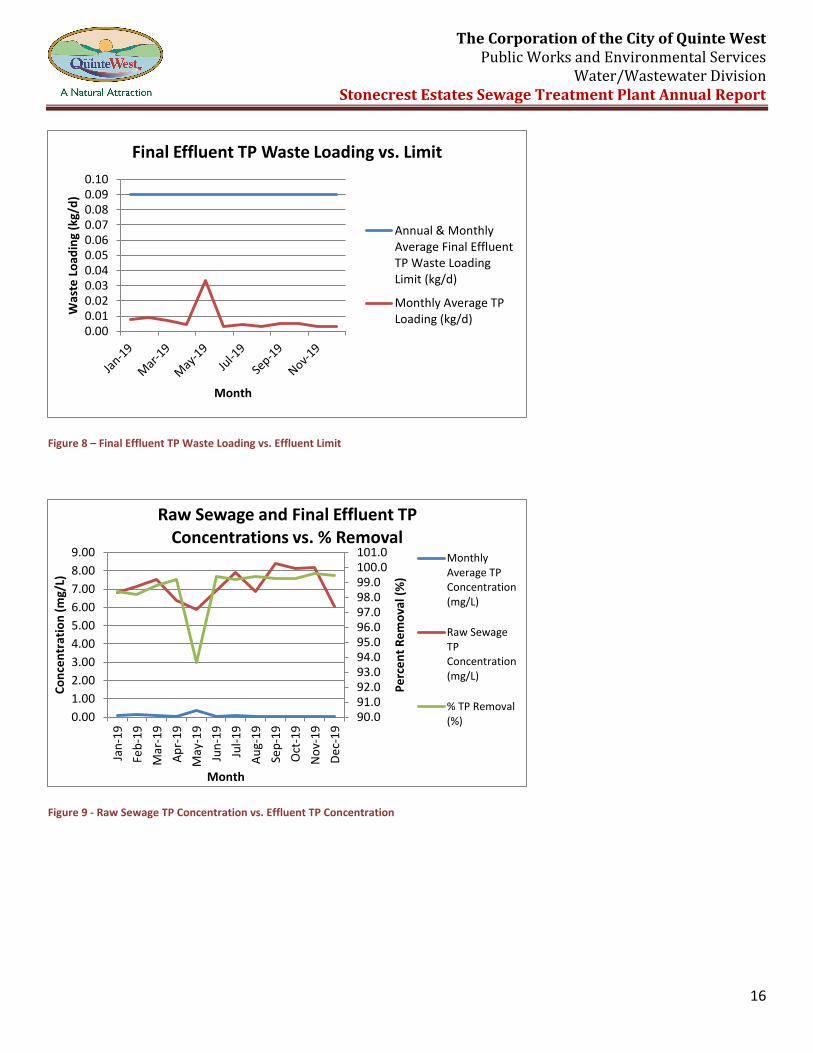
Total Phosphorus (TP)
Apparent in the Figure 7 below is that the calculated Monthly Average Concentration for Final Effluent TP
exceeded the allowable limit in May, 2019. The exceedance is a direct result of grab sample results obtained
in response to two (2) short duration Bypass Events which occurred during the month. This facility’s ECA
currently does not have provision for calculating the Geometric Mean when there are Bypass Events impacting
the monthly average. Operations staff worked to reduce the Final Effluent TP concentration in January and
February by adjusting Operating pH throughout the two months. By March there was a steady decrease in
measured Total Phosphorus residual. As outlined in Figure 9, the facility still receives high concentrations of
Total Phosphorus in its Raw Sewage. The facility used approximately 5,840 L of liquid aluminum sulphate
during the monitoring period, and maintained an average chemical dosage of 130.2 mg/L.
Figure 7 - Monthly Average Effluent TP Concentration vs. Limit & Objective
0.00.10.10.20.20.30.30.40.4
Co
nce
ntr
atio
n (
mg/
L)
Month
Monthly Average Final Effluent TP Concentration vs. Limit and Objective
Annual & MonthlyAverage Final EffluentTP Limit (mg/L)
Final Effluent TPObjective (mg/L)
Monthly Average TPConcentration (mg/L)
The Corporation of the City of Quinte West Public Works and Environmental Services
Water/Wastewater Division Stonecrest Estates Sewage Treatment Plant Annual Report
16
Figure 8 – Final Effluent TP Waste Loading vs. Effluent Limit
Figure 9 - Raw Sewage TP Concentration vs. Effluent TP Concentration
0.000.010.020.030.040.050.060.070.080.090.10
Was
te L
oad
ing
(kg/
d)
Month
Final Effluent TP Waste Loading vs. Limit
Annual & MonthlyAverage Final EffluentTP Waste LoadingLimit (kg/d)
Monthly Average TPLoading (kg/d)
90.091.092.093.094.095.096.097.098.099.0100.0101.0
0.00
1.00
2.00
3.00
4.00
5.00
6.00
7.00
8.00
9.00
Jan
-19
Feb
-19
Mar
-19
Ap
r-1
9
May
-19
Jun
-19
Jul-
19
Au
g-1
9
Sep
-19
Oct
-19
No
v-1
9
De
c-1
9
Pe
rce
nt
Re
mo
val (
%)
Co
nce
ntr
atio
n (
mg/
L)
Month
Raw Sewage and Final Effluent TP Concentrations vs. % Removal
MonthlyAverage TPConcentration(mg/L)
Raw SewageTPConcentration(mg/L)
% TP Removal(%)
The Corporation of the City of Quinte West Public Works and Environmental Services
Water/Wastewater Division Stonecrest Estates Sewage Treatment Plant Annual Report
17
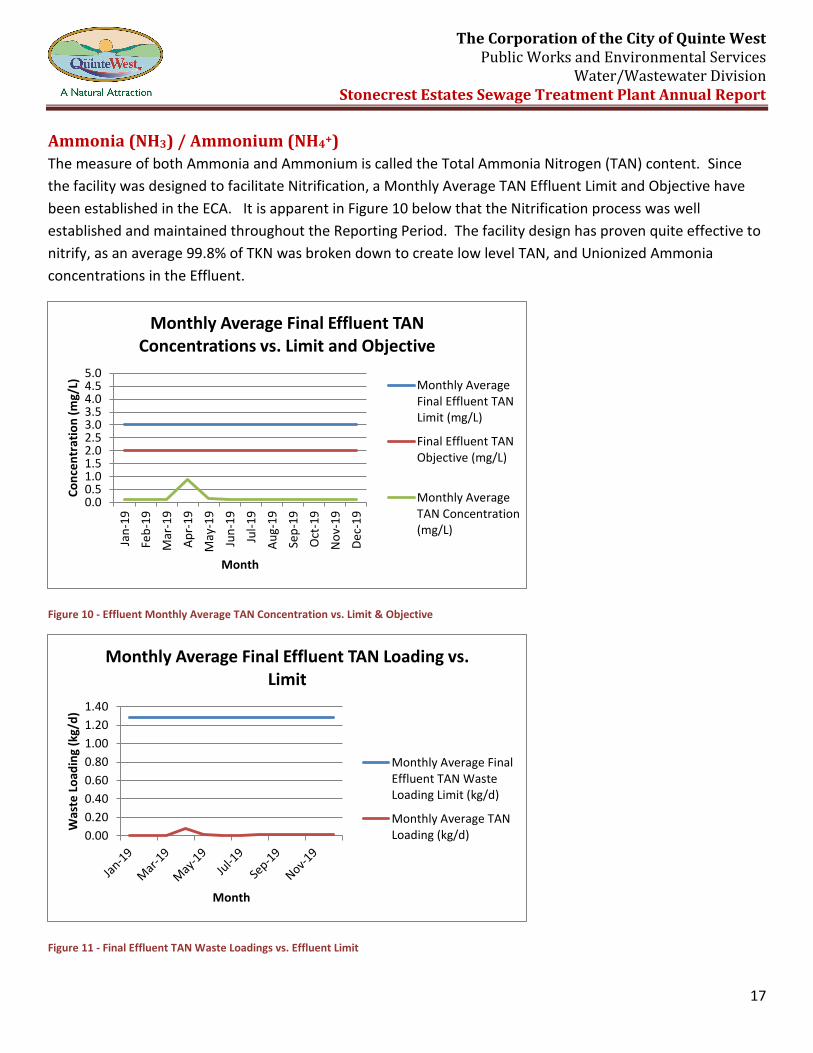
Ammonia (NH3) / Ammonium (NH4+)
The measure of both Ammonia and Ammonium is called the Total Ammonia Nitrogen (TAN) content. Since
the facility was designed to facilitate Nitrification, a Monthly Average TAN Effluent Limit and Objective have
been established in the ECA. It is apparent in Figure 10 below that the Nitrification process was well
established and maintained throughout the Reporting Period. The facility design has proven quite effective to
nitrify, as an average 99.8% of TKN was broken down to create low level TAN, and Unionized Ammonia
concentrations in the Effluent.
Figure 10 - Effluent Monthly Average TAN Concentration vs. Limit & Objective
Figure 11 - Final Effluent TAN Waste Loadings vs. Effluent Limit
0.00.51.01.52.02.53.03.54.04.55.0
Jan
-19
Feb
-19
Mar
-19
Ap
r-1
9
May
-19
Jun
-19
Jul-
19
Au
g-1
9
Sep
-19
Oct
-19
No
v-1
9
De
c-1
9
Co
nce
ntr
atio
n (
mg/
L)
Month
Monthly Average Final Effluent TAN Concentrations vs. Limit and Objective
Monthly AverageFinal Effluent TANLimit (mg/L)
Final Effluent TANObjective (mg/L)
Monthly AverageTAN Concentration(mg/L)
0.00
0.20
0.40
0.60
0.80
1.00
1.20
1.40
Was
te L
oad
ing
(kg/
d)
Month
Monthly Average Final Effluent TAN Loading vs. Limit
Monthly Average FinalEffluent TAN WasteLoading Limit (kg/d)
Monthly Average TANLoading (kg/d)
The Corporation of the City of Quinte West Public Works and Environmental Services
Water/Wastewater Division Stonecrest Estates Sewage Treatment Plant Annual Report
18
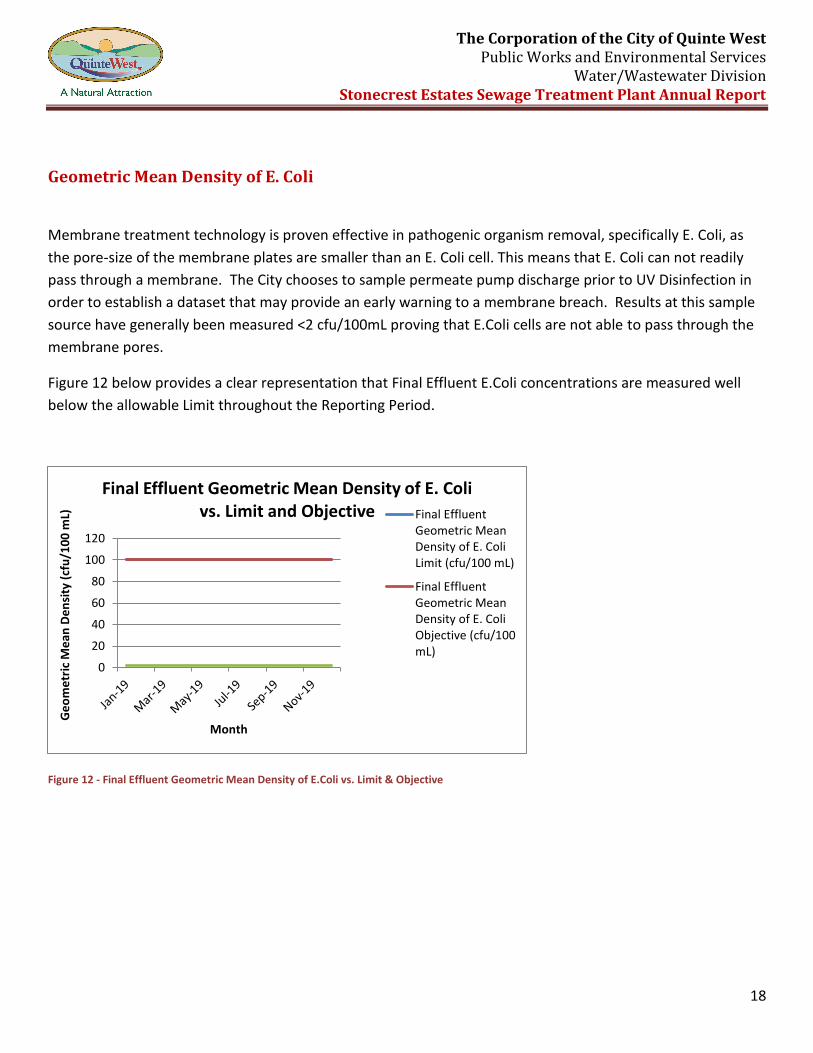
Geometric Mean Density of E. Coli
Membrane treatment technology is proven effective in pathogenic organism removal, specifically E. Coli, as
the pore-size of the membrane plates are smaller than an E. Coli cell. This means that E. Coli can not readily
pass through a membrane. The City chooses to sample permeate pump discharge prior to UV Disinfection in
order to establish a dataset that may provide an early warning to a membrane breach. Results at this sample
source have generally been measured <2 cfu/100mL proving that E.Coli cells are not able to pass through the
membrane pores.
Figure 12 below provides a clear representation that Final Effluent E.Coli concentrations are measured well
below the allowable Limit throughout the Reporting Period.
Figure 12 - Final Effluent Geometric Mean Density of E.Coli vs. Limit & Objective
0
20
40
60
80
100
120
Ge
om
etr
ic M
ean
De
nsi
ty (
cfu
/10
0 m
L)
Month
Final Effluent Geometric Mean Density of E. Coli vs. Limit and Objective Final Effluent
Geometric MeanDensity of E. ColiLimit (cfu/100 mL)
Final EffluentGeometric MeanDensity of E. ColiObjective (cfu/100mL)
The Corporation of the City of Quinte West Public Works and Environmental Services
Water/Wastewater Division Stonecrest Estates Sewage Treatment Plant Annual Report
19
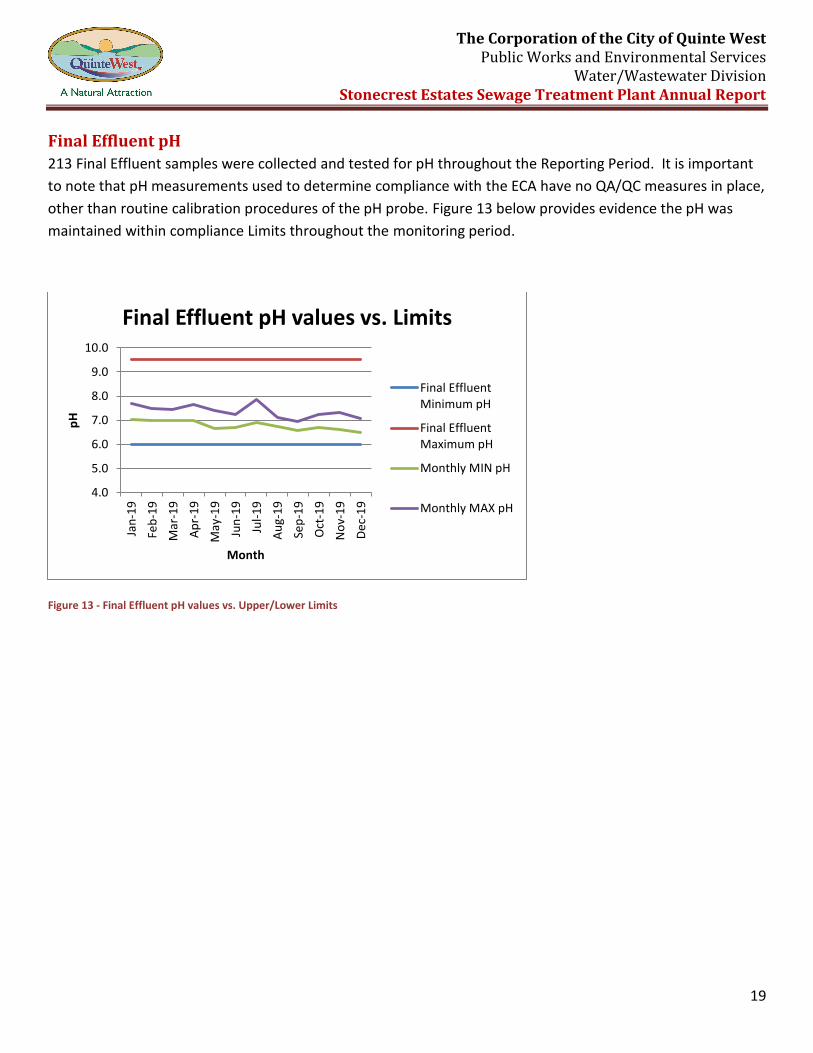
Final Effluent pH
213 Final Effluent samples were collected and tested for pH throughout the Reporting Period. It is important
to note that pH measurements used to determine compliance with the ECA have no QA/QC measures in place,
other than routine calibration procedures of the pH probe. Figure 13 below provides evidence the pH was
maintained within compliance Limits throughout the monitoring period.
Figure 13 - Final Effluent pH values vs. Upper/Lower Limits
4.0
5.0
6.0
7.0
8.0
9.0
10.0
Jan
-19
Feb
-19
Mar
-19
Ap
r-1
9
May
-19
Jun
-19
Jul-
19
Au
g-1
9
Sep
-19
Oct
-19
No
v-1
9
De
c-1
9
pH
Month
Final Effluent pH values vs. Limits
Final EffluentMinimum pH
Final EffluentMaximum pH
Monthly MIN pH
Monthly MAX pH
The Corporation of the City of Quinte West Public Works and Environmental Services
Water/Wastewater Division Stonecrest Estates Sewage Treatment Plant Annual Report
20
Summary of Maintenance performed throughout Reporting Period
In addition to an active maintenance management program, Works were upgraded as follows:
Membrane module maintenance;
Two (2) separate occasions of mechanical cleaning of membrane cassette’s.
A vacuum priming module was installed on the membrane extraction piping.
Summary of Biosolids Generated in 2019
Low volumes of Biosolids were removed from the facility as needed, and hauled to the Trenton Wastewater
Collection System for treatment through the facility.
The Corporation of the City of Quinte West Public Works and Environmental Services
Water/Wastewater Division Stonecrest Estates Sewage Treatment Plant Annual Report
21
Summary of Effluent Quality Assurance and Control Measures
The Stonecrest Estates STP Operator collects samples from Raw Sewage, Anoxic Tank, Aeration Tank,
Membrane Tank, and Final Effluent on a regular basis throughout the week. The samples are tested for
various parameters in-house for process control and effluent quality assurance. A spreadsheet is used to track
in-house lab results and plant performance data. In addition to the in-house analysis, samples are collected
weekly and sent to a certified laboratory – SGS Environmental Services. These sample results are used to
determine compliance with the ECA, as the City does not have approved QA/QC measures in place for their in-
house testing to qualify accuracy of results.
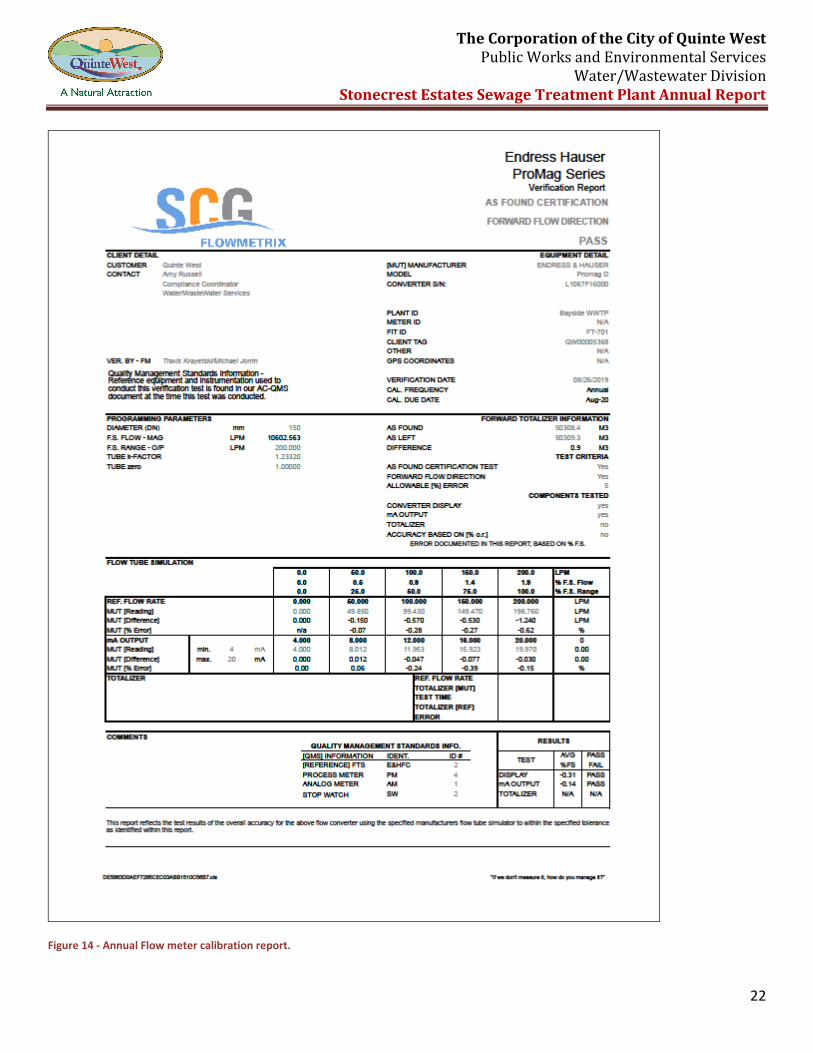
Summary of Calibration and Maintenance carried out on Final Effluent
Monitoring Equipment
Work Orders are generated on a regular basis for the maintenance of the Final Effluent composite sampler
and associated equipment. See Figure 14 below for a copy of the annual calibration report of the Final
Effluent flow meter.
The Corporation of the City of Quinte West Public Works and Environmental Services
Water/Wastewater Division Stonecrest Estates Sewage Treatment Plant Annual Report
22
Figure 14 - Annual Flow meter calibration report.
The Corporation of the City of Quinte West Public Works and Environmental Services
Water/Wastewater Division Stonecrest Estates Sewage Treatment Plant Annual Report
23
Summary of Complaints received throughout the Reporting Period
There were no complaints received by City staff for the Stonecrest Estates Sewage Treatment Plant
throughout the Reporting Period.