stomatal behavior of cowpea genotypes grown under varying moisture … · stomatal behavior of...
TRANSCRIPT

sustainability
Article
Stomatal Behavior of Cowpea Genotypes GrownUnder Varying Moisture Levels
Lawrence Munjonji 1,* ID , Kingsley K. Ayisi 1, Pascal Boeckx 2 ID and Geert Haesaert 2
1 Risk and Vulnerability Center, University of Limpopo, P Bag X1106, Sovenga 0727, South Africa;[email protected]
2 Faculty of Bioscience Engineering, Ghent University, B-9000 Gent, Belgium; [email protected] (P.B.);[email protected] (G.H.)
* Correspondence: [email protected]; Tel.: +27-79-792-0860
Received: 13 October 2017; Accepted: 17 December 2017; Published: 23 December 2017
Abstract: Drought is a major limitation to crop productivity worldwide. Plants lose most of theirwater through stomata, thus making stomata an important organ in the control of transpiration andphotosynthesis. This study assessed the stomatal behavior of four cowpea genotypes grown underfour moisture levels under hot semi-arid conditions. Stomatal conductance (gs) was measured at47, 54, 70 and 77 days after planting (DAP). Biomass and carbon isotope composition (δ13C) werealso determined at flowering. Genotype and moisture level significantly influenced gs. Genotypesvaried in gs at vegetative stages (47 and 54 DAP) only. TVu4607 had higher gs under severe droughtconditions at both 47 and 54 DAP. On the other hand, moisture level influenced gs at 54 and 70 DAPonly. Stomatal conductance was severely restricted in cowpea under both moderate and severedrought conditions as gs was mostly below the threshold 0.10 mol m−2 s−1. Relationships between:biomass and gs, and δ13C and gs were positive under severe drought only. The findings revealedthat cowpea genotypes vary in gs under dry conditions and that the variation is more prominentat vegetative stage, suggesting that cowpea productivity in dry areas could be improved throughselection of genotypes that maintain higher gs under dry conditions.
Keywords: carbon isotope composition; cowpea; stomatal conductance; water stress
1. Introduction
Water use efficiency (WUE) and crop productivity strongly depend on stomatal conductance (gs)of the crop. The opening and closing of the stomata, which is mainly affected by water availability [1],not only influence the amount of CO2 that diffuses into the leaf for photosynthesis but also theamount of water lost through the leaf [2]. Thus, the compromise between water loss and carbon gaindetermines WUE of a crop and is influenced by the stomatal response to environmental conditions [3].Stomatal conductance thus plays a particularly important role of controlling water loss in crops grownin dry areas.
Cowpea is an important legume for smallholder farmers in arid and semi-arid regions ofAfrica. It is commonly grown in hot and dry areas where evaporative demand is high. Therefore,understanding the behavior of the stomata in cowpea is vital for improving its productivity and itsadaptation to future drier climates.
The occurrence of droughts in semi-arid areas where cowpea is commonly grown is expectedto increase [4] and this will negatively affect cowpea productivity. To maintain acceptable levels ofcrop productivity in such environments, there is a need to develop drought tolerant cultivars thatuse water efficiently [5]. The improvement of drought resistance in cowpea is only possible if thereis a better understanding of its physiological responses to limited water supply. One of the primary
Sustainability 2018, 10, 12; doi:10.3390/su10010012 www.mdpi.com/journal/sustainability
Sustainability 2018, 10, 12 2 of 16
physiological responses with a significant role in drought resistance is gs. Stomatal conductance is alsobelieved to be a reliable integrative indicator of water stress [6] even though patchy gs could presentchallenges [7,8]. It is also important to develop a proxy for WUE to facilitate breeding.
WUE has been proposed to be strongly related to the adaptation of crops to drought [9] and canbe measured as a ratio of biomass accumulation to the amount of water transpired/used. Alternatively,it can also be measured at leaf level as the ratio of photosynthetic rate (A) to gs [10], commonly referredto as intrinsic WUE (WUEintrinsic). The integration of WUEintrinsic over time can be estimated throughcarbon isotope composition [6,11]. Carbon isotope composition has also been shown to be related toWUE [12]. According to Bloch, Hoffmann [13], plants with a lower 13C-CO2 discrimination tend tobe efficient water users. The advantage of measuring carbon isotope composition is that it providesan integrated measure of the plant’s growing conditions as opposed to instantaneous measurementsprovided by gs measurements.
Against this background, it is, therefore, important to elucidate the role of gs and carbon isotopediscrimination on drought resistance and productivity of cowpea. This study therefore seeks toestablish (1) how gs in cowpea is influenced by genotype and moisture level (2) how gs evolves withtime under varying moisture levels. The study also seeks to establish whether there is any correlationbetween dry biomass accumulation and gs and whether carbon isotope composition (which providesan integration of gs and A) is related to cowpea productivity and WUE.
2. Materials and Methods
2.1. Plant Growth Conditions and Experimental Design
A two-year field research was carried out at the University of Limpopo experimental farm,Syferkuil (23◦50′ S, 029◦41′ E) in the Limpopo Province, South Africa. In the first year, cowpea wasplanted on the 2 January 2015 while in the second experiment, planting was on the 22 December 2015.The differences in planting dates were mainly a result of logistics. The average daily temperatureduring the growing season at Syferkuil ranges from 12 to 35 ◦C.
Four genotypes; IT00K-1263, IT99K-1122, TVu14632 and TVu4607 were used in the experimentsand abbreviated as IT1, IT2, TV1 and TV2, respectively. The lines were sourced from the InternationalInstitute of Tropical Agriculture (IITA) in Nigeria. The lines were selected from a pool of 91 that werepre-screened earlier for high grain and biomass yield in Limpopo over a period of two years. In thefirst season, all 91 lines were grown under rain fed conditions and the best eight performing lines interms of grain and biomass yield were selected. In the subsequent season, the eight lines were furthergrown under rain fed conditions and four lines with high grain yield and biomass were selected forfurther investigation. In both pre-screening seasons cowpea was sown later in the season to inducewater stress conditions through reduced rainfall.
Cowpea was planted in rows, 0.9 m apart with in row spacing of 0.20 m, without inoculation anddepended on the resident Bradyrhizobia population for nodulation. The plot sizes were 10 m × 10 mand irrigation was by Rain Bird sprinklers (Rain Bird, Azusa, CA, USA), fitted with Arad M20 watermeters (Arad Group, Arad, Israel) to record the amount of water applied. In addition, rain gaugeswere installed at the center of each plot. Soil moisture was measured three to four times a week using acapacitance sensor; Diviner 2000 (Sentek Technologies, Stepney, Australia) from access tubes installedat the center of each plot. Irrigation was applied when half of the plots under the same moisture levelreached the threshold value. The soil was classified as a Chromic Luvisol (Hypereutric) [14]. The soildepth ranges from 60–70 cm, with sandy clay loams overlaying sandy clays and an available watercapacity (AWC) of 80 mm.
The four genotypes were examined under four moisture levels in a split-plots and four replications.The main plot treatment was the irrigation level and the subplot, cowpea lines. The four moisturelevels were as follows:

Sustainability 2018, 10, 12 3 of 16
• Well-watered (WW): 25% soil moisture depletion before recharging to field capacity (FC);• Moderately well-watered (MW): 50% soil moisture depletion before recharging to FC;• Moderate drought (MD): 75% soil moisture depletion before recharging to 50% of FC;• Rainfed (severe drought; SD): the crop depended solely on rainfall. However, in the 2016 season,
the plots were irrigated at the beginning to establish the experiments as the rainfall was too lowat the start of the season.
Due to unexpected rainfall interferences, the moisture levels could not be maintained throughoutthe 2016 growing season. However, in the 2015 season, the moisture levels were maintained for mostparts of the growing season due to reduced seasonal rainfall and longer drought period experienced.The amounts of water received (irrigation + rainfall) by the crop at flowering and harvesting stagesfor the different moisture treatments is shown in Table 1. Cowpea grown under water-limitedconditions flowered much earlier compared to the cowpea grown under well-watered conditions.These differences were more pronounced in 2015 compared to 2016. In addition, cowpea took longerto reach gravest maturity in 2016 compared to 2015 due to the availability of more moisture.
Table 1. Total amount of water received by cowpea genotypes and the days taken (DAP) to reachflowering and harvesting maturity in 2015 and 2016.
2015 2016
Flowering Harvesting Flowering Harvesting
Moisture DAP toFlowering
Irrigation +Rainfall (mm)
DAP toMaturity
Irrigation +Rainfall (mm)
DAP toFlowering
Irrigation +Rainfall (mm)
DAP toMaturity
Irrigation +Rainfall (mm)
WW 60 181 125 348 76 314 140 419MW 60 154 113 267 76 314 140 418MD 56 112 97 173 69 237 126 312SD 54 73 97 121 67 216 126 299
WW: well-watered; MW: moderately well-watered; MD: medium drought and SD: severe drought. DAP forflowering and maturity are averages of the four genotypes.
The AWC was estimated using the hydraulic properties calculator [15]. Before the first planting,composite top soil samples (0 to 30 cm) were analyzed for pH, organic carbon (OC), electricalconductivity (EC) and macronutrients. The soils had a pH (H2O) of 8.1, 500 mg N kg−1, 18.7 mg P kg−1,369 mg K kg−1, 1008 mg Ca kg−1, 710 mg kg−1, 33 mg Na kg−1 and OC of 0.5%. The EC measuredbefore the start of the experiments was 82 µS cm−1 with an exchangeable sodium percentage (ESP) of4 making it a non-saline soil. The soils were then fertilized with single super phosphate (10.5%) at arate of 35 kg P ha−1. The same rate of P was applied in the subsequent year.
2.2. Plant Harvesting and Sample Preparation
Biomass at 50% flowering (i.e., time when half of the plants had flowered) was harvested from a0.9 m2 area (equivalent to four plants per plot) from all plots on the same day in each year while grainyield was determined at harvest maturity from four middle rows of 2 m length each (equivalent to40 plants per plot). Shoot biomass at flowering was collected by cutting the main stem at 3 cm abovethe ground, leaving small stumps. Root biomass was then sampled by first watering the soil around thestumps to avoid root hair and nodule loss. Basins were made around the harvest area (about 0.36 m2)and then watered using canes. Water was applied to the small harvest area only. As described theplots were 100 m2 in size hence the watered area did not disturb the moisture treatments. The wateredarea was then left for 24 h to allow infiltration before carefully digging out the stumps using spades.The roots were then washed with water on a sieve to remove bound soil particles and collect rootbiomass. Shoot and root dry biomass was then determined by oven drying the samples at 65 ◦C toconstant weight. Grain yield was harvested at full maturity on different days for the different moistureas cowpea reached maturity at different times. The time when the first harvest was done in each yearis shown by the big arrows on Figure 1.

Sustainability 2018, 10, 12 4 of 16
Figure 1. Top panel: Daily rainfall received during the two growing seasons, starting in Decemberof previous year until harvest (2015-black bars and 2016-grey bars). Set of arrows: (a) sowing day(b) biomass collection at 50% flowering and (c) long arrows first harvesting dates (2015-black arrows;2016-gray arrows). Bottom panels show cumulative rainfall plus irrigation for the two years (2015 onthe left and 2016 on the right).
2.3. Leaf Gas Exchange Measurements
Leaf gas exchange (stomatal conductance (gs), photosynthetic rate (A) and transpiration rate (E))measurements were carried out using LCi-SD Ultra Compact Photosynthesis System (ADC BioScientific, Hoddesdon, UK). The photosynthesis machine does not provide control of CO2, temperatureor relative humidity but rather uses ambient conditions. The measured ambient CO2 ranged from 380to 395 ppm, chamber temperature from 30 to 36 ◦C while ambient relative humidity averaged from aminimum of 35% and a maximum of 93% over the growing period. The measurements were takenfour times in the first season on clear sunny days between 11h00 and 13h00. The measurements weretaken at 47, 54, 70, and 77 days after planting (DAP) in 2015. In 2016, the measurements were takenonly once at 70 DAP due to malfunctioning of the machine. The measurements were done on a singleyoungest fully matured leaf per plot.
2.4. Isotope Analyses
For isotope analyses, five to ten young fully grown leaves (depending on the size) were randomlysampled from different plants per plot at 50% flowering. The leaves were dried at 65 ◦C to constantweight and ground to a fine powder using a ZM200 mill (Retsch, Haan, Germany). The 13C/12C isotopecompositions of the leaves were analyzed using an Automated Nitrogen Carbon Analyser—Solid andLiquids (ANCA-SL) (SerCon, Crewe, UK) interfaced with an Isotope Ratio Mass Spectrometer (IRMS)
Sustainability 2018, 10, 12 5 of 16
(20-20, SerCon, Crewe, UK). The isotope composition was reported as δ13C in ‰ using Vienna PeeDee Belemnite (V-PDB) as international standard (Rstandard) and calculated using the formula below:
δ13Csample =
( Rsample
Rstandard− 1
)× 1000 (1)
2.5. WUE Determination
WUE of biomass (WUEbiomass) was calculated as the ratio of shoot biomass to total amount ofwater used. The total amount of water added was obtained from the summation of the rain gaugerecordings from planting to flowering. At leaf level, intrinsic WUE (WUEintrinsic) was calculated asfollows: WUEintrinsic = A/gs where A is the photosynthetic rate, and gs is the stomatal conductance.A and gs were obtained from the measurements of the Photosynthesis System described under 2.3.
2.6. Statistical Analyses
The analysis was conducted in accordance with the standard procedure for analysis of variance(ANOVA) of a split plot design with irrigation as the main plot and genotypes as sub-plots [16].The ANOVA was performed to calculate the effects of moisture level, genotype and time (i.e., DAP)on the studied parameters. Where the interaction effect was not significant, data was split according tomoisture level and analyzed for the effect of genotype at each moisture level (for some parameters).Post hoc multiple comparisons for observed means was done using Tukey and different means weredenoted by *, ** or *** for significance levels p ≤ 0.05, p ≤ 0.01 and p ≤ 0.001, respectively. BivariatePearson Correlation was carried out to assess the relationship between gs and δ13C and between gsand biomass. All data were analyzed using the SPSS 20 statistical package (SPSS, Armonk, NY, USA).
3. Results
3.1. Rainfall Distribution and Amount
The distribution of daily rainfall received during the two growing seasons as well as thecumulative amount of water applied is shown on Figure 1. Time to physiological maturity varied withmoisture levels in both years. The total amount of water received from planting to last harvesting was121 mm in 2015 and 299 mm in 2016 (Table 1). No significant rains were received in the immediateperiod before and after planting in 2016, hence the crop was irrigated to establish the experiment.At the time of biomass collection (short arrows), a total of 73 mm was received in 2015 while atthe same stage 218 mm (rainfall + irrigation) had been received in 2016. Furthermore, the rainfalldistribution differed between the two seasons. A longer mid-season dry period was experienced in2015 compared to 2016. Soon after the dry period in 2016, 126 mm of rain was received in ten dayswhen the cowpea was still flowering while much of the late rain received in 2015 came when mostof the cowpea had reached physiological maturity. The cumulative amount of rainfall and irrigationdiffered with moisture levels in 2015 as shown by the bottom left panel. However, in 2016, differenceswere only observed between well-watered (WW and MW) and water-limited conditions (MD and SD).It must be noted that there were some significant rains received after harvesting of cowpea under MDand SD in 2015.
3.2. Genotypic Variation in Stomatal Conductance with Time and Moisture Level
Stomatal conductance measured in 2015 varied with genotype, moisture level, DAP and thecombined effect of moisture and DAP. Due to the interaction between moisture level and DAP, Figure 2shows gs data separated according to moisture level and showing the effects of genotype and DAP.Genotypes varied in gs before flowering i.e., at 47 and 54 DAP but neither at flowering (70 DAP) norjust after flowering (77 DAP) (Figure 2). Similarly, no genotypic variations in gs were observed in 2016,where gs measurements were only carried out at 70 DAP (results not shown). At both 47 and 54 DAP,

Sustainability 2018, 10, 12 6 of 16
significant variations in gs were mainly observed under limited water supply (MD and SD). Under SDconditions, genotype TV2, had significantly higher gs compared to the other genotypes at 47 DAP whileit only differed with IT2 under the same moisture level at 54 DAP. However, under MW, genotype IT1performed much better than the other genotypes at 47, 54 and 70 DAP. Moisture levels on the otherhand, significantly influenced gs at 54 and 70 DAP but had no influence at 47 and 77 DAP (Figure 2).Generally, gs was higher under well-watered conditions (WW and MW) compared to water-limitedconditions (MD and SD). At 54 DAP, gs was higher under WW compared to both MD and SD but didnot differ with MW. A similar trend was also observed at 70 DAP. Figure 2 also shows how gs of thegenotypes evolved with DAP at each moisture levels with a control line at 0.10 mol m−2 s−1 showingthe threshold value below which photosynthesis is believed to be affected as described by Flexas etal. [17]. The figure shows that under WW, gs was above the threshold at 47, 54 and 70 DAP and wasonly below the threshold at 77 DAP. Under MW, only IT1 maintained gs at above the threshold until70 DAP. However, under SD, all genotypes had gs below the threshold except for TV2 at 47 DAP.Genotype TV2, even though below 0.10 mol m−2 s−1, it maintained a relatively higher gs compared tothe genotypes. However, under SD, gs was mostly below 0.05 mol m−2 s−1.
Figure 2. Variation in genotypic stomatal conductance with DAP at different moisture levels(well-watered (WW), moderately well-watered (MW), moderate drought (MD) and severe drought(SD) for data measured in 2015. IT1, IT2, TV1 and TV2 are the genotypes. The ANOVA table shows theeffects of genotypes (G), Moisture level (M), Time of measurement as DAP as well as their interactioneffects. Error bars are stander error of mean. The line at 0.10 mol m−2 s−1 is a control line showing thethreshold value below which photosynthesis is affected as described by Flexas et al. [17].
Sustainability 2018, 10, 12 7 of 16
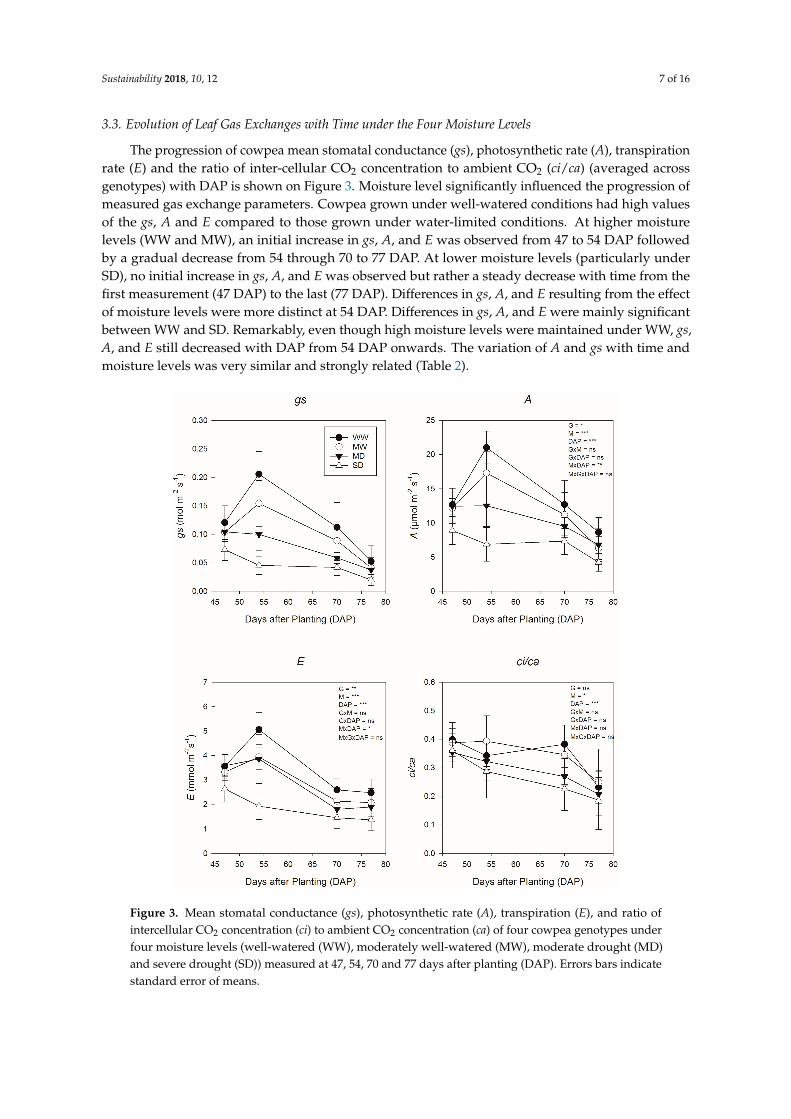
3.3. Evolution of Leaf Gas Exchanges with Time under the Four Moisture Levels
The progression of cowpea mean stomatal conductance (gs), photosynthetic rate (A), transpirationrate (E) and the ratio of inter-cellular CO2 concentration to ambient CO2 (ci/ca) (averaged acrossgenotypes) with DAP is shown on Figure 3. Moisture level significantly influenced the progression ofmeasured gas exchange parameters. Cowpea grown under well-watered conditions had high valuesof the gs, A and E compared to those grown under water-limited conditions. At higher moisturelevels (WW and MW), an initial increase in gs, A, and E was observed from 47 to 54 DAP followedby a gradual decrease from 54 through 70 to 77 DAP. At lower moisture levels (particularly underSD), no initial increase in gs, A, and E was observed but rather a steady decrease with time from thefirst measurement (47 DAP) to the last (77 DAP). Differences in gs, A, and E resulting from the effectof moisture levels were more distinct at 54 DAP. Differences in gs, A, and E were mainly significantbetween WW and SD. Remarkably, even though high moisture levels were maintained under WW, gs,A, and E still decreased with DAP from 54 DAP onwards. The variation of A and gs with time andmoisture levels was very similar and strongly related (Table 2).
Figure 3. Mean stomatal conductance (gs), photosynthetic rate (A), transpiration (E), and ratio ofintercellular CO2 concentration (ci) to ambient CO2 concentration (ca) of four cowpea genotypes underfour moisture levels (well-watered (WW), moderately well-watered (MW), moderate drought (MD)and severe drought (SD)) measured at 47, 54, 70 and 77 days after planting (DAP). Errors bars indicatestandard error of means.

Sustainability 2018, 10, 12 8 of 16
3.4. Relationship between gs Measured at 47 DAP, Biomass and ∆13c
Figure 4 shows the relationship between gs and biomass, and between gs and δ13C during theearly growth stages of cowpea (47 DAP) as affected by the four moisture levels. Figure 5 on the otherhand shows the relationships of genotypic averages demonstrating how gs of the four genotypes wasrelated to biomass, δ13C, root biomass and grain yield. The results showed no significant relationshipsbetween dry biomass accumulated prior to flowering (i.e., 47 DAP) and gs measured under WW, MWand MD conditions. A similar relationship was also observed with leaf δ13C. However, under rain fed(SD), positive relationships were observed between gs and dry biomass (r2 = 0.58, p < 0.05) as well asbetween gs and δ13C of leaves sampled at flowering stage (r2 = 0.60, p < 0.05). Cowpea grain yield,was also positively related to gs at 47 DAP under SD (r2 = 0.50, p < 0.05) and under WW (r2 = 0.64,p < 0.01). The overall relationships: gs and biomass; gs and root biomass; gs and grain yield weremostly positive when data for all moisture levels were combined while that of δ13C and gs was mostlynegative (Figure 5). Similar relationships were also observed with gs measurements taken at 70 DAP(Figure A1). Where relationships were significantly positive, genotype TV2 performed much bettercompared to the others. Figure 5A,D shows that TV2 had significantly higher aboveground biomass,root biomass and gs under SD conditions. In Table 2 the relationship between gs measured at 70 DAPand δ13C was strongly negative in both years (2015 = −0.49 ** and 2016 = −0.78 **).
Figure 4. The relationship between stomatal conductance (gs) measured at 47 DAP and biomassaccumulated at flowering and as well leaf δ13C measured at flowering.

Sustainability 2018, 10, 12 9 of 16
Figure 5. The relationship between genotypic means of stomatal conductance (gs) measured at 47 DAPand mean biomass (A), δ13C (B), root biomass (at flowering) (C) and grain yield (D). Means werecalculated per moisture level i.e., blue for well-watered; green for moderate well-watered; yellowfor moderate drought and red for severe drought. Symbols: circle for genotype IT1, triangle for IT2,rectangle for TV1, and diamond for TV2.
3.5. Genotypic Variation in ∆13c with Moisture Level
The variation in δ13C measured in leaves at the flowering stage is shown on Figure 6.The results show that moisture level significantly influenced leaf δ13C in both seasons (2015 and2016), but genotypic effects were not observed. No differences in leaf δ13C values were observedfor cowpea grown under MD and SD in both seasons. In both seasons, there were clear differencesbetween leaf δ13C grown under well-watered conditions (WW and MW) and those under water-limitedconditions (MD and SD). Thus, cowpea discriminated more against 13C-CO2 when soil moisture wasmore readily available compared to when the soil moisture was limited, resulting in more negativeδ13C values being observed under well-watered conditions. In the first season, differences in leafδ13C values were also observed between WW and MW. In 2015, average δ13C values were −25.6‰under WW and −24.3‰ under SD while in 2016 the averages were −26.9‰ under WW and −24.7‰under SD. Due to the higher rainfall received in 2016, cowpea discriminated more against 13C in 2016compared to 2015.

Sustainability 2018, 10, 12 10 of 16
Figure 6. Influence of moisture levels on genotypic δ13C measured in leaves sampled, at floweringstage in 2015 and 2016. Average is mean of all genotypes at a particular moisture level. Asterisks showsignificance: *** for p ≤ 0.001.
3.6. WUEbiomass and WUEintrinsic as Influenced by Moisture Level
WUEbiomass varied with moisture level in 2015 but not in 2016 (Figure 7). Likewise, genotypeshad a significant effect on WUEbiomass only in the 2015 growing season and not in 2016. The interactioneffect between moisture level and genotype was not significant in both years. In 2015, a generalincrease in mean WUEbiomass with decreasing moisture level was observed where WUEbiomass washigher under SD followed by MD and then MW and WW. Average WUEbiomass of 26.8 kg ha−1 mm−1
was observed in cowpea grown under SD compared to 18.0 kg ha−1 mm−1 observed under WW.Genotypic variations in WUEbiomass were observed in 2015 and where only significant under WWand SD. Under SD, TV2 had the highest WUEbiomass of 38.6 kg ha−1 mm−1 while the other threegenotypes did not vary with WUEbiomass values ranging from 21.4 to 24.8 kg ha−1 mm−1. UnderWW, TV2 maintained a higher WUEbiomass (in magnitude) followed by IT2, while TV1 had the lowestWUEbiomass. Even though no genotypic differences were observed in the 2016, however in magnitude,TV1 consistently had the lowest WUEbiomass under all moisture level. On average, WUEbiomasswas significantly lower in 2016 compared to that of 2015. When data for all moisture levels wereaveraged, TV2 had significantly higher WUEbiomass compared to the other three genotypes in 2015.When correlated to the measured gas exchanges, WUEbiomass did not show any significant relationshipwith the measured gas exchange parameters in both seasons (Table 2). No significant relationship wasalso observed between WUEintrinsic and WUEbiomass.
WUEintrinsic was also influenced by moisture levels in both seasons. No genotypic differences wereobserved and the interaction between moisture and genotype was also not significant. WUEintrinsic washigher under water-limited conditions (MD and SD) compared to well-watered conditions (MW andWW). In 2015, further differences were also observed between MD and SD. WUEintrinsic ranged from120 to 200 µmol mol−1 in 2015 while in 2016 it ranged from 133 to 189 µmol mol−1. Genotypes did notvary in WUEintrinsic at each moisture level and this was observed in both seasons. Even when data forall moisture levels were combined the genotypes still did not show any differences in WUEintrinsic aswas observed with WUEbiomass. WUEintrinsic was also negatively related to gs, A, E and ci/ca in bothseasons (Table 2). In addition, WUEintrinsic was positively related to δ13C.

Sustainability 2018, 10, 12 11 of 16
Table 2. Correlation among gas exchange parameters and WUEintrinsic, WUEbiomass, and δ13C in 2015and 2016 measured at 70 DAP.
2015 gs A E ci/ca WUEintrinsic WUEbiomass
A 0.89 **E 0.97 ** 0.89 **
ci/ca 0.30 * −0.06 0.30 **WUEintrinsic −0.46 ** −0.22 −0.42 ** −0.67 **WUEbiomass −0.19 −0.18 −0.08 0.10 0.09
δ13C −0.49 ** −0.38 ** −0.41 ** −0.23 * 0.34 ** 0.31 *
2016 gs A E ci/ca WUEintrinsic WUEbiomass
A 0.90 **E 0.94 ** 0.91 **
ci/ca −0.01 −0.35 ** −0.11WUEintrinsic −0.60 ** −0.31 ** −0.54 ** −0.54 **WUEbiomass 0.11 0.15 0.09 −0.02 −0.05
δ13C −0.78 ** −0.72 ** −0.74 ** −0.04 0.48 ** −0.26 *
Bold values show significant correlations. Asterisks show significance: * for p < 0.05 and ** for p < 0.01. Dataaveraged for all moisture levels.
Figure 7. The effect of moisture levels on biomass WUE and Intrinsic WUE of the four studiedgenotypes measured in 2015 and 2016. Letters show differences among the genotypes at each moisturelevel (different letters represent significant differences). Asterisks show significance: * for p < 0.05, ** forp < 0.01 and *** for p ≤ 0.001.

Sustainability 2018, 10, 12 12 of 16
4. Discussion
4.1. Variation in Leaf Gas Exchange with Genotype, Moisture Level and DAP
The study has shown that soil moisture significantly influences leaf gas exchanges in cowpea.Stomatal conductance, A and E were found to be high under higher moisture level compared to lowermoisture levels (Figures 2 and 3). Such results were expected and agree with the findings of similarstudies [6]. It was also interesting to note that genotypes only varied in gs during the early growthstages but not in the later stages. A plausible explanation for such a variation could be differences inroot establishment, where genotypes that establish their roots faster would have much more access towater, resulting in high leaf water content and hence higher gs. Agbicodo, Fatokun [18] reported thatplants that maintain higher tissue water potential under low water availability can do so by developingefficient root system that maximizes on water uptake.
Accordingly, it can be postulated that the high gs of TV2 at 47 and 54 DAP under SD (Figure 2)may have resulted from a stronger and a more efficient rooting system (Figure 5D) that enabled it to tapwater efficiently early in its growth. Even though TV2 was superior in biomass and root biomass underSD, the grain yield observed at the same moisture level was not congruent with the high biomassobserved. Interestingly, at both 47 and 54 DAP genotypes did not vary in gs under WW conditionsbut showed much variation under lower moisture levels (MW, MD and SD). This could probablybe due to the easily available moisture that allowed the genotypes to absorb enough moisture tokeep stomata open. This probably suggests that, gs variation in cowpea genotypes may be moredetermined by root characteristics rather than by leaf characteristics. Under MW and MD, IT1 andTV2 consistently revealed higher gs compared to the other two genotypes (IT2 and TV1). However,under SD, TV2 maintained relatively higher values of gs, which were significant at 47 DAP. The resultssuggest that TV2 probably has the capacity to establish an efficient rooting system very early in theseason. In a separate study, TV2 was found to have significantly higher root biomass compared to theother genotypes [19].
Genotypic differences observed in gs under low water availability could be due to differences inthe response mechanisms to water deficit. Genotypes with higher capacity to establish efficient rootingsystem, may show drought tolerance by maintaining relatively higher gs, E an A while those weaklyestablished rooting system, may show drought avoidance by closing their stomata, hence low gs, Eand A. IT1 and TV2 displayed strong drought tolerance tendencies under moderate drought (MD) at47 and 54 DAP. Stomatal conductance of TV2 under MD was similar to its gs under MW while othergenotypes had significantly lower gs at MD compared to MW. Stomata of cowpea are also knownto be sensitive to soil drying [9], and thus the cowpea plant normally exhibits drought avoidancemechanism [20,21]. The drought avoidance mechanism could explain lower gs across all moisturelevels exhibited by IT1, IT2 and TV1 at 54 DAP.
While genotypic differences in gs were observed at 47 and 54 DAP, the soil moisture effect wasobserved at 54 and 70 DAP (Figure 2). The lack of moisture level effect at 47 DAP is difficult to explainbut the differences might have been masked by the higher gs displayed by TV2 and IT1 under MDand SD. The lack of moisture level effect on gs at 77 DAP was probably due to crop aging. Stomataconductance values observed at 77 DAP were significantly low, mostly below 0.05 mol m−2 s−1
(Figures 2 and 3). Figure 3 shows a gradual decrease in gs with DAP even under WW, which supportsthe idea of plant aging. In addition, stomata are generally known to be more open early in the seasonthan at its end [22] hence the decrease of gs with DAP. Another interesting observation was the gsobserved under WW in this study were relatively lower than those observed in intercropped sorghumand cowpea [23] and in sugar beet [13]. However, they were in the same range as those reportedby [24] in cowpea and by [25] in wheat.
The strong relationship observed between gs and A (r2 = 0.90, p < 0.01) suggests that CO2
assimilation in cowpea is controlled by stomatal effects. However, the water stress may not have beensevere enough to induce non-stomatal effects on photosynthetic processes. The control of gs on A

Sustainability 2018, 10, 12 13 of 16
is also confirmed by the identical evolution of A and gs with time (Figure 3). Similar results havealso been reported in other legume studies [26]. Transpiration rate related strongly with gs (r2 = 0.97,p < 0.01, 2015 season). Flexas et al. [17], reported that photosynthesis is affected when gs goes below0.10–0.15 mol m−2 s−1. In this study, cowpea grown under rain fed conditions (SD) and underMD had gs values lower than 0.10 mol m−2 s−1 for most of their growing period (Figures 2 and 3).This, therefore, suggests that cowpea grown in semi-arid regions are likely photosynthesizing atsub-optimal levels throughout their life cycle. In addition, Table 1 shows that time to flowering andmaturity were shortened by water availability. As a result, biomass and grain yield observed in 2015were significantly lower under SD, an indication of the suppressed photosynthetic rate as well limitedtime for biomass accumulation and grain filling. Thus, improvement in cowpea stomatal conductancecould increase productivity of cowpea under dry conditions. TV2 and IT1 where the only genotypesthat maintained gs values above 0.10 mol m−2 s−1 under moderate drought (MD) until 54 DAP.
δ13C, which provides an integration of the environmental conditions during the period of CO2
assimilation [6], differed with moisture level. δ13C values were more negative under well-wateredconditions compared to water-limited conditions, which corroborates the findings of many otherstudies on C3 plants [13,27,28]. Less negative δ13C values under SD were attributed to lower 13Cdiscrimination due to the partial closure of the stomata occurring under soil drying. The influenceof gs and A on δ13C is confirmed by the strong negative relationship between δ13C and, A and gs(Table 2). The relationship between gs at 47 DAP and δ13C showed a positive relationship under SDonly (Figure 4). The positive relationship seems to suggest the existence genotypic variation in leafδ13C of cowpea grown under SD conditions, whereby genotypes that show higher gs would have lessnegative δ13C values. However, the observed results did not show significant genotypic variation inδ13C under SD (Figure 6). Figure 2 shows that TV2 had significantly higher gs under SD at 47 DAP butthis did not translate to significantly higher δ13C (Figure 6).
4.2. Relationships of WUEbiomass and WUEintrinsic as Influenced by Moisture Level
Higher WUE is regarded as an important factor in improving crop performance underwater-limited conditions [29]. WUE can be measured or estimated in several ways as described byTambussi, Bort [11]. In this study, WUE was measured in terms of: biomass accumulation (WUEbiomass);as gas exchange (WUEintrinsic) and estimated δ13C data. The results showed strong influence of moisturelevel on all three (WUEintrinsic, WUEbiomass and δ13C). It was observed that WUEintrinsic, WUEbiomassand δ13C were all higher under water-limited conditions (Figures 6 and 7) agreeing with the findingsof Bloch, Hoffmann [13] who also found higher WUE under water-limited conditions. However,other studies are contrary to such findings [30]. The lack of differences in WUEbiomass in 2016 may beattributed to the relatively higher rainfall received in that year. It is believed that under well-wateredconditions plants continue to assimilate carbon even when evaporative demand is very high resultingin higher losses of water per carbon gained, leading to lower WUEbiomass [13]. Under water-limitedconditions crops only assimilate carbon when evaporative demand is low, hence loses less water percarbon gained [13].
Similarly, WUEintrinsic was higher under water stressed conditions due to differences in therate of decrease between A and gs. When stomata are partially closed, the photosynthetic rate doesnot immediately decrease, resulting in higher WUEintrinsic [6]. Also, WUEintrinsic increases whenA increases at a constant gs [21]. There was no significant relationship between WUEbiomass andWUEintrinsic, probably because WUEintrinsic is an instantaneous measurement that reflects conditionsprevailing at the instant of measurement while WUEbiomass is an integration of the conditions fromsowing to the time of biomass sampling. δ13C, which provides an integration of WUEintrinsic overtimewas positively related to WUEbiomass in 2015. The strong relationship shows that δ13C can be used as asurrogate of WUEintrinsic in cowpea. Similar conclusions have also been drawn in other studies [31].

Sustainability 2018, 10, 12 14 of 16
5. Conclusions
In conclusion, the findings of this study showed that gs responded to genotypic variation, moisturelevels and to the time of measurement. Variation in genotypes varied at early vegetative stages andmostly under water-limited conditions, with genotype TVu4607 (TV2) showing much higher gs underSD. As expected, gs was higher under well-watered conditions compared to water-limited conditionsbut it was interesting to note that, gs still decreased with DAP even under WW conditions. This studyalso showed that gs is severely restricted in cowpea grown in semi-arid areas as gs under MD andSD were mostly below 0.10 mol m−2 s−1. Thus, improving gs of cowpea grown in such areas couldimprove its productivity. The use of δ13C in screening for high WUE in cowpea maybe limited as itonly responded to moisture level and not to genotype. However, the highly significant and positiverelationship observed between δ13C and gs under SD suggest that δ13C could be useful as a screeningtrait for higher gs in cowpea under drought conditions.
The findings of this study were however constrained by the high rainfall received later in 2016 thatreduced the moisture levels to two, thus failing to completely replicate the four levels observed in 2015.Another limitation of the study is in the reduced number of gas exchange measurements (gs, A, E andci/ca) taken per plot. These are instantaneous measurements that would require several measurementsper plot. However, due to the large number of the experimental plots and the limitation in the timeand conditions to which measurements can be carried out, a reduced number of measurements perplot were taken to accommodate all plots within the recommended period.
Acknowledgments: This work was financially supported by VLIR-IUC, an Inter University Cooperation withUniversity of Limpopo (UL), South Africa under Project 6 on Food Security. The authors would also like toacknowledge support from the Risk and Vulnerability Science Centre at UL. The following people are alsoacknowledged for their contribution to the work: Katja Van Nieuland, LouisEloff, and Jimmy Motloutsi.
Author Contributions: Lawrence Munjonji, Kingsley K. Ayisi, Pascal Boeckx and Geert Haesaert conceived anddesigned the experiments; Lawrence Munjonji performed the experiments; Lawrence Munjonji analyzed the data;Lawrence Munjonji, Kingsley K. Ayisi, Pascal Boeckx and Geert Haesaert contributed towards the writing andediting of the paper.
Conflicts of Interest: The authors declare no conflict of interest.
Appendix A
Figure A1. Cont.

Sustainability 2018, 10, 12 15 of 16
Figure A1. The relationship between genotypic means of stomatal conductance (gs) measured at70 DAP and mean biomass (A), root biomass (at flowering) (B), δ13C (C) and grain yield (D). Meanswere calculated per moisture level i.e., blue for well-watered; green for moderate well-watered; yellowfor moderate drought and red for severe drought. Symbols: circle for genotype IT1, triangle for IT2,rectangle for TV1, and diamond for TV2.
References
1. Farooq, M.; Wahid, A.; Kobayashi, N.; Fujita, D.; Basra, S. Plant Drought Stress: Effects, Mechanisms andManagement. Agron. Sustain. Dev. 2009, 29, 185–212. [CrossRef]
2. Farquhar, G.D.; Sharkey, T.D. Stomatal conductance and photosynthesis. Annu. Rev. Plant Physiol. 1982,33, 317–345. [CrossRef]
3. Lawson, T.; Blatt, M.R. Stomatal size, speed, and responsiveness impact on photosynthesis and water useefficiency. Plant Physiol. 2014, 164, 1556–1570. [CrossRef] [PubMed]
4. Lobell, D.B.; Burke, M.B.; Tebaldi, C.; Mastrandrea, M.D.; Falcon, W.P.; Naylor, R.L. Prioritizing climatechange adaptation needs for food security in 2030. Science 2008, 319, 607–610. [CrossRef] [PubMed]
5. Barnabás, B.; Jäger, K.; Fehér, A. The effect of drought and heat stress on reproductive processes in cereals.Plant Cell Environ. 2008, 31, 11–38. [CrossRef] [PubMed]
6. Ninou, E.; Tsialtas, J.; Dordas, C.; Papakosta, D. Effect of irrigation on the relationships between leaf gasexchange related traits and yield in dwarf dry bean grown under mediterranean conditions. Agric. Water Manag.2012, 116, 235–241. [CrossRef]
7. Mott, K.A.; Buckley, T.N. Stomatal heterogeneity. J. Exp. Bot. 1998, 49, 407–417. [CrossRef]8. Mott, K.A.; Buckley, T.N. Patchy stomatal conductance: Emergent collective behaviour of stomata.
Trends Plant Sci. 2000, 5, 258–262. [CrossRef]9. Hall, A.E. Phenotyping cowpeas for adaptation to drought. Front. Physiol. 2012, 3, 155. [CrossRef] [PubMed]10. Condon, A.; Richards, R.; Rebetzke, G.; Farquhar, G. Improving intrinsic water-use efficiency and crop yield.
Crop Sci. 2002, 42, 122–131. [CrossRef] [PubMed]11. Tambussi, E.; Bort, J.; Araus, J. Water use efficiency in C3 cereals under mediterranean conditions: A review
of physiological aspects. Ann. Appl. Biol. 2007, 150, 307–321. [CrossRef]12. Farquhar, G.; Richards, R. Isotopic composition of plant carbon correlates with water-use efficiency of wheat
genotypes. Funct. Plant Biol. 1984, 11, 539–552. [CrossRef]13. Bloch, D.; Hoffmann, C.M.; Märländer, B. Impact of water supply on photosynthesis, water use and carbon
isotope discrimination of sugar beet genotypes. Eur. J. Agron. 2006, 24, 218–225. [CrossRef]14. WRB. World Reference Base for Soil Resources 2014. In International Soil Classification System for Naming Soils
and Creating Legends for Soil Maps; World Soil Resources Reports; FAO: Rome, Italy, 2014.15. Saxton, K.E.; Rawls, W.J. Soil water characteristic estimates by texture and organic matter for hydrologic
solutions. Soil Sci. Soc. Am. J. 2006, 70, 1569–1578. [CrossRef]

Sustainability 2018, 10, 12 16 of 16
16. Gomez, K.A.; Gomez, A.A. Statistical Procedures for Agricultural Research; John Wiley & Sons: Toronto, ON,Canada, 1984.
17. Flexas, J.; Bota, J.; Cifre, J.; Mariano Escalona, J.; Galmés, J.; Gulías, J.; Lefi, E.K.; Florinda Martinez-Canellas, S.;Teresa Moreno, M.; Ribas-Carbo, M. Understanding down-regulation of photosynthesis under water stress:Future prospects and searching for physiological tools for irrigation management. Ann. Appl. Biol. 2004,144, 273–283. [CrossRef]
18. Agbicodo, E.; Fatokun, C.; Muranaka, S.; Visser, R. Breeding drought tolerant cowpea: Constraints,accomplishments, and future prospects. Euphytica 2009, 167, 353–370. [CrossRef]
19. Munjonji, L.; Ayisi, K.K.; Boeckx, P.; Haesaert, G. Screening cowpea genotypes for high biological nitrogenfixation and grain yield under drought conditions. Agron. J. 2017, in press.
20. Anyia, A.; Herzog, H. Water-use efficiency, leaf area and leaf gas exchange of cowpeas under mid-seasondrought. Eur. J. Agron. 2004, 20, 327–339. [CrossRef]
21. Singh, S.K.; Raja Reddy, K. Regulation of photosynthesis, fluorescence, stomatal conductance and water-useefficiency of cowpea (Vigna unguiculata [L.] Walp.) under drought. J. Photochem. Photobiol. B Biol. 2011,105, 40–50. [CrossRef] [PubMed]
22. Austin, R.; Craufurd, P.; Hall, M.; Acevedo, E.; da Silveira Pinheiro, B.; Ngugi, E. Carbon isotopediscrimination as a means of evaluating drought resistance in barley, rice and cowpeas. Bull. Soc. Bot.Fr. Actual. Bot. 1990, 137, 21–30. [CrossRef]
23. Makoi, J.; Chimphango, S.; Dakora, F. Photosynthesis, water-use efficiency and δ13C of five cowpeagenotypes grown in mixed culture and at different densities with sorghum. Photosynthetica 2010, 48, 143–155.[CrossRef]
24. Rivas, R.; Falcão, H.M.; Ribeiro, R.V.; Machado, E.C.; Pimentel, C.; Santos, M.G. Drought tolerance in cowpeaspecies is driven by less sensitivity of leaf gas exchange to water deficit and rapid recovery of photosynthesisafter rehydration. S. Afr. J. Bot. 2016, 103, 101–107. [CrossRef]
25. Sikder, S.; Foulkes, J.; West, H.; De Silva, J.; Gaju, O.; Greenland, A.; Howell, P. Evaluation of photosyntheticpotential of wheat genotypes under drought condition. Photosynthetica 2015, 53, 47–54. [CrossRef]
26. Liu, F.; Andersen, M.N.; Jacobsen, S.-E.; Jensen, C.R. Stomatal control and water use efficiency of soybean(Glycine max L. Merr.) during progressive soil drying. Environ. Exp. Bot. 2005, 54, 33–40. [CrossRef]
27. Cabrera-Bosquet, L.; Molero, G.; Nogues, S.; Araus, J.L. Water and nitrogen conditions affect the relationshipsof Delta C-13 and Delta O-18 to gas exchange and growth in durum wheat. J. Exp. Bot. 2009, 60, 1633–1644.[CrossRef] [PubMed]
28. Wang, Y.; Zhang, X.; Liu, X.; Zhang, X.; Shao, L.; Sun, H.; Chen, S. The effects of nitrogen supply and waterregime on instantaneous WUE, time-integrated WUE and carbon isotope discrimination in winter wheat.Field Crop. Res. 2013, 144, 236–244. [CrossRef]
29. Araus, J.; Slafer, G.; Reynolds, M.; Royo, C. Plant breeding and drought in C3 cereals: What should we breedfor? Ann. Bot. 2002, 89, 925–940. [CrossRef] [PubMed]
30. Erice, G.; Louahlia, S.; Irigoyen, J.J.; Sánchez-Díaz, M.; Alami, I.T.; Avice, J.-C. Water use efficiency,transpiration and net CO2 exchange of four alfalfa genotypes submitted to progressive drought andsubsequent recovery. Environ. Exp. Bot. 2011, 72, 123–130. [CrossRef]
31. Barbour, M.M.; Tcherkez, G.; Bickford, C.P.; Mauve, C.; Lamothe, M.; Sinton, S.; Brown, H. δ13C ofleaf-respired CO2 reflects intrinsic water-use efficiency in barley. Plant Cell Environ. 2011, 34, 792–799.[CrossRef] [PubMed]
© 2017 by the authors. Licensee MDPI, Basel, Switzerland. This article is an open accessarticle distributed under the terms and conditions of the Creative Commons Attribution(CC BY) license (http://creativecommons.org/licenses/by/4.0/).