stoichiometric conversion of biodiesel derived crude glycerol to hydrogen: response surface...
TRANSCRIPT
Bioresource Technology 106 (2012) 154–160
Contents lists available at SciVerse ScienceDirect
Bioresource Technology
journal homepage: www.elsevier .com/locate /bior tech
Stoichiometric conversion of biodiesel derived crude glycerol to hydrogen: Responsesurface methodology study of the effects of light intensity and crude glyceroland glutamate concentration
Dipankar Ghosh, Irma Flore Sobro, Patrick C. Hallenbeck ⇑Département de Microbiologie et Immunologie, Université de Montréal, CP 6128 Succursale Centre-ville, Montréal, Québec, Canada H3C 3J7
a r t i c l e i n f o
Article history:Received 3 November 2011Received in revised form 3 December 2011Accepted 5 December 2011Available online 13 December 2011
Keywords:BiohydrogenPhotofermentationPhotosynthetic bacteriaBiodiesel-derived glycerol
0960-8524/$ - see front matter � 2011 Elsevier Ltd. Adoi:10.1016/j.biortech.2011.12.021
⇑ Corresponding author. Tel.: +1 514 343 6278; faxE-mail address: [email protected] (
a b s t r a c t
Photofermentation by the photosynthetic bacterium Rhodopseudomonas palustris has been used to con-vert the crude glycerol fraction from biodiesel production to hydrogen as a means of converting this largeresource to useful energy. In the present study response surface methodology was applied to investigatethe interactive effects among several important process parameters; light intensity, and the concentra-tions of crude glycerol and glutamate, on the stoichiometric conversion of crude glycerol to hydrogen.Under optimal conditions, a light intensity of 175 W/m2, 30 mM glycerol, and 4.5 mM glutamate,6.69 mol hydrogen/mole of crude glycerol were obtained, a yield 96% of theoretical. Determination ofnitrogenase activity and expression levels showed that there was relatively little variation in levels ofnitrogenase protein with changes in process variables whereas nitrogenase activity varied considerably,with maximal nitrogenase activity (228 nmol of C2H4/ml/min) at the optimal central point.
� 2011 Elsevier Ltd. All rights reserved.
1. Introduction
Biodiesel manufacturing produces extensive amounts of crudeglycerol as the major side product since the currently used technol-ogy, base-catalyzed trans-esterification of oil, generates about 10 kgof crude glycerol per 100 l of biodiesel produced. Biodiesel produc-tion, and consequently that of the main side product, crude glycerol,are increasing annually. Even at current production levels, the crudeglycerol produced during biodiesel manufacture has become awaste disposal problem (Johnson and Taconi, 2007). At the scaleestimated for future biodiesel production, the enormous quantitiesof crude glycerol will create a waste stream with potentially signif-icant environmental impacts. Thus there is an urgent need for thedevelopment of practical processes for converting these large quan-tities of waste crude glycerol to useable products. The magnitude ofprojected future supplies suggests that its conversion to a biofuel isthe only feasible avenue to creating a product that will not over-whelm demand. Several studies have shown that this fraction canbe used to feed anaerobic digesters to produce methane, but achiev-ing significant yields and operational stability requires co-digestionwith a nitrogen rich waste stream due to the low nitrogen content ofbiodiesel waste (Astals et al., 2011; Siles et al., 2010). One of themore promising ways could be its conversion to biohydrogen by
ll rights reserved.
: +1 514 343 5701.P.C. Hallenbeck).
photofermentation. It was recently reported that crude glycerolcould be successfully converted to biohydrogen by photofermenta-tion using Rhodopseudomonas palustris (CGA009) with a molarhydrogen yield of 3 mol H2/mol of crude glycerol (Sabourin-Provostand Hallenbeck, 2009). However, improvement of this process isdesirable since the theoretical stoichiometric yield is 7 mol H2/mol of glycerol.
Bioprocess development involving photofermentation is com-plicated since a variety of nutritional and physico-chemical processvariables including light intensity, carbon and nitrogen sources,might be expected to affect the hydrogen yield. The C:N ratio is par-ticularly important due to its potential influence over nitrogenaseexpression, the enzyme responsible for the observed hydrogen evo-lution (Keskin et al., 2011; Hallenbeck, 2011). Bioprocess optimiza-tion using a conventional ‘change-one-factor-at-a-time’ process isvery time-consuming, and, moreover, this method may not findthe true optimum since interactions between process variablesare neglected. On the other hand, experimental design based on sta-tistical modeling can be a very useful tool to evaluate the interac-tions between a set of independent experimental factors andobserved responses, and, moreover, is a time saving method sinceit requires the least number of experiments (Annadurai et al.,1999). One such method is Box–Behnken statistical design which,as an independent quadratic design, does not contain an embeddedfactorial or fractional factorial design and uses a relatively smallnumber of observations to estimate the process parameters. Thus,for analysis of three process parameters, Box–Behnken offers the
D. Ghosh et al. / Bioresource Technology 106 (2012) 154–160 155
advantage of requiring the least number of experimental runs(Whittinghill, 1998). In the present study response surface method-ology was used to maximize the molar hydrogen yield from glycerolduring photofermentation by R. palustris (CGA009). This methodpermitted the examination of the effect of three important processparameters; light intensity, glycerol concentration and glutamateconcentration, and their interaction on the molar hydrogen yield.
2. Methods
2.1. Bacterial strain and culture conditions
The photosynthetic purple bacterium R. palustris (CGA009) wasmaintained regularly in screw cap sealed tubes (1.6 cm by 12.5 cm)completely filled with RCV succinate amended with biotin (15 lg/l) and para-amino-acid benzoic acid (200 lg/l) and incubated at30 �C in an environmental chamber Biotronette Mark III (Lab-lineInstruments) equipped with three 150 W incandescent bulbs. Acrude glycerol fraction was obtained from Rothsay Biodiesel, alarge, high volume, Canadian biodiesel manufacturer. Methanolrepresents one of the single largest cost factors in biodiesel manu-facture from waste products and is routinely recovered from theglycerol fraction by large scale manufacturers as a cost effectiveprocedure. Thus the crude glycerol fraction is typically <0.5%methanol.
2.2. Photofermentation of glycerol
Hydrogen production from crude glycerol was measured using125 ml serum bottles containing RCV medium made up with eithersuccinate or a crude glycerol fraction derived from biodiesel man-ufacture as carbon source, and ammonium sulfate or glutamate asnitrogen source at the indicated concentrations. Inoculation into80 ml of RCV was made with 5 ml of bacterial culture in the latelog phase of growth. The bottles were fitted with rubber stoppers,purged for 15 min with oxygen-free argon, and then submerged ina 30 �C water bath. The intensity of light provided by a panel of six50 W halogen bulbs was 200 W/m2 at the surface of the bottles.The hydrogen produced was measured by water displacementusing graduated cylinders connected to the serum bottles by rela-tively hydrogen impermeable FEP 890 tubing.
2.3. Analytical procedures
The concentration of hydrogen in the collected gas was deter-mined using a gas chromatograph (Shimadzu GC-8A) equippedwith a thermal conductivity detector and a 1 m column packedwith molecular sieve 5A with as carrier gas. Glycerol concentra-tions were determined spectrophotometrically at 410 as 3,5-diace-tyl-1,4-dihydrolutidine, produced by periodate oxidation andreaction with acetylacetone in the presence of ammonium acetate(Bondioli and Della Bella, 2005). The crude biodiesel fraction had aglycerol content of 85%.
In vivo nitrogenase activity was measured by the acetylenereduction assay (Hallenbeck et al., 1982) with 5 ml culture sam-ples. Solutions were made anaerobic by sparging with oxygen freeargon which had been passed through a heated copper catalyst toremove any traces of oxygen. At the indicated times, 50 ll ofaliquots of the gas phase and the culture were separately with-drawn from the vials for the analysis of ethylene by GC–FIDand Western blot analysis of Fe-protein expression. To monitorFe-protein expression, the culture samples were treated withSDS–PAGE sample buffer (Laemmli and Favre, 1973) and immedi-ately incubated in a boiling-water bath for 5 min. Equal amountsof protein (3 lg/well) were analyzed by Laemmli sodium dodecyl
sulfate–polyacrylamide gel electrophoresis (12.5% total acrylam-ide, 30:0.2 acrylamide/bis-acrylamide (Kanemoto and Ludden,1984) and with subsequent immunoblotting chemiluminescencedetection (LumiGlo chemiluminescence substrate system assay(Mandel Scientific)). Western blots were scanned using a MultiImage machine and the Alpha image 2200 and Image Quant TLv2005 software were used to perform densitometric analysis ofthe labeled bands. Protein concentrations were determined bythe Bradford method (Bradford, 1976) after 2 min of sonicationof whole cell culture.
2.4. Optimization study
A 3K Box–Behnken model was used as the experimental designmodel to optimize key process parameters for enhanced hydrogenproduction. For three factors, the Box–Behnken design offers someadvantages in requiring fewer experimental runs and is rotatable ifthe variance of the predicted response at any point x depends onlyon the distance of x from the design center point (Box and Behn-ken, 1960). The 3K factorial design also allows efficient estimationof second degree quadratic polynomials and obtains the combina-tion of values that optimizes the response within the region of thethree dimensional observation space (Annadurai et al., 1999). Indeveloping the regression equation, the relation between thecoded values and actual values can be described by the followingequation:
xi ¼ ðXi � X�i Þ=DXi ð1Þ
where xi is the coded value of the ith independent variable, Xi is theuncoded value of the ith independent variable, X�i is the uncodedvalue of the ith independent variable at the center point, and DXi
is the step change value.The levels of the variables and the experimental design are
shown in Table 1. Hydrogen yield was associated with simulta-neous changes in light intensity (100, 175 and 250 W/m2), glycerolconcentration (10, 30 and 50 mM) and the glutamate concentra-tion (1.0, 4.5 and 8.0) of the culture medium. A total of fifteenexperimental runs decided by the 3K factorial Box–Behnken designwere carried out, and the center point was replicated three timesto estimate experimental errors. For predicting the optimal condi-tions, the quadratic polynomial equation was fitted to correlate therelationship between variables and response (i.e. molar hydrogenyield, nitrogenase activity), and estimated with the followingequation:
Y ¼ a0 þX
i¼1
aiXi þX
i¼1
aiiX2i þ
X
i¼1
X
i<j¼2
aijXiXj ð2Þ
where Xi are the input variables, which influence the response var-iable Y, a0 the offset term, ai the ith linear coefficient, aij is the ijthinteraction coefficient. The input values of X1, X2 and X3 correspond-ing to the maximum value of Y were solved by setting the partialderivatives of the functions to zero.
3. Results and discussion
3.1. Influence of process parameters on hydrogen yield andnitrogenase activity
R. palustris produces hydrogen from glycerol in a nitrogenasedependent reaction. Therefore, greater hydrogen yields could possi-bly be obtained through bioprocess optimization of nitrogenaseactivity. A number of variables could possibly restrict effective nitro-genase activity and thus hydrogen yields. Assuming an adequatemedium formulation, the most important key parameters are prob-ably glycerol concentration, glutamate concentration and light
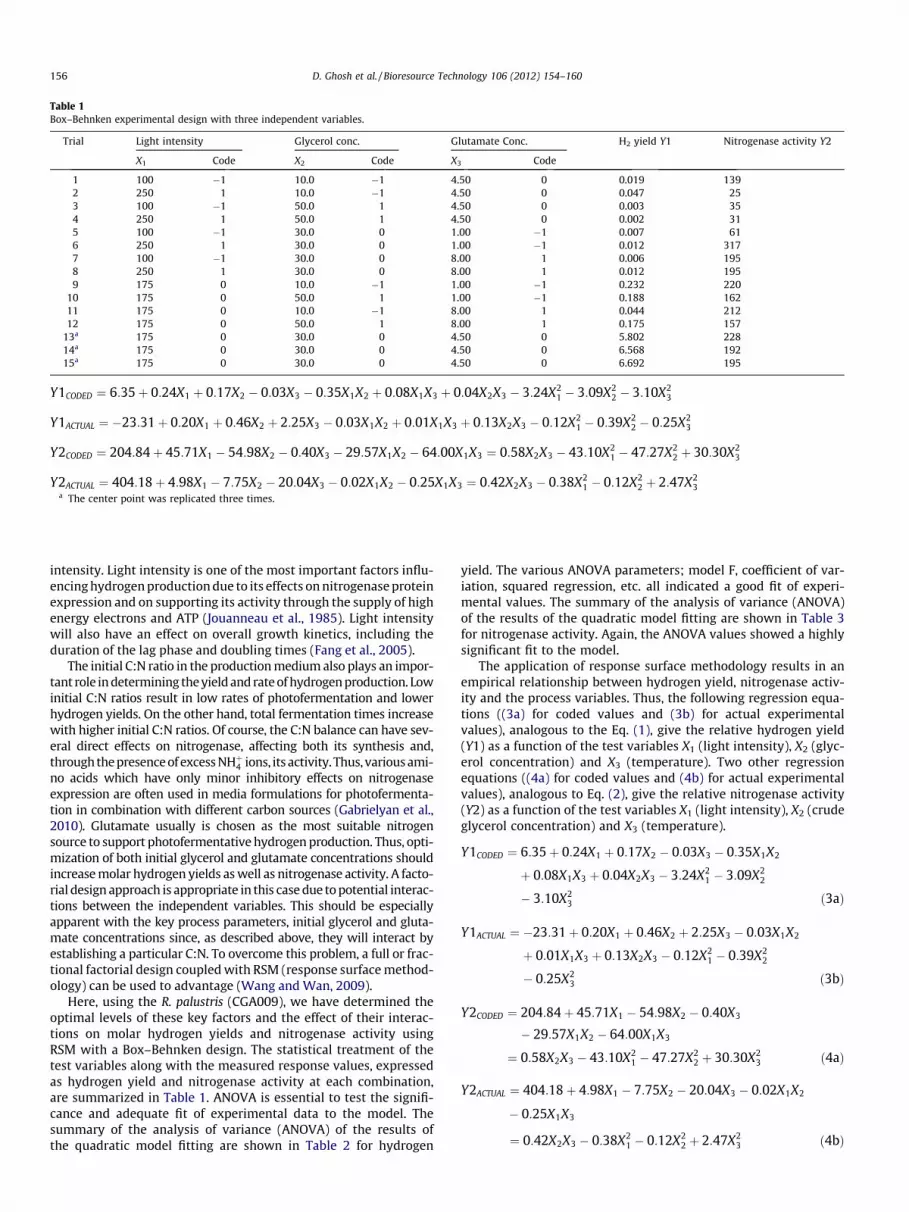
Table 1Box–Behnken experimental design with three independent variables.
Trial Light intensity Glycerol conc. Glutamate Conc. H2 yield Y1 Nitrogenase activity Y2
X1 Code X2 Code X3 Code
1 100 �1 10.0 �1 4.50 0 0.019 1392 250 1 10.0 �1 4.50 0 0.047 253 100 �1 50.0 1 4.50 0 0.003 354 250 1 50.0 1 4.50 0 0.002 315 100 �1 30.0 0 1.00 �1 0.007 616 250 1 30.0 0 1.00 �1 0.012 3177 100 �1 30.0 0 8.00 1 0.006 1958 250 1 30.0 0 8.00 1 0.012 1959 175 0 10.0 �1 1.00 �1 0.232 220
10 175 0 50.0 1 1.00 �1 0.188 16211 175 0 10.0 �1 8.00 1 0.044 21212 175 0 50.0 1 8.00 1 0.175 157
13a 175 0 30.0 0 4.50 0 5.802 22814a 175 0 30.0 0 4.50 0 6.568 19215a 175 0 30.0 0 4.50 0 6.692 195
Y1CODED ¼ 6:35þ 0:24X1 þ 0:17X2 � 0:03X3 � 0:35X1X2 þ 0:08X1X3 þ 0:04X2X3 � 3:24X21 � 3:09X2
2 � 3:10X23
Y1ACTUAL ¼ �23:31þ 0:20X1 þ 0:46X2 þ 2:25X3 � 0:03X1X2 þ 0:01X1X3 þ 0:13X2X3 � 0:12X21 � 0:39X2
2 � 0:25X23
Y2CODED ¼ 204:84þ 45:71X1 � 54:98X2 � 0:40X3 � 29:57X1X2 � 64:00X1X3 ¼ 0:58X2X3 � 43:10X21 � 47:27X2
2 þ 30:30X23
Y2ACTUAL ¼ 404:18þ 4:98X1 � 7:75X2 � 20:04X3 � 0:02X1X2 � 0:25X1X3 ¼ 0:42X2X3 � 0:38X21 � 0:12X2
2 þ 2:47X23
a The center point was replicated three times.
156 D. Ghosh et al. / Bioresource Technology 106 (2012) 154–160
intensity. Light intensity is one of the most important factors influ-encing hydrogen production due to its effects on nitrogenase proteinexpression and on supporting its activity through the supply of highenergy electrons and ATP (Jouanneau et al., 1985). Light intensitywill also have an effect on overall growth kinetics, including theduration of the lag phase and doubling times (Fang et al., 2005).
The initial C:N ratio in the production medium also plays an impor-tant role in determining the yield and rate of hydrogen production. Lowinitial C:N ratios result in low rates of photofermentation and lowerhydrogen yields. On the other hand, total fermentation times increasewith higher initial C:N ratios. Of course, the C:N balance can have sev-eral direct effects on nitrogenase, affecting both its synthesis and,through the presence of excess NHþ4 ions, its activity. Thus, various ami-no acids which have only minor inhibitory effects on nitrogenaseexpression are often used in media formulations for photofermenta-tion in combination with different carbon sources (Gabrielyan et al.,2010). Glutamate usually is chosen as the most suitable nitrogensource to support photofermentative hydrogen production. Thus, opti-mization of both initial glycerol and glutamate concentrations shouldincrease molar hydrogen yields as well as nitrogenase activity. A facto-rial design approach is appropriate in this case due to potential interac-tions between the independent variables. This should be especiallyapparent with the key process parameters, initial glycerol and gluta-mate concentrations since, as described above, they will interact byestablishing a particular C:N. To overcome this problem, a full or frac-tional factorial design coupled with RSM (response surface method-ology) can be used to advantage (Wang and Wan, 2009).
Here, using the R. palustris (CGA009), we have determined theoptimal levels of these key factors and the effect of their interac-tions on molar hydrogen yields and nitrogenase activity usingRSM with a Box–Behnken design. The statistical treatment of thetest variables along with the measured response values, expressedas hydrogen yield and nitrogenase activity at each combination,are summarized in Table 1. ANOVA is essential to test the signifi-cance and adequate fit of experimental data to the model. Thesummary of the analysis of variance (ANOVA) of the results ofthe quadratic model fitting are shown in Table 2 for hydrogen
yield. The various ANOVA parameters; model F, coefficient of var-iation, squared regression, etc. all indicated a good fit of experi-mental values. The summary of the analysis of variance (ANOVA)of the results of the quadratic model fitting are shown in Table 3for nitrogenase activity. Again, the ANOVA values showed a highlysignificant fit to the model.
The application of response surface methodology results in anempirical relationship between hydrogen yield, nitrogenase activ-ity and the process variables. Thus, the following regression equa-tions ((3a) for coded values and (3b) for actual experimentalvalues), analogous to the Eq. (1), give the relative hydrogen yield(Y1) as a function of the test variables X1 (light intensity), X2 (glyc-erol concentration) and X3 (temperature). Two other regressionequations ((4a) for coded values and (4b) for actual experimentalvalues), analogous to Eq. (2), give the relative nitrogenase activity(Y2) as a function of the test variables X1 (light intensity), X2 (crudeglycerol concentration) and X3 (temperature).
Y1CODED ¼ 6:35þ 0:24X1 þ 0:17X2 � 0:03X3 � 0:35X1X2
þ 0:08X1X3 þ 0:04X2X3 � 3:24X21 � 3:09X2
2
� 3:10X23 ð3aÞ
Y1ACTUAL ¼ �23:31þ 0:20X1 þ 0:46X2 þ 2:25X3 � 0:03X1X2
þ 0:01X1X3 þ 0:13X2X3 � 0:12X21 � 0:39X2
2
� 0:25X23 ð3bÞ
Y2CODED ¼ 204:84þ 45:71X1 � 54:98X2 � 0:40X3
� 29:57X1X2 � 64:00X1X3
¼ 0:58X2X3 � 43:10X21 � 47:27X2
2 þ 30:30X23 ð4aÞ
Y2ACTUAL ¼ 404:18þ 4:98X1 � 7:75X2 � 20:04X3 � 0:02X1X2
� 0:25X1X3
¼ 0:42X2X3 � 0:38X21 � 0:12X2
2 þ 2:47X23 ð4bÞ
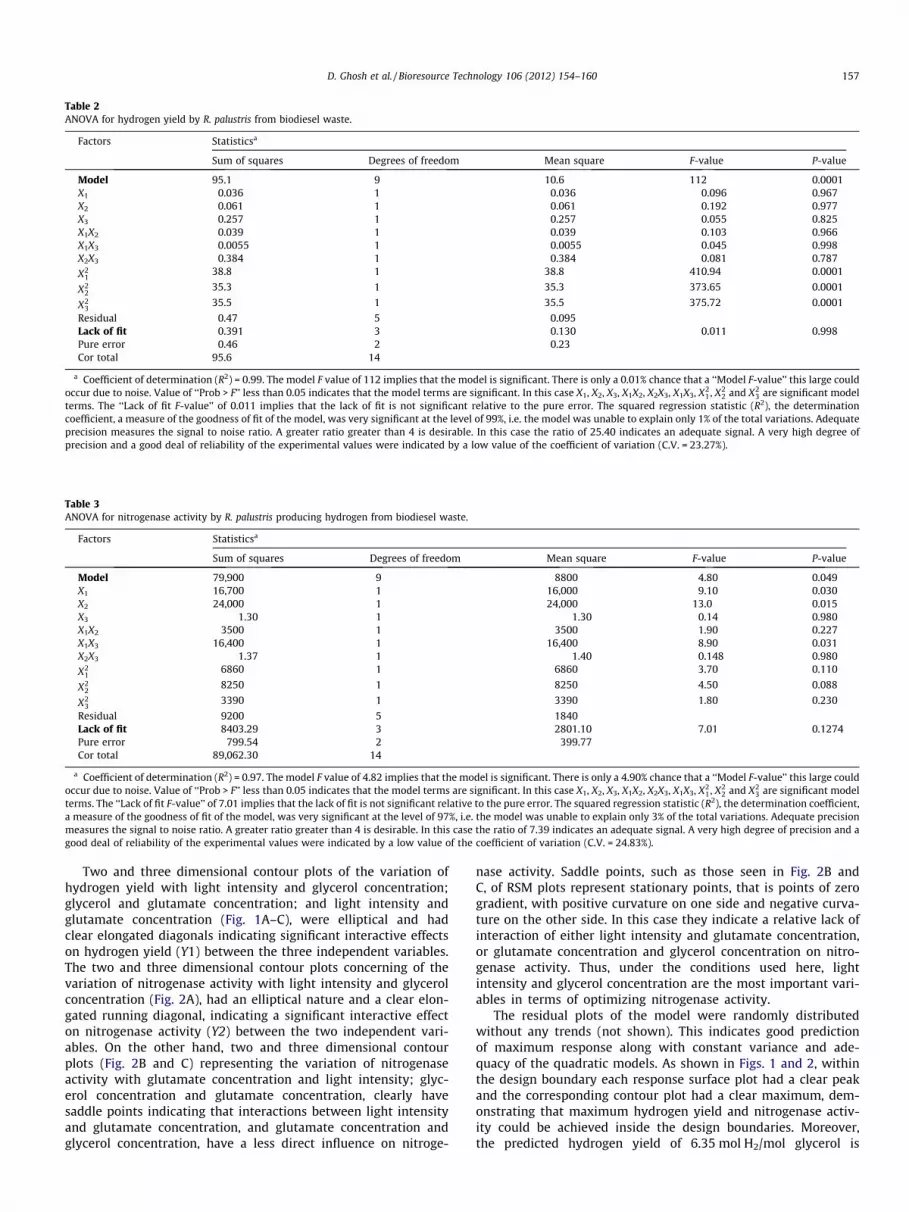
Table 2ANOVA for hydrogen yield by R. palustris from biodiesel waste.
Factors Statisticsa
Sum of squares Degrees of freedom Mean square F-value P-value
Model 95.1 9 10.6 112 0.0001X1 0.036 1 0.036 0.096 0.967X2 0.061 1 0.061 0.192 0.977X3 0.257 1 0.257 0.055 0.825X1X2 0.039 1 0.039 0.103 0.966X1X3 0.0055 1 0.0055 0.045 0.998X2X3 0.384 1 0.384 0.081 0.787
X21
38.8 1 38.8 410.94 0.0001
X22
35.3 1 35.3 373.65 0.0001
X23
35.5 1 35.5 375.72 0.0001
Residual 0.47 5 0.095Lack of fit 0.391 3 0.130 0.011 0.998Pure error 0.46 2 0.23Cor total 95.6 14
a Coefficient of determination (R2) = 0.99. The model F value of 112 implies that the model is significant. There is only a 0.01% chance that a ‘‘Model F-value’’ this large couldoccur due to noise. Value of ‘‘Prob > F’’ less than 0.05 indicates that the model terms are significant. In this case X1, X2, X3, X1X2, X2X3, X1X3, X2
1, X22 and X2
3 are significant modelterms. The ‘‘Lack of fit F-value’’ of 0.011 implies that the lack of fit is not significant relative to the pure error. The squared regression statistic (R2), the determinationcoefficient, a measure of the goodness of fit of the model, was very significant at the level of 99%, i.e. the model was unable to explain only 1% of the total variations. Adequateprecision measures the signal to noise ratio. A greater ratio greater than 4 is desirable. In this case the ratio of 25.40 indicates an adequate signal. A very high degree ofprecision and a good deal of reliability of the experimental values were indicated by a low value of the coefficient of variation (C.V. = 23.27%).
Table 3ANOVA for nitrogenase activity by R. palustris producing hydrogen from biodiesel waste.
Factors Statisticsa
Sum of squares Degrees of freedom Mean square F-value P-value
Model 79,900 9 8800 4.80 0.049X1 16,700 1 16,000 9.10 0.030X2 24,000 1 24,000 13.0 0.015X3 1.30 1 1.30 0.14 0.980X1X2 3500 1 3500 1.90 0.227X1X3 16,400 1 16,400 8.90 0.031X2X3 1.37 1 1.40 0.148 0.980
X21
6860 1 6860 3.70 0.110
X22
8250 1 8250 4.50 0.088
X23
3390 1 3390 1.80 0.230
Residual 9200 5 1840Lack of fit 8403.29 3 2801.10 7.01 0.1274Pure error 799.54 2 399.77Cor total 89,062.30 14
a Coefficient of determination (R2) = 0.97. The model F value of 4.82 implies that the model is significant. There is only a 4.90% chance that a ‘‘Model F-value’’ this large couldoccur due to noise. Value of ‘‘Prob > F’’ less than 0.05 indicates that the model terms are significant. In this case X1, X2, X3, X1X2, X2X3, X1X3, X2
1, X22 and X2
3 are significant modelterms. The ‘‘Lack of fit F-value’’ of 7.01 implies that the lack of fit is not significant relative to the pure error. The squared regression statistic (R2), the determination coefficient,a measure of the goodness of fit of the model, was very significant at the level of 97%, i.e. the model was unable to explain only 3% of the total variations. Adequate precisionmeasures the signal to noise ratio. A greater ratio greater than 4 is desirable. In this case the ratio of 7.39 indicates an adequate signal. A very high degree of precision and agood deal of reliability of the experimental values were indicated by a low value of the coefficient of variation (C.V. = 24.83%).
D. Ghosh et al. / Bioresource Technology 106 (2012) 154–160 157
Two and three dimensional contour plots of the variation ofhydrogen yield with light intensity and glycerol concentration;glycerol and glutamate concentration; and light intensity andglutamate concentration (Fig. 1A–C), were elliptical and hadclear elongated diagonals indicating significant interactive effectson hydrogen yield (Y1) between the three independent variables.The two and three dimensional contour plots concerning of thevariation of nitrogenase activity with light intensity and glycerolconcentration (Fig. 2A), had an elliptical nature and a clear elon-gated running diagonal, indicating a significant interactive effecton nitrogenase activity (Y2) between the two independent vari-ables. On the other hand, two and three dimensional contourplots (Fig. 2B and C) representing the variation of nitrogenaseactivity with glutamate concentration and light intensity; glyc-erol concentration and glutamate concentration, clearly havesaddle points indicating that interactions between light intensityand glutamate concentration, and glutamate concentration andglycerol concentration, have a less direct influence on nitroge-
nase activity. Saddle points, such as those seen in Fig. 2B andC, of RSM plots represent stationary points, that is points of zerogradient, with positive curvature on one side and negative curva-ture on the other side. In this case they indicate a relative lack ofinteraction of either light intensity and glutamate concentration,or glutamate concentration and glycerol concentration on nitro-genase activity. Thus, under the conditions used here, lightintensity and glycerol concentration are the most important vari-ables in terms of optimizing nitrogenase activity.
The residual plots of the model were randomly distributedwithout any trends (not shown). This indicates good predictionof maximum response along with constant variance and ade-quacy of the quadratic models. As shown in Figs. 1 and 2, withinthe design boundary each response surface plot had a clear peakand the corresponding contour plot had a clear maximum, dem-onstrating that maximum hydrogen yield and nitrogenase activ-ity could be achieved inside the design boundaries. Moreover,the predicted hydrogen yield of 6.35 mol H2/mol glycerol is
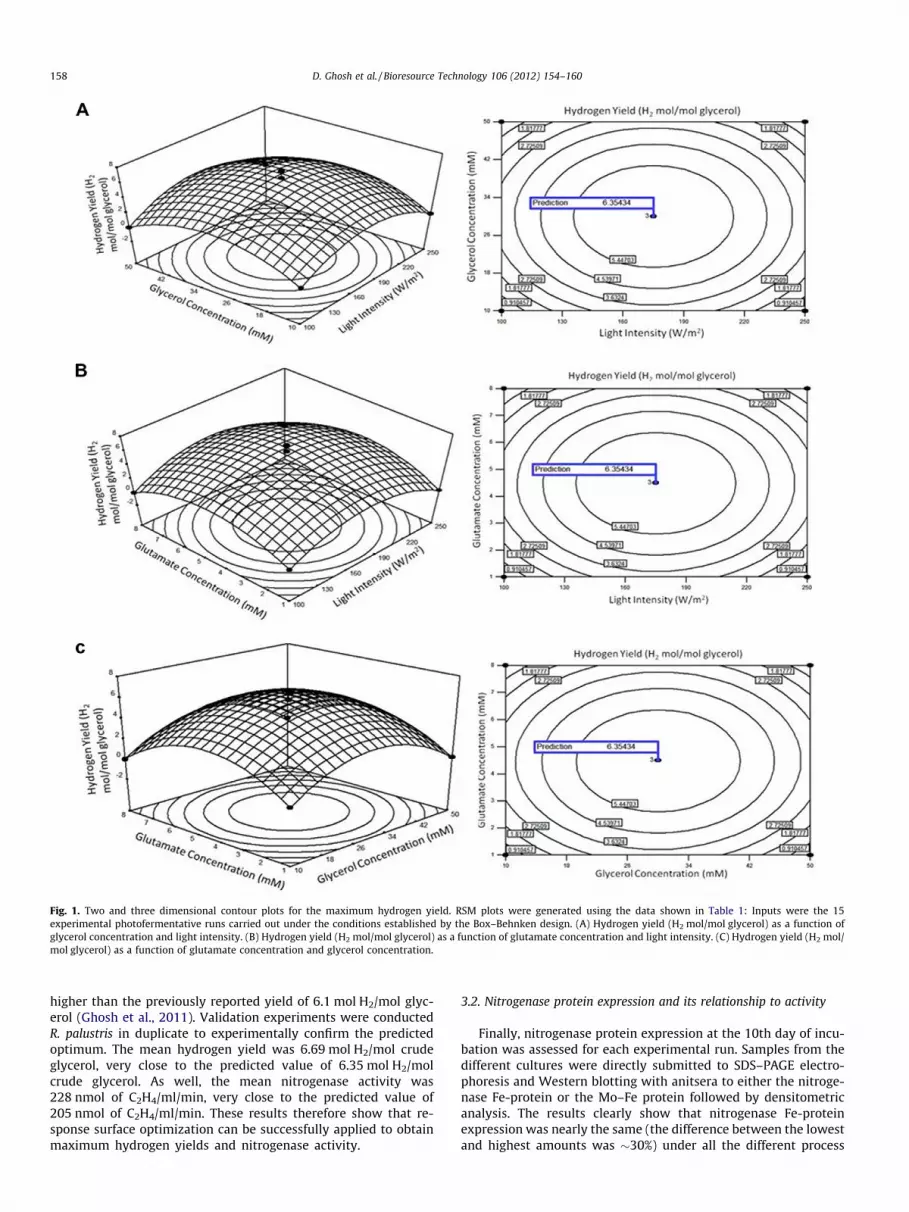
Fig. 1. Two and three dimensional contour plots for the maximum hydrogen yield. RSM plots were generated using the data shown in Table 1: Inputs were the 15experimental photofermentative runs carried out under the conditions established by the Box–Behnken design. (A) Hydrogen yield (H2 mol/mol glycerol) as a function ofglycerol concentration and light intensity. (B) Hydrogen yield (H2 mol/mol glycerol) as a function of glutamate concentration and light intensity. (C) Hydrogen yield (H2 mol/mol glycerol) as a function of glutamate concentration and glycerol concentration.
158 D. Ghosh et al. / Bioresource Technology 106 (2012) 154–160
higher than the previously reported yield of 6.1 mol H2/mol glyc-erol (Ghosh et al., 2011). Validation experiments were conductedR. palustris in duplicate to experimentally confirm the predictedoptimum. The mean hydrogen yield was 6.69 mol H2/mol crudeglycerol, very close to the predicted value of 6.35 mol H2/molcrude glycerol. As well, the mean nitrogenase activity was228 nmol of C2H4/ml/min, very close to the predicted value of205 nmol of C2H4/ml/min. These results therefore show that re-sponse surface optimization can be successfully applied to obtainmaximum hydrogen yields and nitrogenase activity.
3.2. Nitrogenase protein expression and its relationship to activity
Finally, nitrogenase protein expression at the 10th day of incu-bation was assessed for each experimental run. Samples from thedifferent cultures were directly submitted to SDS–PAGE electro-phoresis and Western blotting with anitsera to either the nitroge-nase Fe-protein or the Mo–Fe protein followed by densitometricanalysis. The results clearly show that nitrogenase Fe-proteinexpression was nearly the same (the difference between the lowestand highest amounts was �30%) under all the different process
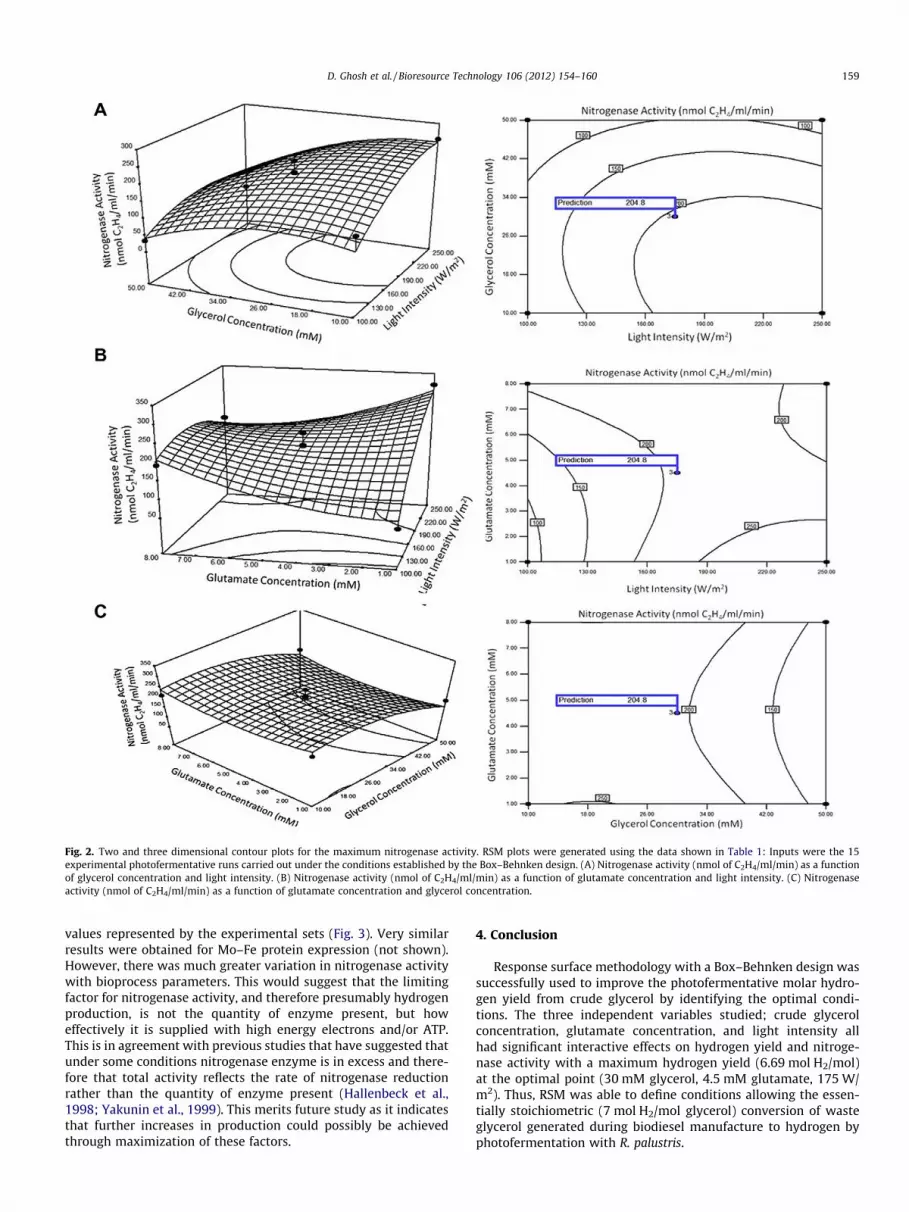
Fig. 2. Two and three dimensional contour plots for the maximum nitrogenase activity. RSM plots were generated using the data shown in Table 1: Inputs were the 15experimental photofermentative runs carried out under the conditions established by the Box–Behnken design. (A) Nitrogenase activity (nmol of C2H4/ml/min) as a functionof glycerol concentration and light intensity. (B) Nitrogenase activity (nmol of C2H4/ml/min) as a function of glutamate concentration and light intensity. (C) Nitrogenaseactivity (nmol of C2H4/ml/min) as a function of glutamate concentration and glycerol concentration.
D. Ghosh et al. / Bioresource Technology 106 (2012) 154–160 159
values represented by the experimental sets (Fig. 3). Very similarresults were obtained for Mo–Fe protein expression (not shown).However, there was much greater variation in nitrogenase activitywith bioprocess parameters. This would suggest that the limitingfactor for nitrogenase activity, and therefore presumably hydrogenproduction, is not the quantity of enzyme present, but howeffectively it is supplied with high energy electrons and/or ATP.This is in agreement with previous studies that have suggested thatunder some conditions nitrogenase enzyme is in excess and there-fore that total activity reflects the rate of nitrogenase reductionrather than the quantity of enzyme present (Hallenbeck et al.,1998; Yakunin et al., 1999). This merits future study as it indicatesthat further increases in production could possibly be achievedthrough maximization of these factors.
4. Conclusion
Response surface methodology with a Box–Behnken design wassuccessfully used to improve the photofermentative molar hydro-gen yield from crude glycerol by identifying the optimal condi-tions. The three independent variables studied; crude glycerolconcentration, glutamate concentration, and light intensity allhad significant interactive effects on hydrogen yield and nitroge-nase activity with a maximum hydrogen yield (6.69 mol H2/mol)at the optimal point (30 mM glycerol, 4.5 mM glutamate, 175 W/m2). Thus, RSM was able to define conditions allowing the essen-tially stoichiometric (7 mol H2/mol glycerol) conversion of wasteglycerol generated during biodiesel manufacture to hydrogen byphotofermentation with R. palustris.
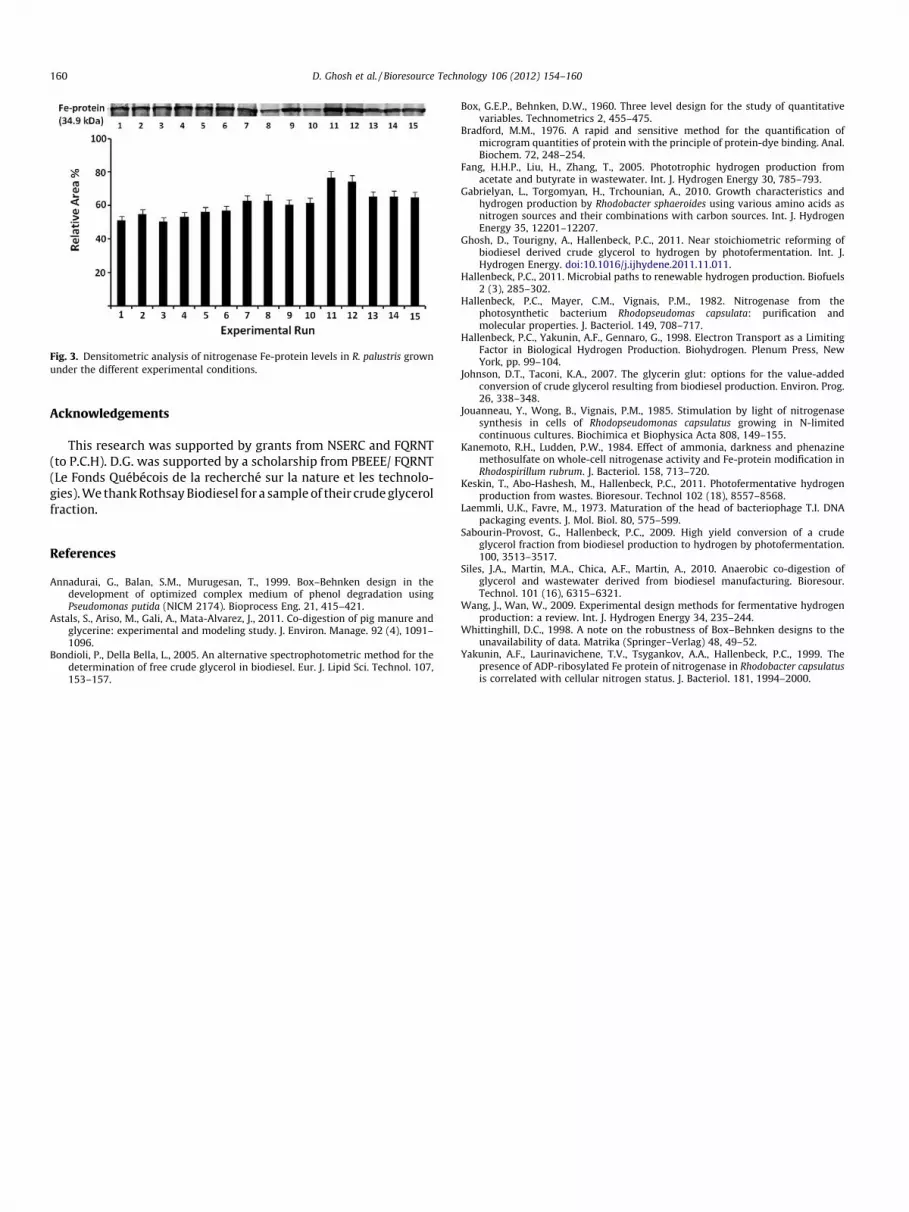
Fig. 3. Densitometric analysis of nitrogenase Fe-protein levels in R. palustris grownunder the different experimental conditions.
160 D. Ghosh et al. / Bioresource Technology 106 (2012) 154–160
Acknowledgements
This research was supported by grants from NSERC and FQRNT(to P.C.H). D.G. was supported by a scholarship from PBEEE/ FQRNT(Le Fonds Québécois de la recherché sur la nature et les technolo-gies). We thank Rothsay Biodiesel for a sample of their crude glycerolfraction.
References
Annadurai, G., Balan, S.M., Murugesan, T., 1999. Box–Behnken design in thedevelopment of optimized complex medium of phenol degradation usingPseudomonas putida (NICM 2174). Bioprocess Eng. 21, 415–421.
Astals, S., Ariso, M., Gali, A., Mata-Alvarez, J., 2011. Co-digestion of pig manure andglycerine: experimental and modeling study. J. Environ. Manage. 92 (4), 1091–1096.
Bondioli, P., Della Bella, L., 2005. An alternative spectrophotometric method for thedetermination of free crude glycerol in biodiesel. Eur. J. Lipid Sci. Technol. 107,153–157.
Box, G.E.P., Behnken, D.W., 1960. Three level design for the study of quantitativevariables. Technometrics 2, 455–475.
Bradford, M.M., 1976. A rapid and sensitive method for the quantification ofmicrogram quantities of protein with the principle of protein-dye binding. Anal.Biochem. 72, 248–254.
Fang, H.H.P., Liu, H., Zhang, T., 2005. Phototrophic hydrogen production fromacetate and butyrate in wastewater. Int. J. Hydrogen Energy 30, 785–793.
Gabrielyan, L., Torgomyan, H., Trchounian, A., 2010. Growth characteristics andhydrogen production by Rhodobacter sphaeroides using various amino acids asnitrogen sources and their combinations with carbon sources. Int. J. HydrogenEnergy 35, 12201–12207.
Ghosh, D., Tourigny, A., Hallenbeck, P.C., 2011. Near stoichiometric reforming ofbiodiesel derived crude glycerol to hydrogen by photofermentation. Int. J.Hydrogen Energy. doi:10.1016/j.ijhydene.2011.11.011.
Hallenbeck, P.C., 2011. Microbial paths to renewable hydrogen production. Biofuels2 (3), 285–302.
Hallenbeck, P.C., Mayer, C.M., Vignais, P.M., 1982. Nitrogenase from thephotosynthetic bacterium Rhodopseudomas capsulata: purification andmolecular properties. J. Bacteriol. 149, 708–717.
Hallenbeck, P.C., Yakunin, A.F., Gennaro, G., 1998. Electron Transport as a LimitingFactor in Biological Hydrogen Production. Biohydrogen. Plenum Press, NewYork, pp. 99–104.
Johnson, D.T., Taconi, K.A., 2007. The glycerin glut: options for the value-addedconversion of crude glycerol resulting from biodiesel production. Environ. Prog.26, 338–348.
Jouanneau, Y., Wong, B., Vignais, P.M., 1985. Stimulation by light of nitrogenasesynthesis in cells of Rhodopseudomonas capsulatus growing in N-limitedcontinuous cultures. Biochimica et Biophysica Acta 808, 149–155.
Kanemoto, R.H., Ludden, P.W., 1984. Effect of ammonia, darkness and phenazinemethosulfate on whole-cell nitrogenase activity and Fe-protein modification inRhodospirillum rubrum. J. Bacteriol. 158, 713–720.
Keskin, T., Abo-Hashesh, M., Hallenbeck, P.C., 2011. Photofermentative hydrogenproduction from wastes. Bioresour. Technol 102 (18), 8557–8568.
Laemmli, U.K., Favre, M., 1973. Maturation of the head of bacteriophage T.I. DNApackaging events. J. Mol. Biol. 80, 575–599.
Sabourin-Provost, G., Hallenbeck, P.C., 2009. High yield conversion of a crudeglycerol fraction from biodiesel production to hydrogen by photofermentation.100, 3513–3517.
Siles, J.A., Martin, M.A., Chica, A.F., Martin, A., 2010. Anaerobic co-digestion ofglycerol and wastewater derived from biodiesel manufacturing. Bioresour.Technol. 101 (16), 6315–6321.
Wang, J., Wan, W., 2009. Experimental design methods for fermentative hydrogenproduction: a review. Int. J. Hydrogen Energy 34, 235–244.
Whittinghill, D.C., 1998. A note on the robustness of Box–Behnken designs to theunavailability of data. Matrika (Springer–Verlag) 48, 49–52.
Yakunin, A.F., Laurinavichene, T.V., Tsygankov, A.A., Hallenbeck, P.C., 1999. Thepresence of ADP-ribosylated Fe protein of nitrogenase in Rhodobacter capsulatusis correlated with cellular nitrogen status. J. Bacteriol. 181, 1994–2000.