stocks end august unchanged · 1 stocks end august unchanged the s&p 500 index trended lower...
TRANSCRIPT

1
Stocks End August UnchangedThe S&P 500 index trended lower during most of August, but rallied in the last week to recover those losses. At the current mark of 2,477, it remains just below the all-time high of 2,490 that it hit on August 8th.
The chart remains bullish and the RSI shows room to continue higher before becoming overbought. After initially making a lower low in mid-August, the index has put in a higher low and higher high. I would not be surprised to see a new record in September.
The ContrarianThe ContrarianReportReport
Jason Hamlin
September 2017
BU I LD I NG WE A L TH WI T H C O NT R AR I AN I NV E ST M EN T R E S EA R C H
The employment report came in weaker-than-expected during August. Just 156k new jobs were added versus the consensus forecast of 180k. The chart to the left highlights a clear downtrend since 2015. Making matters worse, the months of June and July were revised down by 41k jobs.
The headline unemployment rate edged back up to 4.4%. U6 unemployment also came in higher at 8.59% and the Shadow Stats alternative measure of unemployment ticked up slightly to 22.2%.

2
BOTH ISM
MANUFACTURING AND
SERVICES IMPROVED
SIGNIFICANTLY DURING
SEPTEMBER.
Q3 GDP Estimate Drops from 3.7% to 3.2%
Average hourly earnings rose just 0.1% to $26.39 an hour and average weekly earnings actually fell 0.2%, reflecting a 0.3% drop in the workweek.
When you add this weak wage growth with already weaker-than-expected PPI and CPI data, it decreases the odds of additional rate hikes in 2017. The FED is not likely to be able to unwind their balance sheet and raise interest rates higher in this fragile environment.
The civilian-employment population ratio dropped from 60.2 to 60.1. It measures the proportion of the country's working age population that is employed.
The Atlanta FED's Q3 annualized GDP estimate dropped from 3.7% a month ago to 3.2% today. This revision was certainly driven by the weaker-than-expected employment report released on Friday.
The decline could also have to do with U.S. sovereign risk climbing to its highest level since 2008. This comes as Fitch announced that the “AAA” rating of the U.S. is at risk if lawmakers fail to raise the debt ceiling in time to avoid a government shutdown.
The chart above shows the percentage of GDP growth that has gone to labor over time. It is the compensation of employees, wages and salaries disbursed. While laborers used to receive closer to50% of this growth, it has trended down over time to around 40%. The bottom line is that jobs have to be assessed both in quantity and quality. The quality part has been largely missing over thepast 40 years and certainly from the most recent “recovery” in the employment market.

3
The oil chart remains bearish despite thestorm-related bounce this past week. The price made a lower high at $50.43 and proceeded to drop below both the 200-day and 100-day moving averages.
The RSI has room to move in either direction, but the trend remains to the downside. There is support around $42, should the price continue to slide in September. If this support fails, I expect the oil price to drop into the high 30's.
Natural Gas Price Climbs Back Above $3.00
Oil Price Slides Back Below $47
The oil price trended to the downside during the month of August. Prices had fallen towards $45, but the storms have shuttered refineries, cutting output and pushing prices back to $47. However, the OPEC deal to cap output expires in March and prices may start to climb higher in anticipationof increased supply early next year.
The natural gas price climbed from a low around $2.75 back above resistance at $3 during the past month. Hurricane Harvey is now projected to be at least the 2nd most costly storm in U.S. history and has disruptedsupplies of natural gas.
The RSI is pointed higher with room to run and the price broke through resistance at the 100-day moving average. Look for more upside in the weeks ahead.
If the price can break above the 200-day moving average and downtrend line, we could see a major move back towards $4. In such a scenario, I expect leveraged gains from many natural gas stocks. Aprevious GSB position, Southwestern Energy (SWN), would be a candidate for playing this bounce in natural gas. While their recent financials missed the street's expectations, they nevertheless swung to a quarterly profit of $224 million. This compares to a loss of over $600 million in the quarter last year. I will look for a breakout on increasing volume to enter this trade.
You can donate to disaster-relief in Texas with Bitcoin at unsung.org.

4
Gold Continues to Rally, Up $58or 4.6% to $1,325
In a very bullish technical development, the gold price broke through
multiple points of resistance.
After briefly falling to $1,200 in early July, the gold price has advanced significantly higher to $1,325 on Friday.
The gold price has pierced through both the downward sloping resistance line and double-top resistance line at $1,300. The RSI has become overbought, so we could see a pullback to prior resistance at $1,300. A bounce off this level would be bullish and increase our confidence of gold making a new multi-year near $1,500 by the end of 2017.
Gold's rise is being fueled by a number of different factors. One is increased geopolitical tensions between the United States and North Korea, the U.S. and Russia, China and India and several other hotspots around the globe.
Political gridlock regarding raising the debt ceiling also threatens a potential government shutdown if opposing sides can't agree in time. Fitch has already promised a downgrade.
With gold breaking out above key resistance, we added Atlantic Gold to the portfolio last week. They will be celebrating their first gold pour at Moose River within the next few weeks and ramp up to full production over the next few months. I believe shares are undervalued, as they have the potential to double the LOM annualized production from their two main satellite deposits.
North Korea, Debt Ceiling, Bonds and Gold
The weak employment report decreases the odds of the FED hiking rates aggressively, which is bullish for gold. The economic optimism over Trump's election has started to fade and investors are increasingly questioning whether the equity rally is long in the tooth. Gold has also benefited in 2017 from a declining U.S. dollar, which has lost over 10% of its value since the start of the year.
It is also interesting to note that gold is outperforming bond prices across all categories. Gold/bond ratios are breakout out to the upside, suggesting that investors are buying gold as a hedge against expensive bond and stock markets. Lastly, China wants to price oil in Yuan, convertible into gold!
5
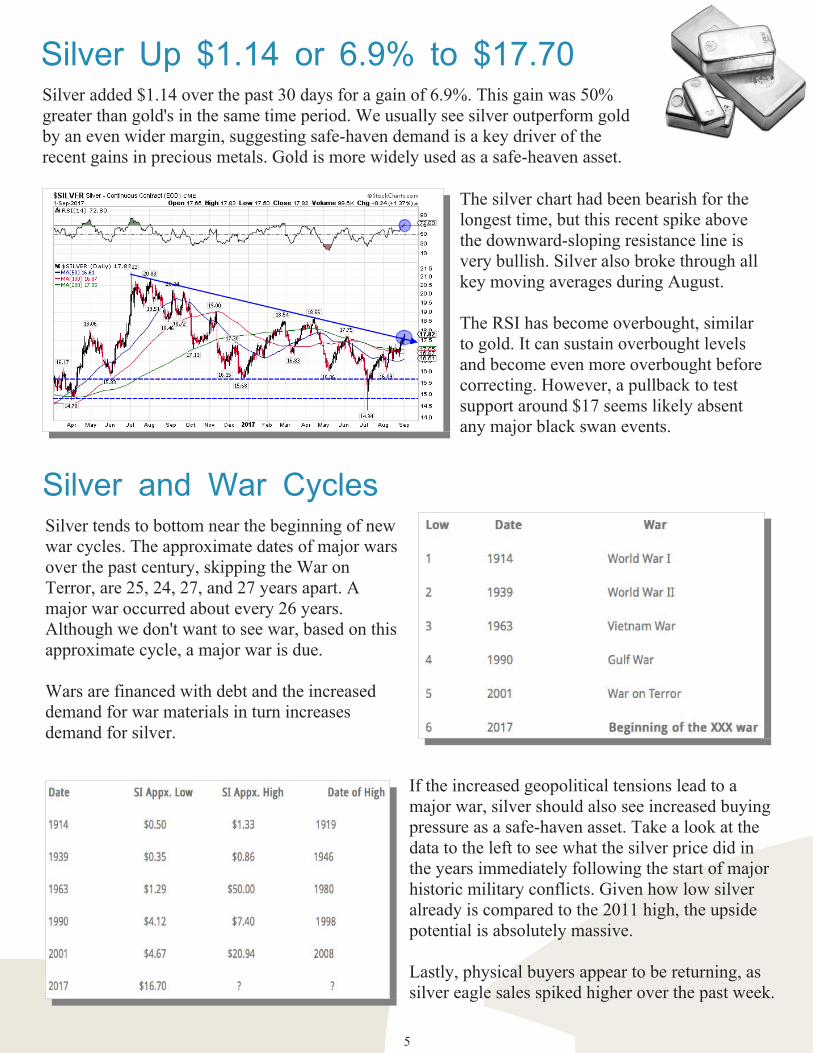
Silver Up $1.14 or 6.9% to $17.70
The silver chart had been bearish for the longest time, but this recent spike above the downward-sloping resistance line is very bullish. Silver also broke through all key moving averages during August.
The RSI has become overbought, similar to gold. It can sustain overbought levels and become even more overbought beforecorrecting. However, a pullback to test support around $17 seems likely absent any major black swan events.
Silver added $1.14 over the past 30 days for a gain of 6.9%. This gain was 50% greater than gold's in the same time period. We usually see silver outperform gold by an even wider margin, suggesting safe-haven demand is a key driver of the recent gains in precious metals. Gold is more widely used as a safe-heaven asset.
Silver and War CyclesSilver tends to bottom near the beginning of new war cycles. The approximate dates of major wars over the past century, skipping the War on Terror, are 25, 24, 27, and 27 years apart. A major war occurred about every 26 years. Although we don't want to see war, based on this approximate cycle, a major war is due.
Wars are financed with debt and the increased demand for war materials in turn increases demand for silver.
If the increased geopolitical tensions lead to a major war, silver should also see increased buying pressure as a safe-haven asset. Take a look at the data to the left to see what the silver price did in the years immediately following the start of major historic military conflicts. Given how low silver already is compared to the 2011 high, the upside potential is absolutely massive.
Lastly, physical buyers appear to be returning, as silver eagle sales spiked higher over the past week.
6
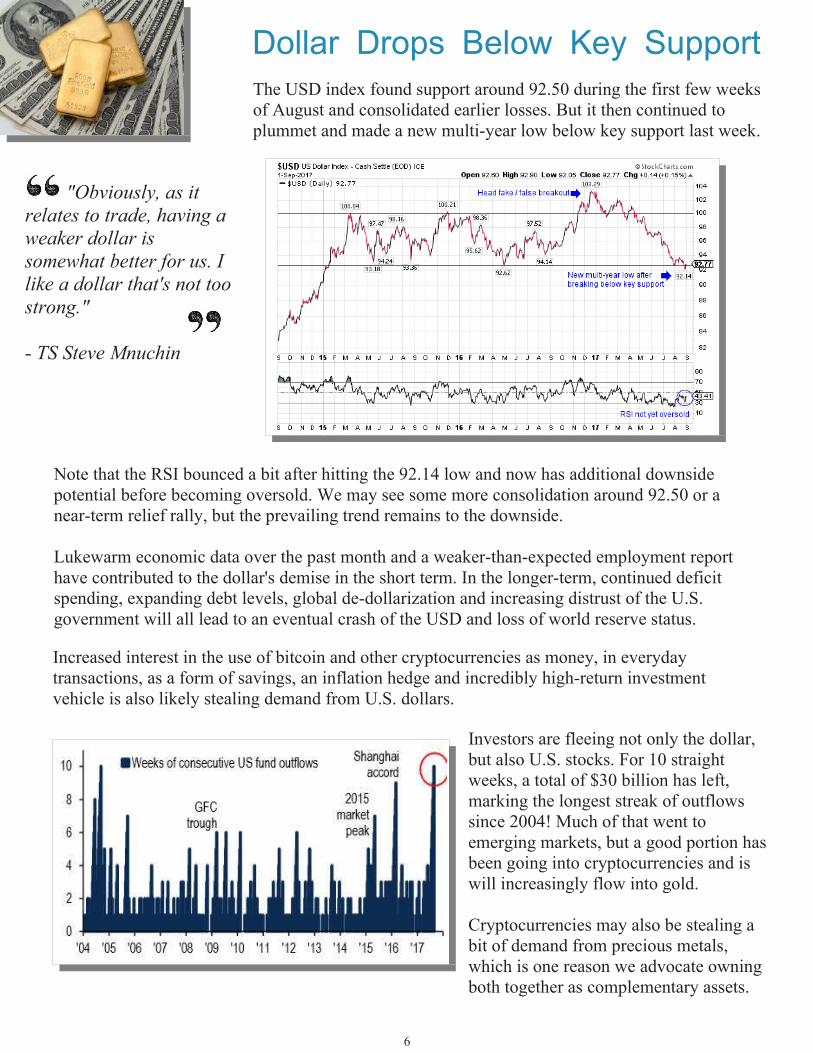
"Obviously, as it
relates to trade, having a
weaker dollar is
somewhat better for us. I
like a dollar that's not too
strong."
- TS Steve Mnuchin
Dollar Drops Below Key Support
Note that the RSI bounced a bit after hitting the 92.14 low and now has additional downside potential before becoming oversold. We may see some more consolidation around 92.50 or a near-term relief rally, but the prevailing trend remains to the downside.
Lukewarm economic data over the past month and a weaker-than-expected employment report have contributed to the dollar's demise in the short term. In the longer-term, continued deficit spending, expanding debt levels, global de-dollarization and increasing distrust of the U.S. government will all lead to an eventual crash of the USD and loss of world reserve status.
The USD index found support around 92.50 during the first few weeks of August and consolidated earlier losses. But it then continued to plummet and made a new multi-year low below key support last week.
Increased interest in the use of bitcoin and other cryptocurrencies as money, in everyday transactions, as a form of savings, an inflation hedge and incredibly high-return investment vehicle is also likely stealing demand from U.S. dollars.
Investors are fleeing not only the dollar, but also U.S. stocks. For 10 straight weeks, a total of $30 billion has left, marking the longest streak of outflows since 2004! Much of that went to emerging markets, but a good portion hasbeen going into cryptocurrencies and is will increasingly flow into gold.
Cryptocurrencies may also be stealing a bit of demand from precious metals, which is one reason we advocate owning both together as complementary assets.

7
August was an incredible month for cryptocurrency investors. The Bitcoin price rocketed from $2,750 to $5,000, before correcting over the past few days to $4,500. Even with the sharp correction, the price is still up 66% in the past month alone and 375% year to date!
The price chart shows the massive upward movement of Bitcoin over the past few months. A correction just started on Friday and I have highlighted key support levels to watch at $4,400, $4,000 and $3,425. Very strong support is at $3,000, but I doubt the price will drop below $4,000 again. With segwit activated and lightning on the way, the winds are behind BTC.
For those looking to invest in Bitcoin for the first time or wanting to add to positions on a dip, I think these types of corrections are excellent buying opportunities. I would look to buy in tranches, allocating 1/3 of funds at $4,400, 1/3 if it should dip to $4,000 and the final 1/3 if it fallstowards $3,425. If there is a strong bounce at $4,000, I would be inclined to go all in at that level.
Cryptocurrencies Rocket toNew Record Highs
The Ethereum price started the month of August at $200 and nearly doubled to $400. It has since pulled back in the latest correction to $350.
The chart suggests there is support around $320, where I would look to add to my current position. If this support fails, there is strong support at $220, although I doubt the price will fall that low.
I continue to be very bullish on cryptocurrencies and hold BTC and ETH as my two largest positions. They may have become overbought and overvalued in the short-term, so the current pullback is not surprising. I plan to add to my positions during this correction and believe we could see Bitcoin at $10,000 and Ethereum at $1,000 within the next 6 to 12 months.
8
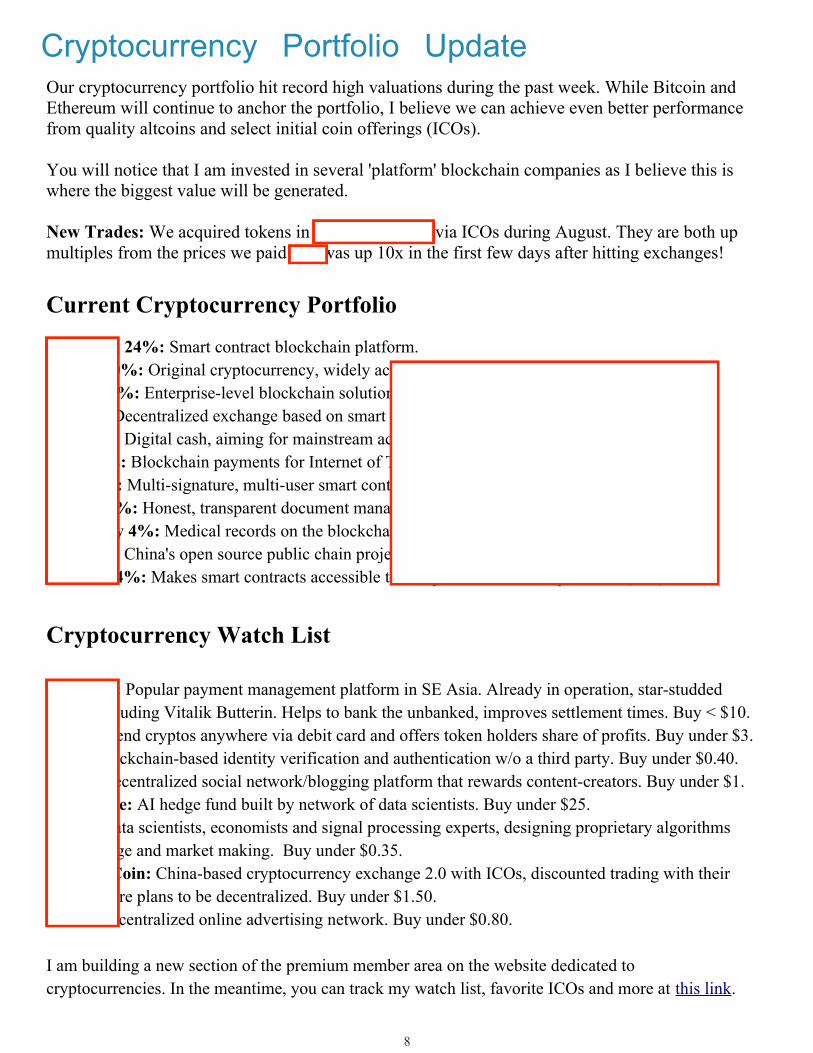
Cryptocurrency Portfolio UpdateOur cryptocurrency portfolio hit record high valuations during the past week. While Bitcoin and Ethereum will continue to anchor the portfolio, I believe we can achieve even better performance from quality altcoins and select initial coin offerings (ICOs).
You will notice that I am invested in several 'platform' blockchain companies as I believe this is where the biggest value will be generated.
New Trades: We acquired tokens in 0x and Blockcat via ICOs during August. They are both up multiples from the prices we paid. 0X was up 10x in the first few days after hitting exchanges!
Current Cryptocurrency Portfolio
Ethereum 24%: Smart contract blockchain platform.
Bitcoin 20%: Original cryptocurrency, widely accepted.
Stratis 12%: Enterprise-level blockchain solutions. (l ink)
0x 10%: Decentralized exchange based on smart contracts (link)
Dash 7%: Digital cash, aiming for mainstream acceptance, fast, private. (l ink)
IOTA 6%: Blockchain payments for Internet of Things, no cost, 'tangle' tech. (link)
NEM 5%: Multi-signature, multi-user smart contracts, huge in Japan. (l ink)
Factom 4%: Honest, transparent document management on blockchain. (l ink)
Patientory 4%: Medical records on the blockchain. (link)
NEO 4%: China's open source public chain project that serves as a smart assets platform. (link)
Blockcat 4%: Makes smart contracts accessible to everyone via intuitive platform. (link)
Cryptocurrency Watch List
OmiseGo: Popular payment management platform in SE Asia. Already in operation, star-studded
board, including Vitalik Butterin. Helps to bank the unbanked, improves settlement times. Buy < $10.
TenX: Spend cryptos anywhere via debit card and offers token holders share of profits. Buy under $3.
Civic: Blockchain-based identity verification and authentication w/o a third party. Buy under $0.40.
Steem: Decentralized social network/blogging platform that rewards content-creators. Buy under $1.
Numeraire: AI hedge fund built by network of data scientists. Buy under $25.
Rialto: Data scientists, economists and signal processing experts, designing proprietary algorithms
for arbitrage and market making. Buy under $0.35.
Binance Coin: China-based cryptocurrency exchange 2.0 with ICOs, discounted trading with their
coins, future plans to be decentralized. Buy under $1.50.
AdEx: Decentralized online advertising network. Buy under $0.80.
I am building a new section of the premium member area on the website dedicated to
cryptocurrencies. In the meantime, you can track my watch list, favorite ICOs and more at this link.
9
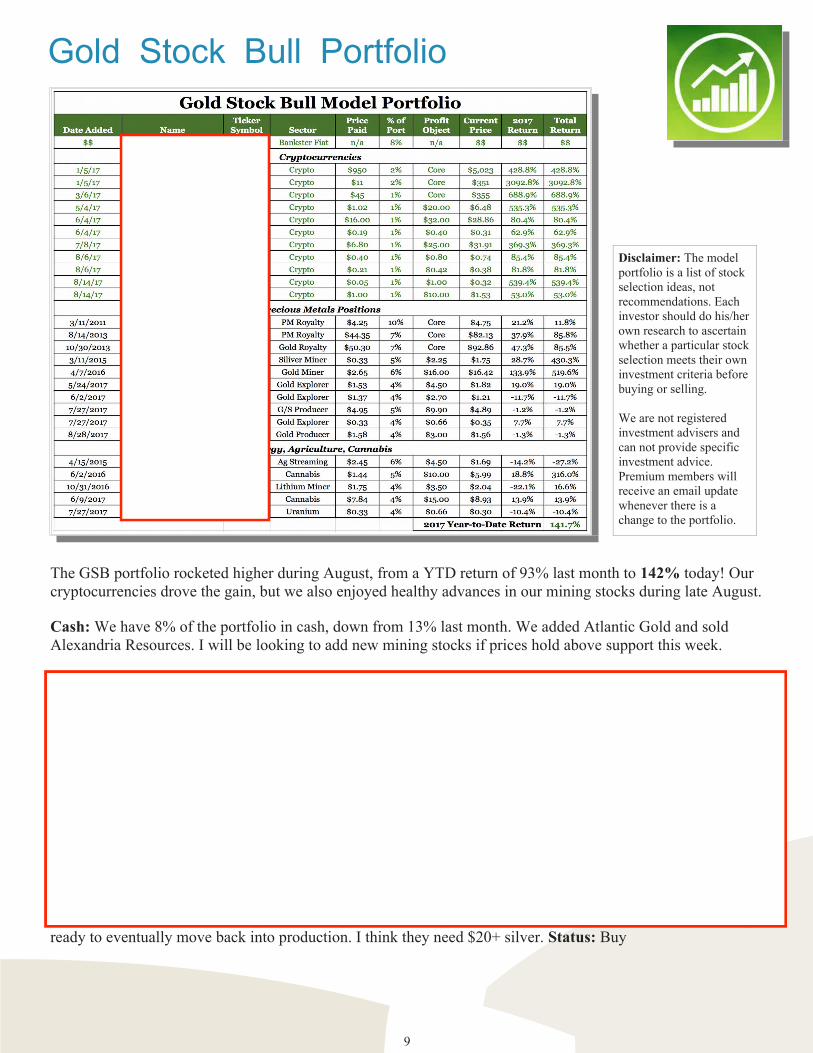
The GSB portfolio rocketed higher during August, from a YTD return of 93% last month to 142% today! Our cryptocurrencies drove the gain, but we also enjoyed healthy advances in our mining stocks during late August.
Cash: We have 8% of the portfolio in cash, down from 13% last month. We added Atlantic Gold and sold Alexandria Resources. I will be looking to add new mining stocks if prices hold above support this week.
Cryptos: We added 0x and Blockcat during August. I am targeting OmiseGo, TenX and Civic on dips.
SAND: Sandstorm Gold advanced by 17% in the past month. Q2 financials were strong and they received positive news at a number of partner mines. SAND announced they were selling shares of Mason Gold for C$2.8 million. Status: Buy
FNV: Franco Nevada was up 10% in the past month. Q2 results were solid, with GEO production trending towards the top end of guidance. Revenues and earnings both beat, with EPS of $0.25 and revenue of $163M, up 8.4% Y/Y. This was $4.25M more than expected. Status: Buy
RGLD: Royal Gold was up a modest 7% in the past month, but is up 47% YTD. Quarterly financials showed that EPS of $0.31 missed guidance and revenues of $109M (+16% Y/Y) were in-line. Status: Hold
AXU: Alexco Resources was up 28% in the past month. They continue to drill, expand their resources and getready to eventually move back into production. I think they need $20+ silver. Status: Buy
Disclaimer: The model portfolio is a list of stock selection ideas, not recommendations. Each investor should do his/herown research to ascertain whether a particular stockselection meets their own investment criteria before buying or selling.
We are not registered investment advisers and can not provide specific investment advice. Premium members will receive an email update whenever there is a change to the portfolio.
Gold Stock Bull Portfolio
10
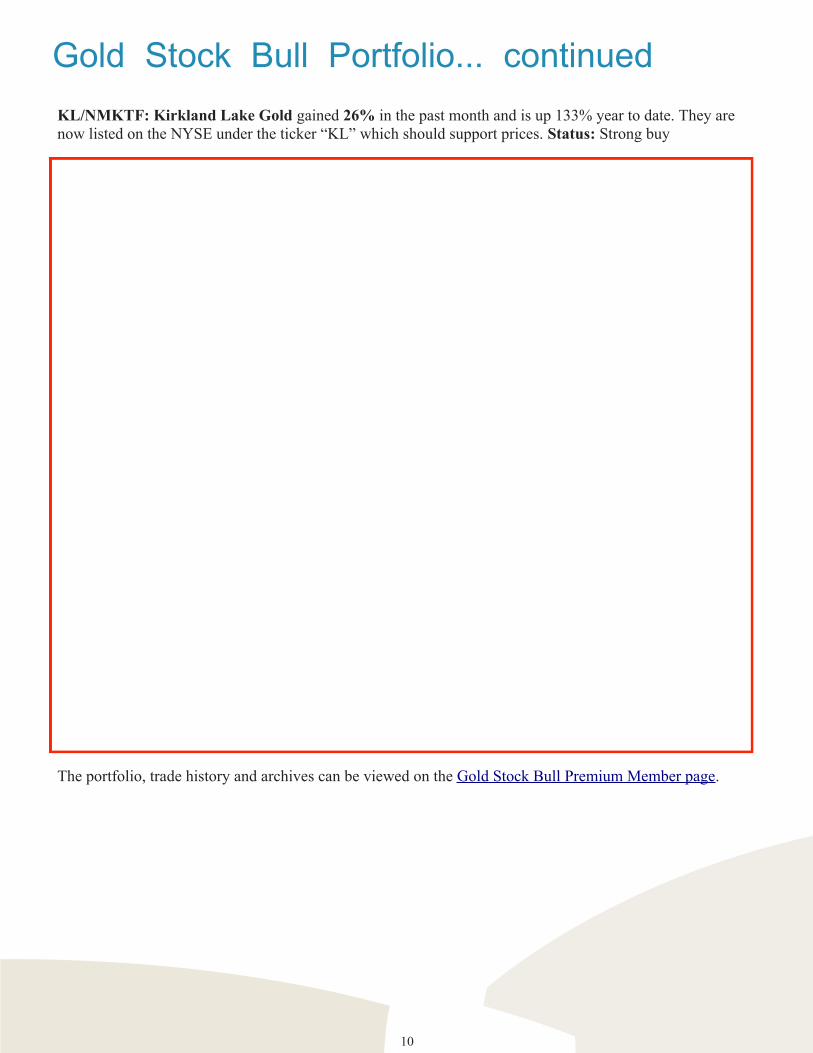
KL/NMKTF: Kirkland Lake Gold gained 26% in the past month and is up 133% year to date. They are now listed on the NYSE under the ticker “KL” which should support prices. Status: Strong buy
FSM: Fortuna Silver Mining underperformed with a gain of just 4% in the past month. This is despite a fairly strong quarter in which revenues were up 44% beating expectations and they swung from a $1.4M loss to a $9M profit. Status: Buy
AAU: Almaden Minerals added 4% in the past month despite exceptional drill results on 8/23 and the discovery of a new zone outside of the PFS pit. Status: Hold
GSV: Gold Standard Ventures was up 10% in the past month. A maiden resource on North Bullion by the end of Q3 may be a catalysts to propel the share price higher. Status: Buy
ER/EANRF: Eastmain Resources advanced 6% in the past month. In-fill drilling at Eau Claire continues to impress and they are moving closer to an updated mineral resource and PEA. Status: Buy
INP/INPCF: Input Capital was down 8% in the past month. Quarterly results were on the weak side. I will give them until harvest season to improve operations and gain momentum. If they don't, I will go aheadand cut my losses. Status: Hold / Sell
APH/APHQF: Aphria fell 5% in the past month. They struck a deal with Nuuvera Corp., meant to increase Aphria's distribution abilities outside the country, while creating revenue through operational deals. I think future revenue expansion will be huge and remain bullish. Status: Buy under CAD $6.00.
WEED/TWMJF: Canopy Growth dropped 1% in the past month. Q1 revenues of $16 million were up 127% Y/Y and they sold 86% more product. Costs were down and production was up 196%. They launched a new online store, which temporarily reduced sales during downtime. Their net loss increased slightly to $4.4M during the latest quarter. Status: Buy
GXY/GALXF: Galaxy Resources added 11% in the past month. They reported a positive cash flow of $7.6 million on revenues of $14.1 million for the half-year period ending June 30, 2017. Status: Buy
LAM/LMRXF: Laramide Resources dropped 7% in the past month as the uranium price rally ran out of steam. I am hoping for a resource estimate on Churchrock and Mancos very soon, followed by a PEA. This should lift the share price, especially if accompanied by higher U3O8 prices. Status: Buy The portfolio, trade history and archives can be viewed on the Gold Stock Bull Premium Member page.
Gold Stock Bull Portfolio... continued
11
Gold Stock Bull Watch List
Gold Stock Bull is not an investment advisory service, nor a registered investment advisor or broker-dealer and does not purport to tell or suggest which securities customers should buy or sell for themselves. Jason Hamlin is not an investment advisor. All ideas, opinions, and/or forecasts, expressed or implied herein, are for informational purposes only and should not be construed as a recommendation to invest, trade, and/or speculate in the markets. Any investments, trades, and/or speculations made in light of the ideas, opinions, and/or forecasts, expressed or implied herein, are committed at your own risk. Investors should not act on any information on this site without obtaining specific advice from their financial advisor. Past performance is no guarantee of future results. Click here to view our full Terms of Service and Privacy Policy.
Copyright © 2017 Gold Stock Bull - All Rights Reserved
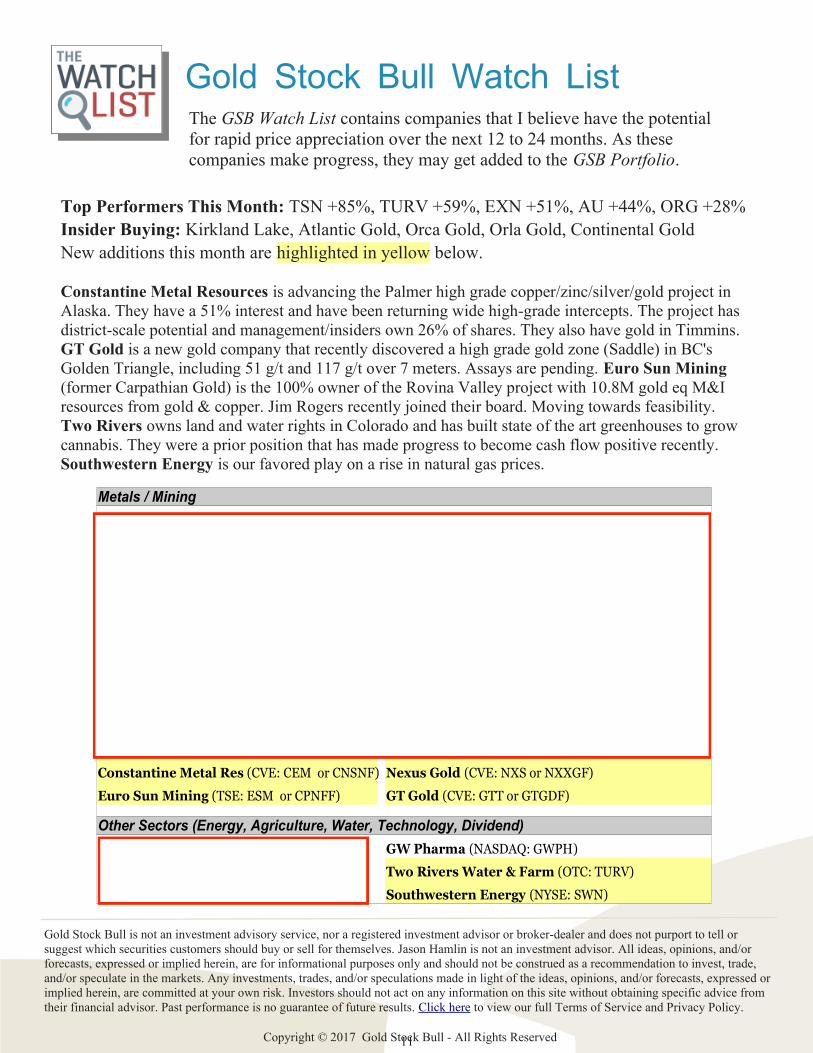
Top Performers This Month: TSN +85%, TURV +59%, EXN +51%, AU +44%, ORG +28%
Insider Buying: Kirkland Lake, Atlantic Gold, Orca Gold, Orla Gold, Continental Gold
New additions this month are highlighted in yellow below.
Constantine Metal Resources is advancing the Palmer high grade copper/zinc/silver/gold project in Alaska. They have a 51% interest and have been returning wide high-grade intercepts. The project has district-scale potential and management/insiders own 26% of shares. They also have gold in Timmins.GT Gold is a new gold company that recently discovered a high grade gold zone (Saddle) in BC's Golden Triangle, including 51 g/t and 117 g/t over 7 meters. Assays are pending. Euro Sun Mining (former Carpathian Gold) is the 100% owner of the Rovina Valley project with 10.8M gold eq M&I resources from gold & copper. Jim Rogers recently joined their board. Moving towards feasibility. Two Rivers owns land and water rights in Colorado and has built state of the art greenhouses to grow cannabis. They were a prior position that has made progress to become cash flow positive recently. Southwestern Energy is our favored play on a rise in natural gas prices.
The GSB Watch List contains companies that I believe have the potential for rapid price appreciation over the next 12 to 24 months. As these companies make progress, they may get added to the GSB Portfolio.
Metals / Mining
Other Sectors (Energy, Agriculture, Water, Technology, Dividend)
Torex Gold (TSE: TXG) Endeavour Mining (TSE: EDV or EDVMF)
Belo Sun Mining (TSE: BSX) RoxGold (CVE: ROG or ROGFF)
Richmont Mines (NYSEMKT: RIC) Strategic Metals (CVE: SMD / SMDZF )
Sabina Gold and Silver (TSE: SBB) Erdene Resource Development (TSE: ERD / ERDCF)
Guyana Goldfields (TSE: GUY or GUYFF) White Gold (CVE: WGO or GFRGF)
Orca Gold (CVE: ORG or CANWF) Rupert Resources (CVE: RUP / RUPRF)
Excellon Resources (CVE: EXN or EXLLF) Pretium Resources (NYSE: PVG)
Independence Gold (CVE: IGO or IEGCF) Auryn Resources (TSE: AUG or GGCTF)
Aurion Resources (CVE:AU or AIRRF) Barsele Minerals (CVE: BME or BRSLF)
Telson Resources (CVE: TSN or SOHFF) Southern Silver (CVE: SSV or SSVFF)
Trilogy Metals (NYSEMKT: TMQ) Avino Silver & Gold (NYSE: ASM)
Constantine Metal Res (CVE: CEM or CNSNF) Nexus Gold (CVE: NXS or NXXGF))
Euro Sun Mining (TSE: ESM or CPNFF) GT Gold (CVE: GTT or GTGDF))
Farmland Partners (NYSE: FPI) GW Pharma (NASDAQ: GWPH)
Greenland Minerals (ASX: GGG or GDLNF) Two Rivers Water & Farm (OTC: TURV)
Sierra Wireless (NASDAQ: SWIR) Southwestern Energy (NYSE: SWN)