stockholm bypass tunnel merging traffic study - diva...
TRANSCRIPT
Stockholm Bypass Tunnel
Merging Traffic Study
Technical Report
www.vipsimulation.se
ViP publication 2014-3
AuthorsChristopher Patten, VTI
Selina Mårdh, VTIRuggero Ceci, STA

ViP publication 2014-3
Preface
The reported study has been done in collaboration between the Swedish Transport
Administration (STA) and the Swedish National Road and Transport Research Institute
(VTI) in the project Development of the Stockholm bypass Tunnel Model – Extension of
surface road network and tunnel ramps for tests of safety features and future traffic
scenarios within the competence centre Virtual Prototyping and Assessment by
Simulation (ViP; www.vipsimulation.se).
The project was financed by ViP, i.e. by Vinnova (the Swedish Governmental Agency
for Innovation Systems) and the ViP partners.
The main focus of the study was to investigate the pattern of merging of traffic onto the
main Stockholm bypass (Förbifart Stockholm, or FS) tunnel when the gap sizes between
vehicles in the main tunnel were relatively small. It is important that the reader is aware
that these small gap sizes are not intended to represent mean values that allude to total
traffic intensity. Moreover, our ambition has been to create a virtual tunnel as accurately
as possible. The tunnel has, however, not yet been built and some details are subject to
changes, e.g. lighting details and the materials on the side walls.
The authors would like to thank the Swedish Transport Administration (STA;
Trafikverket in Swedish) who have among other things supplied the tunnel blueprints
that were necessary to create a virtual FS tunnel and the STA specialists Mr Henric
Modig and Mr Hans Ek who participated in the planning of this study. The authors
would also like to thank the Research Engineers Mats Lidström and Jonas Andersson
Hultgren at the Swedish National Road and Transport Research Institute (VTI) for their
simulator expertise and the Administrator Kristina Kindgren and the Research Assistant
Gunilla Sörensen at VTI for their assistance. We would also like to thank the test
participants for their participation.
The authors of this study were Dr Christopher Patten who specialises in engineering
psychology, human machine interface (HMI) and human factors; Dr Selina Mårdh who
specialises in HMI, driver behaviour and effects of surrounding landscape on behaviour;
and Dr Ruggero Ceci (project manager) who specialises in HMI, psychometric scales
and driver behaviour.
Borlänge, March 2014
Christopher Patten
ViP publication 2014-3
Quality review
A review seminar was carried out on 18th of December 2013 where Professor Claes
Tingvall, Swedish Transport Administration and Professor Emeritus Ola Svenson,
University of Stockholm reviewed and commented on the report. Dr Christopher Patten
has made alterations to the final manuscript of the report. The ViP Director Dr Lena
Nilsson examined and approved the report for publication on 25 June 2014.
ViP publication 2014-3
Table of contents
Executive summary ............................................................................................ 9
1 Introduction ............................................................................................ 11
2 Method ................................................................................................... 13
2.1 Participants ............................................................................................ 13
2.2 Apparatus .............................................................................................. 13
2.3 Test scenario ......................................................................................... 14
2.4 Experimental design .............................................................................. 16
2.5 Dependent variables - measures ........................................................... 16
2.6 Procedure .............................................................................................. 19
2.7 Data analyses ........................................................................................ 20
3 Results ................................................................................................... 21
3.1 Distance-to-wall ..................................................................................... 21
3.2 Position-between-vehicles at merging ................................................... 22
3.3 Time headway at merging ...................................................................... 23
3.4 Speed .................................................................................................... 26
3.5 Mental demand ...................................................................................... 27
3.6 Time pressure (temporal demand) ......................................................... 28
3.7 Frustration .............................................................................................. 29
3.8 Perceived risk ........................................................................................ 30
3.9 Questionnaires ....................................................................................... 31
3.10 Incidents ................................................................................................ 33
4 Discussion ............................................................................................. 34
5 Conclusions ........................................................................................... 37
5.1 Future research ..................................................................................... 37
5.2 Benefits for ViP ...................................................................................... 37
References ....................................................................................................... 38
Appendix: Post-experimental questionnaire results
ViP publication 2014-3
Abbreviations
AADT Annual Average Daily Traffic (ÅDT in Swedish)
ANOVA Analysis of Variance
CR10 Category Ratio 10 scale (used for subjective ratings)
FS Förbifart Stockholm (Stockholm bypass)
ITS Intelligent Transportation System
LCD Liquid Crystal Display
MCS Motorway Control Systems
SD Standard Deviation (of mean)
SEK Swedish Kronor
SPSS Statistical Package for the Social Sciences
STA Swedish Transport Administration
THW Time Headway
T-LOC Traffic Locus of Control
VGU Swedish design guide for road infrastructure (Vägar och Gators
Utformning).
VINNOVA the Swedish Governmental Agency for Innovation Systems
ViP Virtual Prototyping and Assessment by Simulation
ViP publication 2014-3
Definitions and concepts
Entry-ramp An entry-ramp is the ramp plus the merging zone.
Entry-ramp tunnel The entry-ramp tunnel is the section of the entry-ramp
that is in a tunnel.
Exit-ramp The exit-ramp is the merging zone plus the ramp leaving
the motorway.
Exit-ramp tunnel The exit-ramp tunnel is the section of the exit-ramp that
is in a tunnel.
Merge-completion Merge-completion is when the merging manoeuvre has
been completed. Merging is completed when the outer
edge of the vehicle’s front, right-hand tyre passes the
lane marking between the entry-ramp and the motorway.
Merging zone The merging zone comprises the observation, the
adjustment and the completion section of the entry-ramp
just before it joins the motorway.
Point of merge-completion The point of merge-completion is the position of the
vehicle in the merging zone/motorway when merging has
been completed.
Ramp The ramp is a section of road that starts from an auxiliary
road and leads on to the motorway. In this study the ramp
is also partially in an auxiliary tunnel.
ViP publication 2014-3
List of figures
Figure 1: Simulator III at VTI in Linköping, Sweden. ................................................... 13
Figure 2: Standard definition of a Swedish motorway ramp with its 3 merging zone
sections, from VGU (Trafikverket, 2012). Note: Traffic is going from right to left. ..... 15
Figure 3: The measurement window for driving performance dependent variables. ..... 17
Figure 4: The CR10 scale (Borg, 1982; Borg & Borg, 2008). ....................................... 18
Figure 5: Distance-to-wall variable (m) at the time of merge-completion, divided by
entry-ramp tunnel length and gap size. Boxplot diagram with median values and quartile
distributions. Broken lines indicate 22.2 m and 44.4 m, i.e. 1 and 2 seconds of travel
with 80 km/h, respectively. ............................................................................................ 21
Figure 6: The mean position-between-vehicles (decimal notation) at merging, divided
by entry-ramp tunnel length and gap size. ...................................................................... 23
Figure 7: The time headway to the rearward vehicle (THW-behind) (s) at merging,
divided by entry-ramp tunnel length and gap size. Boxplot diagram with median values
and quartile distributions ................................................................................................ 24
Figure 8: The time headway to the vehicle in front (THW-forward) (s) at merging,
divided by entry-ramp tunnel length and gap size. Boxplot diagram with median values
and quartile distributions. ............................................................................................... 25
Figure 9: Speed (m/s) in three different ramp sections by mileage group and section-on-
ramp. Means ± standard error bars. ................................................................................ 27
Figure 10: Mean mental demand CR10 ratings by entry-ramp tunnel length and gap
size. ................................................................................................................................. 28
Figure 11: Mean time pressure (temporal demand) CR10 ratings by entry-ramp tunnel
length and gap size. ........................................................................................................ 29
Figure 12: Mean frustration CR10 ratings by entry-ramp tunnel length and gap size. .. 30
Figure 13: Mean perceived level of risk CR10 ratings by entry-ramp tunnel length and
gap size. .......................................................................................................................... 31
ViP publication 2014-3
List of tables
Table 1: Distribution of the 21 participants by gender and annual mileage. .................. 13
Table 2: Mean speed (m/s) at merging for the four tunnel conditions, combinations of
ramp length and gap size. ............................................................................................... 26
Table 3: The participants’ experiences of driving in tunnels, before the simulator
experiment. ..................................................................................................................... 32
Table 4: The participants’ feelings/emotions regarding driving in tunnels, before the
simulator experiment. ..................................................................................................... 32
Table 5: The participants’ responses to questions about the merging zone (excerpt of
responses to the post-experimental questionnaire). 7-point Likert scale from 1 “strongly
disagree” to 7 “strongly agree”. ...................................................................................... 33

ViP publication 2014-3
ViP publication 2014-3 9
Stockholm Bypass Tunnel – Merging Traffic Study
Technical Report
by Christopher Patten1, Selina Mårdh1 and Ruggero Ceci2
1 the Swedish National Road and Transport Research Institute (VTI) 2 the Swedish Transport Administration (STA)
Executive summary
The Stockholm bypass (Förbifart Stockholm, or FS, in Swedish) project is a new road
project that will create a bypass of central Stockholm. The entire project includes
motorways, bridges and two tunnels; one of which will be 16.5 km. The Stockholm
bypass is the largest infrastructure project in Sweden to date. A high level of road traffic
safety is always important and when the road is in a tunnel, and especially in a long
tunnel, maintaining the highest possible level of safety is paramount. The present report
describes a simulator study on the merging of traffic from entry-ramps into the main
tunnel. The entry-ramps in the Stockholm bypass tunnel are planned to let traffic merge
into the main tunnel from five specified locations (excluding the main southbound and
northbound entrances).
The present study focused upon the specific situation of driving down the entry-ramps
and entering (merging) into the main tunnel with a special emphasis on measures of
safety and driver performance. A group of 21 test drivers, 11 males and 10 females,
participated in the study. They were instructed to drive a series of test scenarios in a 3D-
model of the Stockholm bypass tunnel in the VTI driving simulator III. There was
simulated traffic in the main tunnel to improve the realism for the drivers merging from
the entry-ramp tunnel into the main tunnel. The gap sizes between vehicles in the main
tunnel were relatively small, two gap sizes were used (1.5 s and 2.5 s). The gap sizes are
not intended to represent mean values that allude to total traffic intensity. They are,
however, gap sizes that road users will observe on a daily basis when using the E4
motorway through Stockholm. This fact is the rationale for using relatively small gap
sizes because they reflect real-life traffic situations. The study design was a within-
subject design where all test drivers drove all the four included tunnel conditions.
Driving performance (speed, time headway, vehicle position, and distance to tunnel
wall) and the test drivers’ experiences of the driving task (CR10 ratings of four
dimensions) were measured.
The main results of the study suggest that the merging zones were too short for some of
the drivers to merge comfortably and safely. The merging zones are found at the point
where the entry-ramp tunnels merge with the main motorway tunnel and comprise an
observation section, an adjustment section and a completion (/taper) section. The
distance-to-wall measure (a measure that gauges how much of the entry-ramp remains
at the time of merge-completion) for the Vinsta ramp (0.5 km) with heavy traffic is
particularly concerning from a road traffic safety perspective because more than 25 %
of the drivers completed the merging manoeuvre with less than two seconds of time
headway remaining before the end of the completion section.
In order to establish the causes and to seek and verify possible solutions to the safety
concerns arising from this study, a number of areas need to be explored. Would for
10 ViP publication 2014-3
instance, lengthening the merging zone at Vinsta improve the safety of that entry-ramp?
What are the characteristics of an entry-ramp into a motorway tunnel that gives
provision for safe and well-working merging? On the other hand, what causes unsafe
merging performance? Could it be other aspects apart from the actual length of the
merging zones? Moreover, only two of the five entry-ramps have been assessed in this
study. What is the status of the remaining entry-ramps from a safety perspective? It is
also important to investigate the effects of heavy traffic (buses and trucks) on
interaction with other road users and merging.
ViP publication 2014-3 11
1 Introduction
The Stockholm bypass (Förbifart Stockholm, or FS, in Swedish) is a road project that
will create a new bypass of central Stockholm, Sweden. The entire bypass project
includes motorways, bridges and two tunnels; one of which will be 16.5 km. The FS is
the largest road infrastructure project in Sweden to date. The planning of the project
includes the choice of the exact route, the road geometry and also the interior design of
the 16.5 km tunnel, including the aesthetics of all aspects of the tunnel. The FS project
is expected to replace the Essingeleden section of the E4 motorway through Stockholm.
Essingeleden has an annual average daily traffic (AADT) of approximately 160 000
vehicles (in 4 lanes) which is also the expected traffic volume for the Stockholm bypass
tunnel. Maintaining high levels of road traffic safety is always important and when the
road is in a tunnel, and especially in a long tunnel, maintaining the highest possible
level of safety is paramount (Patten & Mårdh, 2012).
Some of the research questions related to other studies planned in the FS project have
addressed the interaction between vehicle and infrastructure technology (e.g. ITS
systems) and human behaviour from a human machine interaction (HMI) perspective as
well as safety critical aspects of road and tunnel traffic situations. Some typical issues
that need attention are the signal and sign systems of the new infrastructure systems that
should be designed for optimal use. Traffic messages and road signs for orientation and
way-finding purposes should be tested and evaluated for best HMI practice on roads and
in in-vehicle systems. Speed adaptation and regulations in tunnel and surface traffic,
merging zones in tunnel entry-ramps as well as merging behaviour in general in
different parts of the infrastructure system (both in tunnel and in freeway intersections)
should also be considered.
The present report describes a simulator study on the merging of traffic from entry-
ramps into the main tunnel. The entry-ramps in the Stockholm bypass tunnel are
planned to let traffic in to the tunnel from five specified locations. The present study
focuses on two of the locations with connections at Lovö and Vinsta. These two entry-
ramp tunnels are fairly long (0.5 and 1.5 km), curvy and with a relatively steep descent
(max 5 %). It can be argued that this may lead to difficulties in judging and maintain
speed and distances between vehicles. In order to merge safely, drivers entering the
motorway in the main tunnel are required to judge speed and gap size between vehicles
and with timing place their vehicle in a gap without undue hindrance to other road
users. This may be especially problematic for larger trucks with heavy load and for
those drivers wishing to eco-drive (e.g. in-gear coasting for better fuel-economy). Also,
the specific situations arising when vehicles attempt to enter the main tunnel are
considered to induce a risk for incidents and collisions in the tunnel. Earlier studies have
suggested that drivers’ ability to gauge speed can be affected by visual design concepts
(Manser & Hancock, 2007). Other forms of driver behaviour, such as eye-glance
behaviour, and mental workload, have also been suggested as being affected by the
lighting colours and patterns of the tunnel walls as well as the strength of the lighting
(Kircher & Ahlström, 2012; Kircher & Lundkvist, 2011; Patten, Ceci, Engström, &
Anund, in press). Driving experience has been suggested as having an effect on driving
performance where e.g. the workload from driving per se is more demanding or greater
for a less experienced driver than for an experienced driver (cf. Patten, Kircher,
Östlund, Nilsson, & Svenson, 2006). Driving in tunnels is unlikely to improve
performance and may even exacerbate the mentioned effects when the driving task
becomes more demanding (Rudin-Brown, Young, Patten, Lenné, & Ceci, 2013).
12 ViP publication 2014-3
A recent simulator study with a dissimilar design investigated traffic scenarios in a
model of the Stockholm bypass tunnel (Young, Ceci, Patten, & Lenné, submitted). The
test drivers in this study did not merge themselves but drove on the motorway in the
main tunnel. The drivers did experience other traffic entering the motorway from the
entry-ramps and compared tunnel and motorway driving. The results suggested that
when sight lines were not restricted on the motorway, drivers reduced speed during a
first merge event only. For the tunnel and motorway conditions, with restricted sight
lines, there were no significant differences in mean speed across merge segments
(Young et al., submitted) suggesting that unrestricted sight lines facilitated a reduction
in mean speeds on the main route when encountering merging traffic from entry-ramps.
Locus of control refers to the extent to which individuals believe that they can control
events that affect them such as in the case of driving and the resultant driver behaviour
and accidents. Locus of control often divide humans into two main groups, internals
and externals. Internals tend to believe that events in their life/driving stem primarily
from their own actions whereas externals are more likely to rely on the actions of other
people/drivers (Özkan & Lajunen, 2005). Speed and speeding behaviour can be used to
study the effects of a traffic locus of control (T-LOC) (Wallén Warner, Özkan, &
Lajunen, 2010). T-LOC would usually require large data sets as used by Wallén Warner
et al. (2010), but the study reported here has a limited sample size (21 test drivers) and
is not conducive for correct T-LOC analysis. In our study driver experience will be
tested as an alternative means of deriving different driving styles or strategies when
merging, but not as an alternative to T-LOC. Driver experience has been shown to have
an effect on cognitive workload where inexperienced drivers carry a heavier cognitive
workload for primary tasks (driving) than experienced drivers (Patten et al., 2006).
The present study focused upon the specific situation of driving down the entry-ramps
and entering (merging) into the main tunnel. Three research questions were formulated
and are listed in the following:
Research question 1: Is there a difference in the subjective and/or objective measures
between the two different entry-ramp tunnels (Lovö, 1.5 km and Vinsta, 0.5 km)?
Research question 2: Is driver performance when merging affected by the drivers’
experience when entering the main tunnel from the entry-ramp?
Research question 3: Does traffic intensity and its subsequent effect on the gap size
between vehicles influence the frequency and character of hazardous situations such as
late merging?
ViP publication 2014-3 13
2 Method
2.1 Participants
Twenty-two participants were recruited from the VTI participant database. They were
required to have had previous experience of simulator driving, an annual mileage of ≥
5 000 km and having held a car driving licence for ≥ 5 years. Twenty-one participants,
11 males and 10 females, completed the study. Their mean age was 39 years (SD 4.01)
with a range between 32 and 46 years. One female participant missed the scheduled
appointment at the simulator due to illness. The participants received 300 SEK in
compensation.
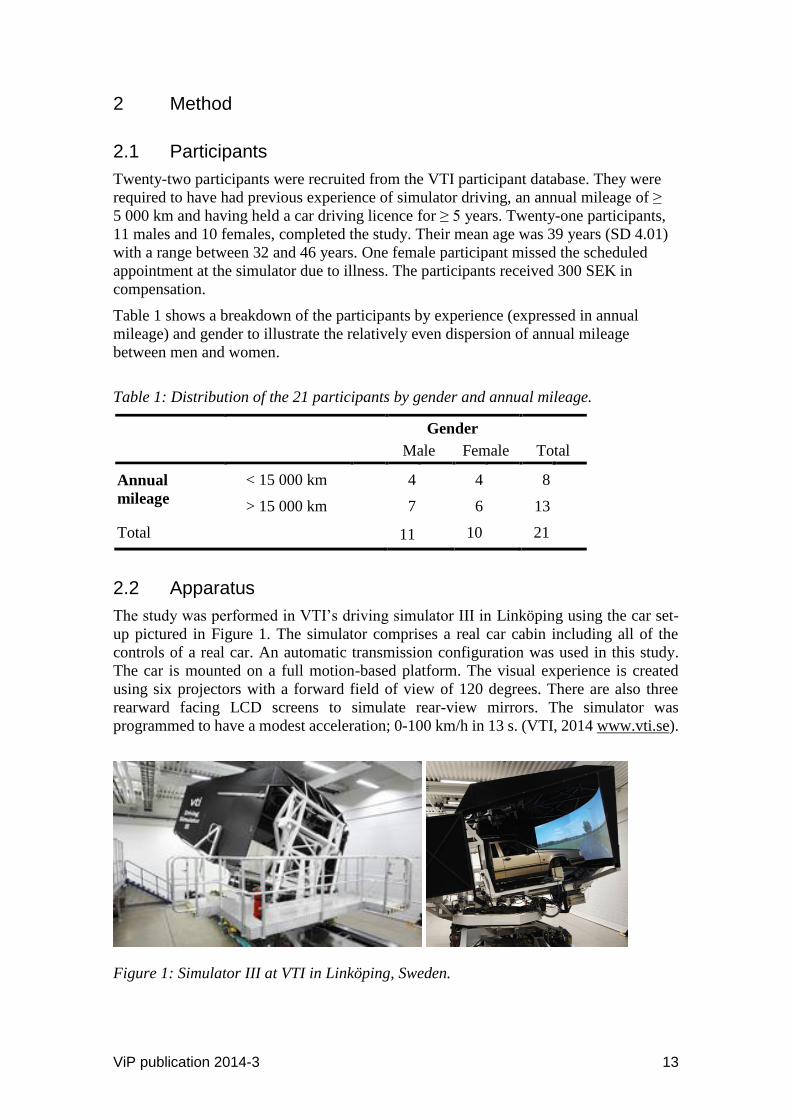
Table 1 shows a breakdown of the participants by experience (expressed in annual
mileage) and gender to illustrate the relatively even dispersion of annual mileage
between men and women.
Table 1: Distribution of the 21 participants by gender and annual mileage.
Gender
Total Male Female
Annual
mileage
< 15 000 km 4 4 8
> 15 000 km 7 6 13
Total 11 10 21
2.2 Apparatus
The study was performed in VTI’s driving simulator III in Linköping using the car set-
up pictured in Figure 1. The simulator comprises a real car cabin including all of the
controls of a real car. An automatic transmission configuration was used in this study.
The car is mounted on a full motion-based platform. The visual experience is created
using six projectors with a forward field of view of 120 degrees. There are also three
rearward facing LCD screens to simulate rear-view mirrors. The simulator was
programmed to have a modest acceleration; 0-100 km/h in 13 s. (VTI, 2014 www.vti.se).
Figure 1: Simulator III at VTI in Linköping, Sweden.
14 ViP publication 2014-3
2.3 Test scenario
A motorway tunnel replicated based on the blueprints of the Stockholm bypass tunnel
was created in the advanced driving simulator III at VTI. The blueprints were provided
by the Swedish Transport Administration (Trafikverket, 2011) and were, at the time, the
most current blueprints available. The simulated tunnel included all of the original road
topography, including curvature, gradient, length and breadth. It also included the
planned surface texture of the walls, road signage, emergency exits and other road
furniture such as extraction fans and standard lighting fixtures. The simulated main
tunnel comprised a three-lane motorway. The exact details of the tunnel may change
during the lifetime of the scheduled tunnel construction over the next ten or so years’
time.
There were two entry-ramp tunnels, the ‘long’ tunnel ramp (Lovö) was 1.5 km and the
‘short’ tunnel ramp (Vinsta) was 0.5 km. At the end of the entry-ramp tunnels there
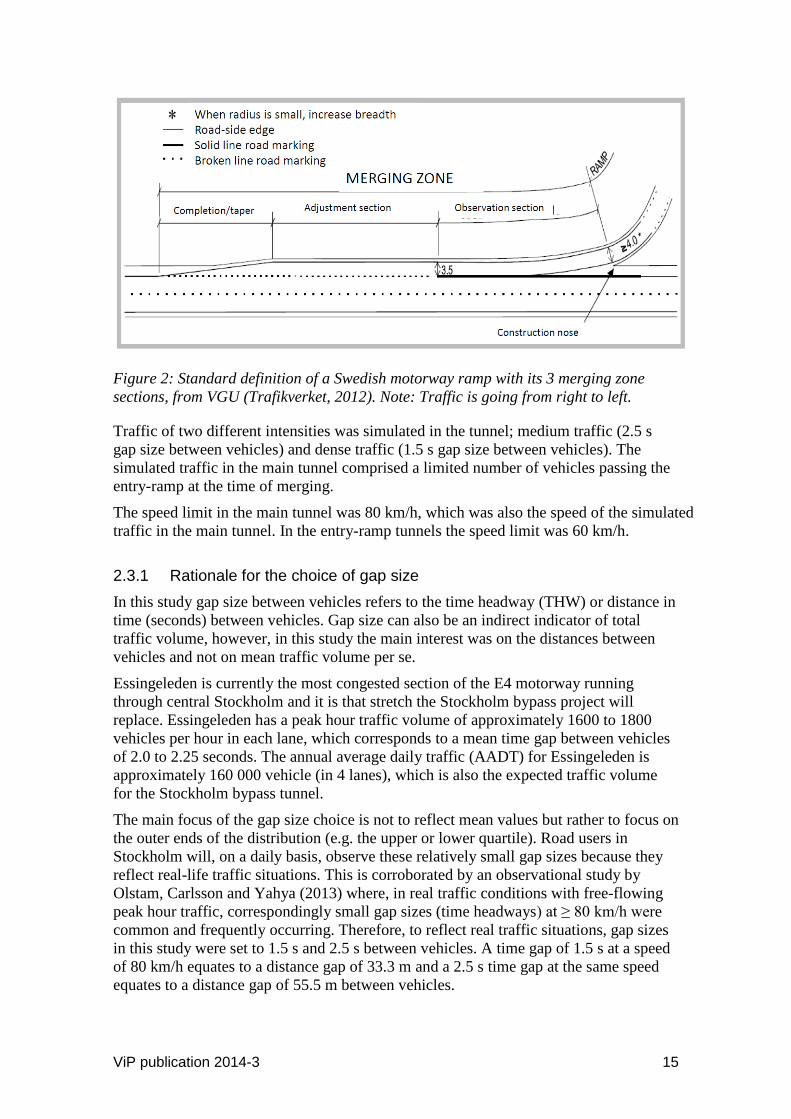
were merging zones according to the illustration in Figure 2. The merging zones start
with an observation section, then an adjustment section and finish with a completion
section where the entry-ramp is joined to the right-hand motorway lane in the main
tunnel. The merging zones had different dimensions, the details of which are described
below. There was traffic in all three motorway lanes (less in the left-hand lane). The
simulated traffic was programmed to brake if necessary to accommodate merging, but
only when the own (simulator-) vehicle had completely entered the lane.
The simulation of the Stockholm bypass north bound tunnel included:
Entry-ramps at Lovö and Vinsta
Exit-ramps, Vinsta exit-ramp at both Vinsta and Lovö
Merging zones of an entry-ramp comprising three sections in accordance with
the Swedish VGU guidelines (Trafikverket, 2012):
- Observation section (observationssträcka in Swedish)
- Adjustment section (anpassningssträcka in Swedish)
- Completion (taper) section (avslutningssträcka in Swedish)
The entry-ramp at Lovö had a long entry-ramp tunnel (1.5 km) and a merging zone of
the following design (Trafikverket, 2011):
Observation section = 100 m
Adjustment section = 125 m
Completion (taper) section = 100 m
Summa = 325 m
The entry-ramp at Vinsta had a short entry-ramp tunnel (0.5 km) and a merging zone of
the following design (Trafikverket, 2011):
Observation section = 150 m
Adjustment section = 80 m
Completion (taper) section = 100 m
Summa = 330 m
ViP publication 2014-3 15
Figure 2: Standard definition of a Swedish motorway ramp with its 3 merging zone
sections, from VGU (Trafikverket, 2012). Note: Traffic is going from right to left.
Traffic of two different intensities was simulated in the tunnel; medium traffic (2.5 s
gap size between vehicles) and dense traffic (1.5 s gap size between vehicles). The
simulated traffic in the main tunnel comprised a limited number of vehicles passing the
entry-ramp at the time of merging.
The speed limit in the main tunnel was 80 km/h, which was also the speed of the simulated
traffic in the main tunnel. In the entry-ramp tunnels the speed limit was 60 km/h.
2.3.1 Rationale for the choice of gap size
In this study gap size between vehicles refers to the time headway (THW) or distance in
time (seconds) between vehicles. Gap size can also be an indirect indicator of total
traffic volume, however, in this study the main interest was on the distances between
vehicles and not on mean traffic volume per se.
Essingeleden is currently the most congested section of the E4 motorway running
through central Stockholm and it is that stretch the Stockholm bypass project will
replace. Essingeleden has a peak hour traffic volume of approximately 1600 to 1800
vehicles per hour in each lane, which corresponds to a mean time gap between vehicles
of 2.0 to 2.25 seconds. The annual average daily traffic (AADT) for Essingeleden is
approximately 160 000 vehicle (in 4 lanes), which is also the expected traffic volume
for the Stockholm bypass tunnel.
The main focus of the gap size choice is not to reflect mean values but rather to focus on
the outer ends of the distribution (e.g. the upper or lower quartile). Road users in
Stockholm will, on a daily basis, observe these relatively small gap sizes because they
reflect real-life traffic situations. This is corroborated by an observational study by
Olstam, Carlsson and Yahya (2013) where, in real traffic conditions with free-flowing
peak hour traffic, correspondingly small gap sizes (time headways) at ≥ 80 km/h were
common and frequently occurring. Therefore, to reflect real traffic situations, gap sizes
in this study were set to 1.5 s and 2.5 s between vehicles. A time gap of 1.5 s at a speed
of 80 km/h equates to a distance gap of 33.3 m and a 2.5 s time gap at the same speed
equates to a distance gap of 55.5 m between vehicles.
16 ViP publication 2014-3
2.4 Experimental design
The study had a 2 (gap size) x 2 (entry-ramp) x 2 (driver experience) design with gap
size and entry-ramp as within-subject variables and with driver experience (annual
mileage) as between-group variable (two groups). Thus, all participants drove all four
experimental conditions, the four combinations of the two gap sizes and the two entry-
ramps. The order was balanced for entry-ramp (ramp length) and gap size. All
participants drove the route through the tunnel in the same direction, from south to
north.
2.4.1 Independent variables
Gap size: two levels, 1.5 s and 2.5 s
Entry-ramp: two levels, long (at Lovö) and short (at Vinsta)
Driver experience: two levels, annual mileage < 15 000 km and > 15 000 km
2.5 Dependent variables - measures
2.5.1 Driving performance measures
The following dependent variables were used (se Figure 3):
Distance-to-wall (m).
Position-between-vehicles at the point of merging (%).
Time headway (THW)
- between the simulator vehicle and the forward vehicle (s),THW-forward
- between the simulator vehicle and the rearward vehicle (s), THW-behind
Mean speed (m/s)
- prior to merging (at the construction nose)
- at the point of merging
- merge + 25 m
The distance-to-wall variable was calculated by measuring the distance from the front
of the simulator vehicle to the final point on the entry-ramp (the joining of the right-
hand ramp lane marking and the right-hand motorway lane marking), see Figure 3. The
measurement was taken at the point of merge-completion, i.e. when the front right
outside edge of the simulator vehicle had fully entered the first (right-hand) motorway
lane. The distance was measured in metres (m). It should be noted that the last forty
metres or so of the entry-ramps are tapered to the extent that there is no longer enough
room for a car’s breadth.
The position-between-vehicles variable at the exact point of merge completion was
calculated using the measurement window described in Figure 3. The unit used was a
decimal notation. A decimal notation can also be expressed as a percentage to improve
comprehension, i.e. 100 % (or 1.00) is a collision with the vehicle in front, 50 % (or
0.50) is exactly in the middle between the vehicles in front of and behind the simulator
vehicle and 0 % (or 0.00) is a collision with the vehicle behind. This dependent variable
conveys a similar result to the time headway measures described below but in terms of
relative position instead of time-distances.
ViP publication 2014-3 17
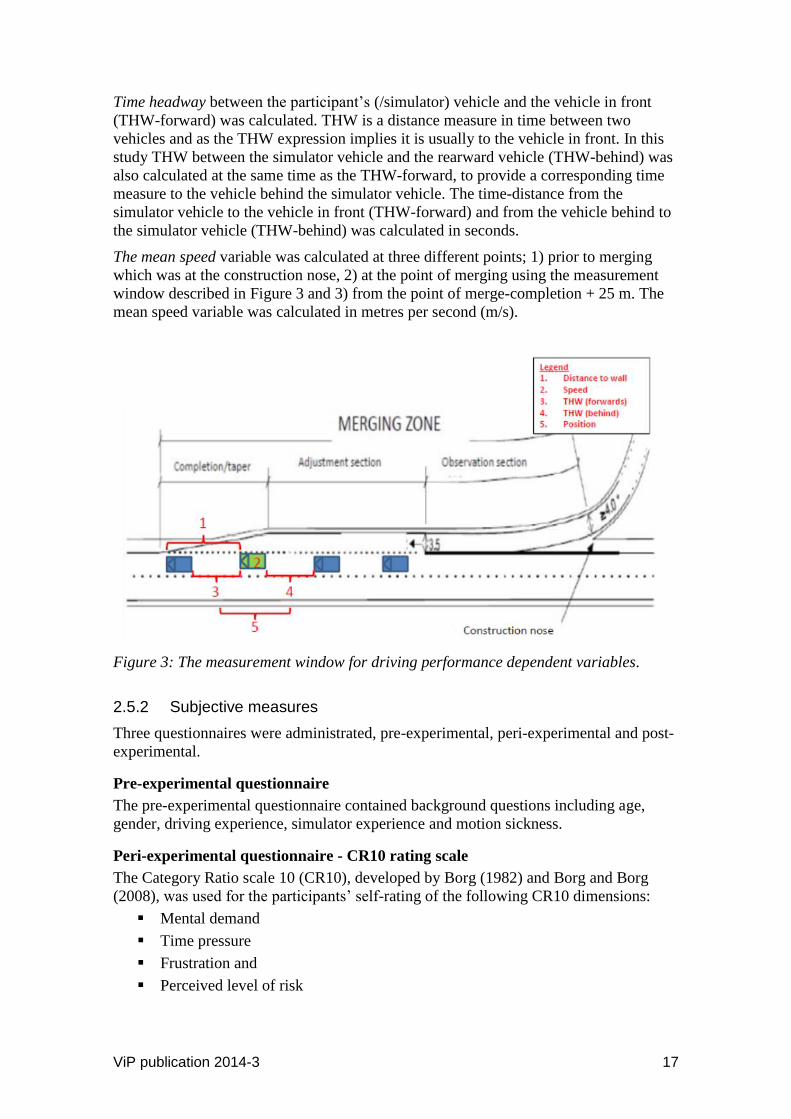
Time headway between the participant’s (/simulator) vehicle and the vehicle in front
(THW-forward) was calculated. THW is a distance measure in time between two
vehicles and as the THW expression implies it is usually to the vehicle in front. In this
study THW between the simulator vehicle and the rearward vehicle (THW-behind) was
also calculated at the same time as the THW-forward, to provide a corresponding time
measure to the vehicle behind the simulator vehicle. The time-distance from the
simulator vehicle to the vehicle in front (THW-forward) and from the vehicle behind to
the simulator vehicle (THW-behind) was calculated in seconds.
The mean speed variable was calculated at three different points; 1) prior to merging
which was at the construction nose, 2) at the point of merging using the measurement
window described in Figure 3 and 3) from the point of merge-completion + 25 m. The
mean speed variable was calculated in metres per second (m/s).
Figure 3: The measurement window for driving performance dependent variables.
2.5.2 Subjective measures
Three questionnaires were administrated, pre-experimental, peri-experimental and post-
experimental.
Pre-experimental questionnaire
The pre-experimental questionnaire contained background questions including age,
gender, driving experience, simulator experience and motion sickness.
Peri-experimental questionnaire - CR10 rating scale
The Category Ratio scale 10 (CR10), developed by Borg (1982) and Borg and Borg
(2008), was used for the participants’ self-rating of the following CR10 dimensions:
Mental demand
Time pressure
Frustration and
Perceived level of risk
18 ViP publication 2014-3
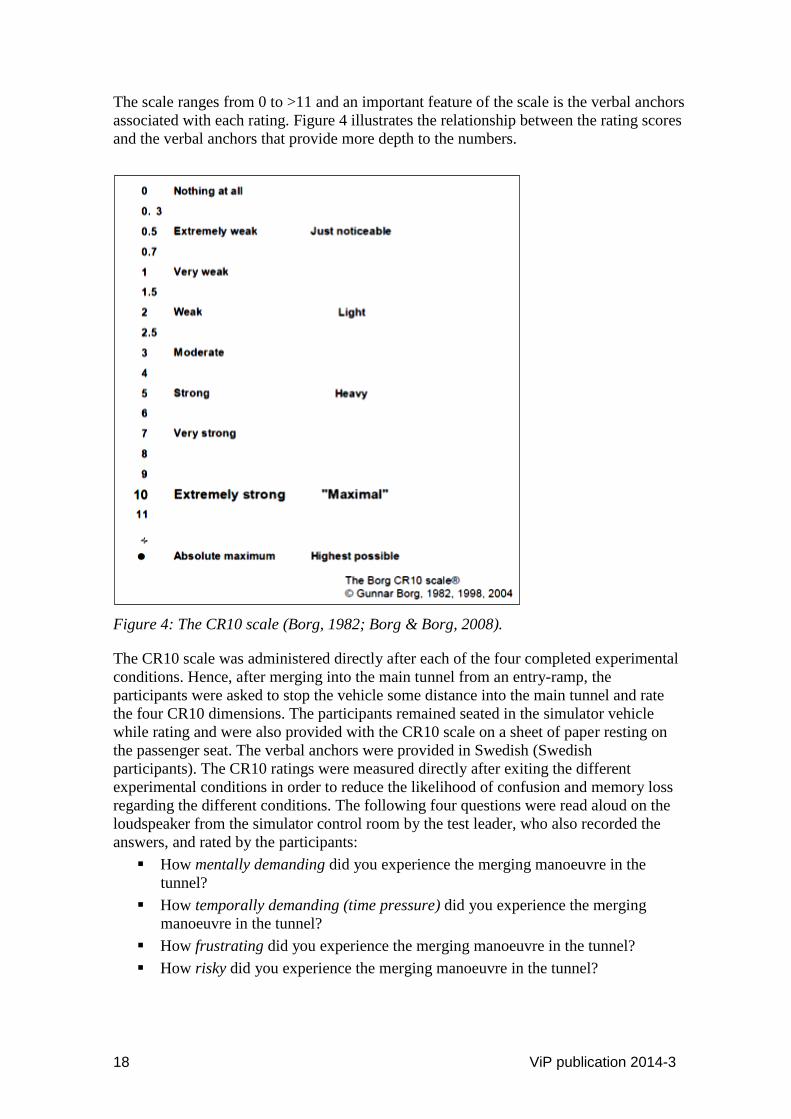
The scale ranges from 0 to >11 and an important feature of the scale is the verbal anchors
associated with each rating. Figure 4 illustrates the relationship between the rating scores
and the verbal anchors that provide more depth to the numbers.
Figure 4: The CR10 scale (Borg, 1982; Borg & Borg, 2008).
The CR10 scale was administered directly after each of the four completed experimental
conditions. Hence, after merging into the main tunnel from an entry-ramp, the
participants were asked to stop the vehicle some distance into the main tunnel and rate
the four CR10 dimensions. The participants remained seated in the simulator vehicle
while rating and were also provided with the CR10 scale on a sheet of paper resting on
the passenger seat. The verbal anchors were provided in Swedish (Swedish
participants). The CR10 ratings were measured directly after exiting the different
experimental conditions in order to reduce the likelihood of confusion and memory loss
regarding the different conditions. The following four questions were read aloud on the
loudspeaker from the simulator control room by the test leader, who also recorded the
answers, and rated by the participants:
How mentally demanding did you experience the merging manoeuvre in the
tunnel?
How temporally demanding (time pressure) did you experience the merging
manoeuvre in the tunnel?
How frustrating did you experience the merging manoeuvre in the tunnel?
How risky did you experience the merging manoeuvre in the tunnel?
ViP publication 2014-3 19
Post-experimental questionnaire
The post-experimental questionnaire comprised fifteen questions about the participants’
experiences of driving in the simulated tunnel. The questionnaire was completed in the
post-experimental phase, i.e. after the participant had exited the simulator. The
questions were answered using a seven-point Likert scale where 1 represented “strongly
disagree” and 7 represented “strongly agree”. The participants were asked to indicate
the number on the seven-point scale that, for each of the questionnaire statements, most
accurately reflected their experience.
The questions covered the following aspects of tunnel driving and the driving scenarios:
The entry-ramp tunnel
The merging zones
Merging (per se)
The signposting (statutory speed sign)
In the questionnaire, screen captures from the simulator were used to remind the
participants of the specific location in the tunnel that the different topics were related to.
A traffic locus of control (T-LOC) questionnaire was also administered despite not
formally qualifying due to the small sample size (Özkan & Lajunen, 2005).
2.6 Procedure
The study procedure started when the participants arrived at VTI in Linköping,
whereupon written instructions were given. The participants were informed that their
participation was completely voluntary and that they could withdraw at any time.
Informed consent forms were signed by each of the participants before commencing
with the experiment. The participants completed a background questionnaire and were
calibrated on the CR10 rating scale. Before entering the driving simulator they were
informed about the driving session with the different experimental (tunnel) conditions.
The participants were informed that the drive would start with a training stretch
followed by driving the entry-ramp tunnels into the main tunnel. They were told that
after each entry-ramp they would stop in the main tunnel and rate their experiences on
the CR10 scale. It was explained to the participants that they after the rating should
continue driving, i.e. going further in the main tunnel, exiting at the first exit-ramp and
then re-entering through the next entry-ramp. The participants were instructed to drive
“as they normally would under similar circumstances in real traffic” and observe traffic
rules and regulations. The speed limit was 80 km/h in the main tunnel and 60 km/h in
the entry-ramp tunnels. Other instructions given were:
No overtaking (stay in the right-hand lane when in the main tunnel)
Use wing mirrors for rearward observations
No vehicles would enter the blind spot
Once in the simulator the participants familiarised themselves with the basic vehicle
controls. The driving started with a familiarisation drive on a surface (“open”) road after
which the driving scenario continued with a low speed surface road section whereupon
the participants entered the first entry-ramp tunnel.
After each of the four tunnel conditions, the participants had to stop in the tunnel to
answer/rate the four CR10 questions. After the rating they continued to drive, thus
20 ViP publication 2014-3
entering a new entry-ramp condition. After the final tunnel condition, the participants
got out of the simulator and answered a post-questionnaire and a T-LOC questionnaire.
The whole procedure took approximately 1.5 hours.
2.7 Data analyses
The statistical analyses used were ANOVA repeated measures and t-tests (SPSS version
17.0). Effect sizes (Eta squared) were classified according to Cohen (1988).
The point of merge-completion has been defined as the moment in time when the front-
right outside wheel edge of the simulator vehicle has exactly passed over the lane
marking between the entry-ramp and the lane which the vehicle is merging. The point of
merging was used as a freeze-frame moment in time (or window), in which the main
measurements were taken; these can be seen in Figure 3. In Figure 3 the participant’s
(/simulator) vehicle is indicated by the green car’s position and five measures are
illustrated by numbers, where 1 is the distance-to-wall measure, 2 is the mean speed at
the point of merging, 3 is the THW-forward, 4 is the THW-behind and 5 is the position-
between-vehicles measure. The distance-to-wall variable is more precisely a
measurement of the distance from the right-hand front edge of the simulator vehicle to
the end of the taper section of the merging zone when the merging manoeuvre has been
completed.
Four participants had rear-ended collisions, one participant in the experimental
condition with long entry-ramp and 1.5 s gap size and three participants in the
experimental condition with short entry-ramp and 1.5 s gap size. THW-forward, THW-
behind and position-between-vehicles data for these four participants were removed
because of complications with zero values in the simulator data.
Outliers (i.e. ≥ 3 z-scores from the mean) were excluded from analyses.
The significance level used in the statistical analyses was α = .05 (p < .05). Analyses
that are not significant are labelled with an “n.s.” suffix. Interaction effects were
calculated for all analyses but only reported in the Results section when there were
significant or near-significant effects.
ViP publication 2014-3 21
3 Results
3.1 Distance-to-wall
The distance-to-wall variable was analysed with a 2 x 2 x 2 repeated measures ANOVA.
The within-subject independent variables were entry-ramp tunnel length (1.5 km and 0.5
km) and gap size (1.5 s and 2.5 s) and the between-subject independent variable was
annual mileage (two groups; < 15 000 km and > 15 000 km). The analysis showed
significant main effects of ramp length (F (1, 19) = 50.735, p < .001, Eta squared = .73
large effect size) and gap size (F (1, 19) = 5.376, p < .05, Eta squared = .22 large effect
size), but not of annual mileage (F (1, 19) = 3.435, p = .08 n.s.).
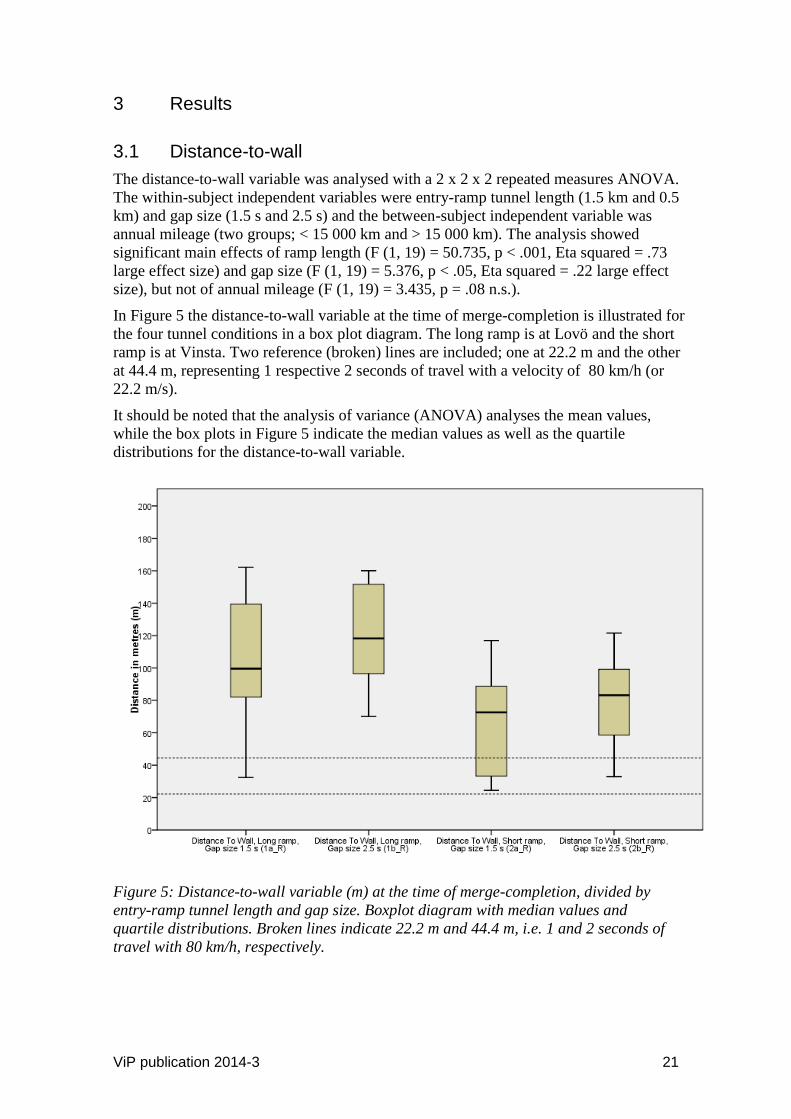
In Figure 5 the distance-to-wall variable at the time of merge-completion is illustrated for
the four tunnel conditions in a box plot diagram. The long ramp is at Lovö and the short
ramp is at Vinsta. Two reference (broken) lines are included; one at 22.2 m and the other
at 44.4 m, representing 1 respective 2 seconds of travel with a velocity of 80 km/h (or
22.2 m/s).
It should be noted that the analysis of variance (ANOVA) analyses the mean values,
while the box plots in Figure 5 indicate the median values as well as the quartile
distributions for the distance-to-wall variable.
Figure 5: Distance-to-wall variable (m) at the time of merge-completion, divided by
entry-ramp tunnel length and gap size. Boxplot diagram with median values and
quartile distributions. Broken lines indicate 22.2 m and 44.4 m, i.e. 1 and 2 seconds of
travel with 80 km/h, respectively.
22 ViP publication 2014-3
The mean and standard deviation (SD) values for the distance-to-wall variable are
reported below.
The long ramp with the 1.5 s gap size for participants with annual mileage < 15 000 km
had a mean distance-to-wall of 91.56 m (SD = 47.37). The long ramp with the 1.5 s gap
size for participants with annual mileage > 15 000 km had a mean distance-to-wall of
115.18 m (SD = 31.4). The mean distance-to-wall for the long ramp with the 1.5 s gap
size was 106.2 m (SD = 38.93).
The long ramp with the 2.5 s gap size for participants with annual mileage < 15 000 km
had a mean distance-to-wall of 101.07 m (SD = 25.8). The long ramp with the 2.5 s gap
size for participants with annual mileage > 15 000 km had a mean distance-to-wall of
133.18 m (SD = 24.15). The mean distance-to-wall for the long ramp with the 2.5 s gap
size was 120.95 m (SD = 28.95)
The short ramp with the 1.5 s gap size for participants with annual mileage < 15 000 km
had a mean distance-to-wall of 60.15 m (SD = 28.66). The short ramp with the 1.5 s gap
size for participants with annual mileage > 15 000 km had a mean distance-to-wall of
67.23 m (SD = 29.72). The mean distance-to-wall for the short ramp with the 1.5 s gap
size was 64.54 m (SD = 28.81).
The short ramp with the 2.5 s gap size for participants with annual mileage < 15 000 km
had a mean distance-to-wall of 75.27 m (SD = 30.64). The short ramp with the 2.5 s gap
size for participants with annual mileage > 15 000 km had a mean distance-to-wall of
80.57 m (SD = 29.17). The mean distance-to-wall for the short ramp with the 2.5 s gap
size was 78.55 m (SD = 29.09).
3.2 Position-between-vehicles at merging
The position-between-vehicles (decimal notation) variable was analysed with a 2 x 2 x 2
repeated measures ANOVA. The within-subject independent variables were entry-ramp
tunnel length (1.5 km and 0.5 km) and gap size (1.5 s and 2.5 s) and the between-subject
independent variable was annual mileage (two groups; < 15 000 km and > 15 000 km).
The analysis showed a significant main effect of gap size (F (1, 18) = 16.01, p < .001,
Eta squared = .47 large effect size), but neither of ramp length (F (1, 18) = 1.401, p =
.25 n.s.) nor of annual mileage (F (1, 18) = .118, p = .74 n.s.).
In Figure 6 the position-between-vehicles variable at merging is shown as a decimal
notation for the four tunnel conditions. The decimal notation can also be expressed as a
percentage where; 100 % (or 1.00) means a collision with the vehicle in front; 50 % (or
0.50) means a position exactly in the middle between the vehicles in front and behind;
and 0 % (or 0.00) means a collision with the vehicle behind.

ViP publication 2014-3 23
Figure 6: The mean position-between-vehicles (decimal notation) at merging, divided
by entry-ramp tunnel length and gap size.
The mean and standard deviation (SD) values for the position-between-vehicles variable
are reported below.
The long ramp with the 1.5 s gap size had a mean position-between-vehicles of .47 (SD
= .23). The long ramp with the 2.5 s gap size had a mean position-between-vehicles of
.31 (SD = .09).
The short ramp with the 1.5 s gap size had a mean position-between-vehicles of .42 (SD
= .23). The short ramp with the 2.5 s gap size had a mean position-between-vehicles of
.29 (SD =.13).
3.3 Time headway at merging
The time headway (THW) measures THW-behind and THW-forward are intertwined.
Both measures were extracted at the point of merge-completion.
3.3.1 THW-behind
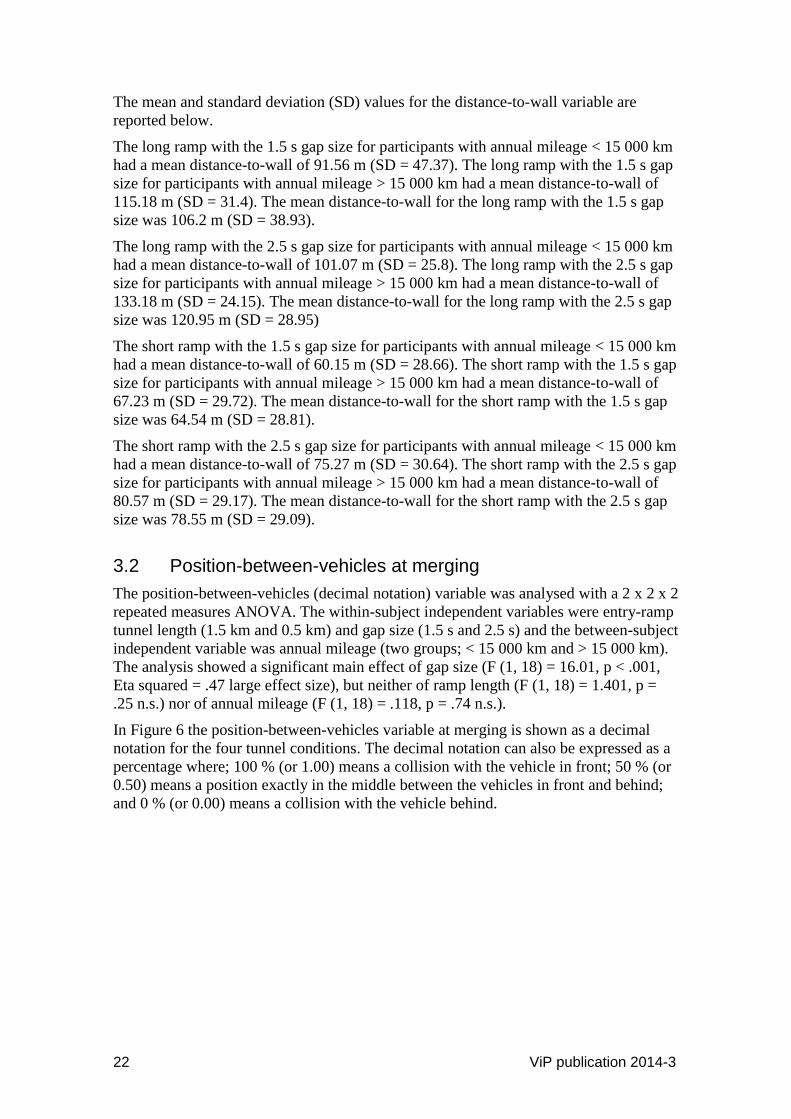
The time headway to the rearward vehicle (THW-behind) variable was analysed with a
2 x 2 x 2 repeated measures ANOVA. The within-subject independent variables were
entry-ramp tunnel length (1.5 km and 0.5 km) and gap size (1.5 s and 2.5 s) and the
24 ViP publication 2014-3
between-subject independent variable was annual mileage (two groups; < 15 000 km
and > 15 000 km). The analysis showed a significant main effect of gap size (F (1, 16) =
355.95, p < .001, Eta squared = .96 large effect size), but neither of ramp length (F (1,
16) = 1.533, p = .23 n.s.) nor of annual mileage (F (1, 16) = .138, p = .72 n.s.).
The results are shown in Figure 7. Outliers (i.e. ≥ 3 z-scores from the mean; not
included in the analysis) are shown in Figure 7 with the corresponding participant
numbers.
It should be noted that the analysis of variance (ANOVA) analyses the mean values,
while the box plots in Figure 7 indicate the median values as well as the quartile
distributions for the THW-behind.
Figure 7: The time headway to the rearward vehicle (THW-behind) (s) at merging,
divided by entry-ramp tunnel length and gap size. Boxplot diagram with median values
and quartile distributions.
The mean and standard deviation (SD) values for the THW-behind variable are reported
below.
The long ramp with the 1.5 s gap size had a mean THW-behind of .45 s (SD = .21).
The long ramp with the 2.5 s gap size had a mean THW-behind of 1.35 s (SD = .18).
The short ramp with the 1.5 s gap size had a mean THW-behind of.53 s (SD = .25).
The short ramp with the 2.5 s gap size had a mean THW-behind of 1.35 s (SD =.23).
ViP publication 2014-3 25
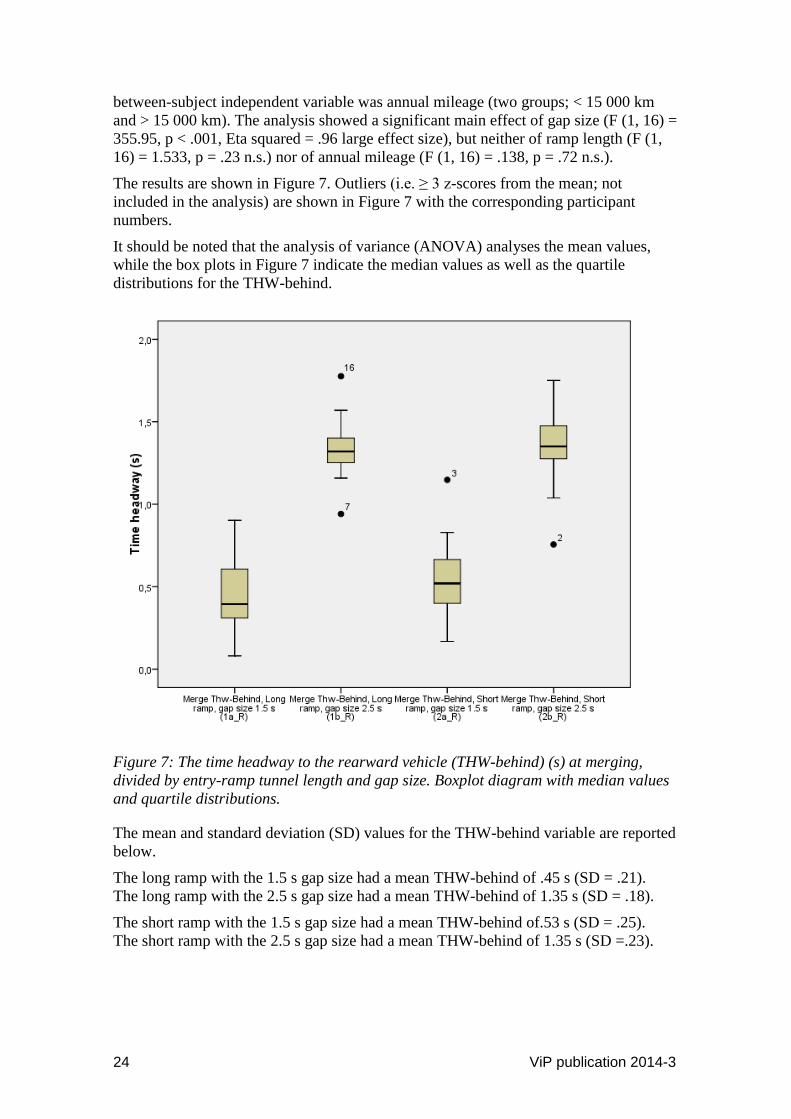
3.3.2 THW-forward
The time headway to the vehicle in front (THW-forward) variable was analysed with a
2 x 2 x 2 repeated measures ANOVA. The within-subject independent variables were
entry-ramp tunnel length (1.5 km and 0.5 km) and gap size (1.5 s and 2.5 s) and the
between-subject independent variable was annual mileage (two groups; < 15 000 km
and > 15 000 km). The analysis showed a significant main effect of gap size (F (1, 15) =
4.719, p < .05, Eta squared = .24 large effect size), but neither of ramp length (F (1, 15)
= .61, p = .81 n.s.) nor of annual mileage (F (1, 17) = .0, p = .95 n.s.). There was also a
significant interaction effect between ramp length x gap size x mileage group (F (1, 15)
= 4.568, p < .05, Eta squared = .23 large effect size).
The results are shown in Figure 8. Outliers (i.e. ≥ 3 z-scores from the mean; not
included in the analysis) are shown in Figure 8 with the corresponding participant
numbers.
It should be noted that the analysis of variance (ANOVA) analyses the mean values,
while the box plots in Figure 8 indicate the median values as well as the quartile
distributions for the THW-forward variable.
Figure 8: The time headway to the vehicle in front (THW-forward) (s) at merging,
divided by entry-ramp tunnel length and gap size. Boxplot diagram with median values
and quartile distributions.
26 ViP publication 2014-3
The mean and standard deviation (SD) values for the THW-forward variable are
reported below.
The long ramp with the 1.5 s gap size had a mean THW-forward of .70 s (SD = .24).
The long ramp with the 2.5 s gap size had a mean THW-forward of .79 s (SD = .21).
The short ramp with the 1.5 s gap size had a mean THW-forward of .66 s (SD = .25).
The short ramp with the 2.5 s gap size had a mean THW-forward of .81 s (SD =.28).
3.4 Speed
3.4.1 Speed at merging
No significant differences were found for the mean speed variable.
Table 2: Mean speed (m/s) at merging for the four tunnel conditions, combinations of
ramp length and gap size.
Mean
Standard
deviation N
SpeedAtMerge
long ramp 1.5 s gap size
21.7 .73 19
SpeedAtMerge
long ramp 2.5 s gap size
21.6 .93 19
SpeedAtMerge
short ramp 1.5 s gap size
21.6 1.09 19
SpeedAtMerge
short ramp 2.5 s gap size
21.2 .94 19
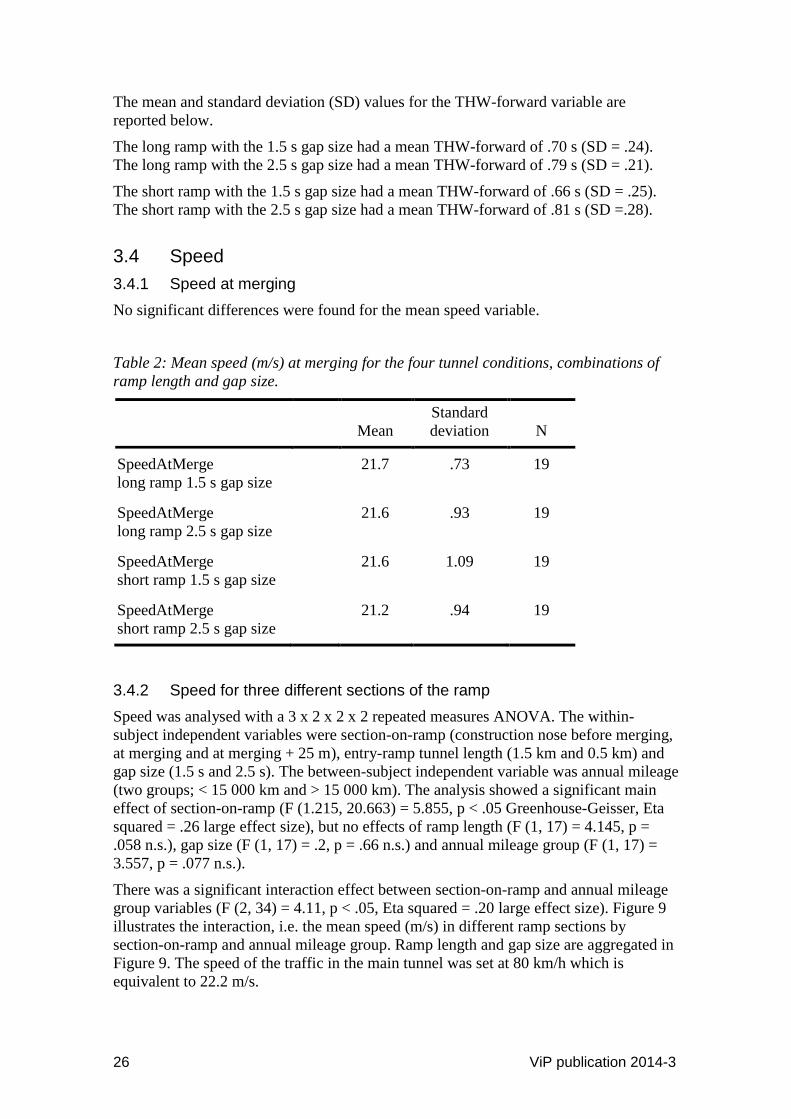
3.4.2 Speed for three different sections of the ramp
Speed was analysed with a 3 x 2 x 2 x 2 repeated measures ANOVA. The within-
subject independent variables were section-on-ramp (construction nose before merging,
at merging and at merging + 25 m), entry-ramp tunnel length (1.5 km and 0.5 km) and
gap size (1.5 s and 2.5 s). The between-subject independent variable was annual mileage
(two groups; < 15 000 km and > 15 000 km). The analysis showed a significant main
effect of section-on-ramp (F (1.215, 20.663) = 5.855, p < .05 Greenhouse-Geisser, Eta
squared = .26 large effect size), but no effects of ramp length (F (1, 17) = 4.145, p =
.058 n.s.), gap size (F (1, 17) = .2, p = .66 n.s.) and annual mileage group (F (1, 17) =
3.557, p = .077 n.s.).
There was a significant interaction effect between section-on-ramp and annual mileage
group variables (F (2, 34) = 4.11, p < .05, Eta squared = .20 large effect size). Figure 9
illustrates the interaction, i.e. the mean speed (m/s) in different ramp sections by
section-on-ramp and annual mileage group. Ramp length and gap size are aggregated in
Figure 9. The speed of the traffic in the main tunnel was set at 80 km/h which is
equivalent to 22.2 m/s.
ViP publication 2014-3 27
Figure 9: Speed (m/s) in three different ramp sections by mileage group and section-on-
ramp. Means ± standard error bars.
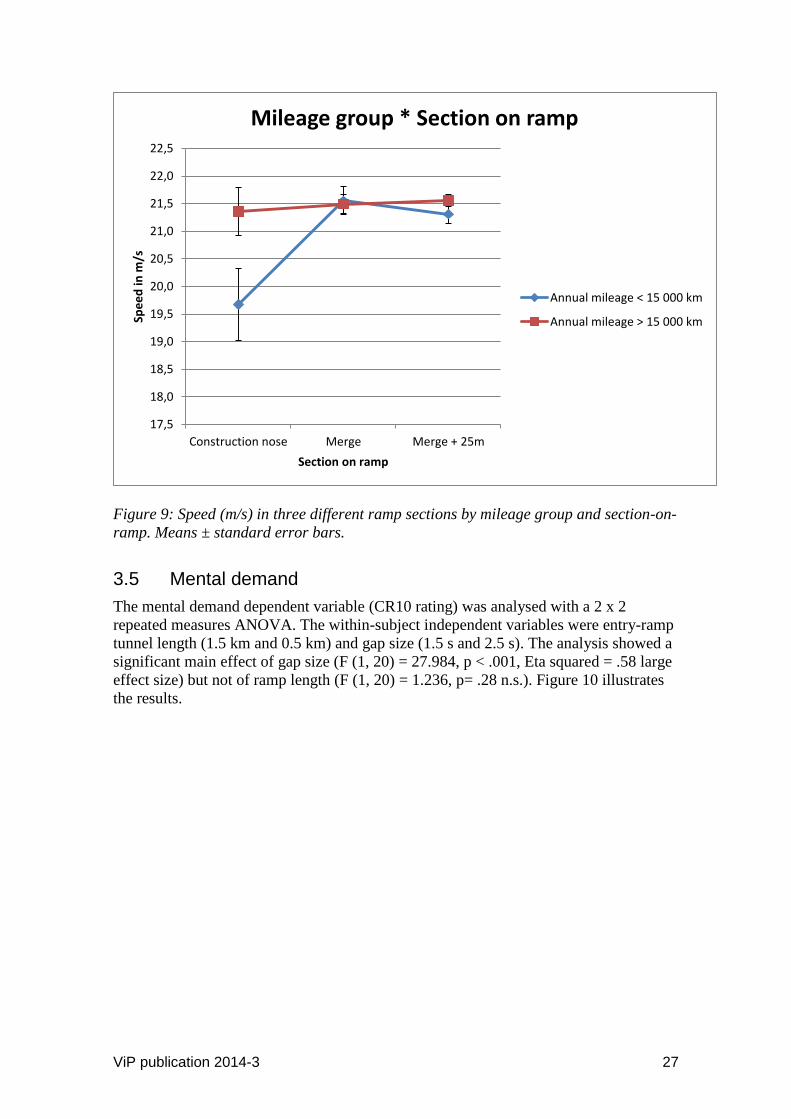
3.5 Mental demand
The mental demand dependent variable (CR10 rating) was analysed with a 2 x 2
repeated measures ANOVA. The within-subject independent variables were entry-ramp
tunnel length (1.5 km and 0.5 km) and gap size (1.5 s and 2.5 s). The analysis showed a
significant main effect of gap size (F (1, 20) = 27.984, p < .001, Eta squared = .58 large
effect size) but not of ramp length (F (1, 20) = 1.236, p= .28 n.s.). Figure 10 illustrates
the results.
17,5
18,0
18,5
19,0
19,5
20,0
20,5
21,0
21,5
22,0
22,5
Construction nose Merge Merge + 25m
Spe
ed
in m
/s
Section on ramp
Mileage group * Section on ramp
Annual mileage < 15 000 km
Annual mileage > 15 000 km
28 ViP publication 2014-3
Figure 10: Mean mental demand CR10 ratings by entry-ramp tunnel length and gap
size.
The mean and standard deviation (SD) values for the mental demand (CR10 rating)
variable are reported below.
The long ramp with the 1.5 s gap size had a mean mental demand CR10 rating of 2.4
(SD = 1.4). The long ramp with the 2.5 s gap size had a mean mental demand CR10
rating of 1.8 (SD = 1.4).
The short ramp with the 1.5 s gap size had a mean mental demand CR10 rating of 2.9
(SD = 1.8). The short ramp with the 2.5 s gap size had a mean mental demand CR10
rating of 1.7 (SD =1.2).
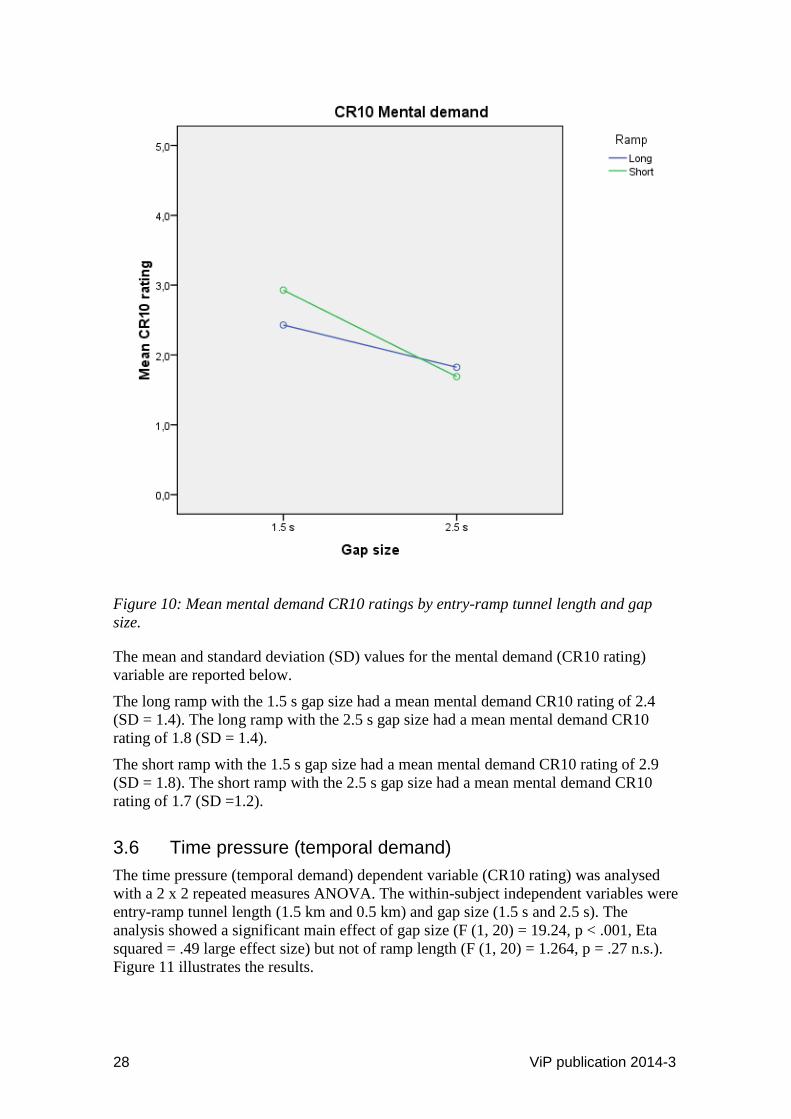
3.6 Time pressure (temporal demand)
The time pressure (temporal demand) dependent variable (CR10 rating) was analysed
with a 2 x 2 repeated measures ANOVA. The within-subject independent variables were
entry-ramp tunnel length (1.5 km and 0.5 km) and gap size (1.5 s and 2.5 s). The
analysis showed a significant main effect of gap size (F (1, 20) = 19.24, p < .001, Eta
squared = .49 large effect size) but not of ramp length (F (1, 20) = 1.264, p = .27 n.s.).
Figure 11 illustrates the results.
ViP publication 2014-3 29
Figure 11: Mean time pressure (temporal demand) CR10 ratings by entry-ramp tunnel
length and gap size.
The mean and standard deviation (SD) values for the temporal demand (CR10 rating)
variable are reported below.
The long ramp with the 1.5 s gap size had a mean temporal demand CR10 rating of 3.2
(SD = 1.8). The long ramp with the 2.5 s gap size had a mean temporal demand CR10
rating of 1.7 (SD = 1.4).
The short ramp with the 1.5 s gap size had a mean temporal demand CR10 rating of 3.6
(SD = 2.6). The short ramp with the 2.5 s gap size had a mean temporal demand CR10
rating of 1.9 (SD =1.4).
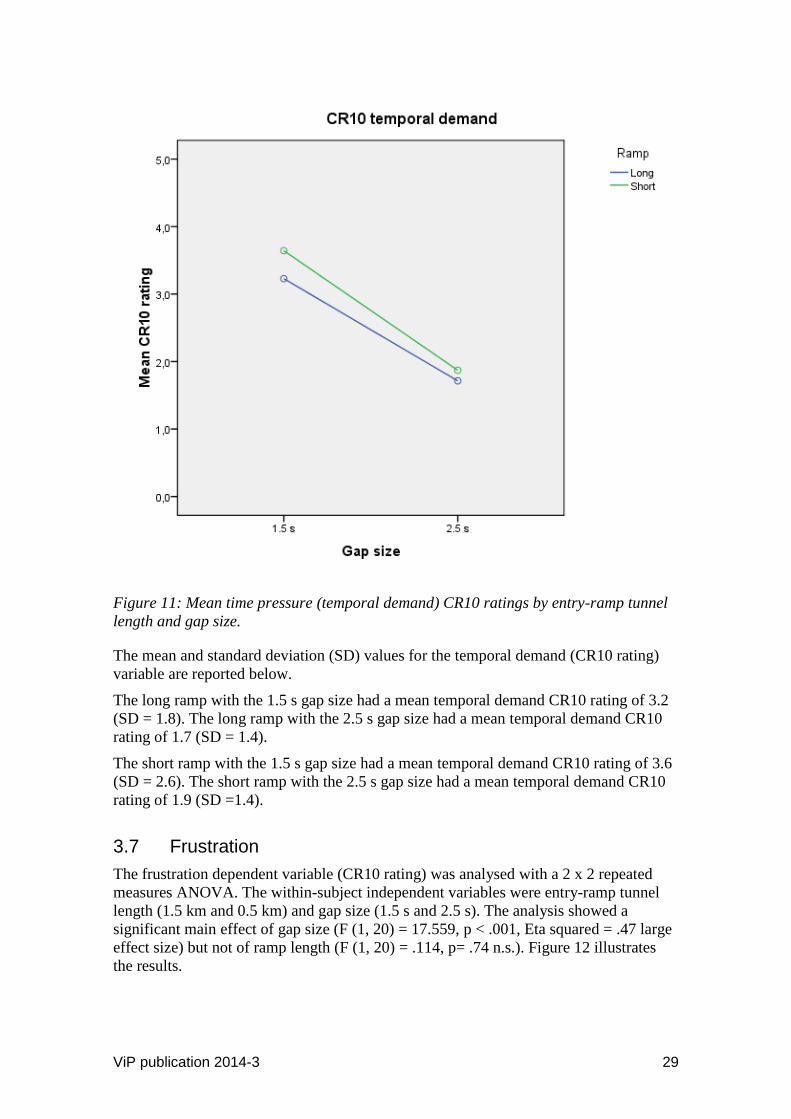
3.7 Frustration
The frustration dependent variable (CR10 rating) was analysed with a 2 x 2 repeated
measures ANOVA. The within-subject independent variables were entry-ramp tunnel
length (1.5 km and 0.5 km) and gap size (1.5 s and 2.5 s). The analysis showed a
significant main effect of gap size (F (1, 20) = 17.559, p < .001, Eta squared = .47 large
effect size) but not of ramp length (F (1, 20) = .114, p= .74 n.s.). Figure 12 illustrates
the results.
30 ViP publication 2014-3
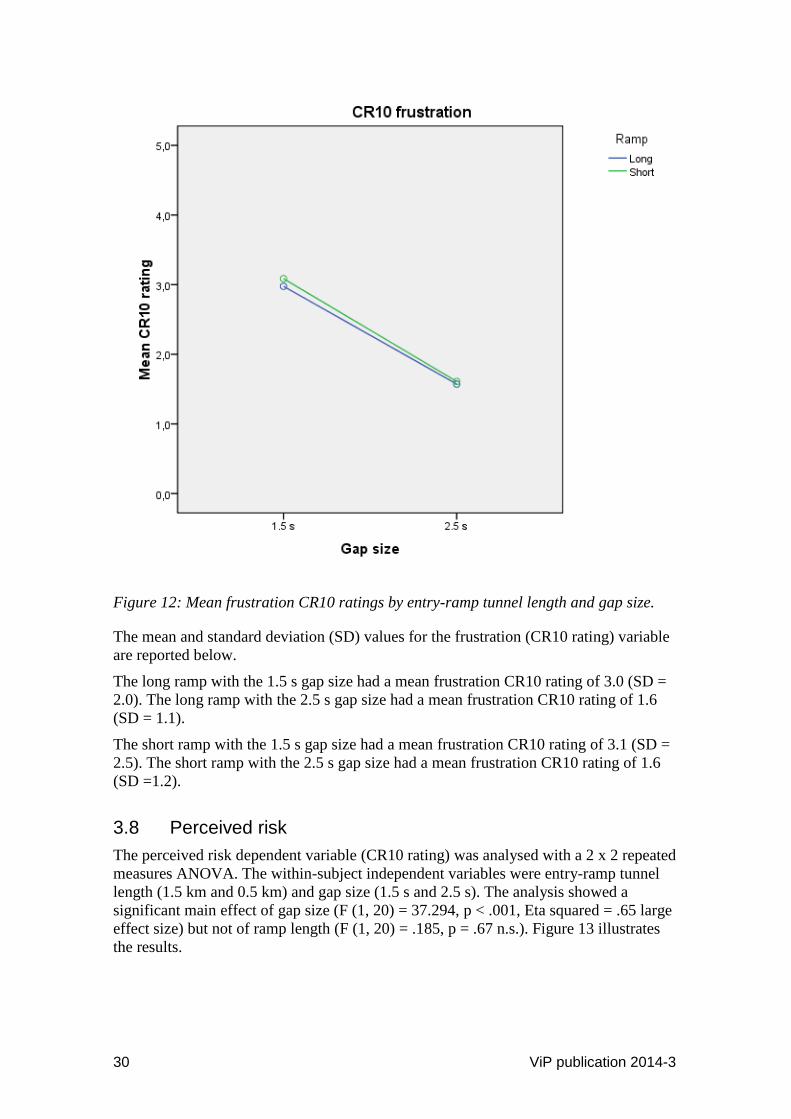
Figure 12: Mean frustration CR10 ratings by entry-ramp tunnel length and gap size.
The mean and standard deviation (SD) values for the frustration (CR10 rating) variable
are reported below.
The long ramp with the 1.5 s gap size had a mean frustration CR10 rating of 3.0 (SD =
2.0). The long ramp with the 2.5 s gap size had a mean frustration CR10 rating of 1.6
(SD = 1.1).
The short ramp with the 1.5 s gap size had a mean frustration CR10 rating of 3.1 (SD =
2.5). The short ramp with the 2.5 s gap size had a mean frustration CR10 rating of 1.6
(SD =1.2).
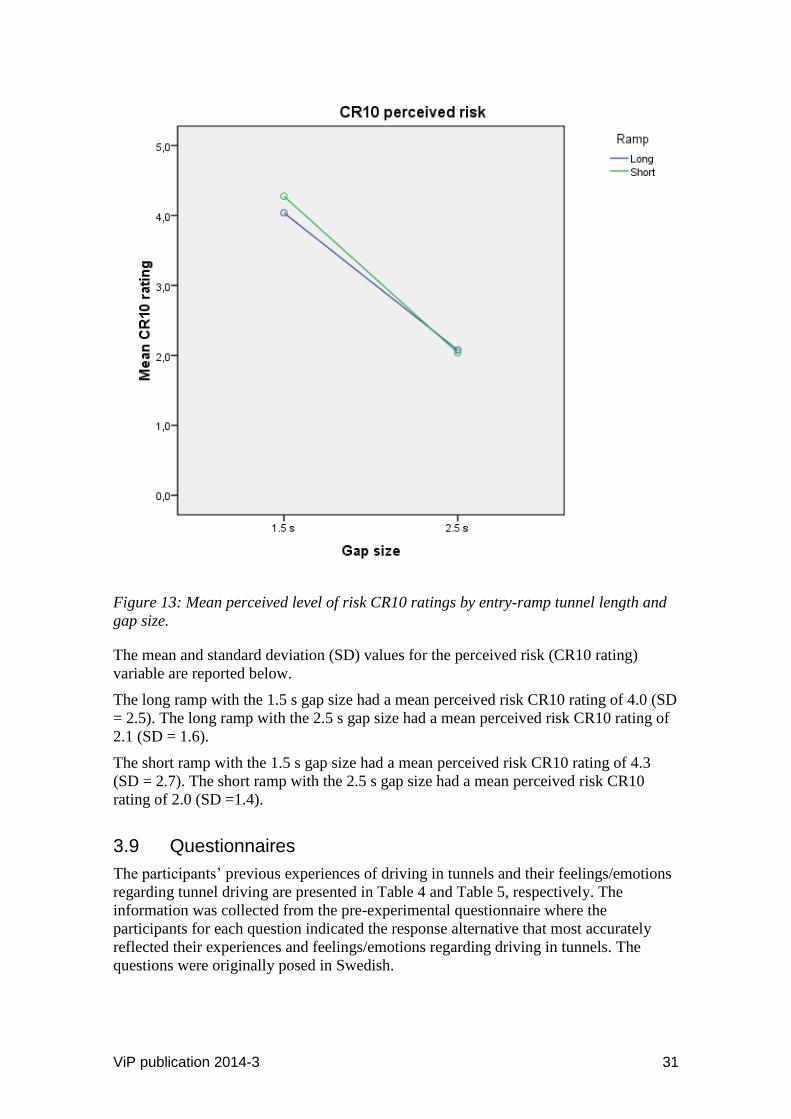
3.8 Perceived risk
The perceived risk dependent variable (CR10 rating) was analysed with a 2 x 2 repeated
measures ANOVA. The within-subject independent variables were entry-ramp tunnel
length (1.5 km and 0.5 km) and gap size (1.5 s and 2.5 s). The analysis showed a
significant main effect of gap size (F (1, 20) = 37.294, p < .001, Eta squared = .65 large
effect size) but not of ramp length (F (1, 20) = .185, p = .67 n.s.). Figure 13 illustrates
the results.
ViP publication 2014-3 31
Figure 13: Mean perceived level of risk CR10 ratings by entry-ramp tunnel length and
gap size.
The mean and standard deviation (SD) values for the perceived risk (CR10 rating)
variable are reported below.
The long ramp with the 1.5 s gap size had a mean perceived risk CR10 rating of 4.0 (SD
= 2.5). The long ramp with the 2.5 s gap size had a mean perceived risk CR10 rating of
2.1 (SD = 1.6).
The short ramp with the 1.5 s gap size had a mean perceived risk CR10 rating of 4.3
(SD = 2.7). The short ramp with the 2.5 s gap size had a mean perceived risk CR10
rating of 2.0 (SD =1.4).
3.9 Questionnaires
The participants’ previous experiences of driving in tunnels and their feelings/emotions
regarding tunnel driving are presented in Table 4 and Table 5, respectively. The
information was collected from the pre-experimental questionnaire where the
participants for each question indicated the response alternative that most accurately
reflected their experiences and feelings/emotions regarding driving in tunnels. The
questions were originally posed in Swedish.
32 ViP publication 2014-3
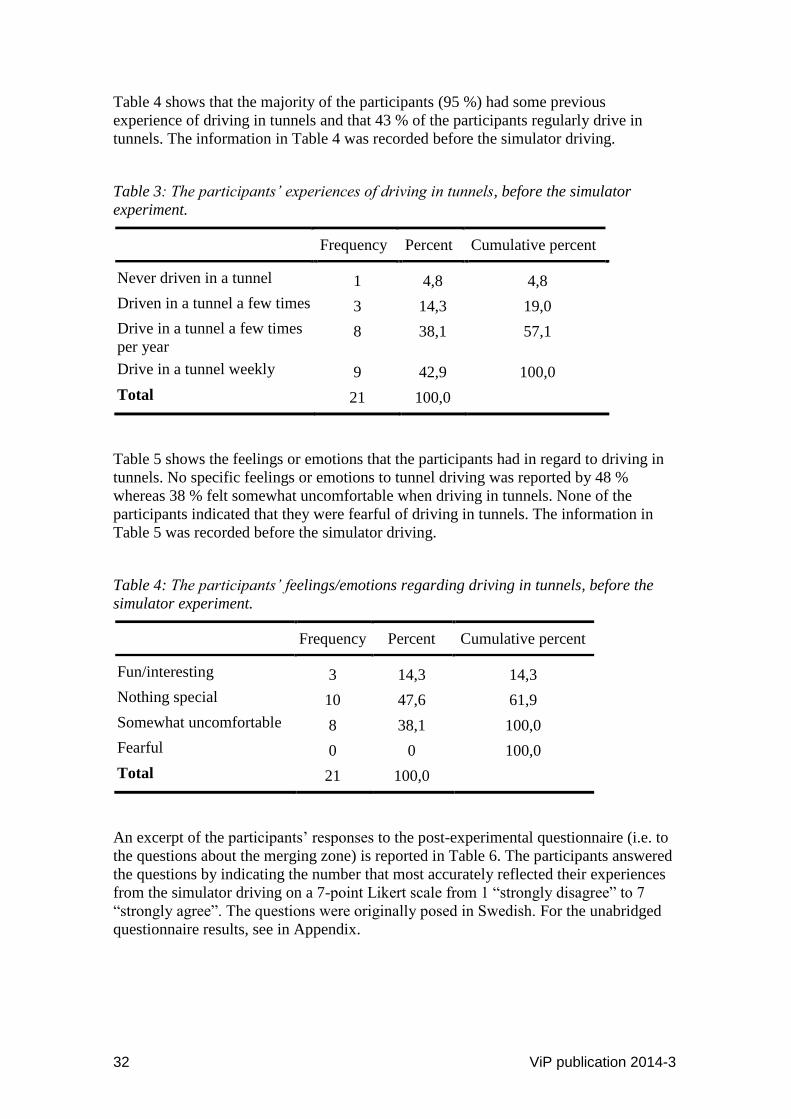
Table 4 shows that the majority of the participants (95 %) had some previous
experience of driving in tunnels and that 43 % of the participants regularly drive in
tunnels. The information in Table 4 was recorded before the simulator driving.
Table 3: The participants’ experiences of driving in tunnels, before the simulator
experiment.
Frequency Percent Cumulative percent
Never driven in a tunnel 1 4,8 4,8
Driven in a tunnel a few times 3 14,3 19,0
Drive in a tunnel a few times
per year 8 38,1 57,1
Drive in a tunnel weekly 9 42,9 100,0
Total 21 100,0
Table 5 shows the feelings or emotions that the participants had in regard to driving in
tunnels. No specific feelings or emotions to tunnel driving was reported by 48 %
whereas 38 % felt somewhat uncomfortable when driving in tunnels. None of the
participants indicated that they were fearful of driving in tunnels. The information in
Table 5 was recorded before the simulator driving.
Table 4: The participants’ feelings/emotions regarding driving in tunnels, before the
simulator experiment.
Frequency Percent Cumulative percent
Fun/interesting 3 14,3 14,3
Nothing special 10 47,6 61,9
Somewhat uncomfortable 8 38,1 100,0
Fearful 0 0 100,0
Total 21 100,0
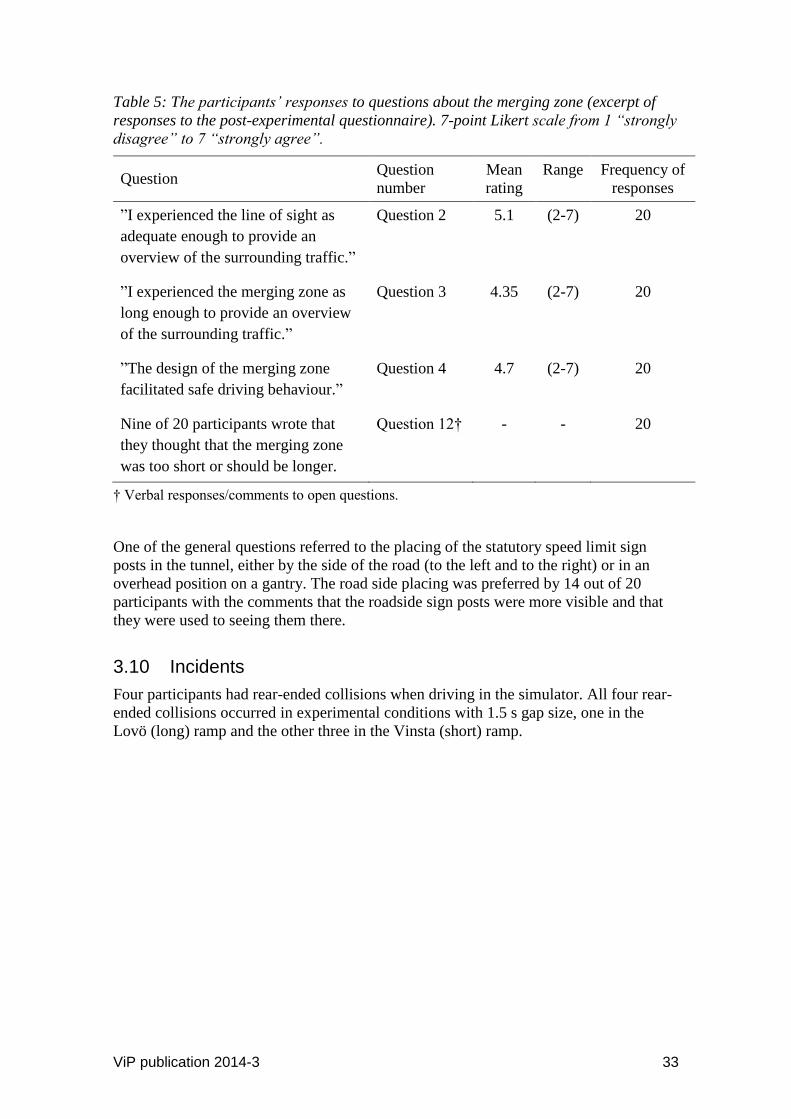
An excerpt of the participants’ responses to the post-experimental questionnaire (i.e. to
the questions about the merging zone) is reported in Table 6. The participants answered
the questions by indicating the number that most accurately reflected their experiences
from the simulator driving on a 7-point Likert scale from 1 “strongly disagree” to 7
“strongly agree”. The questions were originally posed in Swedish. For the unabridged
questionnaire results, see in Appendix.
ViP publication 2014-3 33
Table 5: The participants’ responses to questions about the merging zone (excerpt of
responses to the post-experimental questionnaire). 7-point Likert scale from 1 “strongly
disagree” to 7 “strongly agree”.
Question Question
number
Mean
rating
Range Frequency of
responses
”I experienced the line of sight as
adequate enough to provide an
overview of the surrounding traffic.”
Question 2 5.1 (2-7) 20
”I experienced the merging zone as
long enough to provide an overview
of the surrounding traffic.”
Question 3 4.35 (2-7) 20
”The design of the merging zone
facilitated safe driving behaviour.”
Question 4 4.7 (2-7) 20
Nine of 20 participants wrote that
they thought that the merging zone
was too short or should be longer.
Question 12† - - 20
† Verbal responses/comments to open questions.
One of the general questions referred to the placing of the statutory speed limit sign
posts in the tunnel, either by the side of the road (to the left and to the right) or in an
overhead position on a gantry. The road side placing was preferred by 14 out of 20
participants with the comments that the roadside sign posts were more visible and that
they were used to seeing them there.
3.10 Incidents
Four participants had rear-ended collisions when driving in the simulator. All four rear-
ended collisions occurred in experimental conditions with 1.5 s gap size, one in the
Lovö (long) ramp and the other three in the Vinsta (short) ramp.
34 ViP publication 2014-3
4 Discussion
The main results of the reported study suggest that the merging zones were too short for
some of the drivers in order to merge comfortably and safely. The merging zones are
found at the point where the entry-ramp tunnel merges with the main motorway tunnel.
The merging zones comprise an observation section, an adjustment section and a
completion (/taper) section. For the Vinsta (0.5 km) ramp with heavy traffic the
distance-to-wall measure (the measure that gauges how much of the entry-ramp remains
at the time of merge-completion) is particularly concerning from a road traffic safety
perspective because more than 25 % of the drivers completed the merging manoeuvre
with less than two seconds of time headway (THW) remaining before the end of the
completion section. Two seconds of travel before the ending of the tapered completion
section of the entry-ramp was considered to be the bare minimum in terms of safe
driving and safe merging. Two seconds equates to 44.4 m when travelling at 80 km/h.
The completion section of the entry-ramp also tapers to the width of a car (approx. 2 m)
40 m from the end of the ramp. There is however, a right-hand lane hard shoulder with a
width of approximately 2 m (i.e. wide) drawn on the blueprints after the end of the
ramp. The motorway lanes are 3.5 m wide.
The point-of-no-return refers to the point in time when the driver has to either complete
the merging manoeuvre or stop the vehicle on the ramp before the ramp becomes too
narrow to safely and comfortably stop. In practical terms, the point-of-no-return for a
driver wishing to stop on the ramp would be before the 40 m limit (mentioned above)
due to the vehicle’s width. The stopping distance of an average car travelling at 80 km/h
is approximately 53 m in good conditions, i.e, distance passed during reaction time,
15 m, and distance passed while braking, 38 m (HM Stationary Office, 2001). It could
therefore be argued that for a driver wishing to abort the manoeuvre the point-of-no-
return would be approximately 40 + 53 = 93 m (at 80 km/h) before the very end of the
ramp. A distance of 93 m is roughly 4.2 s of travelling time at 80 km/h. This suggests
that the Vinsta ramp in particular, should be studied in more detail.
The results also suggest that drivers with more driving experience (> 15 000 km/year)
adopted a different strategy when merging. Their strategy could be described as active
(instead of passive) where they appeared to use speed differently (higher constant
speed) and merged earlier rather than later upon entering the merging zones. The active
driving strategy appeared to be safer (in terms of longer distances to the end of the
merging zone) than the passive or defensive driving style when merging from an entry-
ramp onto a busy motorway.
Interestingly the mean time headway (THW) for merging was approximately 0.75 s to
the vehicle in front irrespective of the distance to the vehicle behind (see Figures 7 and
8). The results for the THW-behind measure and the THW-forward measure indicated a
behavioural preference of drivers to place themselves between vehicles using the THW-
forward (as one would expect) and moreover, keeping the THW-forward relatively
constant irrespective of gap size (/traffic intensity) and distance to the vehicle behind.
The two entry-ramp tunnels and their corresponding merging zones were slightly
different in that the Lovö entry-ramp tunnel was 1.5 km and the adjustment section of
the merging zone was 125 m, while the Vinsta entry-ramp tunnel was 0.5 km and the
adjustment section of the merging zone was 80 m. The completion sections of both
entry-ramps (merging zones) were similar and equally long, 100 m each. The total
lengths of both merging zones (Lovö and Vinsta) were approximately the same (325 m
and 330 m, respectively). The drivers did not appear to subjectively (CR10 ratings and
ViP publication 2014-3 35
post-experimental questionnaire) distinguish between the two ramp configurations (i.e.
entry-ramp tunnels plus the merging zones) at Lovö and Vinsta. There were, however,
notable differences for the distance-to-wall measure. The CR10 ratings generally
suggest no subjective differences between ramps but did however suggest significantly
increased levels for the smaller gap size (1.5 s) on all four CR10 dimensions; mental
demand, time pressure, frustration and perceived risk.
Traffic intensity expressed indirectly by the gap size influenced the frequency and
character of hazardous situations such as late merging. There were clear differences
between the two gap sizes (1.5 s and 2.5 s) for the following measures: distance-to-wall;
position-between-vehicles; THW-behind; THW-forward; CR10 ratings of mental
demand, time pressure, frustration and perceived risk. The smaller gap size (1.5 s) was
associated with more hazardous situations.
There were differences in mean speed depending on the section of ramp where a
significant interaction was found between gap size (1.5 s and 2.5 s), ramp (Lovö and
Vinsta) and driver experience (drivers with an annual mileage greater than or less than
15 000 km). This interaction effect between mean speed and the other measures is
arguable a product of driver experience and subsequent differences in driving style,
rather than differences in the ramps themselves.
This study has some limitations regarding sample size (i.e. the number of test
participants), however, the size of the test group can be considered normal for this kind
of study. The sample size used limits the generalisation possibility of the results, in
particular regarding the effect size on a real population. It is, however, important to
point out that even with this limitation, many of the results were statistically significant
and many of the test participants encountered difficulties when merging, giving rise to
serious safety concerns for drivers in real life if the tunnel is built using the present
entry-ramp dimensions. It is proposed that longer merging zones would resolve many of
the difficulties that drivers encountered and facilitate sizable safety benefits for road
users in the tunnel.
An additional, more general limitation is that absolute judgement of distance and speed
is not always easy in general and this difficulty applies to simulators in particular.
However, in a recent validation study of the VTI Simulator III absolute validity between
driving in the field and in the simulator was indicated for speed (Ahlström, Bolling,
Sörensen, Eriksson, & Andersson, 2012). The distances between the autonomously
generated vehicles, i.e. the traffic created in the simulator in the right-hand lane in the
main tunnel, was equal; either 1.5 s gap sizes or 2.5 s gap sizes. This may appear a little
unlikely in real traffic but was necessary for the experiment because the authors did not
know a priori which gap the drivers would choose. However, once the drivers had
completed the merging manoeuvre, the vehicle behind was programmed to avoid a rear-
end collision. There were, however, four incidents where the drivers merged so late that
there was a collision with the simulated vehicle behind. This data was excluded from
the analyses. Moreover, one could argue that the drivers’ merging behaviour might have
been affected by the rather rigid following and braking behaviour of the simulated
vehicles behind. There was also a restricted field of view due to the 120 degrees
simulator screen but the simulator was programmed to not allow traffic to enter the
drivers’ blind spot. The concerns about the rigid traffic and the restricted field of view
appear to be unfounded because analysis of the time headway (THW) data suggested
that the drivers used the THW-forward to gauge their manoeuvre and appeared to
36 ViP publication 2014-3
disregard the THW-behind and the exact position of the vehicle behind. It would,
however, be interesting to study this trait in a field study with eye tracking equipment.
Additionally, the simulated traffic in the main tunnel comprised only cars and there
were no trucks or buses in the right-hand lane. This arguably made the merging task
easier for the drivers in this study, in comparison to what could be expected in real life
driving when the tunnel will be used by heavy vehicles. In peak hour traffic, the planned
bus service using parts of the tunnel (but not all) is expected to be approximately one
bus per minute. The length and frequency of heavy vehicles (trucks up to 24 m and
buses up to 18 m length) in the main tunnel may cause additional difficulties for drivers
hoping to merge into the main tunnel simply because of their greater length and the
reduced number of viable gaps between vehicles.
The ratio between gap size and speed (m/s) used in the main tunnel was based on a
relatively high, but still regularly occurring ratio as calculated from empirical traffic
data from Swedish motorways. The empirical motorway data clearly illustrates that
drivers in real traffic drive at 110 km/h even at peak-hour free-flowing traffic (Olstam,
Carlsson, & Yahya, 2013). Olstam et al. (2013) found that free-flowing traffic on
Swedish motorways had an hourly rate of 1650 vehicles per lane at 110 km/h. This
equates to a mean gap size of 2.0 seconds per car at 110 km/h when accounting for
vehicle length. Olstam et al. (20113) propose a traffic flow/speed model that projects
the outcomes at different speeds and traffic intensity levels. The estimated traffic
intensity per motorway lane at 80 km/h is 2000 vehicles per hour. This equates to a
mean gap size between vehicles of 1.56 seconds. It should be noted that where the mean
gap size is 1.56 s, there are many vehicles travelling with a gap size much shorter than
1.5 s.
The Stockholm bypass tunnel is planned to be completed in approximately eight to ten
years from the present day. In the meantime the development of autonomous vehicles
and platooning vehicles will have matured and the market penetration increased. A
caveat is necessary regarding the possible effects that platooning and autonomous
vehicles will have on traffic flow, gap sizes behaviour, merging and road safety in
general.
ViP publication 2014-3 37
5 Conclusions
There are safety concerns relating to the design of the entry-ramps, in particular the
Vinsta ramp. The authors cannot categorically state that there is a road traffic safety
problem with the entry-ramp tunnel at the subterranean Vinsta junction but we are
concerned that if the merging zones are not lengthened or improved in some other
suitable fashion, then there is a major likelihood of collisions and incidents on the entry-
ramp. This will in turn lead to stationary traffic and queues all the way up the entry-
ramp tunnels creating unwanted traffic congestions.
5.1 Future research
In order to establish the causes and to seek and verify possible solutions to the safety
concerns arising from this study, a number of areas need to be explored. New research
questions in relation to the merging zones of the subterranean junctions in the
Stockholm bypass tunnel project are:
1. Would lengthening the merging zone at Vinsta improve the safety of that entry-
ramp?
2. What are the characteristics of an entry-ramp into a motorway tunnel that gives
provision for safe and well-working merging? On the other hand, what causes
unsafe merging performance? Could it be other aspects apart from the actual
length of the merging zones?
3. Only two of the five planned entry-ramps have been assessed in this study. What
is the status of the remaining entry-ramps from a safety perspective?
4. Can we use micro-simulation data together with test drivers to assess the effects
of different scenarios on traffic flow? This could include activated motorway
control systems (MCS); having multiple vehicles on the entry-ramps as well as
in the main tunnel.
5. How is the merging situation affected when heavy vehicles want to merge?
There are issues on accelerating up to the speed of the traffic in the main tunnel
in addition to visibility issues for heavy vehicles. E.g., what will happen to the
traffic situation in the entry-ramps when the planned entry-ramps for buses are
added to the existing entry-ramps?
6. Is it possible to manage traffic and modify driver behaviour to avoid critical
situations merely by means of motorway control systems (MSC) preceding each
of the merging zones in the main tunnel?
5.2 Benefits for ViP
This study has illustrated the unique potential of using a driving simulator to study road
infrastructure from a design and safety perspective. Construction of the Stockholm
bypass tunnel has not started and yet it was possible, using the simulator, to create the
entire tunnel from the blueprints and evaluate different design features of this
infrastructure project. The development of infrastructure models is highly relevant for
the ViP partners and is especially useful for those who are already involved in similar
projects e.g. Known Roads. The virtual tunnel environment developed in this project is
now available within ViP and has also been implemented in a simulator at MUARC
(Monash University Accident Research Centre, Melbourne) and used in collaborative
studies.
38 ViP publication 2014-3
References
Ahlström, C., Bolling, A., Sörensen, G., Eriksson, O., & Andersson, A. (2012).
Validating speed and road surface realism in VTI driving simulator III. VTI
rapport 745A. Linköping: the Swedish National Road and Transport Research
Institute (VTI).
Borg, G. (1982). Psychophysical bases of perceived exertion. Medicine and Science in
Sports and Exercise, 14 (5), pp. 377-381.
Borg, G., & Borg, E. (2008). Borg CR Scales Folder. Stockholm: Borg Perception.
Cohen, J. (1988). Statistical Power Analysis for the Behavioral Sciences (2nd Ed.).
Hillsdale, NJ: Lawrence Erlbaum Associates.
HM Stationary Office. (2001). The Highway Code. Prepared by the U.K. Department of
Transport and the Central Office of Information. London: HMSO.
Kircher, K., & Ahlström, C. (2012). The impact of tunnel design and lighting on the
performance of attentive and visually distracted drivers. Accident Analysis and
Prevention, 47, pp. 153-161.
Kircher, K., & Lundkvist, S.-O. (2011). The influence of lighting, wall colour and
inattention on traffic safety in tunnels – A simulator study. VTI rapport 724A.
Linköping: the Swedish National Road and Transport Research Institute (VTI).
Manser, M. P., & Hancock, P. A. (2007). The influence of perceptual speed regulation
on speed perception, choice, and control: Tunnel wall characteristics and
influences. Accident Analysis and Prevention, 39, pp. 69-78.
Olstam, J., Carlsson, A., & Yahya, M.-R. (2013). Hastighetsflödessamband för svenska
typvägar – Förslag till reviderade samband baserat på TMS-mätningar från
2009-2011. VTI rapport 784 (in Swedish). Linköping: the Swedish National
Road and Transport Research Institute (VTI).
Patten, C., Ceci, R., Engström, J., & Anund, A. (In press). Tunnel Driving and the
Effects of Visual Design. ViP publication. Linköping: the Swedish National
Road and Transport Research Institute (VTI).
Patten, C. J. D., Kircher, A., Östlund, J., Nilsson, L., & Svenson, O. (2006). Driver
experience and cognitive workload in different traffic environments. Accident
Analysis and Prevention, 38, pp. 887-894.
Patten, C., & Mårdh, S. (2012). Förbifart Stockholm Tunnel Utvärdering 2012. VTI
Rapport R759 (in Swedish). Linköping: the Swedish National Road and
Transport Research Institute (VTI).
Rudin-Brown, C. M., Young, K. L., Patten, C., Lenné M. G., & Ceci, R. (2013). Driver
distraction in an unusual environment: Effects of text-messaging in tunnels.
Accident Analysis and Prevention, 50, pp. 122– 129.
Trafikverket. (2011). STA blueprints “FST Plan 2011-11-08”. Borlänge: the Swedish
Transport Administration.
Trafikverket. (2012). Vägar och Gators Utformning (VGU). Publikation 2012:181.
Borlänge: the Swedish Transport Administration (in Swedish).
VTI. (2014). VTI's simulator facilities. www.vti.se/en/research-areas/vehicle-
technology/vtis-driving-simulators/ retrieved 140624.
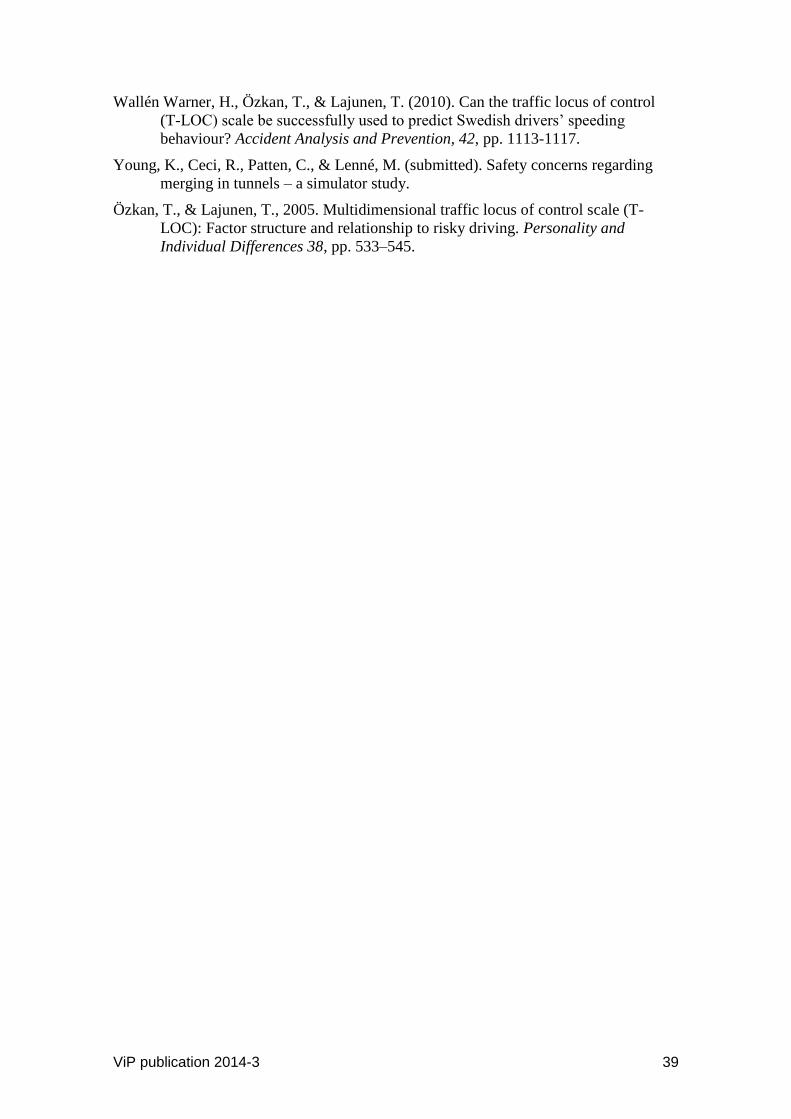
ViP publication 2014-3 39
Wallén Warner, H., Özkan, T., & Lajunen, T. (2010). Can the traffic locus of control
(T-LOC) scale be successfully used to predict Swedish drivers’ speeding
behaviour? Accident Analysis and Prevention, 42, pp. 1113-1117.
Young, K., Ceci, R., Patten, C., & Lenné, M. (submitted). Safety concerns regarding
merging in tunnels – a simulator study.
Özkan, T., & Lajunen, T., 2005. Multidimensional traffic locus of control scale (T-
LOC): Factor structure and relationship to risky driving. Personality and
Individual Differences 38, pp. 533–545.
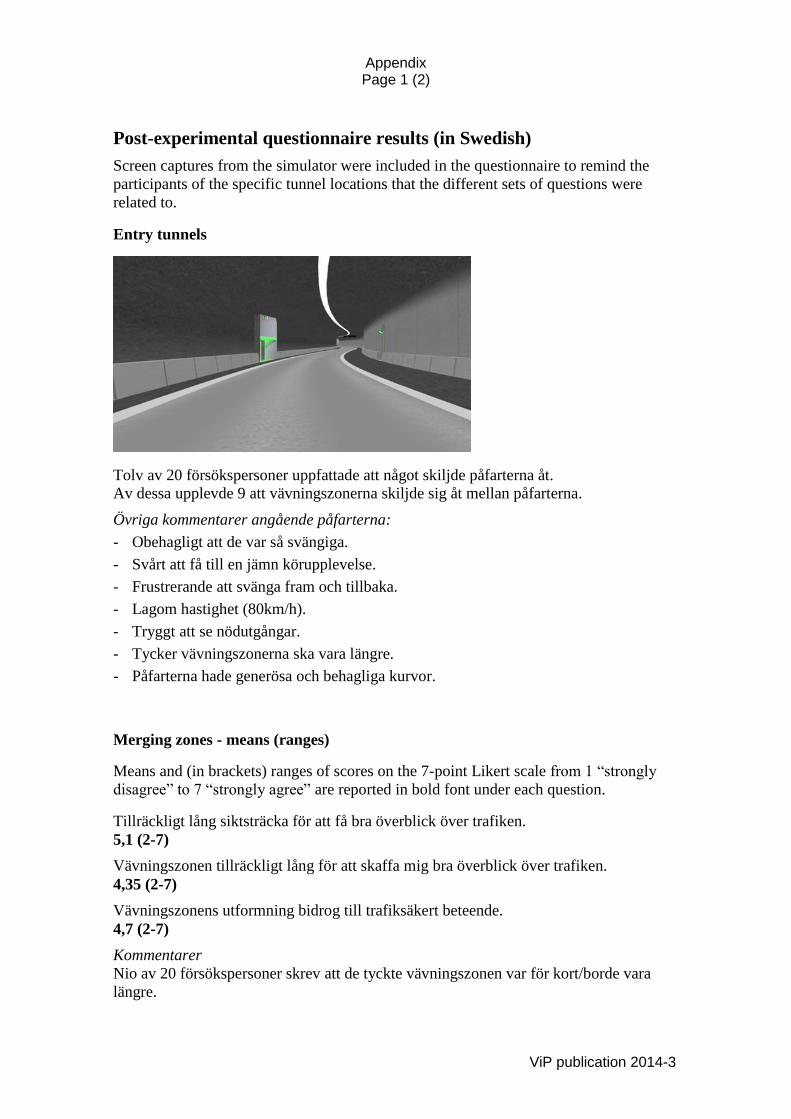
Appendix Page 1 (2)
ViP publication 2014-3
Post-experimental questionnaire results (in Swedish)
Screen captures from the simulator were included in the questionnaire to remind the
participants of the specific tunnel locations that the different sets of questions were
related to.
Entry tunnels
Tolv av 20 försökspersoner uppfattade att något skiljde påfarterna åt.
Av dessa upplevde 9 att vävningszonerna skiljde sig åt mellan påfarterna.
Övriga kommentarer angående påfarterna:
- Obehagligt att de var så svängiga.
- Svårt att få till en jämn körupplevelse.
- Frustrerande att svänga fram och tillbaka.
- Lagom hastighet (80km/h).
- Tryggt att se nödutgångar.
- Tycker vävningszonerna ska vara längre.
- Påfarterna hade generösa och behagliga kurvor.
Merging zones - means (ranges)
Means and (in brackets) ranges of scores on the 7-point Likert scale from 1 “strongly
disagree” to 7 “strongly agree” are reported in bold font under each question.
Tillräckligt lång siktsträcka för att få bra överblick över trafiken.
5,1 (2-7)
Vävningszonen tillräckligt lång för att skaffa mig bra överblick över trafiken.
4,35 (2-7)
Vävningszonens utformning bidrog till trafiksäkert beteende.
4,7 (2-7)
Kommentarer
Nio av 20 försökspersoner skrev att de tyckte vävningszonen var för kort/borde vara
längre.
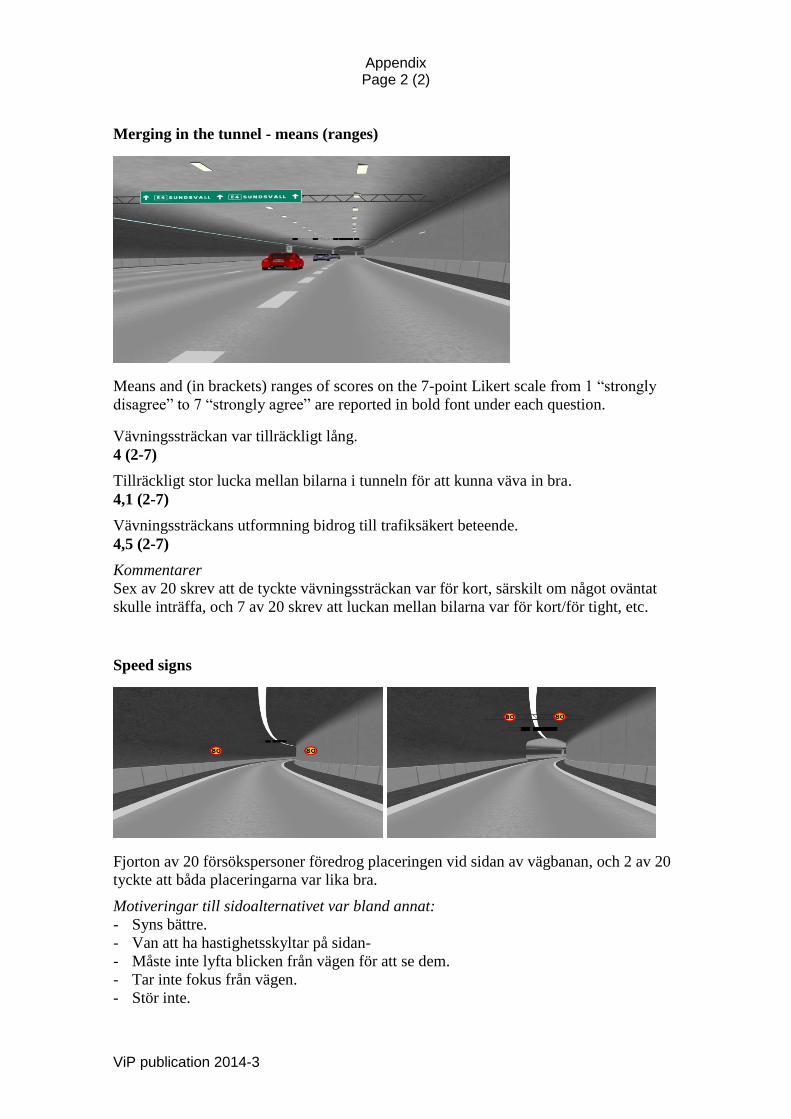
Appendix Page 2 (2)
ViP publication 2014-3
Merging in the tunnel - means (ranges)
Means and (in brackets) ranges of scores on the 7-point Likert scale from 1 “strongly
disagree” to 7 “strongly agree” are reported in bold font under each question.
Vävningssträckan var tillräckligt lång.
4 (2-7)
Tillräckligt stor lucka mellan bilarna i tunneln för att kunna väva in bra.
4,1 (2-7)
Vävningssträckans utformning bidrog till trafiksäkert beteende.
4,5 (2-7)
Kommentarer
Sex av 20 skrev att de tyckte vävningssträckan var för kort, särskilt om något oväntat
skulle inträffa, och 7 av 20 skrev att luckan mellan bilarna var för kort/för tight, etc.
Speed signs
Fjorton av 20 försökspersoner föredrog placeringen vid sidan av vägbanan, och 2 av 20
tyckte att båda placeringarna var lika bra.
Motiveringar till sidoalternativet var bland annat:
- Syns bättre.
- Van att ha hastighetsskyltar på sidan-
- Måste inte lyfta blicken från vägen för att se dem.
- Tar inte fokus från vägen.
- Stör inte.


www.vipsimulation.se
ViPVirtual Prototyping and Assessment by Simulation
ViP is a joint initiative for development and application of driving sim- ulator methodology with a focus on the interaction between humans and technology (driver and vehicle and/or traffic environment). ViP aims at unifying the extended but distributed Swedish competence in the field of transport related real-time simulation by building and using a common simulator platform for extended co-operation, competence development and knowledge transfer. Thereby strengthen Swedish competitiveness and support prospective and efficient (costs, lead times) innovation and product development by enabling to explore and assess future vehicle and infrastructure solutions already today.
Centre of Excellence at VTI funded by Vinnova and ViP partners
VTI, Scania, Volvo Trucks, Volvo Cars, Swedish Transport Administration, Dynagraph, Empir, HiQ, SmartEye, Swedish Road Marking Association
Olaus Magnus väg 35, SE-581 95 Linköping, Sweden – Phone +46 13 204000