stock guide - marketsmith · your returns and stay on top of the market action with ibd’s new...
TRANSCRIPT

2019 Q4
Riding Out Volatility
Stock Guide
Having Steady Hands in a
Shaky Market
Interview: David Saito-
ChungGood Trade/
Bad TradeAsk a Portfolio
Manager

LISTEN ON
Stitcher
Google Podcasts
THE NEW WEEKLY PODCAST
For more info, go to: investors.com/podcast
Sharpen your trading skills, improve your returns and stay on top of the
market action with IBD’s new podcast!
MarketSmith.com 2019 Q4 Stock Guide 3
LISTEN ON
Stitcher
Google Podcasts
THE NEW WEEKLY PODCAST
For more info, go to: investors.com/podcast
Sharpen your trading skills, improve your returns and stay on top of the
market action with IBD’s new podcast!
Stock Guide // 2019 Q4There’s an old saying around the MarketSmith offices: “The trend is your friend.” Trading with the market trend is one of the best ways to improve your investing batting average. But what happens when it feels like the trend changes almost daily? That’s right: vola-tility was back in a big way in Q3. We’re dedicating this issue of Stock Guide to breaking down volatility and asking mar-ket experts how they deal with whipsaw action and hedge against uncertainty. Check out our feature article for some pointers on how to handle volatile con-ditions strategically and psychologically.
For this quarter’s Q&A, we talked to David Saito-Chung, a senior writer and Deputy Markets Editor for Investor’s Business Daily. As a key member of the Markets Team, he’s knee-deep in IBD’s day-to-day stock coverage. That makes him uniquely qualified to speak on re-cent market volatility. David shares how daily news can affect the market in the short- and long-term, and gives his take on where we might be heading in Q4.
In Good Trade / Bad Trade, MarketSmith Senior Product Coach Scott St. Clair opens the books on two of his recent trades. His foray into a gold mining stock paid off when he hedged before earnings and sold into strength. However, he got burned by a big e-Commerce stock when he broke his own rules and bought too many shares too quickly. Scott will break down his buy and sell points and what he learned from each trade.
As always, if you have any questions or comments about your investing research or any MarketSmith features, please call one of our product coaches at (800) 831-2525 or email us at [email protected]. We’re here to help you make more money in the market.
Best Returns, The MarketSmith Team

4 2019 Q4 Stock Guide MarketSmith.com4
Market Chart Nasdaq CompositeN
asda
q Co
mpo
site

MarketSmith.com 2019 Q4 Stock Guide 5
Table of ContentsMarket Chart .......................................................................4
Having Steady Hands in A Shaky Market ...............6
Q&A: David Saito-Chung ............................................10
Stock Screen: Less Volatility, More Profitability* ............................14
Kirkland Lake Gold Ltd (KL) .......................................15
Topbuild Corp (BLD) ...................................................16
Veeva Systems Inc Cl A (VEEV)................................17
Good Trade/Bad Trade: Scott St. Clair .......................18
Stock Screen: Weekend Research Routine* .........................................22
Paylocity Holding Corp (PCTY)) ...............................23
Kinsale Capital Group (KNSL) ...................................24
Paycom Software Inc (PAYC)....................................25
Ask a Portfolio Manager: Mike Webster ....................26
Resources.............................................................................27
Connect With Us.................................................................29
*All screen results are computer-generated and were run on September 30, 2019
page 6
CONNECT WITH US
Having Steady Hands in a
Shaky Market

6 2019 Q4 Stock Guide MarketSmith.com
Feature Article Having Steady Hands in a Shaky Market
Having Steady Hands in a
Shaky MarketThe recent story of the market has been volatility. Massive price
swings in both directions gave investors whiplash. Headline-making
news like tariffs, trade wars and interest rates caused whole indexes
to rise or fall almost in unison. At times like this, it can be difficult to
make smart decisions when your money is on the line.
USE YOUR RULES AND FORGET YOUR FEELINGS.

MarketSmith.com 2019 Q4 Stock Guide 7
Having Steady Hands in a Shaky Market Feature Article
The number one way to keep your portfolio strong during high volatility is to hold fast to your buy and sell rules. William O'Neil’s buy and sell rules are the basis for MarketSmith’s buy/profit/loss zones in Pattern Recognition, so we are big believers in taking profits at 20-25% and cutting losses at 7-8%.
Aside from using clear buy/sell rules, here are four more ways to fight back when volatility rears its head.
1. WATCH FOR OUTLOOK CHANGES Buy and sell rules cover individual stock trades during uptrends, but what about when the market is highly volatile? Re-member, three out of every four stocks follow the overall trend of the market. If high volatility drags the market into a correction, all the fundamental strength in the world won’t protect your portfolio.
One solution? Check the market outlook in MarketSmith every day and focus your buying during a Confirmed Uptrend. You can find the current market outlook under the “Market Snapshot” box on the main member page. There are three
possible outlooks: Confirmed Uptrend, Uptrend Under Pressure and Market in Correction.
During periods of high volatility like we saw in Q3, a growing number of dis-tribution days in the market will often force the market outlook to Uptrend Under Pressure or Market in Correction. These trend changes are warning signs that you probably want to modify your sell rules and either start taking profits off the board before 20-25% or set your stop-losses tighter (think 3-4% in a cor-rection vs. the standard 7-8%).
What if the market is in an Uptrend Under Pressure with high volatility and you’re not sure which way the market is going to trend? First of all, don’t force a trade at times like this. You may like a stock, but you can always wait to buy it until the market stabilizes. Remember: cash is a position—and a good one when stocks are getting hit.
2. KEEP YOUR EMOTIONS IN CHECK What do emotions have to do with investing? The market doesn’t have feel-ings, and neither do the big institutions that drive the market. But retail investors are real people who can feel emotions and act irrationally when their money is on the line.

8 2019 Q4 Stock Guide MarketSmith.com
Feature Article Having Steady Hands in a Shaky Market
Four big emotions can get in the way of good investing decisions. It’s especially crucial to keep these emotions in check when volatility is giving your portfolio sudden gains and losses that feel out of your control. Don’t invest with your heart; invest with your head by recognizing and controlling these four emotions.
FEAR and GREED work together to drive bad buy and sell decisions. You’re afraid of missing out on a big run, so you buy a stock too early or too late. Or you’re feeling greedy and want 100% gains on every trade, only to end up roundtripping a nice 25% gain back to zero.
PRIDE can lead you to rationalize losses on bad trades by telling yourself that you were right, and everyone else was wrong. You’ll never learn from mistakes that way.
HOPE can make you hold on to “pet stocks” that you should have sold. You can pull down your entire portfolio by trying to “hope” a stock back up.
3. TRACK PSYCHOLOGICAL INDICATORS Psychological market indicators are important to watch during high-volatility
market conditions. They can give you early insights into when the market is nearing a top or a bottom. With this knowledge, you can tune out some of the day-to-day volatility and keep your focus on long-term trends.
You can find MarketSmith’s Psycholog-ical Indicators from the chart interface. Just pull up an index like the Nasdaq (0NDQC) or S&P 500 (0S&P5) then open the Related Information panel at the right. Select the “Climate” button to see a partial list of Psychological Indicators underneath a calendar of upcoming events that could affect market volatility.
Three important indicators to watch are:
• CBOE Market Volatility Index, commonly called the VIX or “Fear Index.” When fear rules Wall Street, volatility surges in the stock market, which is typically the time the major indexes will hit bottom and rally higher.
• NYSE Short Interest Ratio is the ratio of all short interest on the NYSE exchange divided by the average daily volume. As it
For more about controlling fear, greed, hope and pride, check out Scott O’Neil’s videos on investor psychology at investors.com/MStutorial.

MarketSmith.com 2019 Q4 Stock Guide 9
Having Steady Hands in a Shaky Market Feature Article
increases, more investors are taking short positions and betting on bearish trends continuing. However, when this ratio nears extreme levels it can be used as a contrarian indicator.
• Ratio of price premiums in puts vs. calls tracks the relative interest in bearish and bullish options contracts. When investors are looking to profit from a bearish market they flock to buying put options, which increases the premium paid. When this ratio spikes (for example, to a 5-year high late December 2018), a market bottom and subsequent rebound may be coming soon (see January 2019).
For an in-depth look at more psycho-logical indicators, watch our webinar at investors.com/psychwebinar.
4. CALL A COACH Don’t forget, MarketSmith Coaches are here to help! If you’re unsure about your next move in a volatile market, give a coach a call at 800-831-2525.
MarketSmith Coach Arnie Gutierrez hears from MarketSmith customers all the time asking how to deal with volatile markets. His advice? “First of all, look at weekly charts instead of daily charts. Weekly charts provide a clearer picture of the stock’s trend. From a psycholog-ical standpoint, it’ll help maintain your conviction and not get scared out.
“Second, be more cautious when build-ing a position. If a stock breaks out and you love the story, initiate a position but be quicker to cut losses. Tight stop-loss-es can save you a lot of money when the overall market suddenly moves against you.” n
s Pictured: The expanded Psychological Indicators window in MarketSmith.

10 2019 Q4 Stock Guide MarketSmith.com
A CONVERSATION WITH
Q & A A Conversation with David Saito-Chung
David Saito-Chung is a senior writer and Deputy Markets Editor for Investor’s Business Daily®. He helps oversee IBD’s day-to-day stock coverage, including Leaderboard®, The Big Picture, The Short Side, IPO Leaders, Inside IBD® 50, Inside IBD® Big Cap 20, The Income Investor and Investor’s Corner.
MarketSmith recently sat down with David to talk about volatility, hedging strategies and how he avoids overreact-ing to the latest news.
Market volatility was a big story in the third quarter of 2019. Do you see this trend continuing into Q4? David Saito-Chung: Personally, yes! We have numerous issues that keep large investors engaged in equity prices. The slowdown in the U.S. economy. The ratcheting up in tariffs on imports be-tween the U.S. and China. A big year for gold and silver. A new round of monetary easing by the Federal Reserve. Clearly, the third quarter has reflected these con-cerns as well as a time-honored tradition on Wall Street: taking some profits off the table.
Yet volatility can be a growth investor’s friend. History has shown that the U.S. stock market has made important
bottoms often in the October to Decem-ber period. In IBD parlance, we call it a Follow-Through Day.
Follow-Through Days signal that a potential new uptrend in stock prices is underway. Good Follow-Throughs should be accompanied by high-growth companies that break out of good bases to new highs.
Actually, I think 2019 has so far been relatively tame. 2017 was so calm on a day-to-day basis that the action in the fourth quarter of 2018 and in the months of May, July and August this year feel highly volatile. But we’ve seen nothing like what we witnessed during major bear markets such as 2000-2002 and 2008 to early 2009.
David Saito-Chung

MarketSmith.com 2019 Q4 Stock Guide 11
A Conversation with David Saito-Chung Q & A
How do you handle volatile market environments? If you’re serious about trading stocks, you should treat your portfolio like a sports car that can shift gears. In a nice car, you don’t go immediately into the high gears without rising through the lower gears. In a stock portfolio, stocks are like those gears. At the start of a new market uptrend, it’s critical to at least have one or two stocks. That’s like putting your account into first gear.
If the stocks act right, you’re logging profits. Then it may be time to shift into higher gear – especially when the current market outlook squarely says, “Confirmed Uptrend.”
But when the uptrend is under pressure, it’s also smart to downshift gears. Raise some cash, even as much as 50% to 75% of your active portfolio, when a new uptrend is sputtering or the market has rallied a lot and is wavering.
The more stocks you own, the more you must consider how much to allocate into each stock. Even in large portfolios, it makes sense to focus on around six, eight or 10 names. Bill O’Neil always liked to say, “It’s not enough to be right. When you’re right, you want to be right big.”
Are there any hedging plays investors can use when they’re uncertain about the market? When you’re not confident about the current market conditions, this four-let-ter word gives your portfolio a fantastic hedge: C-A-S-H.
In a whipsawing market, it’s actually easy to lose both on the long side and the short side.
When the market rises 1% one day, falls 2% the next day, then rebounds 2.5% the very next session, how often can you be right about the direction of the market each day? In a world where the wealth of markets can swing high and low on a tweet or two, cash can be a great antidote against painful trades. It’s far better to sit on the sidelines and wait and watch.
Watch for great stocks – in terms of fundamentals (earnings, sales, margins, ROE, low debt, a great product, and su-perior management), stock price relative strength and rising institutional owner-ship. Use those to make your watchlist.
If you follow solid sell rules that are based on the actual stock’s price-and-volume action, then you can hedge against one of

12 2019 Q4 Stock Guide MarketSmith.com
Q & A A Conversation with David Saito-Chung
the worst things that can happen to you in stocks – a respectable gain disappears into oblivion. Never allow a roundtrip of your hard-earned gains.
Whether it’s the Fed, trade wars or Brexit, we’ve seen an increase in news stories driving big market moves. How much should investors pay attention to the headlines? I think they should pay a lot of attention because there are big themes that are impacting markets perhaps more than in other years. Look at early 2009: every headline was negative. People wondered how long the recession would last, if Wall Street would ever be the same and so on. But the market was determined to rally. Look at the big moves by leading stocks—
that was the real news in my view. Later on after 2009 became a good year, there were fresh concerns about the EU, Greece and other economic issues. Those pieces of news certainly impacted the market.
We’re seeing the same thing this year: concerns about how much growth will slow, and whether we’ll actually go through a recession. So I would say headlines are a big deal right now, in addition to what the markets themselves are telling you.
I would say the biggest piece of news from the last few months was the Follow-Through Day on August 13 which we covered in The Big Picture column at Investors.com that day. But going
Quotes delayed 20 minutes. Ownership and Estimate data provided by Thomson Reuters. © 2019 MarketSmith, Incorporated. 10.02.2019
$20.34 +1.78 +9.59%N/ACboe Volatility S&P 500 (0VIX) Average Daily Volume 0
10
15
20
25
30
35
40
Inde xScale
NovOctSepAugJulJunMayAprMarFebJanDecNovOctSepAugJulJunMayAprMar08251127133016021905210724102612291501150118042107230926122814311703200622082511271330160216
13.31
24.81
11.6912.04
16.68
19.75
11.03
12.37
23.81
16.09
27.86
28.84
15.63
16.86
10.17
11.44
19.61
11.22
18.78
26.01
15.51
14.42
23.38
17.8518.33
36.20
15.94
11.1010.91
14.57
13.31
26.22
RS
S&P 500
s Pictured: The CBOE Volatility Index (0VIX in MarketSmith), which tracks market volatility. Compared to the large spike in December 2018, much of 2019 has been relatively tame.

MarketSmith.com 2019 Q4 Stock Guide 13
A Conversation with David Saito-Chung Q & A
forward, what will sustain this rally? In a few months we’re going to go through a fresh wave of earnings results, but before that it’s really going to be the deci-sions of the leaders of US and China, the leaders of EU and Britain, and comments from the Federal Reserve. Are we going to see any evidence of a pickup in the economy or inflation? Those things are really important.
I think two of the most important eco-nomic statistics to watch are the monthly ISM surveys and the monthly U.S. jobs report. The July ISM report was positive: it showed that the services side of our economy is growing. That’s a very bullish overall indicator. But the index for August and September signaled that manufactur-ing activity in the U.S. is now in decline.
The other big one is the U.S. jobs report on the first Friday of every month. Any big changes, whether it’s growth or shrinkage in payrolls, will sway markets in my view.
One more thing: word around the office is that you’re a pretty good golfer. Do you see any parallels between golf and investing? Oh sure. They’re both difficult endeavors that require rules, training… and maybe some luck from time to time. The key to both is having a strong game plan.
Jack Nicklaus once said that one of his keys to being a great golfer is course management: not how hard or how accurately you swing, but how you ap-proach a certain hole. Do you get aggres-sive here or do you lay up, meaning you try to land the ball in front of the green so you avoid the various traps, sand or water, surround ing it.
That kind of mental attitude is really important for the stock market too. If you sense danger, maybe you don’t want to be “all in” with your positions. Maybe instead of four positions you have one or two, and you make them half the size you would at the beginning of a new bull market.
Quick golf story: One of my weaknesses was always chipping and putting, where you can lose a lot of strokes really quickly. So I decided to work on that really hard. I set my own rules on how to hit these shots, how to make certain kinds of putts. I had a protocol. Results eventually came. At the Penmar By The Sea nine-hole course in Santa Monica, I shaved an aver-age two to three strokes off my card! For investing, post-analysis is key to improv-ing your performance in the market. Look at your weaknesses, work on them and never stop improving. n

14 2019 Q4 Stock Guide MarketSmith.com
Stock Screen: Less Volatility, More Profitability
Find stocks that can deliver outperformance with reasonable price volatility.
David Chung’s screen looks for stocks with heavy dollar volume, a solid earnings track record and enviable relative strength. Combined with a current share price within 15% of a 52-week high, these stocks are less likely to experience huge swings due to the buying and selling pressures of a few institutions.
Less Volatility, More Profitability
Visit Investors.com/MSStockGuide to load the criteria for this and other Stock Guide screens directly in to your MarketSmith screener.
*All screen results are computer-generated and were run on September 30, 2019. This screen can also be found on marketsmith.com in shared screens.
Screen created by David Saito-Chung, IBD Deputy Markets Editor
COMPANY (SYMBOL) INDUSTRY GROUP RS RATING
Kirkland Lake Gold Ltd (KL) Mining-Gold/Silver/Gems 98
Topbuild Corp (BLD) Bldg-Constr Prds/Misc 98
Veeva Systems Inc Cl A (VEEV) Computer Sftwr-Medical 93
Capital City Bk Gp (CCBG) Banks-Southeast 87
Firstservice Corporation (FSV) Real Estate Dvlpmt/Ops 90
Twitter Inc (TWTR) Internet-Content 93
T-Mobile U.S. Inc (TMUS) Telecom Svcs-Wireless 82
JD.com Inc Cl A Ads (JD) Retail-Internet 71

MarketSmith.com 2019 Q4 Stock Guide 1515
Kirk
land
Lak
e G
old
Ltd
(KL)
Less Volatility, More Profitability Stock Screen

16 2019 Q4 Stock Guide MarketSmith.com16
Stock Screen Less Volatility, More ProfitabilityTo
pbui
ld C
orp
(BLD
)

MarketSmith.com 2019 Q4 Stock Guide 1717
Less Volatility, More Profitability Stock ScreenVe
eva
Syst
ems
Inc
Cl A
(VEE
V)

18 2019 Q4 Stock Guide MarketSmith.com
Good Trade/Bad Trade Scott St. Clair
In this edition of Good Trade / Bad Trade, MarketSmith Coach Scott St. Clair shared a couple of his recent trades—one winner and one loser—and told us what he learned from each. Pull up the charts for KL and BABA and follow along to see how you would have handled these trades!
GOOD TRADE: KIRKLAND LAKE GOLD (KL)
The Timeframe: May 2019 – August 2019
Stock Background: KL was always coming up on my custom MarketSmith screens around May 2019. They had great sales and earnings, plus 98s and 99s in almost all the IBD proprietary ratings. I wanted exposure to a gold stock, and this was by far the best in that space. Gold was looking very attractive as the market began to get skittish and favor more defensive plays. Even when gold wasn’t doing well, this stock was behaving well.
Around May, I saw that Fidelity Contra-fund (FCNTX) had increased its posi-tion in the stock from the most recent quarter. I’m a big believer in Will Danoff (the fund manager) and his approach, so when I see FCNTX buying a stock and even adding more, that tells me that this is a stock worth watching closely.
Technical Picture: I wanted to get in early on this stock based on the great fundamentals. MarketSmith Pattern Recognition showed the base as a consolidation, but it looked like a cup-with-handle to me. Rather than wait for a traditional buy point of 36.84, I decided I would buy when it broke through resis-tance at the 50-day moving average. But with that strategy, I usually make smaller, exploratory buys and build a position incrementally.
My Buy Point: May 30, 2019 at 32.20. I bought KL while it was still in the base when it broke through the 50-day line, but only a small position. I added more shares on the following days as it crept toward a breakout. My last add-on buy was at 35.15. KL kept behaving well, and I kept feeding it.
THE TRADER
Scott St. ClairMarketSmith Coach
Good Trade/Bad Trade

MarketSmith.com 2019 Q4 Stock Guide 19
Scott St. Clair Good Trade/Bad Trade
How I Held It: This one was easy to hold at first. I reduced my posi-tion going into earnings because I was up over 30% and earnings can be unpredictable. Sure enough, the next day KL plunged almost 10% on earnings, but it held above the 50-day line. A week later it was at a new high, so I felt like I had weath-ered the earnings storm. KL tested the 50-day line a second time on Aug. 19, bouncing back up again. I was worried that if it tested the 50-day line for a third time it would no longer find support there, so I prepared to close the position.
My Sell Point: August 23, 2019 at 47. I closed out because I like to lock in the profits while I have them and move on to another opportunity. I am not good at sitting through bases, so I tend to sell into strength with most of my trades.
My 3 Takeaways:
• You can buy probing positions before the traditional buy point. You might have to try it 2 or 3 times before it works. The key is cutting losses quickly if it doesn’t work.
• If you’re heavily concentrated, don’t hold the full position the entire time. My portfolio was heavily weighted in favor of KL, which is why I took some profits off before earnings. Can you withstand a quick 10% drop and sleep at night? If the answer is no, you’re overly concentrated and need to sell some.
• When you’re deep in a stock, you have to remember to let it run. After you’ve been in it 10 days, it feels like 3 months. To get a big win, you have to give it some time and not follow the volatility like life and death.
Real-time prices by Nasdaq Last Sale. Real-time quote and/or trade prices are not sourced from all markets. Ownership and Estimate data provided Thomson Reuters. [email protected] © 2019 MarketSmith, Incorporated. 10.01.2019
$44.94 +0.14 +0.31%Volume 1,349,200 -16%Kirkland Lake Gold Ltd (KL) NYSE Mining-Gold/Silver/Gems Average Daily Volume 1,613,100
15
20
25
30
35
40
45
50
PriceScale
550,000
1,300,000
3,050,000
7,200,000
Volume
NovOctSepAugJulJunMayAprMarFebJanDecNovOctSepAugJulJunMayAprMar08251127133016021905210724102612291501150118042107230926122814311703200622082511271330160216
51.08
40.50
29.15
36.74
24.69
18.12
23.86
20.93
14.56
16.33
42.2942.20
49.13
47.21
40.05
44.04
31.34
35.20
30.57
32.25
22.34
18.2317.26
23.33
19.83
15.80
13.09
3.6M2.7M
1.8M
2.6M
17.0M
2.7M2.2M
1.9M
2.9M3.7M
3.0M2.6M3.6M
1.9M1.7M
1.0M
2.6M
RS Rating
S&P 500
+22% from Pivot in 8 4 days
Reduced position before earnings
Closed PositionSell Point: 47.00
Add-on:35.15
Buy Point:32.20

20 2019 Q4 Stock Guide MarketSmith.com
BAD TRADE: ALIBABA (BABA)
The Time Frame: May 2019
Stock Background: In 2017, BABA was one of my biggest winners. I had a soft spot for the stock because of that. But it’s not just a pet stock of mine; Alibaba is like the megacap love child of Ama-zon (AMZN) and eBay (EBAY) in the Chinese market.
Alibaba sells everything, from goods to services, to the largest population in the world. It created (and later spun off) the mobile payment service Alipay, which is fast eclipsing hard currency as the payment method of choice across China. It owns Taobao, which is like eBay on ste-roids for the Chinese market. One more point: Alibaba surpassed Walmart (WMT) as the largest retailer in the world!
Technical Picture: BABA was coming out of a very long cup-with-handle base that started in June 2018. Looking back on it now, it was a flawed base: very choppy with lots of volume spikes and large closing ranges. That’s the opposite
of what you want in a base: tight closing ranges and low volume. On top of that, the Relative Strength line wasn’t near a new high; it was lagging with an RS Rating in the 60-70 range.
My Buy Point: May 2, 2019 at 188.46. And 189. And 190.52. And 190.96. Yes, all four of those buys were all on the same day, and all the same size: 100 shares each. I got overexcited because the stock was acting nicely. I added another 100 shares the next day at 195 because it was closing near the high of the range. My average cost shot up to around 191. My portfolio was now highly concentrated in BABA. I’m up only 2.5% at that point, which is a very small cush-ion for a heavy position.
How I Held It: BABA gapped down the very next trading day, May 6, to close at 188.24. So I’m already down on a big position, but I wanted to give it more time to see if it would rebound. I wouldn’t have to wait long for the answer.
My Sell Point: May 7, 2019 at 180.52. I lost 5% almost immediately and had to cut my losses; I was too deep in BABA and my average cost was too high. I
Good Trade/Bad Trade Scott St. Clair
"Yes, all four of those buys were all on the same day, and all the same size: 100 shares each. I got overexcited."

MarketSmith.com 2019 Q4 Stock Guide 21
couldn’t tolerate any further losses in a position this large. I tried to give it time after the gap down day and it cost me even more. And this all happened over five days! As Ferris Bueller said, “Life moves pretty fast.”
My 3 Takeaways:
• Adding to a position is fine, but I didn’t do it correctly. I added the same number of shares every time, which is not the correct way to pyramid into a position.
• I should have bought at 50% of a full position at 188, another 30% at 192, and then never got to a third buy to
build a full position. I would have ended up with around 200 shares instead of 500, a lower average cost and a much smaller overall loss when the trade went against me.
• Even though this trade turned out to be a small loss percentage-wise, it hurt my overall portfolio because I built up too heavy a concentration too quickly. n
Real-time prices by Nasdaq Last Sale. Real-time quote and/or trade prices are not sourced from all markets. Ownership and Estimate data provided Thomson Reuters. [email protected] © 2019 MarketSmith, Incorporated. 05.31.2019
$149.26 -1.81 -1.20%Volume 26,881,200 +60%Alibaba Group Hldg Ads (BABA) NYSE Retail-Internet Average Daily Volume 15,531,000
130
140
150
160
170
180
190
200
210
PriceScale
10,700,000
17,700,000
29,100,000
47,900,000
Volume
JulJunMayAprMarFebJanDecNovOctSepAugJulJunMayAprMarFebJanDecNov12281431170319052208220825112814301602190521072410271329150118042006230923092612291501170320
195.72
189.79
174.10
168.80
130.06
135.14
152.85
198.35
181.06
192.80
201.50
195.15
168.88
206.20
179.32
192.49
168.58
184.70
171.56
188.08
173.09
129.77
169.84
186.50
165.39
195.13
211.70
166.64166.13
175.45
164.25
191.75191.22
22.8M
37.0M35.1M
47.0M57.8M
33.6M41.4M
26.8M28.8M
55.8M
78.8M
32.8M
52.6M
41.2M
RS Rating
S&P 500
-21% from Pivot in 34 days
Buy Points:188.46, 189,
190.52, 190.96Add-on: 191.00
Sell point:180.52
Scott St. Clair Good Trade/Bad Trade
22 2019 Q4 Stock Guide MarketSmith.com
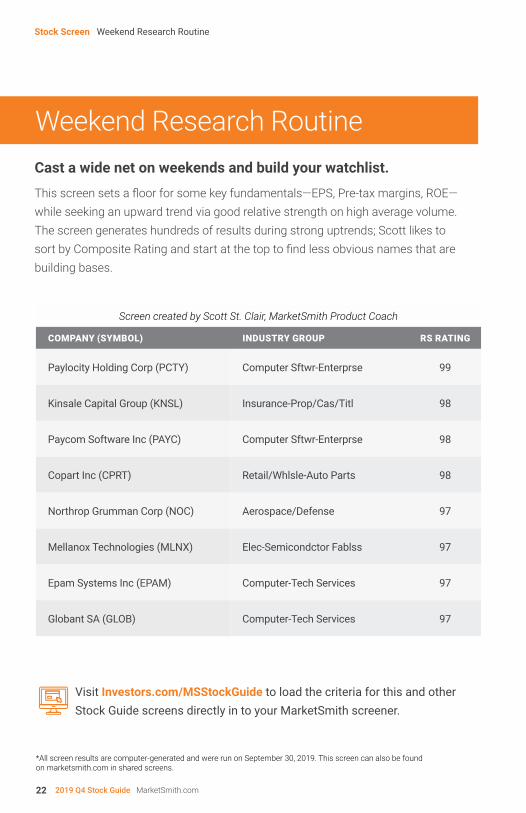
Visit Investors.com/MSStockGuide to load the criteria for this and other Stock Guide screens directly in to your MarketSmith screener.
*All screen results are computer-generated and were run on September 30, 2019. This screen can also be found on marketsmith.com in shared screens.
Cast a wide net on weekends and build your watchlist.
This screen sets a floor for some key fundamentals—EPS, Pre-tax margins, ROE—while seeking an upward trend via good relative strength on high average volume. The screen generates hundreds of results during strong uptrends; Scott likes to sort by Composite Rating and start at the top to find less obvious names that are building bases.
Weekend Research Routine
Stock Screen Weekend Research Routine
Screen created by Scott St. Clair, MarketSmith Product Coach
COMPANY (SYMBOL) INDUSTRY GROUP RS RATING
Paylocity Holding Corp (PCTY) Computer Sftwr-Enterprse 99
Kinsale Capital Group (KNSL) Insurance-Prop/Cas/Titl 98
Paycom Software Inc (PAYC) Computer Sftwr-Enterprse 98
Copart Inc (CPRT) Retail/Whlsle-Auto Parts 98
Northrop Grumman Corp (NOC) Aerospace/Defense 97
Mellanox Technologies (MLNX) Elec-Semicondctor Fablss 97
Epam Systems Inc (EPAM) Computer-Tech Services 97
Globant SA (GLOB) Computer-Tech Services 97

MarketSmith.com 2019 Q4 Stock Guide 2323
Weekend Research Routine Stock ScreenPa
yloc
ity H
oldi
ng C
orp
(PCT
Y)

24 2019 Q4 Stock Guide MarketSmith.com24
Stock Screen Weekend Research RoutineKi
nsal
e Ca
pita
l Gro
up (K
NSL
)

MarketSmith.com 2019 Q4 Stock Guide 2525
Weekend Research Routine Stock ScreenPa
ycom
Sof
twar
e In
c (P
AYC)

26 2019 Q4 Stock Guide MarketSmith.com
Ask a Portfolio Manager Mike Webster
Mike Webster is a Senior Vice President and Portfolio Manager at O’Neil Capital Management. A protégé of William O'Neil, he has worked on projects as varied as the 4th Edition of How to Make Money in Stocks and the development of Mar-ketSmith’s Pattern Recognition algorithm.
Keeping with this issue’s theme, we asked Mike about news events and market volatility.
Stock Guide: This year, the market seems more responsive to news (e.g. Fed rates, trade wars) than usual. Do you see this trend continuing through the end of 2019?
Mike Webster: The market always reacts to news. It always has and always will, but I do agree that this year feels extreme. Be-sides the concern about what the Fed is going to do, now it’s about what Chairman Powell is going to say. He really hasn’t learned how to communicate properly with Wall Street, in my opinion.
I don’t see an end in sight for the trade conflict to be completely resolved. Most likely this will drag on like a short version
of the Cold War, which is fine—once the market is able to figure out how to price that in. The market can handle negative news, but right now it feels like we are all on edge because it’s hard to quantify the impacts of the trade war. And then you’ve got negative interest rates throughout the world, conflict in Hong Kong, the inversion on the yield curve, fears of recession, the 2020 elections and the latest worries about Impeachment.
Paying attention to the news is fun and interesting, but when it comes to trading, try to just follow what the market is telling you. The news is always terrible near market lows. Try to keep it simple: are we above our 21-day Exponential Moving Av-erage? Are we trending higher? If so, look for stocks to buy; if not, stay defensive. n
Ask a Portfolio Manager
Have a question for a professional portfolio manager? Email us at [email protected] and we might include your question in a future issue!

MarketSmith.com 2019 Q4 Stock Guide 27
RESOURCES
The Stock Ideas Button Resources
Where do you look for trade ideas when the market is behaving unpredictably? Start with the “Open Stock Ideas” button in the MarketSmith chart interface! This bright orange button is a shortcut to some of our most popular stock lists, which are sorted into 3 tabs: Uptrend, Correction and Earnings.
The Uptrend tab features stock lists like Breaking Out Today and Near Pivot that show you actionable stock ideas from
the Growth 250, which means you’re already starting with the fundamentally strongest stocks in our entire database. Although it’s generally riskier to buy in a correction, the Correction tab has lists of stocks that are outperforming the cur-rent market. You can further sort these lists by Daily Review or Weekly Review.
The Stock Ideas Button

28 2019 Q4 Stock Guide MarketSmith.com
Resources The Member Home Page
We recently redesigned the member home page for MarketSmith to give you a market update as soon as you log in. When you go to marketsmith.investors.com, you’ll be greeted with real-time price and volume action for the topline indexes. Below that, you’ll see the current market trend, quick shortcuts to stock lists like Breaking Out Today, and the latest episode of our weekly webinar, Take on the Market.
What else is new on the redesigned member page? We’ve added a 1-2-3 educational section that includes links to the MarketSmith University video series, as well as a recent/upcoming webinar section and the latest issue of the Mar-ketSmith Stock Guide.
The Member Home Page has a new look!
RESOURCES

MarketSmith.com 2019 Q4 Stock Guide 29
Connect With Us
Follow us for exclusive offers, giveaways and stock investing tips.
CONNECT WITH US
Get actionable investing content, unique financial stories and live videos with market updates on our Facebook page. ________________________________________________________________
Get real-time updates on the stock market throughout the day on Twitter. Tweet us @MarketSmith with your thoughts on the market. ________________________________________________________________
IBD’s StockTwits allows you to connect with other stock traders to get tips on growing your portfolio. ________________________________________________________________
Reach out and network with the IBD® and MarketSmith® teams on LinkedIn to get in-depth investing knowledge. ________________________________________________________________
Check out Friday’s video market update for our take on the market action in the week that was. Plus, you’ll find timely tips for your stock research routine. ________________________________________________________________
Our Instagram gives you a behind-the-scenes look at how the IBD® and MarketSmith® teams work to help you succeed in the market.

Copyright © 2019 Investor’s Business Daily, Inc., Investor’s Business Daily, IBD, CAN SLIM, and corresponding logos are registered trademarks owned by Investor’s Business Daily, Inc. MarketSmith is a registered trademark of MarketSmith, Incorporated.
The material contained herein is not to be reproduced, redistributed, published, stored in a retrieval system, or transmitted in any form or by any means, electronic mechanical, photocopying, recording, or otherwise, without prior written permission of Investor’s Business Daily, Inc. and MarketSmith Incorporated.
Data provided under license agreement by William O’Neil + Co. Incorporated. All material presented here has been obtained or derived from sources believed to be accurate, but Investor’s Business Daily, Inc., MarketSmith Inc., and William O’Neil + Company, Inc. do not guarantee its accuracy and it may possibly be incomplete and/or condensed. The contents are based on the study and interpretation of available data as it relates to our historical models of the best performing stocks. This is not a prospectus; no effort on our part with respect to sale or purchase of any securities is intended or implied. Any chart appearing in this material is for educational purposes and is not, and should not be construed as a recommendation or rating to buy or sell any security. It is possible that at this date or some subsequent date the officers, directors and/or shareholders of William O’Neil + Company, Inc., MarketSmith Inc. and Investor’s Business Daily, Inc. and their affiliates own securities or buy or sell securities listed in the following pages or those not mentioned.
Standard & Poor’s US Index Data
Copyright © 2019, Standard & Poor’s Financial Services LLC (“S&P”). Reproduction of S&P US Index Data in any form is prohibited except with the prior written permission of S&P. Because of the possibility of human or mechanical error by S&P’s sources, S&P or others, S&P does not guarantee the accuracy, adequacy, completeness, timeliness or availability of any information and is not responsible for any errors or omissions or for the results obtained from the use of such information. S&P GIVES NO EXPRESS OR IMPLIED WARRANTIES, INCLUDING, BUT NOT LIMITED TO, ANY WARRANTIES OF MERCHANTABILITY OR FITNESS FOR A PARTICULAR PURPOSE OR USE. In no event shall S&P or its affiliates be liable for any indirect, special or consequential damages in connection with subscriber’s or others’ use of S&P US Index Data. (2012)

Whether you have a question about earnings season or you just want some perspective on recent market action, our Product Coaches are here for you. Best of all, this service is free with your MarketSmith subscription! Here are a few investing-related topics you can call us about today:
Call us today and talk to a MarketSmith® Product Coach!
• Building a better research routine• Finding stocks that fit your investing style• Identifying buy and sell points• Gauging supply and demand via volume
GOTINVESTING QUESTIONS?
LET’S TALK INVESTING. CALL (800) 831-2525

1265
5 Be
atric
e St
reet
Los
Ange
les,
CA
9006
6
CON
NEC
T W
ITH
US
STO
CK
GU
IDE
// 2
019
Q4
Ridi
ng O
ut
Vola
tility