stn/improve comparison study preliminary results paul solomon, ord tracy klamser-williams, oria...
TRANSCRIPT

STN/IMPROVE Comparison StudyPreliminary Results
Paul Solomon, ORDTracy Klamser-Williams, ORIA
Peter Egeghy, ORDDennis Crumpler, OAQPS
Joann Rice, OAQPSOthers
PM Model Performance Workshop
February 10, 2004

2
Discussion Topics
Study Background
STN and IMPROVE Protocol Differences
Preliminary STN versus IMPROVE Data Comparison Results and Conclusions
Next Steps

3
STN/IMPROVE Intercomparison
Why did we do this study? To establish data comparison
and relationships for historical data
Collecting data since fall ’01 3 areas (1 urban/rural pair)Presenting Analysis of Oct ’01 to Sept ’02 dataFinishing QA of first year dataFinal results early ’04
4
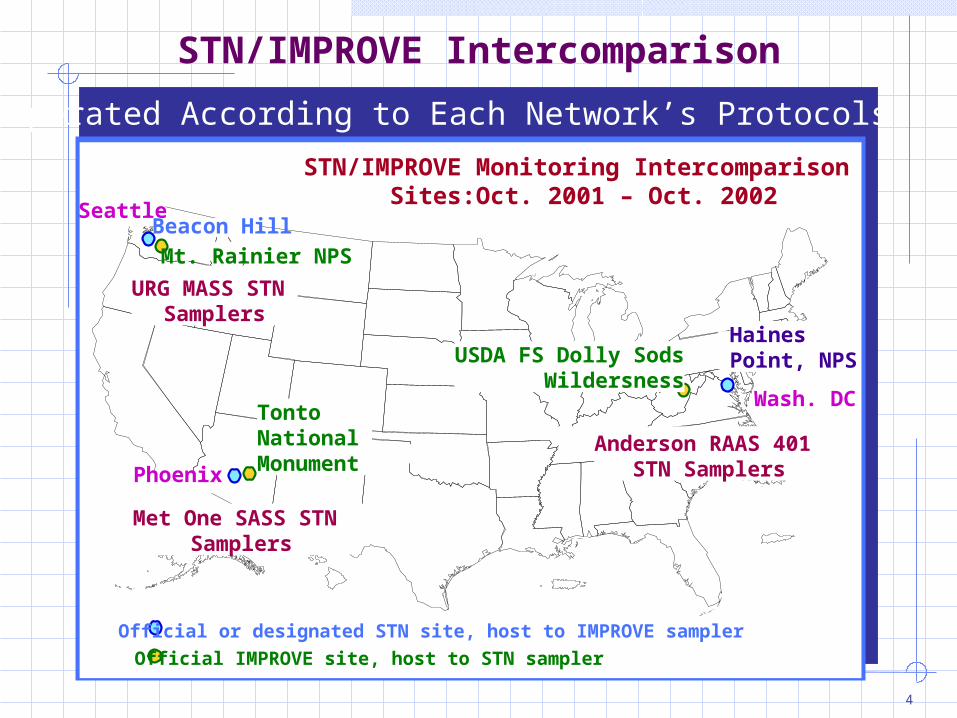
STN/IMPROVE Monitoring Intercomparison Sites:Oct. 2001 – Oct. 2002
Mt. Rainier NPS
Phoenix
TontoNational Monument
Haines Point, NPS
Wash. DC
Official or designated STN site, host to IMPROVE sampler
Official IMPROVE site, host to STN sampler
Anderson RAAS 401 STN Samplers
Met One SASS STN Samplers
URG MASS STN Samplers
SeattleBeacon Hill
USDA FS Dolly SodsWildersness
Operated According to Each Network’s Protocols
STN/IMPROVE Intercomparison

5
It is Not Just the Analysis Methods
From Monitor Inlet* to Data Mgmt Sample Collection Handling, Shipping, and Storage (after collection) Chemical Analysis
Extraction Analysis Methods
Standards Or Lack Thereof for Ambient Field PM Measurements
Data Manipulation Blank Subtraction and Artifacts
Comparative Protocol Analysis
* Begins w/ Filter Purchase, Acceptance Testing, Handling & Storage

6
How Protocols Might Affect Results
Between Networks * Inlets
Effect on Slope of Efficiency Curve and Cutpoint
Flow Rate Differences Effect of Pressure Drop, Face Velocity
and Residence Time Influences Collection of Semi-Volatiles
Negative vs Positive Artifacts Blank Values Likely Different
* Not an Exhaustive List
7
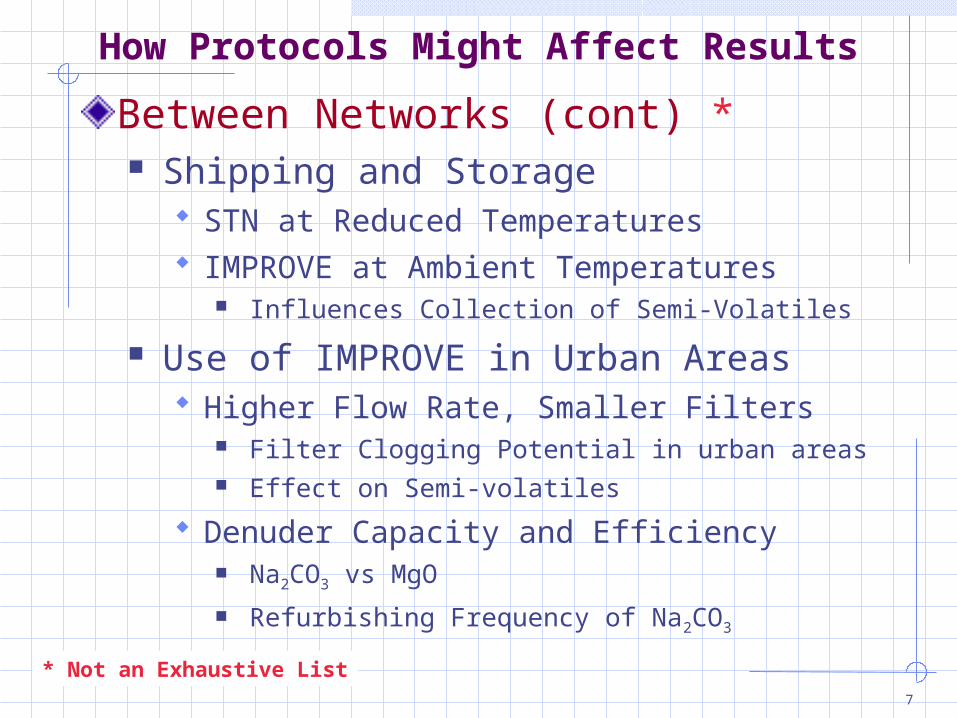
Between Networks (cont) * Shipping and Storage
STN at Reduced Temperatures IMPROVE at Ambient Temperatures
Influences Collection of Semi-Volatiles
Use of IMPROVE in Urban Areas Higher Flow Rate, Smaller Filters
Filter Clogging Potential in urban areas Effect on Semi-volatiles
Denuder Capacity and Efficiency Na2CO3 vs MgO
Refurbishing Frequency of Na2CO3
How Protocols Might Affect Results
* Not an Exhaustive List

8
Bottom Line
Given All these Differences, Do the
Networks Provide Similar Results for
Mass and the Components
?

9
Median Ratio of STN/IMPROVE
Haines Pt. PhoenixBeacon
HillDOSO TONT MORA
IMP/STN
PM2.5 0.91 1.05 0.96 0.89 0.91 0.90
EC 1.09 1.01 1.04 1.29 0.68 1.39
OC 0.54 0.48 0.90 0.53 0.36 0.58
Nitrate 0.89 0.87 1.31 0.87 1.22 0.86
Sulfate 1.00 1.31 1.06 1.01 0.90 0.86
As 0.62 0.49 0.67 0.46 0.46 0.63
Ca 0.87 1.61 1.37 0.95 1.46 1.16
Cr 0.55 0.27 0.75 2.22 0.11 0.28
Cu 0.93 1.28 0.63 0.78 1.44 0.16
Fe 0.93 1.59 1.34 0.91 1.35 1.11
Mn 0.70 1.11 1.19 0.84 0.90 0.85
Pb 0.83 0.84 1.01 0.88 0.69 0.72
S 0.98 0.97 1.03 1.03 0.95 0.84
Si 1.42 1.82 1.57 1.48 1.45 1.43
Zn 1.03 1.55 1.18 1.01 1.20 1.00
Median Ratio (IMP/STN)
Urban (E to W) Rural (E to W)

10
Urban – Rural Temporal Analysis: PM2.5 Mass
Haines Point
Dolly Sods
Phoenix
Tonto

11
Urban – Rural Comparison of Means: PM2.5 Mass
Annual Average ResultsEast Coast Sites Have Higher Conc. than West
Coast SitesUrban Site Levels Exceed Rural Sites by 20-
100%Similar Agreement, within ~10%, is Observed
at Both Urban and Rural Sites, with Slightly Better Average Agreement at Urban Sites
9.0%*
-5.1%
4.3%
11.0%
11.3%
3.3%
9.5%
10.8%
5.9%
Haines Point1.3
Phoenix -0.6
Beacon Hill0.3
Dolly
Sods1.1
Tonto 0.7
Mt Rainier 0.3
Urban 0.36
Rural 0.71
All Sites 0.52
STN- IMP (ug/m3)
* Relative Percent Diff. (STN-IMP)/((STN+IMP)/2)*100
Urban (EW) Rural (EW)
12
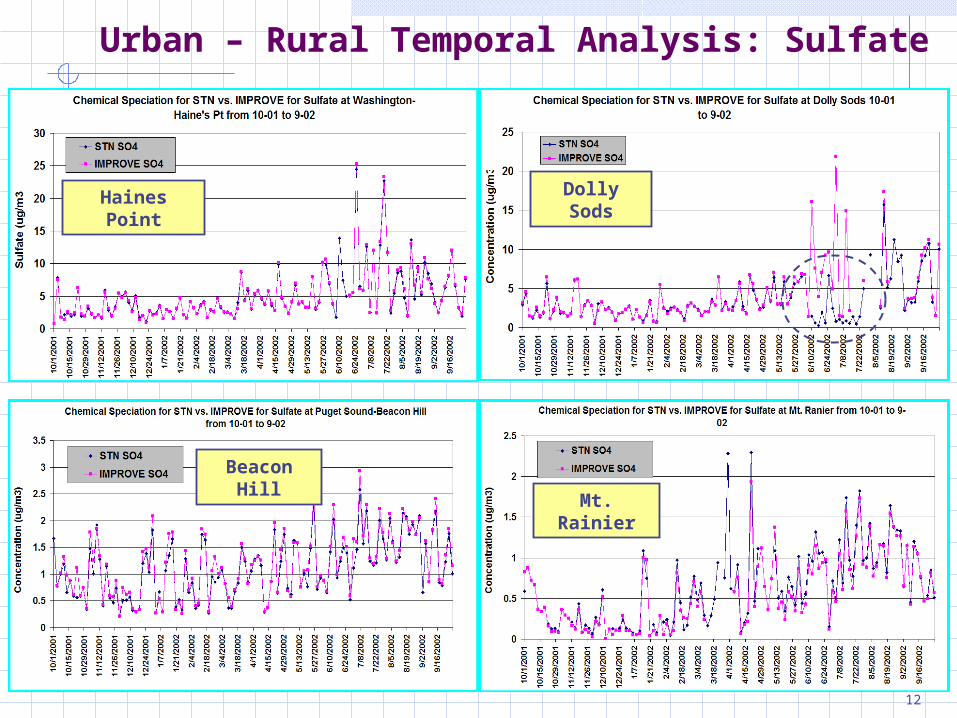
Urban – Rural Temporal Analysis: Sulfate
Haines Point
Dolly Sods
Beacon Hill
Mt. Rainier

13
Urban – Rural Comparison of Means: Sulfate
Annual Average ResultsEast Coast Sites Have Higher Conc. than West Coast
SitesUrban Site Levels Exceed Rural Sites By 50 to 70%
(Avg 48%) Based on STN Data and By 22-100% (Avg 37%) Based on IMP Data
There Is Better Agreement On Average at Urban SitesThe Dolly Sods STN Sulfate Data For June & July 2001
Will Be Flagged as Invalid Due to a Flow Controller Problem – These Data Contribute Significantly to the Larger Difference Between the Two Networks at Dolly Sods
Haines Pt. -0.05
Phoenix -0.36
Beacon Hill -0.09
Dolly Sods -0.89
Tonto 0.12
Mt. Rainier 0.06
Urban -0.15
Rural -0.25
All Sites -0.20
STN- IMP (ug/m3)
-0.9%
-23.4%
-7.5%
-24.2%
12.0%9.5%
-6.0%
-13.7%
-9.0%
* Relative Percent Diff. (STN-IMP)/((STN+IMP)/2)*100
Urban (EW) Rural (EW)
14
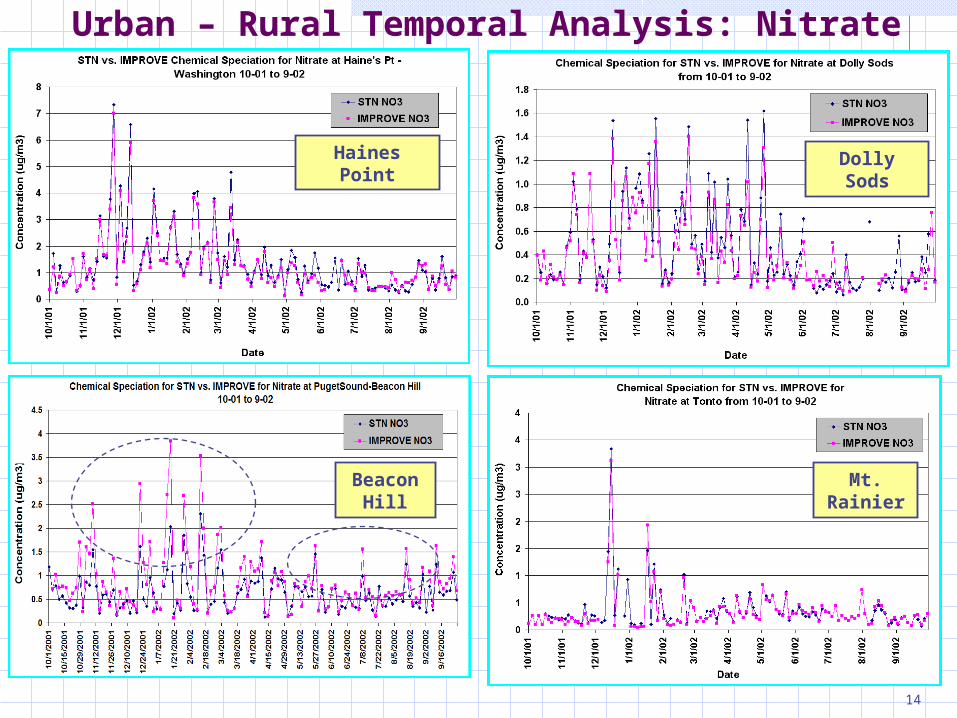
Urban – Rural Temporal Analysis: Nitrate
Haines Point
Dolly Sods
Beacon Hill
Mt. Rainier

15
Urban – Rural Comparison of Means: Nitrate
Annual Average ResultsOn Average, Nitrate Conc Are Low, < 1.4 µg/m3
East Coast Sites Have Higher Conc. than West Coast Sites
Paired Urban Site Levels Exceed Rural Sites by ~ Factor of 3
By Site, Samplers Agree Within About 30% on Average
At Beacon Hill the Difference is Largest at Higher Conc as Seen in the Temporal Distribution
11.7%
13.1%-31.9%
13.7%-20.8%
-3.3%
0.5%
-2.8%
-0.2%
Haines Pt. 0.15
Phoenix 0.12
Beacon Hill -0.24
Dolly Sods 0.060
Tonto -0.085
Mt. Rainier -0.005
Urban 0.005
Rural -0.009
All Sites -0.002
STN- I MP (ug/m3)
Urban (EW) Rural (EW)
*Relative Percent Diff. (STN-IMP)/((STN+IMP)/2)*100

16
Urban – Rural Temporal Analysis: OC
Haines Point Dolly
Sods
Beacon Hill
Mt. Rainier
In General IMP < STN
17
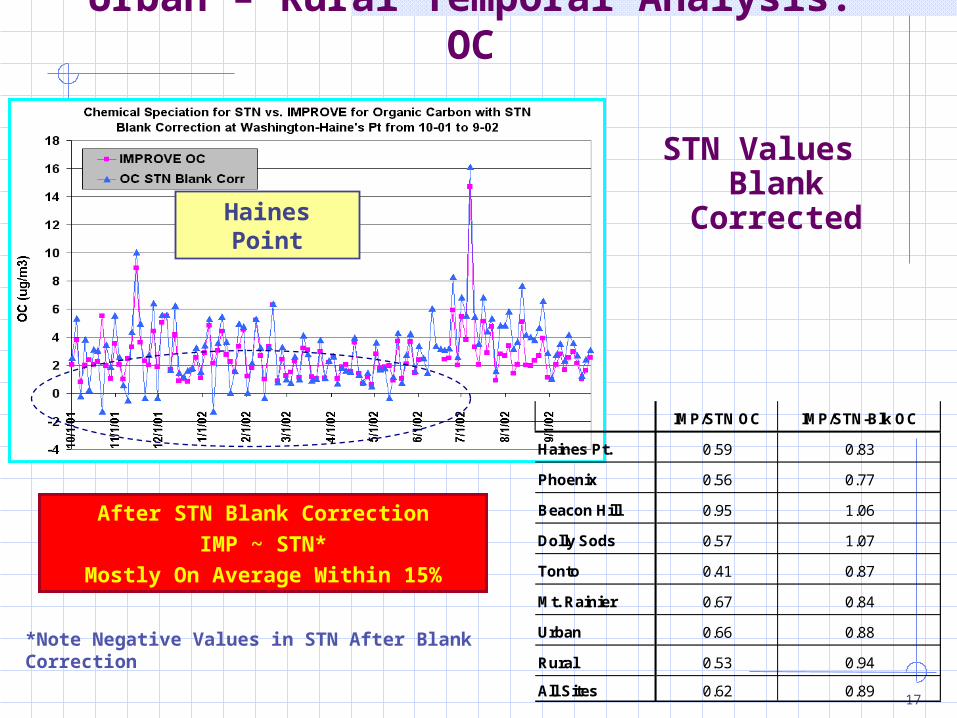
Urban – Rural Temporal Analysis: OC
Haines Point
*Note Negative Values in STN After Blank Correction
After STN Blank CorrectionIMP ~ STN*
Mostly On Average Within 15%
IMP/STN OC IMP/STN-Blk OC
Haines Pt. 0.59 0.83
Phoenix 0.56 0.77
Beacon Hill 0.95 1.06
Dolly Sods 0.57 1.07
Tonto 0.41 0.87
Mt. Rainier 0.67 0.84
Urban 0.66 0.88
Rural 0.53 0.94
All Sites 0.62 0.89
STN Values Blank
Corrected

18
Annual Average ResultsEast and West Coast Sites Can Have Similar
ConcentrationsSTN Urban Site Levels Exceed Rural Sites by 200-
500%Rural Sites Tend to Agree Better Than Urban Sites
Before Blank CorrectionValues Agree Better, but Blank Correcting STN
Results in Negative Numbers That Seem to Be More Prevalent in the Fall & Winter
Urban – Rural Comparison of Means: OC
Blank Correcting STN OC Values Improves the Comparison
Between STN and IMPROVE at Most
Locations
STN Blank Values Are Based on Trip and Field Blanks and Averaged Over the Time Period of the Study
Anderson = 1.3 ug/m3
Haines Pt, Dolly SodsMetOne = 1.4 ug/m3
Phoenix, TontoURG = 0.3 ug/m3
Beacon Hill, Mt Rainier
Urban (EW) Rural (EW)
19
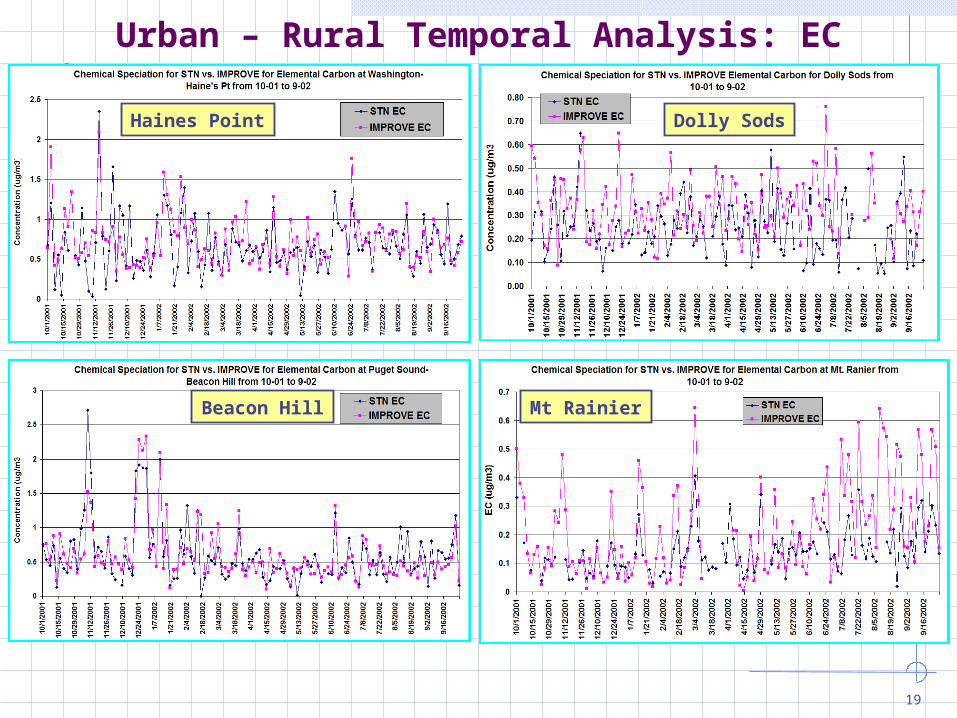
Urban – Rural Temporal Analysis: EC
Haines Point Dolly Sods
Beacon Hill Mt Rainier
20
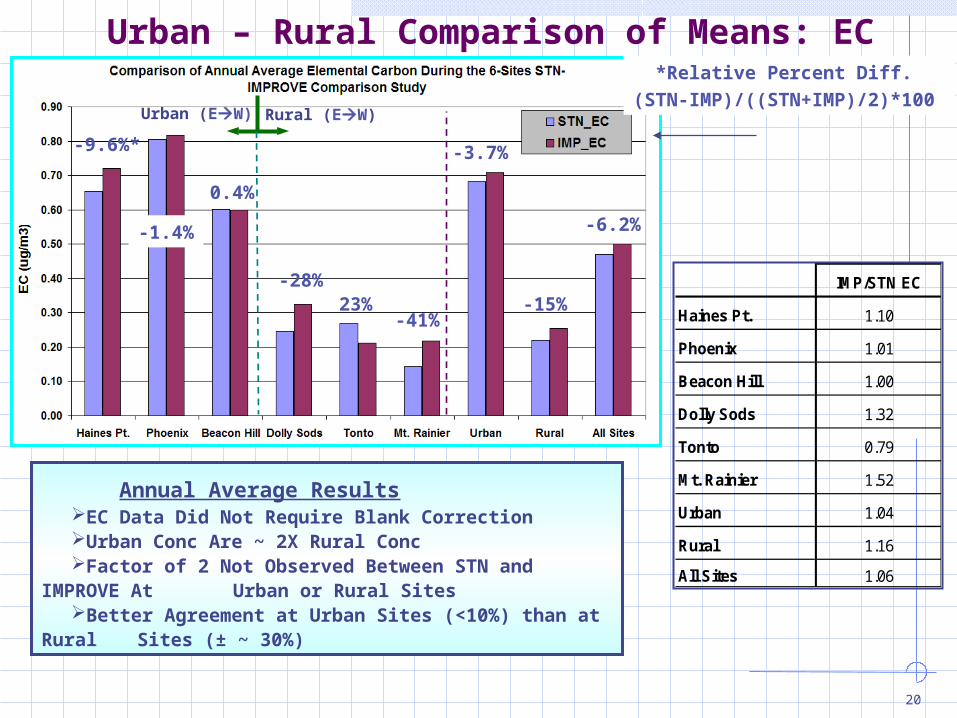
Urban – Rural Comparison of Means: EC
Annual Average ResultsEC Data Did Not Require Blank CorrectionUrban Conc Are ~ 2X Rural ConcFactor of 2 Not Observed Between STN and
IMPROVE At Urban or Rural SitesBetter Agreement at Urban Sites (<10%) than at
Rural Sites (± ~ 30%)
IMP/STN EC
Haines Pt. 1.10
Phoenix 1.01
Beacon Hill 1.00
Dolly Sods 1.32
Tonto 0.79
Mt. Rainier 1.52
Urban 1.04
Rural 1.16
All Sites 1.06
-9.6%*
-1.4%
0.4%
-28%23%
-41%
-3.7%
-15%
-6.2%
Urban (EW) Rural (EW)
*Relative Percent Diff. (STN-IMP)/((STN+IMP)/2)*100

21
Concentrations at Rural Sites Lower for
Most Species at Most Sites
Less Consistency (Greater Scatter)
Observed at Rural Sites
Higher Data Capture Observed at Urban
Sites
Mass and Sulfate Agreed Well
Typically within 10% for Mass and 20% for
Sulfate
Organic Carbon Agreed Better After STN
Data Blank Corrected
Conclusions

22
Species at Higher Concentrations Agree
Better
MDL & Blanks Potential Issue Between
Network Agreement
Site-to-Site Variations Observed for All
Species Even After a Thorough Review
of the Data and Outliers
Questionable Data Still Remain
Factor of 2 Difference not Observed
Between STN and IMPROVE EC
Conclusions (cont’d)

23
Finalize report on first year of data from 6 sites
Conduct study to determine the effects of shipping conditions
Begin analyzing quartz filters from STN sites using IMPROVE protocol
Sponsoring projects to specifically look at the effect of carbon meas. protocols on concentration data
Next Steps

24
Expanding IMPROVE collocation to nine additional “STN” sites in 2003/2004 New York City Atlanta Pittsburgh Birmingham Detroit Chicago Houston (SS) Riverside-Rubidoux Fresno (SS)
Next Steps

25
Disclaimer & AcknowledgementsThis work has been funded wholly by the United States
Environmental Protection Agency. It has been subjected to Agency review and approved for publication. Mention of trade names or commercial products do not constitute endorsement or recommendation for use.
Acknowledgements:This work was supported by the National Park Service and EPA.
Staff from UC Davis, DRI and NPS personnel have played a significant role in collection and analysis of samples in the IMPROVE Network. Research Triangle Institute has played a significant role in preparing and analyzing samples for the STN network, as well as state site operators who have meticulously been collecting samples since October 2001, which continues to date.
Complete Authors List:Solomon, Paul, A. (EPA, ORD, Las Vegas), Crumpler, Dennis (EPA,
OAQPS, RTP), Klamser-Williams, Tracy (EPA, ORIA, Las Vegas), Egeghy, Peter, Homolya, James, Pitchford, Marc (EPA, OAQPS, Las Vegas), Rice, Joann, Ashbaugh, Lowell (UC Davis, Sacramento), Orourke, James (RTI, RTP), Frank, Neil, McDade, Charles, Flanagan, James, and Rickman, Edward