sti's blue/green template - caltrans - california … · web viewblack text = headingsblue...
TRANSCRIPT

Black Text = Headings Blue Text = Instructions to be deletedRed Text = Boilerplate Purple Text = Examples
AIR QUALITY REPORT[PROJECT TITLE]
[GENERAL LOCATION INFORMATION]
[DISTRICT]-[COUNTY CODE]-[ROUTE]-[PM] [EA/PROJECT NUMBER]
Prepared by
[Organization Name][Department/Division]
[Office][Address]
[Month Year]
Version 1.0 (12/15/2017) of Air Quality Report Annotated Outline
Insert a map showing the project area here

Black Text = Headings Blue Text = Instructions to be deletedRed Text = Boilerplate Purple Text = Examples
This document contains blank pages to accommodate two-sided printing.
Version 1.0 (12/15/2017) of Air Quality Report Annotated Outline

Black Text = Headings Blue Text = Instructions to be deletedRed Text = Boilerplate Purple Text = Examples
AIR QUALITY REPORT
[COUNTY NAME] COUNTY, CALIFORNIA
CALIFORNIA DEPARTMENT OF TRANSPORTATION DISTRICT [#]
E.A. [##]
EFIS [##]
[PROJECT ID]
Reviewed by: __________________________________________________ Date: _________________________ Name
Agency Address City, State, Zip
Prepared by: __________________________________________________ Date: _________________________ Name
Agency Address City, State, Zip
For individuals with sensory disabilities, this document is available in alternative formats.Please call or write to the California Department of Transportation, Attn: [CONTACT NAME], or use
the California Relay Service TTY number, 711, or 1-800-735-2922.
Version 1.0 (12/15/2017) of Air Quality Report Annotated Outline

Black Text = Headings Blue Text = Instructions to be deletedRed Text = Boilerplate Purple Text = Examples Contents
ContentsNot all sections may be required; for example, Section 3.4.2, Project-Level Conformity may not be required if the project is not subject to conformity, as discussed in Section 3.4.1 Regional Conformity. For any changes, additions, or omissions in the content of this document, consult with the District Air Quality Specialist or Branch. Update the table of contents (right click, choose Update Field, and select Update entire table) once the air quality report is complete to reflect sections included in the report.
List of Appendices............................................................................................................vList of Tables....................................................................................................................viList of Figures.................................................................................................................viiAcronyms and Abbreviations.........................................................................................viii
1. Proposed Project Description......................................................................11.1 Introduction........................................................................................................11.2 Location and Background...................................................................................11.3 Purpose and Need...............................................................................................21.4 Baseline and Forecasted Conditions for No-Build and Project Alternatives.........2
1.4.1 Existing Roadways and Traffic Conditions................................................31.4.2 No-Build Alternative.................................................................................31.4.3 Project Build Alternatives.........................................................................41.4.4 Comparison of Existing/Baseline and Build Alternatives..........................6
1.5 Construction Activities and Schedule..................................................................7
2. Regulatory Setting......................................................................................92.1 Pollutant-Specific Overview................................................................................9
2.1.1 Criteria Pollutants....................................................................................92.1.2 Mobile Source Air Toxics.........................................................................132.1.3 Greenhouse Gases.................................................................................152.1.4 Asbestos................................................................................................16
2.2 Regulations.......................................................................................................172.2.1 Federal and California Clean Air Act.......................................................172.2.2 Transportation Conformity......................................................................172.2.3 National Environmental Policy Act (NEPA)..............................................182.2.4 California Environmental Quality Act (CEQA).........................................182.2.5 Local......................................................................................................18
3. Affected Environment...............................................................................203.1 Climate, Meteorology, and Topography.............................................................203.2 Existing Air Quality...........................................................................................21
3.2.1 Criteria Pollutants and Attainment Status..............................................213.2.2 Mobile Source Air Toxics.........................................................................243.2.3 Greenhouse Gas and Climate Change....................................................24
3.3 Sensitive Receptors..........................................................................................243.4 Conformity Status.............................................................................................25
3.4.1 Regional Conformity...............................................................................253.4.2 Project-Level Conformity........................................................................273.4.3 Interagency Consultation.......................................................................28
Version 1.0 (12/15/2017) of Air Quality Report Annotated Outline
Black Text = Headings Blue Text = Instructions to be deletedRed Text = Boilerplate Purple Text = Examples Contents
3.5 NEPA Analysis/Requirement..............................................................................283.6 CEQA Analysis/Requirement.............................................................................29
4. Environmental Consequences...................................................................304.1 Impact Criteria..................................................................................................304.2 Short-Term Effects (Construction Emissions).....................................................37
4.2.1 Construction Equipment, Traffic Congestion, and Fugitive Dust.............374.2.2 Asbestos................................................................................................414.2.3 Lead.......................................................................................................41
4.3 Long-Term Effects (Operational Emissions).......................................................424.3.1 CO Analysis............................................................................................434.3.2 PM Analysis............................................................................................444.3.3 NO2 Analysis...........................................................................................454.3.4 Mobile Source Air Toxics Analysis...........................................................464.3.5 Greenhouse Gas Emissions Analysis......................................................50
4.4 Cumulative/Regional/Indirect Effects................................................................52
5. Minimization Measures.............................................................................535.1 Short-Term (Construction).................................................................................535.2 Long-Term (Operational)...................................................................................53
6. Conclusions...............................................................................................55
7. References................................................................................................56
8. Appendices...............................................................................................57
Version 1.0 (12/15/2017) of Air Quality Report Annotated Outline

Black Text = Headings Blue Text = Instructions to be deletedRed Text = Boilerplate Purple Text = Examples List of Appendices
List of AppendicesUpdate the list of appendices once the air quality report is complete to reflect appendices included in the report.
Appendix A RTP and TIP Listings for the Project and FHWA Conformity Determination
Appendix B Summary of Forecast Travel Activities
Appendix C Construction Emissions Calculation
Appendix D CO Flow Chart (Based on the CO Protocol)
Appendix E Summary of Emissions Input for PM Hot-Spot Modeling
Appendix F Quantitative PM Hot-Spot Analysis
Appendix G Summary Tables for Changes in MSAT Emissions
Appendix H Grid Maps for Changes in Emissions of DPM and Benzene
Appendix I Summary Tables for Estimated Regional Emissions of GHG, PM, and Other Pollutants
Appendix J Grid Maps for Changes in Emissions of GHG and PM
Appendix K NO2 Analysis Information and Results
Appendix L Interagency Consultation Documentation
Version 1.0 (12/15/2017) of Air Quality Report Annotated Outline

Black Text = Headings Blue Text = Instructions to be deletedRed Text = Boilerplate Purple Text = Examples List of Tables
List of TablesUpdate the list of tables to add new tables and delete unused tables. Be sure to check that the page numbers are correct. Table [X]. Summary of Existing Traffic Conditions. Address mainline and arterial
volumes, speeds, and VMT..........................................................................................3Table [X]. Summary of Future No-Build Traffic Conditions. Address mainline and
arterial volumes, speeds, and VMT..............................................................................4Table [X]. Summary of Build and TSM/TDM Traffic Conditions. Address mainline and
arterial volumes, speeds, and VMT..............................................................................6Table [X]. Summary of Long-Term Operational Impacts of Existing, No-Build, and
Build Alternatives........................................................................................................7Table [X]. Construction Activities and Schedule................................................................8Table [X]. Table of State and Federal Ambient Air Quality Standards. Accessed
[DATE], www.arb.ca.gov/research/aaqs/aaqs2.pdf. Note: This table is maintained and updated by the ARB; please check for current version....................10
Table [X]. State and Federal Criteria Air Pollutant Effects and Sources...........................12Table [X]. State and Federal Attainment Status..............................................................22Table [X]. Air Quality Concentrations for the Past [X] Years Measured at [NAME OF
STATION]. If documenting air quality concentrations at multiple monitors, provide data for each monitor in a separate table and label tables [X]a, [X]b, [X]c, etc.....................................................................................................................23
Table [X]. Status of SIPs Relevant to the Project Area.....................................................24Table [X]. Sensitive Receptors Located Within [DISTANCE] of the Project Site................25Table [X]. Status of Plans Related to Regional Conformity...............................................27Table [X]. Summary of Interagency Consultation Process...............................................28Table [X]. Summary of Air Quality Studies that May Be Needed to Address
Conformity, NEPA, and CEQA.....................................................................................31Table [X]. Construction Emissions for Roadways. Construction activities included in
this table may vary by project; modify activities in the table as needed...................39Table [X]. Summary of Comparative Emissions Analysis.................................................44Table [X]. Summary of Comparative MSAT Emissions Analysis.......................................48Table [X]. Modeled Annual CO2 Emissions and Vehicle Miles Traveled, by
Alternative.................................................................................................................50
Version 1.0 (12/15/2017) of Air Quality Report Annotated Outlinevi

Black Text = Headings Blue Text = Instructions to be deletedRed Text = Boilerplate Purple Text = Examples List of Figures
List of FiguresUpdate the list of figures to add new figures and delete unused figures. Be sure to check that the page numbers are correct. Figure [X]. Map of the Project Location.............................................................................2Figure [X]. Map of the Project and Nearby Roadways.......................................................3Figure [X]. Projected National MSAT Trends, 2010-2050..................................................14Figure [X]. Predominant Wind Patterns Near the Project.................................................21Figure [X]. Map of Air Quality Monitoring Stations Located Near the Project...................21Figure [X]. Sensitive Receptors Located Near the Proposed Project................................25Figure [X]. The Extent of Areas Considered in the MSAT Analysis...................................21
Version 1.0 (12/15/2017) of Air Quality Report Annotated Outlinevii

Black Text = Headings Blue Text = Instructions to be deletedRed Text = Boilerplate Purple Text = Examples
Acronyms and Abbreviations
Acronyms and AbbreviationsA list of common acronyms and abbreviations follows. Delete unused acronyms/abbreviations and add any others included in the report.
Term Definition
ºF Degrees FahrenheitAADT Average annual daily trafficAB Assembly billADT Average daily trafficAQMP Air Quality Management PlanARB California Air Resources BoardATM Active Traffic ManagementBACM Best available control measuresBMP Best Management PracticeBRT Bus rapid transitCAAQS California Ambient Air Quality StandardsCal/EPA California Environmental Protection AgencyCaltrans California Department of TransportationCAP Climate Action ProgramCCAA California Clean Air ActCCR California Code of RegulationsCEQA California Environmental Quality ActCFR Code of Federal RegulationsCH4 MethaneCO Carbon monoxideCO2 Carbon dioxideCounty [County Name]EO Executive OrderFCAA Federal Clean Air ActFHWA Federal Highway Administrationft FeetFTA Federal Transit AdministrationFTIP Federal Transportation Improvement Program
Version 1.0 (12/15/2017) of Air Quality Report Annotated Outlineviii

Black Text = Headings Blue Text = Instructions to be deletedRed Text = Boilerplate Purple Text = Examples
Acronyms and Abbreviations
Term DefinitionGHG Greenhouse gasIPCC International Panel on Climate ChangeITS Intelligent Transportation SystemsLOS Level of serviceLRTP Long Range Transportation Planmi MilesMOVES Motor Vehicle Emission Simulatormph Miles per hourMPO Metropolitan Planning OrganizationMSA Metropolitan Statistical AreaMSAT Mobile Source Air ToxicsN2O Nitrous oxideNAAQS National Ambient Air Quality StandardsNATA National Air Toxics AssessmentNEPA National Environmental Policy ActNHTSA National Highway Traffic Safety AdministrationNO2 Nitrogen dioxideNOA Naturally occurring asbestosNOx Nitrogen oxideO&M Operations and maintenanceO3 OzoneOMB White House Office of Management & BudgetOPR Office of Planning and ResearchPM Particulate matterPM10 Particulate matter less than 10 microns in diameterPM2.5 Particulate matter less than 2.5 microns in diameterppm Parts per millionProtocol Transportation Project-Level Carbon Monoxide ProtocolROGs Reactive organic gasesRTP Regional Transportation PlanRTPA Regional Transportation Planning AgencySB Senate Bill
Version 1.0 (12/15/2017) of Air Quality Report Annotated Outlineix
Black Text = Headings Blue Text = Instructions to be deletedRed Text = Boilerplate Purple Text = Examples
Acronyms and Abbreviations
Term DefinitionSIP State Implementation PlanSO2 Sulfur dioxideTACsTDMTSM
Toxic air contaminantsTransportation Demand ManagementTransportation System Management
TIP Transportation Improvement ProgramUSC United States CodeUSDOT United States Department of TransportationU.S. EPA United States Environmental Protection AgencyUV UltravioletVHT Vehicle hours traveledVMT Vehicle miles traveledVOCs Volatile organic compounds
Version 1.0 (12/15/2017) of Air Quality Report Annotated Outlinex

Black Text = Headings Blue Text = Instructions to be deletedRed Text = Boilerplate Purple Text = Examples 1. Proposed Project Description
1. Proposed Project Description1.1 IntroductionBriefly introduce the project, project sponsors, purpose, and need for the proposed project, and the lead agencies under the California Environmental Quality Act (CEQA) and the National Environmental Policy Act (NEPA). The lead agency is responsible for supervising the preparation of the environmental document(s) and, under CEQA, identifying and involving responsible and trustee agencies. When an Environmental Impact Statement is prepared under NEPA, Caltrans is responsible for inviting and participating agencies; developing coordination plans; providing opportunities for public and participating agency involvement in defining the purpose and need and determining the range of alternatives; and collaborating with participating agencies in determining methodologies and the level of detail for the analysis of alternatives. Be brief, as this material will be discussed in depth later in this section.
The California Department of Transportation (Caltrans) proposes to improve the uphill segment of [ROUTE] in [COUNTY] from west of [ROUTE] south to east of the [LOCATION] near [ROUTE] to improve mobility and relieve congestion in the area between [ROUTE] and [ROUTE]. The total length of the project is [X] miles. Caltrans is the lead agency under NEPA. Caltrans [OR NAME OF LOCAL AGENCY] is the lead agency under CEQA.
1.2 Location and BackgroundIdentify the project location, county, and the air district(s) and Metropolitan Planning Organization(s) (MPO)/Regional Transportation Planning Agency(s) (RTPA) that have jurisdiction over the project area. Describe relevant features of the project location and surrounding area. A map of the project location should identify street names and prominent landmarks, especially those mentioned in the text.
This project is included in the [TIP NAME] and is proposed for funding from the [PROGRAM NAME]. It is also included in the [MPO]’s Year [YEAR] Regional Transportation Plan (RTP) and the Year [YEAR] cost-constrained TIP. Figure [X] shows the project location.
Version 1.0 (12/15/2017) of Air Quality Report Annotated Outline1

Black Text = Headings Blue Text = Instructions to be deletedRed Text = Boilerplate Purple Text = Examples 1. Proposed Project Description
Figure [X]. Map of the Project Location.
1.3 Purpose and NeedThe project “purpose” is a set of objectives the project intends to meet. The project “need” is the transportation deficiency that the project was initiated to address. Include a description of the purpose of the project, what the project is designed to accomplish, the resulting improvements, and the baseline or forecasted conditions that necessitate the improvements that will result from the project. The description should identify any components of the project that change capacity, and focus on the project information that is relevant to emissions, including annual average daily traffic (AADT), vehicle miles traveled (VMT), fleet mix (trucks compared to light-duty automobiles), and speed, if relevant (such as for high-occupancy vehicle (HOV) lane projects and congestion relief). The purpose and need (P&N) should not be written by technical staff; a specialist should obtain the P&N statement from the environmental generalist.
1.4 Baseline and Forecasted Conditions for No-Build and Project Alternatives
List the proposed project alternatives. The proposed alternatives include the No-Build Alternative, the Transportation System Management/Transportation Demand Management (TSM/TDM) Alternative, the Bus Rapid Transit Alternative, the Light Rail Transit Alternative, and the Freeway Tunnel Alternative. These alternatives are each discussed below. Include maps showing all of the project alternatives and nearby air quality monitors, and summarize traffic conditions in the following subsections. These maps should be displayed in Section 1.4 and referenced in the “List of Figures” section. Note that some unique, large projects that will result in substantial temporary detour emission increases during construction may need to account for those increases. Request fleet mix, speed, and volume information from design and operations staff and report any changes from baseline that will occur during construction and operation to address NEPA and CEQA. Include a discussion of the appropriate modeling years for the analysis and an explanation of why those years were chosen.
Version 1.0 (12/15/2017) of Air Quality Report Annotated Outline2
Insert a detailed map of the project location

Black Text = Headings Blue Text = Instructions to be deletedRed Text = Boilerplate Purple Text = Examples 1. Proposed Project Description
1.4.1 Existing Roadways and Traffic ConditionsUnder CEQA, the baseline for environmental impact analysis consists of the existing conditions (referred to in this document as Baseline) at the time of the Notice of Preparation (NOP) or at the time the environmental studies began. State what baseline (year) is being used for the analysis and why it is being used. Document the roadways that will be affected by the construction of the project. Document existing traffic information in a table in an appendix and summarize conditions here. Provide a map showing the locations of roadways relative to the project, if not shown in the figure in Section 1.2. Include the source of the traffic information.
Figure [X]. Map of the Project and Nearby Roadways.
Table [X]. Summary of Existing Traffic Conditions. Address mainline and arterial volumes, speeds, and VMT.
Scenario/Analysis Year Location
AADT
% Truck VMT (mi)
Average Speed During
Peak Travel (mph)
Average Speed
During Off-Peak Travel (mph)
Total Truck
Existing/Baseline Year 2017
Note: If the percentage of vehicles that are trucks differs between peak and off-peak periods, specify truck percentages during peak and off-peak periods separately. Additionally, if the facility includes HOV lane(s), the travel speeds for the HOV lane(s) must be presented separately from travel speeds for the mixed flow lane(s).
1.4.2 No-Build AlternativeThe No-Build alternative provides a basis for comparing the effects of the Build alternative. Under NEPA, the No-Build alternative for future year(s) can be used as the baseline for comparing environmental impacts. Describe conditions under the No-Build alternative; these might include deteriorating LOS, worsening air quality, and increasing maintenance costs. The No-Build alternative may create cumulative impacts if several smaller fixes are to be implemented over time in a piecemeal fashion.
Version 1.0 (12/15/2017) of Air Quality Report Annotated Outline3
Insert a map showing the project and nearby roadways (including project alternative
alignments)
Black Text = Headings Blue Text = Instructions to be deletedRed Text = Boilerplate Purple Text = Examples 1. Proposed Project Description
The No-Build (No Action) Alternative consists of those transportation projects that are already planned for construction by or before [YEAR]. Consequently, the No-Build alternative represents future travel conditions in the [STUDY NAME] study area without the [STUDY NAME] project and is the baseline against which the other [STUDY NAME] alternatives will be assessed to meet NEPA requirements. Include a list of specific future projects that were included in No-Build Alternative analysis.
Document No-Build traffic conditions in a table in an appendix and summarize conditions here.
Table [X]. Summary of Future No-Build Traffic Conditions. Address mainline and arterial volumes, speeds, and VMT.
Scenario/Analysis Year Location
AADT
% Truck VMT (mi)
Average Speed During
Peak Travel (mph)
Average Speed
During Off-Peak Travel (mph)
Total Truck
No Build Year 2020No Build Year 2025
Note: If the percentage of vehicles that are trucks differs between peak and off-peak periods, specify truck percentages during peak and off-peak periods separately. Additionally, if the facility includes HOV lane(s), the travel speeds for the HOV lane(s) must be presented separately from travel speeds for the mixed flow lane(s).
1.4.3 Project Build AlternativesDescribe all project Build alternatives. Build alternatives should include a range of reasonable alternatives that could meet the purpose and need of the project. Discuss common and unique design features. Consider using a table and/or graphic(s) to highlight differences between alternatives that may be relevant to emissions. Information of particular interest may include:
Volume changes – Do some alternatives have more or less traffic volumes than others? If so, how do these volume changes relate to peak and off-peak travel conditions?
Substantial vehicle fleet differences – Do some alternatives have substantially less or more truck traffic than others? If so, why? Is the character of the project such that it will encourage more or less truck traffic (e.g., HOV lanes, access to warehouse or industrial area)?
Substantial speed differences – Do some alternatives have substantially less or more congestion, leading to higher or lower speeds? If traffic speeds and/or volumes are the same for alternatives that vary in capacity or congestion, explain why. Added capacity or lower congestion should usually have an effect on volume and speed, and air quality differences can be expected as well.
Version 1.0 (12/15/2017) of Air Quality Report Annotated Outline4

Black Text = Headings Blue Text = Instructions to be deletedRed Text = Boilerplate Purple Text = Examples 1. Proposed Project Description
Alignment – Do some alternatives place traffic, especially truck traffic, closer to sensitive receptors than others?
Identify any components of the alternative that change capacity. Focus on the project information that is relevant to emissions, including AADT, VMT, fleet mix (meaning percent of travel by trucks) and speeds if speed change is relevant (such as for HOV lane projects and congestion relief). For all project alternatives, substantial changes in truck traffic are very important to identify. Local information and micro-scale traffic modeling may be needed for major projects or where substantial truck traffic diversion to/from the project is possible. Document traffic conditions for each project alternative in an appendix, and summarize conditions here. Include maps displaying the details of each Build alternative, including various alternative alignments and proximity to sensitive receptors.
Transportation System Management/Transportation Demand Management Alternatives
This section may not be needed for certain projects.
Include Transportation System Management (TSM), Transportation Demand Management (TDM), and Mass Transit alternatives under the following conditions:
TSM Alternative: usually only relevant in urban areas over 200,000 population TDM Alternative: to be considered on all proposed major highway projects in
urban areas over 200,000 population Mass Transit Alternative: to be considered on all proposed major highway projects
in urban areas over 200,000 population
If one or more TSM, TDM, or mass transit alternatives are applicable, include the following text:TSM strategies increase the efficiency of existing facilities; they are actions that increase the number of vehicle trips a facility can carry without increasing the number of through lanes. Examples of TSM strategies include: ramp metering, auxiliary lanes, turning lanes, reversible lanes, and traffic signal coordination. TSM also promotes automobile, public and private transit, ridesharing programs, and bicycle and pedestrian improvements as elements of a unified urban transportation system. Modal alternatives integrate multiple forms of transportation modes, such as pedestrian, bicycle, automobile, rail, and mass transit.
TDM focuses on regional means of reducing the number of vehicle trips and vehicle miles traveled as well as increasing vehicle occupancy. It facilitates higher vehicle occupancy or reduces traffic congestion by expanding the traveler's transportation options in terms of travel method, travel time, travel route, travel costs, and the quality and convenience of the travel experience. A typical activity would be providing funds to regional agencies that are actively promoting ridesharing, maintaining rideshare databases, and providing limited rideshare services to employers and individuals.
If TSM/TDM alternatives are considered for this project, detail the specifics, and include maps and/or tables as needed. If applicable, add a boilerplate paragraph for one common conclusion:
Version 1.0 (12/15/2017) of Air Quality Report Annotated Outline5

Black Text = Headings Blue Text = Instructions to be deletedRed Text = Boilerplate Purple Text = Examples 1. Proposed Project Description
Although Transportation System Management measures alone could not satisfy the purpose and need of the project, the following Transportation System Management measures have been incorporated into the Build alternatives for this project:
[LIST ITEMS]
Table [X]. Summary of Build and TSM/TDM Traffic Conditions. Address mainline and arterial volumes, speeds, and VMT.
Scenario/Analysis Year Location
AADT
% Truck VMT (mi)
Average Speed During
Peak Travel (mph)
Average Speed
During Off-Peak Travel (mph)
Total Truck
[NAME AND YEAR OF BUILD ALTERNATIVE
1][NAME AND
YEAR OF BUILD ALTERNATIVE
2][NAME AND
YEAR OF BUILD ALTERNATIVE
3]
TSM/TDM Alternative Year 2025
Note: If the percentage of vehicles that are trucks differs between peak and off-peak periods, specify truck percentages during peak and off-peak periods separately. Additionally, if the facility includes HOV lane(s), the travel speeds for the HOV lane(s) must be presented separately from travel speeds for the mixed flow lane(s).
1.4.4 Comparison of Existing/Baseline and Build Alternatives
Under CEQA, existing conditions (CEQA baseline) are compared to future Build scenarios. The difference between future No Build and Build may help inform significance determinations, which will be made by the PDT.
To facilitate these comparisons, provide a narrative and table summarizing long-term operational impacts on traffic conditions of Existing/Baseline, No-Build, and Build alternatives. Specifically state the future No-Build year and Build year. Identify the important components of the alternatives that change capacity. Focus on the project information that is relevant to emissions, including AADT, VMT, fleet mix (trucks
Version 1.0 (12/15/2017) of Air Quality Report Annotated Outline6

Black Text = Headings Blue Text = Instructions to be deletedRed Text = Boilerplate Purple Text = Examples 1. Proposed Project Description
compared to light-duty automobiles), and speed, if relevant (such as for HOV lane projects and congestion relief).
Table [X] summarizes design features and operational impacts on traffic conditions near the proposed project.
Table [X]. Summary of Long-Term Operational Impacts on Traffic Conditions of Existing, No-Build, and Build Alternatives.
Scenario/Analysis Year Location
Design Features and Operational Impacts on Traffic Conditions
(For example, use tables in Sections 1.4.1 and 1.4.2 as reference and summarize changes in AADT, % trucks, VMT
and average speed during peak and off-peak periods)Baseline (existing) 2017No-Build 2020Build Alternative 1 2020Build Alternative 2 2020
1.5 Construction Activities and ScheduleInclude a discussion of construction activities, schedule, and duration, especially whether construction will last more or less than five years at a specific location. Construction-related criteria pollutants (e.g., PM, NOx, and reactive organic gas [ROG]) and GHG emissions with comparison results among analysis scenarios may need to be addressed under project-level conformity (e.g., for PM hot-spot analysis), NEPA, or CEQA.
Under transportation conformity analysis, construction emissions are considered temporary if the duration of activities lasts five years or less at any individual site. Include the following text: Although construction is planned to last approximately [X] years, no construction activities are anticipated to last more than five years at any individual site. Emissions from construction-related activities are thus considered temporary as defined in 40 CFR 93.123(c)(5); and are not required to be included in PM hot-spot analyses to meet conformity requirements. If construction will last more than five years at one location, include the following text: The overall construction duration is planned to last approximately [X] years, and [CONSTRUCTION ACTIVITY] is anticipated to occur at [LOCATION] for [X] years. Emissions from construction-related activities are thus not considered temporary as defined in 40 CFR 93.123(c)(5) and are required to be included in a PM hot-spot analysis (see Section [X] and Appendix [X]).
Some larger, more complex projects may need to consider traffic impacts due to multiple staging and phasing of construction activities (i.e., multiple opening years for
Version 1.0 (12/15/2017) of Air Quality Report Annotated Outline7

Black Text = Headings Blue Text = Instructions to be deletedRed Text = Boilerplate Purple Text = Examples 1. Proposed Project Description
multi-phase construction) even if construction activities will last fewer than five years at each individual site due to lengthy overall construction and to meet NEPA/CEQA requirements. Furthermore, some large projects that will result in substantial temporary detour emission increases during construction may need to account for those increases to address NEPA and CEQA.
For larger projects, a map and/or table showing the phases of construction activity may be particularly useful. Construction activity information should be provided based on known construction schedules (including staging and phasing) to aid construction emissions calculations.
The length of the project construction period is approximately [X] years, and the following milestone completion dates are anticipated:
Table [X]. Construction Activities and Schedule.
Construction PhaseDescription/
List of Activities
Begin Date Completion Date
Advertisement and Award of Contract
[DATE] -
End of Construction - [DATE]
Version 1.0 (12/15/2017) of Air Quality Report Annotated Outline8

Black Text = Headings Blue Text = Instructions to be deletedRed Text = Boilerplate Purple Text = Examples 2. Regulatory Setting
2. Regulatory SettingMany statutes, regulations, plans, and policies have been adopted at the federal, state, and local levels to address air quality issues related to transportation and other sources. The proposed project is subject to air quality regulations at each of these levels. This section introduces the pollutants governed by these regulations and describes the regulation and policies that are relevant to the proposed project.
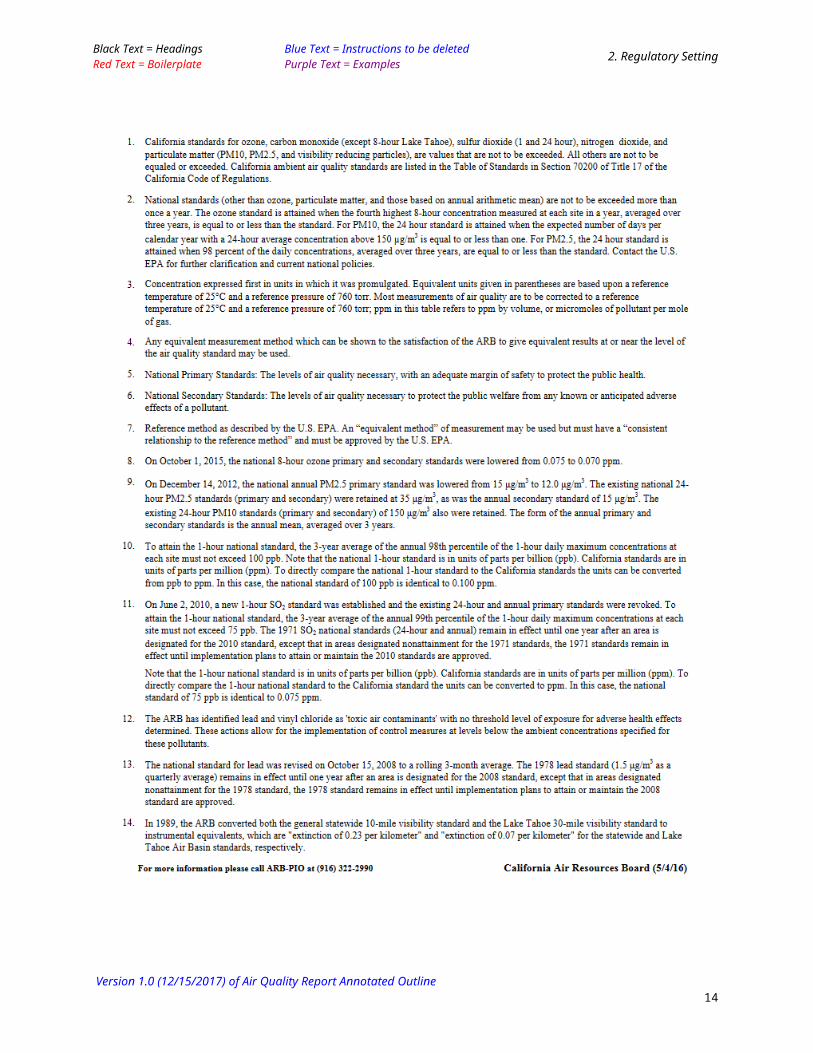
2.1 Pollutant-Specific OverviewInclude the California Air Resources Board (ARB) table of state and federal standards here. Air quality standards and status information must be current at the time the environmental document (Draft or Final) is released for public circulation. The ARB standards table (shown below) is typically updated within a few weeks of changes made by the U.S. Environmental Protection Agency (U.S. EPA) or ARB. Update the table to reflect the current standards at the date of publication of your report. Also include the table below summarizing the sources and health effects of air pollution.
Air pollutants are governed by multiple federal and state standards to regulate and mitigate health impacts. At the federal level, there are six criteria pollutants for which National Ambient Air Quality Standards (NAAQS) have been established: CO, Pb, NO2, O3, PM (PM2.5 and PM10), and SO2. The U.S. EPA has also identified nine priority mobile source air toxics: 1,3-butadiene, acetaldehyde, acrolein, benzene, diesel particulate matter (diesel PM), ethylbenzene, formaldehyde, naphthalene, and polycyclic organic matter (https://www.fhwa.dot.gov/environment/air_quality/air_toxics/policy_and_guidance/msat/). In California, sulfates, visibility reducing particles, hydrogen sulfide, and vinyl chloride are also regulated.
2.1.1 Criteria PollutantsThe Clean Air Act requires the U.S. EPA to set National Ambient Air Quality Standards (NAAQS) for six criteria air contaminants: ozone, particulate matter, carbon monoxide, nitrogen dioxide, lead, and sulfur dioxide. It also permits states to adopt additional or more protective air quality standards if needed. California has set standards for certain pollutants. Table [X] documents the current air quality standards while Table [X] summarizes the sources and health effects of the six criteria pollutants and pollutants regulated in the state of California.
Version 1.0 (12/15/2017) of Air Quality Report Annotated Outline9

Black Text = Headings Blue Text = Instructions to be deletedRed Text = Boilerplate Purple Text = Examples 2. Regulatory Setting
Table [X]. Table of State and Federal Ambient Air Quality Standards. Accessed [DATE], www.arb.ca.gov/research/aaqs/aaqs2.pdf. Note: This table is maintained and updated by the ARB; please check for current version.
Version 1.0 (12/15/2017) of Air Quality Report Annotated Outline10

Black Text = Headings Blue Text = Instructions to be deletedRed Text = Boilerplate Purple Text = Examples 2. Regulatory Setting
Version 1.0 (12/15/2017) of Air Quality Report Annotated Outline11

Black Text = Headings Blue Text = Instructions to be deletedRed Text = Boilerplate Purple Text = Examples 2. Regulatory Setting
Table [X]. State and Federal Criteria Air Pollutant Effects and Sources.
Pollutant Principal Health and Atmospheric Effects Typical Sources
Ozone (O3) High concentrations irritate lungs. Long-term exposure may cause lung tissue damage and cancer. Long-term exposure damages plant materials and reduces crop productivity. Precursor organic compounds include many known toxic air contaminants. Biogenic VOC may also contribute.
Low-altitude ozone is almost entirely formed from reactive organic gases/volatile organic compounds (ROG or VOC) and nitrogen oxides (NOx) in the presence of sunlight and heat. Common precursor emitters include motor vehicles and other internal combustion engines, solvent evaporation, boilers, furnaces, and industrial processes.
Respirable Particulate
Matter (PM10)
Irritates eyes and respiratory tract. Decreases lung capacity. Associated with increased cancer and mortality. Contributes to haze and reduced visibility. Includes some toxic air contaminants. Many toxic and other aerosol and solid compounds are part of PM10.
Dust- and fume-producing industrial and agricultural operations; combustion smoke & vehicle exhaust; atmospheric chemical reactions; construction and other dust-producing activities; unpaved road dust and re-entrained paved road dust; natural sources.
Fine Particulate
Matter (PM2.5)
Increases respiratory disease, lung damage, cancer, and premature death. Reduces visibility and produces surface soiling. Most diesel exhaust particulate matter – a toxic air contaminant – is in the PM2.5 size range. Many toxic and other aerosol and solid compounds are part of PM2.5.
Combustion including motor vehicles, other mobile sources, and industrial activities; residential and agricultural burning; also formed through atmospheric chemical and photochemical reactions involving other pollutants including NOx, sulfur oxides (SOx), ammonia, and ROG.
Carbon Monoxide
(CO)
CO interferes with the transfer of oxygen to the blood and deprives sensitive tissues of oxygen. CO also is a minor precursor for photochemical ozone. Colorless, odorless.
Combustion sources, especially gasoline-powered engines and motor vehicles. CO is the traditional signature pollutant for on-road mobile sources at the local and neighborhood scale.
Nitrogen Dioxide (NO2)
Irritating to eyes and respiratory tract. Colors atmosphere reddish-brown. Contributes to acid rain & nitrate contamination of stormwater. Part of the “NOx” group of ozone precursors.
Motor vehicles and other mobile or portable engines, especially diesel; refineries; industrial operations.
Sulfur Dioxide (SO2)
Irritates respiratory tract; injures lung tissue. Can yellow plant leaves. Destructive to marble, iron, steel. Contributes to acid rain. Limits visibility.
Fuel combustion (especially coal and high-sulfur oil), chemical plants, sulfur recovery plants, metal processing; some natural sources like active volcanoes. Limited contribution possible from heavy-duty diesel vehicles if ultra-low sulfur fuel not used.
Lead (Pb) Disturbs gastrointestinal system. Causes anemia, kidney disease, and neuromuscular and neurological dysfunction. Also a toxic air contaminant and water pollutant.
Lead-based industrial processes like battery production and smelters. Lead paint, leaded gasoline. Aerially deposited lead from older gasoline use may exist in soils along major roads.
Visibility-Reducing Particles
(VRP)
Reduces visibility. Produces haze.NOTE: not directly related to the Regional Haze program under the Federal Clean Air Act, which is oriented primarily toward visibility issues in National Parks and other “Class I” areas. However, some issues and measurement methods are similar.
See particulate matter above.May be related more to aerosols than to solid particles.
Sulfate Premature mortality and respiratory effects. Contributes to acid rain. Some toxic air contaminants attach to sulfate aerosol particles.
Industrial processes, refineries and oil fields, mines, natural sources like volcanic areas, salt-covered dry lakes, and large sulfide rock areas.
Hydrogen Sulfide (H2S)
Colorless, flammable, poisonous. Respiratory irritant. Neurological damage and premature death. Headache, nausea. Strong odor.
Industrial processes such as: refineries and oil fields, asphalt plants, livestock operations, sewage treatment plants, and mines. Some natural sources like volcanic areas and hot springs.
Version 1.0 (12/15/2017) of Air Quality Report Annotated Outline12

Black Text = Headings Blue Text = Instructions to be deletedRed Text = Boilerplate Purple Text = Examples 2. Regulatory Setting
Vinyl Chloride
Neurological effects, liver damage, cancer.Also considered a toxic air contaminant.
Industrial processes.
2.1.2 Mobile Source Air ToxicsControlling air toxic emissions became a national priority with the passage of the Clean Air Act Amendments (CAAA) of 1990, whereby Congress mandated that the U.S. EPA regulate 188 air toxics, also known as hazardous air pollutants. The U.S. EPA has assessed this expansive list in its rule on the Control of Hazardous Air Pollutants from Mobile Sources (Federal Register, Vol. 72, No. 37, page 8430, February 26, 2007), and identified a group of 93 compounds emitted from mobile sources that are part of U.S. EPA’s Integrated Risk Information System (IRIS) (https://www.epa.gov/iris). In addition, the U.S. EPA identified nine compounds with significant contributions from mobile sources that are among the national and regional-scale cancer risk drivers or contributors and non-hazard contributors from the 2011 National Air Toxics Assessment (NATA) (https://www.epa.gov/national-air-toxics-assessment). These are 1,3-butadiene, acetaldehyde, acrolein, benzene, diesel particulate matter (diesel PM), ethylbenzene, formaldehyde, naphthalene, and polycyclic organic matter. While the Federal Highway Administration (FHWA) considers these the priority mobile source air toxics, the list is subject to change and may be adjusted in consideration of future U.S. EPA rules.
The 2007 U.S. EPA rule mentioned above requires controls that will dramatically decrease MSAT emissions through cleaner fuels and cleaner engines. According to an FHWA analysis using U.S. EPA's MOVES2014a model, even if vehicle activity (vehicle-miles traveled, VMT) increases by 45 percent from 2010 to 2050 as forecast, a combined reduction of 91 percent in the total annual emission rate for the priority MSATs is projected for the same time period, as shown in Figure [X].
Version 1.0 (12/15/2017) of Air Quality Report Annotated Outline13

Black Text = Headings Blue Text = Instructions to be deletedRed Text = Boilerplate Purple Text = Examples 2. Regulatory Setting
Figure [X]. Projected National MSAT Trends, 2010-2050 (Source: https://www.fhwa.dot.gov/environment/air_quality/air_toxics/policy_and_guida
nce/msat/).
Version 1.0 (12/15/2017) of Air Quality Report Annotated Outline14

Black Text = Headings Blue Text = Instructions to be deletedRed Text = Boilerplate Purple Text = Examples 2. Regulatory Setting
2.1.3 Greenhouse Gases The term greenhouse gas (GHG) is used to describe atmospheric gases that absorb solar radiation and subsequently emit radiation in the thermal infrared region of the energy spectrum, trapping heat in the Earth’s atmosphere. These gases include carbon dioxide (CO2), methane (CH4), nitrous oxide (N2O), and water vapor, among others. A growing body of research attributes long-term changes in temperature, precipitation, and other elements of Earth’s climate to large increases in GHG emissions since the mid-nineteenth century, particularly from human activity related to fossil fuel combustion. Anthropogenic GHG emissions of particular interest include CO2, CH4, N2O, and fluorinated gases.
GHGs differ in how much heat each traps in the atmosphere (global warming potential, or GWP). CO2 is the most important GHG, so amounts of other gases are expressed relative to CO2, using a metric called “carbon dioxide equivalent” (CO2e). The global warming potential of CO2 is assigned a value of 1, and the warming potential of other gases is assessed as multiples of CO2. For example, the 2007 International Panel on Climate Change Fourth Assessment Report calculates the GWP of CH4 as 25 and the GWP of N2O as 298, over a 100-year time horizon.1 Generally, estimates of all GHGs are summed to obtain total emissions for a project or given time period, usually expressed in metric tons (MTCO2e), or million metric tons (MMTCO2e).2
As evidence has mounted for the relationship of climate changes to rising GHGs, federal and state governments have established numerous policies and goals targeted to improving energy efficiency and fuel economy, and reducing GHG emissions. Nationally, electricity generation is the largest source of GHG emissions, followed by transportation. In California, however, transportation is the largest contributor to GHGs.
At the federal level, the National Environmental Policy Act (NEPA) (42 United States Code [USC] Part 4332) requires federal agencies to assess the environmental effects of their proposed actions prior to making a decision on the action or project.
To date, no national standards have been established for nationwide mobile-source GHG reduction targets, nor have any regulations or legislation been enacted specifically to address climate change and GHG emissions reduction at the project level. However, the U.S. EPA and the National Highway Traffic Safety Administration (NHTSA) issued the first corporate fuel economy (CAFE) standards in 2010, requiring cars and light-duty vehicles to achieve certain fuel economy targets by 2016, with the intention of gradually increasing the targets and the range of vehicles to which they would apply.
California has enacted aggressive GHG reduction targets, starting with Assembly Bill (AB) 32, the California Global Warming Solutions Act of 2006. AB 32 is California’s signature climate change legislation. It set the goal of reducing statewide GHG emissions to 1990 levels by 2020, and required the ARB to develop a Scoping Plan that describes the approach California will take to achieve that goal and to update it every 5 years. In 2015, Governor Jerry Brown enhanced the overall adaptation planning effort 1 See Table 2.14 in IPCC Fourth Assessment Report: Climate Change 2007 (AR4): The Physical Science Basis. Contribution of Working Group I to the Fourth Assessment Report of the Intergovernmental Panel on Climate Change [Solomon, S., D. Qin, M. Manning, Z. Chen, M. Marquis, K.B. Averyt, M. Tignor and H.L. Miller (eds.)]. Cambridge University Press, Cambridge, United Kingdom, and New York, NY, USA. http://www.ipcc.ch/pdf/assessment-report/ar4/wg1/ar4-wg1-chapter2.pdf. 2 See http://www.airquality.org/Businesses/CEQA-Land-Use-Planning/CEQA-Guidance-Tools.
Version 1.0 (12/15/2017) of Air Quality Report Annotated Outline15
Black Text = Headings Blue Text = Instructions to be deletedRed Text = Boilerplate Purple Text = Examples 2. Regulatory Setting
with Executive Order (EO) B-30-15, establishing an interim GHG reduction goal of 40 percent below 1990 levels by 2030, and requiring state agencies to factor climate change into all planning and investment decisions.
Senate Bill (SB) 375, the Sustainable Communities and Climate Protection Act of 2008, furthered state climate action goals by mandating coordinated transportation and land use planning through preparation of sustainable communities strategies (SCS). The ARB sets GHG emissions reduction targets for passenger vehicles for each region. Each regional metropolitan planning organization must include in its regional transportation plan an SCS proposing actions toward achieving the regional emissions reduction targets.3
With these and other State Senate and Assembly bills and executive orders, California advances an innovative and proactive approach to dealing with GHG emissions and climate change.
2.1.4 AsbestosAsbestos is a term used for several types of naturally occurring fibrous minerals that are a human health hazard when airborne. The most common type of asbestos is chrysotile, but other types such as tremolite and actinolite are also found in California. Asbestos is classified as a known human carcinogen by state, federal, and international agencies and was identified as a toxic air contaminant by the ARB in 1986. All types of asbestos are hazardous and may cause lung disease and cancer.
Asbestos can be released from serpentine and ultramafic rocks when the rock is broken or crushed. At the point of release, the asbestos fibers may become airborne, causing air quality and human health hazards. These rocks have been commonly used for unpaved gravel roads, landscaping, fill projects, and other improvement projects in some localities. Asbestos may be released to the atmosphere due to vehicular traffic on unpaved roads, during grading for development projects, and at quarry operations. All of these activities may have the effect of releasing potentially harmful asbestos into the air. Natural weathering and erosion processes can act on asbestos-bearing rock and make it easier for asbestos fibers to become airborne if such rock is disturbed.
Serpentine may contain chrysotile asbestos, especially near fault zones. Ultramafic rock, a rock closely related to serpentinite, may also contain asbestos minerals. Asbestos can also be associated with other rock types in California, though much less frequently than serpentinite and/or ultramafic rock. Serpentinite and/or ultramafic rock are known to be present in 44 of California’s 58 counties. These rocks are particularly abundant in counties of the Sierra Nevada foothills, the Klamath Mountains, and Coast Ranges. The California Department of Conservation, Division of Mines and Geology has developed a map showing the general location of ultramafic rock in the state (www.conservation.ca.gov/cgs/minerals/hazardous_minerals/asbestos/Pages/index.aspx).
3 https://www.arb.ca.gov/cc/sb375/sb375.htm
Version 1.0 (12/15/2017) of Air Quality Report Annotated Outline16

Black Text = Headings Blue Text = Instructions to be deletedRed Text = Boilerplate Purple Text = Examples 2. Regulatory Setting
2.2 Regulations
2.2.1 Federal and California Clean Air Act The Federal Clean Air Act (FCAA), as amended, is the primary federal law that governs air quality while the California Clean Air Act (CCAA) is its companion state law. These laws and related regulations by the U.S. EPA and the (ARB) set standards for the concentration of pollutants in the air. At the federal level, these standards are called National Ambient Air Quality Standards (NAAQS). NAAQS and state ambient air quality standards have been established for six transportation-related criteria pollutants that have been linked to potential health concerns: carbon monoxide (CO), nitrogen dioxide (NO2), ozone (O3), particulate matter (PM), which is broken down for regulatory purposes into particles of 10 micrometers or smaller (PM10) and particles of 2.5 micrometers and smaller (PM2.5), and sulfur dioxide (SO2). In addition, national and state standards exist for lead (Pb), and state standards exist for visibility reducing particles, sulfates, hydrogen sulfide (H2S), and vinyl chloride. The NAAQS and state standards are set at levels that protect public health with a margin of safety, and are subject to periodic review and revision. Both state and federal regulatory schemes also cover toxic air contaminants (air toxics); some criteria pollutants are also air toxics or may include certain air toxics in their general definition.
2.2.2 Transportation ConformityThe conformity requirement is based on Federal Clean Air Act Section 176(c), which prohibits the U.S. Department of Transportation (USDOT) and other federal agencies from funding, authorizing, or approving plans, programs, or projects that do not conform to State Implementation Plan (SIP) for attaining the NAAQS. “Transportation Conformity” applies to highway and transit projects and takes place on two levels: the regional—or, planning and programming level—and the project level. The proposed project must conform at both levels to be approved.
Conformity requirements apply only in nonattainment and “maintenance” (former nonattainment) areas for the NAAQS, and only for the specific NAAQS that are or were violated. The U.S. EPA regulations at 40 CFR 93 govern the conformity process. Conformity requirements do not apply in unclassifiable/attainment areas for NAAQS and do not apply at all for state standards regardless of the status of the area.
Regional conformity is concerned with how well the regional transportation system supports plans for attaining the NAAQS for carbon monoxide (CO), nitrogen dioxide (NO2), ozone (O3), particulate matter (PM10 and PM2.5), and in some areas (although not in California), sulfur dioxide (SO2). California has attainment or maintenance areas for all of these transportation-related “criteria pollutants” except SO2, and also has a nonattainment area for lead (Pb); however, lead is not currently required by the FCAA to be covered in transportation conformity analysis. Regional conformity is based on emission analysis of Regional Transportation Plans (RTPs) and Federal Transportation Improvement Programs (FTIPs) that include all transportation projects planned for a region over a period of at least 20 years (for the RTP), and 4 years (for the FTIP). RTP and FTIP conformity uses travel demand and emission models to determine whether or
Version 1.0 (12/15/2017) of Air Quality Report Annotated Outline17

Black Text = Headings Blue Text = Instructions to be deletedRed Text = Boilerplate Purple Text = Examples 2. Regulatory Setting
not the implementation of those projects would conform to emission budgets or other tests at various analysis years showing that requirements of the Clean Air Act and the SIP are met. If the conformity analysis is successful, the Metropolitan Planning Organization (MPO), FHWA, and Federal Transit Administration (FTA), make the determinations that the RTP and FTIP are in conformity with the SIP for achieving the goals of the Clean Air Act. Otherwise, the projects in the RTP and/or FTIP must be modified until conformity is attained. If the design concept, scope, and “open-to-traffic” schedule of a proposed transportation project are the same as described in the RTP and the TIP, then the proposed project meets regional conformity requirements for purposes of project-level analysis.
Project-level conformity is achieved by demonstrating that the project comes from a conforming RTP and TIP and the project has a design concept and scope4 that has not changed significantly from those in the RTP and TIP. If the design concept and scope have changed substantially from that used in the RTP Conformity analysis, RTP and TIP amendments may be needed. Project-level conformity also needs to demonstrate that project analyses have used the latest planning assumptions and U.S. EPA-approved emissions models; the project complies with any control measures in the SIP in PM areas. Furthermore, additional analyses (known as hot-spot analyses) may be required for projects located in CO and PM nonattainment or maintenance areas to examine localized air quality impacts.
2.2.3 National Environmental Policy Act (NEPA)NEPA requires that policies and regulations administered by the federal government are consistent with its environmental protection goals. NEPA also requires that federal agencies use an interdisciplinary approach to planning and decision-making for any actions that could impact the environment. It requires environmental review of federal actions including the creation of Environmental Documents (EDs) that describe the environmental effects of a proposed project and its alternatives (including a section on air quality impacts).
2.2.4 California Environmental Quality Act (CEQA)CEQA5 is a statute that requires state and local agencies to identify the significant environmental impacts of their actions and to avoid or mitigate those impacts, if feasible. CEQA documents address CCAA requirements for transportation projects. While state standards are often more strict than federal standards, the state has no conformity process.
2.2.5 LocalThe U.S. EPA has delegated responsibility to air districts to establish local rules to protect air quality. Caltrans’ Standard Specification 14-9.02 (Caltrans, 2015) requires
4 "Design concept" means the type of facility that is proposed, such as a freeway or arterial highway. "Design scope" refers to those aspects of the project that would clearly affect capacity and thus any regional emissions analysis, such as the number of lanes and the length of the project.5 For general information about CEQA, see: http://resources.ca.gov/ceqa/more/faq.html.
Version 1.0 (12/15/2017) of Air Quality Report Annotated Outline18

Black Text = Headings Blue Text = Instructions to be deletedRed Text = Boilerplate Purple Text = Examples 2. Regulatory Setting
compliance with all applicable air quality laws and regulations including local and air district ordinances and rules. Include a brief description of any applicable air quality laws and regulations, such as a rule that is part of a SIP for conformity purposes and thereby applies to the study area.
Version 1.0 (12/15/2017) of Air Quality Report Annotated Outline19

Black Text = Headings Blue Text = Instructions to be deletedRed Text = Boilerplate Purple Text = Examples 3. Affected Environment
3. Affected EnvironmentProvide a concise description of the existing social, economic, and environmental setting for the area affected by all project alternatives.
The topography of a region can substantially impact air flow and resulting pollutant concentrations. California is divided into 15 air basins with similar topography and meteorology to better manage air quality throughout the state. Each air basin has a local air district that is responsible for identifying and implementing air quality strategies to comply with ambient air quality standards.
The [PROJECT NAME] project site is located in proximity to [COMMUNITY NAME] in [COUNTY NAME], an area within the [AIR BASIN NAME], which includes [OTHER COUNTY NAMES]. Air quality regulation in [AIR BASIN NAME] is administered by [MANAGEMENT DISTRICT NAME]. Current and forecasted population for [COUNTY NAME] is [POPULATION ESTIMATES] and the county’s economy is largely driven by [ECONOMY SECTOR NAMES].
3.1 Climate, Meteorology, and TopographyDiscuss relevant air basin climate, meteorology, and topography. Include discussions regarding inversions, wind, rainfall, unusual or unique weather patterns, average temperature, atmospheric stability, and conditions leading to high pollutants or exceedances, as applicable. Include relevant graphics that help illustrate conditions, such as a wind rose. Present meteorological information from a nearby monitor. U.S. EPA’s PM hot-spot analysis guidance6 offers methods for identifying one or more representative meteorological monitors near a project site.
Meteorology (weather) and terrain can influence air quality. Certain weather parameters are highly correlated to air quality, including temperature, the amount of sunlight, and the type of winds at the surface and above the surface. Winds can transport ozone and ozone precursors from one region to another, contributing to air quality problems downwind of source regions. Furthermore, mountains can act as a barrier that prevents ozone from dispersing.
The [NAME OF CLOSEST METEOROLOGICAL STATION] climatological station, maintained by [NAME OF AGENCY], is located near the project site and is representative of meteorological conditions near the project. Figure [X] shows a wind rose illustrating the predominant wind patterns near the project.7 The climate of the project area is generally Mediterranean in character, with cool winters (average [AVERAGE JANUARY TEMPERATURE] °Fahrenheit in January) and warm, dry summers (average [AVERAGE JULY TEMPERATURE] °Fahrenheit in July). Temperature inversions are common, affecting localized pollutant concentrations in the winter and enhancing ozone formation in the summer. Mountains averaging [AVERAGE MOUNTAIN HEIGHT] feet in altitude tend to
6 See https://www.epa.gov/state-and-local-transportation/project-level-conformity-and-hot-spot-analyses. 7 For project sites with no appropriate wind roses available, describe the general predominant wind patterns in the project area.
Version 1.0 (12/15/2017) of Air Quality Report Annotated Outline20

Black Text = Headings Blue Text = Instructions to be deletedRed Text = Boilerplate Purple Text = Examples 3. Affected Environment
trap pollutants in the region by limiting air flow. Annual average rainfall is [AVERAGE RAINFALL] inches (at [AIRPORT NAME] airport), mainly falling during the winter months.
Figure [X]. Predominant Wind Patterns Near the Project.
3.2 Existing Air QualityThis section summarizes existing air quality conditions near the proposed project area. It includes attainment statuses for criteria pollutants, describes local ambient concentrations of criteria pollutants for the past [X] years, and discusses MSAT and GHG emissions. Identify the closest air quality monitor(s). Include a map showing the locations of air monitoring sites relative to the proposed project site.
Figure [X]. Map of Air Quality Monitoring Stations Located Near the Project.
3.2.1 Criteria Pollutants and Attainment StatusList designation (i.e., attainment, nonattainment, maintenance), classification (i.e., basic, marginal, moderate, extreme; see www.epa.gov/airquality/greenbook/define.html for classification definitions), and, where applicable, the averaging period (e.g., 8-hour) for federal and state pollutant standards in a table (see below). In one or more additional tables, list ambient pollutant concentrations from one or more nearby monitors and violations (a minimum of three years is required; a minimum of five years of data must be provided if a quantitative hot-spot analysis is done). Note whether data are from the previous three to five years; if older data are used, provide written justification for the use of the data. Be sure to include the most up-to-date status in the table.
Version 1.0 (12/15/2017) of Air Quality Report Annotated Outline21
Insert a wind rose illustrating the
predominant wind patterns near the project
Insert a map showing the air monitoring sites
near the project

Black Text = Headings Blue Text = Instructions to be deletedRed Text = Boilerplate Purple Text = Examples 3. Affected Environment
Table [X] lists the state and federal attainment status for all regulated pollutants. Summarize relevant attainment statuses. Table [X] lists air quality trends in data collected at [STATION NAME] for the past [X] years. Provide written justification if older data (i.e., not from the previous three to five years) are used. For example: Data from [STATION NAME] are included due to the proximity of the site to the project; however, data for [STATION NAME] are for [YEAR – YEAR] because monitoring ended on [DATE] at the site. Describe the air quality monitoring station(s) used to represent air quality at the project site and explain why the monitoring site(s) are representative of the project location. Briefly summarize the historical data provided in Table [X]. Include a table showing the status of U.S. EPA-approved SIPs that are relevant to the proposed project; include the SIP objective and the status of budget adequacy findings by the U.S. EPA on any submitted implementation plans (Table [X]).
Table [X]. State and Federal Attainment Status.
Pollutant State Attainment Status Federal Attainment Status
Ozone (O3)Nonattainment
AttainmentDelete what doesn’t apply. Identify areas if multiple designations apply.
Nonattainment (Extreme, Severe, Serious, Moderate, Marginal, Basic)
Attainment – MaintenanceAttainment – Unclassified
Delete what doesn’t apply. Identify areas if multiple designations apply.
Respirable Particulate
Matter (PM10)Fine
Particulate Matter (PM2.5)
Carbon Monoxide
(CO)Nitrogen
Dioxide (NO2)Sulfur
Dioxide (SO2)Lead (Pb)Visibility-Reducing Particles
N/A
Sulfates N/AHydrogen
Sulfide N/A
Vinyl Chloride N/A
Version 1.0 (12/15/2017) of Air Quality Report Annotated Outline22

Black Text = Headings Blue Text = Instructions to be deletedRed Text = Boilerplate Purple Text = Examples 3. Affected Environment
Table [X]. Air Quality Concentrations for the Past [X] Years Measured at [NAME OF STATION]. If documenting air quality concentrations at multiple monitors, provide data for each monitor in a separate table and label tables [X]a, [X]b, [X]c, etc.
Pollutant Standard Year 1 Year 2 Year 3 Year 4 Year 5OzoneMax 1-hr concentration Conc. Conc. Conc. Conc. Conc.No. days exceeded: State 0.09 ppm # # # # #
Max 8-hr concentration Conc. Conc. Conc. Conc. Conc.No. days exceeded: State Federal
0.070 ppm0.070 ppm
##
##
##
##
##
Carbon MonoxideMax 1-hr concentration Conc. Conc. Conc. Conc. Conc.No. days exceeded: State Federal
20 ppm35 ppm
##
##
##
##
##
Max 8-hr concentration Conc. Conc. Conc. Conc. Conc.No. days exceeded: State Federal
9.0 ppm9 ppm
##
##
##
##
##
PM10
Max 24-hr concentration Conc. Conc. Conc. Conc. Conc.No. days exceeded: State Federal
50 μg/m3
150 μg/m3##
##
##
##
##
Max annual concentration Conc. Conc. Conc. Conc. Conc.No. days exceeded: State 20 μg/m3 # # # # #
PM2.5
Max 24-hr concentration Conc. Conc. Conc. Conc. Conc.No. days exceeded: Federal 35 μg/m3 # # # # #
Max annual concentration Conc. Conc. Conc. Conc. Conc.No. days exceeded: State Federal
12 μg/m3
12.0 μg/m3
##
##
##
##
##
Nitrogen DioxideMax 1-hr concentration Conc. Conc. Conc. Conc. Conc.
Version 1.0 (12/15/2017) of Air Quality Report Annotated Outline23

Black Text = Headings Blue Text = Instructions to be deletedRed Text = Boilerplate Purple Text = Examples 3. Affected Environment
Pollutant Standard Year 1 Year 2 Year 3 Year 4 Year 5No. days exceeded: State Federal
0.18 ppm100 ppb
##
##
##
##
##
Max annual concentration Conc. Conc. Conc. Conc. Conc.No. days exceeded: State Federal
0.030 ppm
53 ppb##
##
##
##
##
Table [X]. Status of SIPs Relevant to the Project Area.
Name/Description Status
3.2.2 Mobile Source Air ToxicsDiscuss priority MSAT pollutant sources in the project area. These may include rail yards, transit terminals, or other nearby facilities serving on- or off-road motor vehicles. Ambient MSAT data are available from ARB’s website (http://www.arb.ca.gov/adam/toxics/toxics.html).
3.2.3 Greenhouse Gas and Climate ChangeCO2, as part of the carbon cycle, is an important compound for plant and animal life, but also accounted for 84% of California’s total GHG emissions in 2015. Transportation, primarily on-road travel, is the single largest source of CO2 emissions in the state.
The proposed project is located in [CITY AND COUNTY], [and is] or [but is not] included in the [TITLE] Regional Transportation Plan/Sustainable Communities Strategy (RTP/SCS).
Identify the Regional Transportation Plan/Sustainable Communities Strategy (RTP/SCS) that applies to the region in which the proposed project is located. Identify regional emissions from applicable RTP/SCS and any local climate action plan. What year do they use as their baseline and what have they analyzed as existing emissions for the region?
Version 1.0 (12/15/2017) of Air Quality Report Annotated Outline24

Black Text = Headings Blue Text = Instructions to be deletedRed Text = Boilerplate Purple Text = Examples 3. Affected Environment
3.3 Sensitive ReceptorsDescribe land uses surrounding the project, especially with regard to traffic generators and sensitive receptors. Sensitive receptors include residential areas, schools, hospitals, other health care facilities, child/day care facilities, parks, and playgrounds. Include a map and/or table documenting nearby sensitive receptors. Discuss the proximity of the sensitive receptors to traffic. For small projects, document sensitive receptors within 500 feet (~150 meters) of the project, since this is the zone of primary concern. For larger projects, document sensitive receptors within 2,000 feet (~600 meters) of the project.
On the basis of research showing that the zone of greatest concern near roadways is within 500 feet (or 150 meters), sensitive receptors within 500 feet (or 150 meters) have been identified and are documented in Table [X]. Given the large size of the project and its potential to influence receptors at greater distances, sensitive receptors within 2000 feet are also listed. Figure [X] shows the locations of sensitive receptors relative to the project site.
Table [X]. Sensitive Receptors Located Within [DISTANCE] of the Project Site.
Receptor Description Distance Between Receptor and Project (ft)
Apple Elementary K-6 Elementary school with 800 students 450
Figure [X]. Sensitive Receptors Located Near the Proposed Project.
3.4 Conformity StatusTransportation Conformity applies in areas that are “nonattainment” or “attainment-maintenance” for the NAAQS, and only for the standards that are or previously were violated. The number of standards violated varies by area; conformity analysis must be done for all of the standards that are or were violated (see Table of Areas Subject to
Version 1.0 (12/15/2017) of Air Quality Report Annotated Outline25
Insert a map showing sensitive receptors
near the project

Black Text = Headings Blue Text = Instructions to be deletedRed Text = Boilerplate Purple Text = Examples 3. Affected Environment
Transportation Conformity Requirements: http://www.dot.ca.gov/hq/env/air/pages/conftable.htm). Conformity analysis and determinations are done at regional and project-level scales. From a practical viewpoint, the pollutant analyses addressed by project-level conformity focus on CO and PM hot-spots; regional conformity pollutant analyses can involve CO, PM, and ozone precursor (VOC and NOx) emissions.
3.4.1 Regional Conformity Refer to the Transportation Air Quality Conformity Findings Checklist (www.dot.ca.gov/ser/downloads/AirQualityConformity/conformitychklst.docx) and the conformity flowchart (www.dot.ca.gov/ser/vol1/sec3/physical/ch11air/chap11.htm) to assess regional conformity. The conformity checklist must be included to address NEPA, regardless of whether the project is subject to conformity. The following instructions and boilerplate text are from the conformity flowchart and can be included in this section as appropriate.
Discuss whether the project is exempt from conformity analysis. Certain types of projects are exempt from conformity requirements; these project types are found by the U.S. EPA to be neutral from an air quality or emissions standpoint, and are listed in the Conformity Regulations at 40 CFR 93.126, 40 CFR 92.127, and 40 CFR 92.128. If a project fits one of the listed types, it may need little or no conformity analysis, and does not need to be individually listed and considered in regional conformity modeling. If so, briefly state that the project is exempt and describe why it is exempt.
If the project is not exempt from conformity analysis, explain whether the project falls in a nonattainment or maintenance area for any federal air quality standards. If the project is not located in a nonattainment or maintenance area, a conformity analysis is not needed. In this case, insert the following text and skip the rest of this section: The project is located in an attainment/unclassified area for all current National Ambient Air Quality Standards (NAAQS). Therefore, conformity requirements do not apply.
If the project is in a nonattainment or maintenance area, determine whether the project is exempt from regional conformity analysis according to 40 CFR 93.127. If the project is exempt under 40 CFR 93.127, insert the following text: This project is exempt from regional (40 CFR 93.127) conformity requirements. Separate listing of the project in the Regional Transportation Plan and Transportation Improvement Program, and their regional conformity analyses, is not necessary. The project will not interfere with timely implementation of Transportation Control Measures identified in the applicable SIP and regional conformity analysis.
If the project is not exempt from regional conformity requirements per 40 CFR 93.127, determine whether the project is in an area that has a Metropolitan Planning Organization. If the project is in an area with an MPO, include the following text: The proposed project is listed in the [TITLE AND YEAR] financially constrained Regional Transportation Plan [INCLUDE AMENDMENT NUMBER IF APPLICABLE] which was found to conform by [MPO OR RTPA] on [DATE], and FHWA and FTA made a regional conformity determination finding on [DATE]. The project is also included in [MPO or RTPA] financially constrained [YEAR] Regional Transportation Improvement Program [INCLUDE AMENDMENT NUMBER IF APPLICABLE], pages [#]. The [MPO or RTPA and YEAR] Regional
Version 1.0 (12/15/2017) of Air Quality Report Annotated Outline26

Black Text = Headings Blue Text = Instructions to be deletedRed Text = Boilerplate Purple Text = Examples 3. Affected Environment
Transportation Improvement Program was determined to conform by FHWA and FTA on [DATE]. The design concept and scope of the proposed project is consistent with the project description in the [YEAR] RTP, [YEAR] RTIP, and the “open to traffic” assumptions of the [MPO’S or RTPA’S] regional emissions analysis. Conformity status information is summarized in Table [X]. Photocopies of relevant pages from the RTP and TIP are included in Appendix [X].
If the project is not in an area that has an MPO, a regional conformity analysis must be carried out in full. The official report that supports a project-level conformity determination is the Air Quality Conformity Report, not the air quality study; however, the findings from the Air Quality Conformity Report should be summarized here. If the project is not in an area that has an MPO, include the following text: A regional conformity analysis covering the [NAME OF NONATTAINMENT AREA] for [IDENTIFY POLLUTANT(S) – O3, PM2.5, PM10, and Pb are the only pollutants in these areas in California as of March 2015] was carried out that includes this project, and all reasonably foreseeable and financially constrained regional significant projects for at least 20 years from the date that the analysis started. The analysis used the latest planning assumptions, and the most recent emission models and appropriate analysis methods, as determined by Interagency Consultation on [DATE OF MEETING]. Based on this analysis, the region will be in conformity with the SIP, including this project, based on the [EMISSION BUDGET, PROJECT/NO PROJECT, AND/OR PROJECT/BASELINE] conformity test(s) and analysis procedures, as described in 40 CFR 93.109(1) [OR THE MOST RECENT SECTION NUMBER]. The design concept and scope of the proposed project is consistent with the project design concept and scope used in the regional conformity analysis. The TCM Timely Implementation evaluation was reviewed and concurred with by Interagency Consultation on [DATE OF MEETING].
Table [X]. Status of Plans Related to Regional Conformity.
MPO Plan/TIPDate of
adoption by MPO
Date of Approval by
FHWALast
Amendment
Date of Approval by
FHWA of Last Amendment
Regional Transportation Plan
Amendment #__
Transportation Improvement Program (FSTIP approval)
Amendment #__
If the project is in an isolated rural conformity area, a narrative description of the isolated rural area’s status, with reference to the regional analysis completed for the project, is needed.
3.4.2 Project-Level Conformity A project-level analysis usually includes documentation that the project’s design concept, scope, and open-to-traffic date match those assumed for regional analysis
Version 1.0 (12/15/2017) of Air Quality Report Annotated Outline27

Black Text = Headings Blue Text = Instructions to be deletedRed Text = Boilerplate Purple Text = Examples 3. Affected Environment
purposes (in the RTP and TIP) and a hot-spot analysis for carbon monoxide and/or particulate matter if the project is located in a nonattainment or maintenance area for either pollutant. CFR 93.116 states “The FHWA/FTA project must not cause or contribute to any new localized CO, PM10, and/or PM2.5 violations, increase the frequency or severity of any existing CO, PM10, and/or PM2.5 violations, or delay timely attainment of any NAAQS or any required interim emission reductions or other milestones in CO, PM10, and PM2.5 nonattainment and maintenance areas.” Projects must be modified to meet hot-spot analysis tests. State whether the project is in a CO and/or PM nonattainment or maintenance area. If hot-spot analyses are required, interagency consultation is required to determine appropriate methods; this should be documented in Section 3.4.3. Build and No-Build emissions must be modeled, both with and without any mitigation measures committed to in the RTP. If the area is currently or will be in a conformity lapse, describe the situation and schedule.
Also document whether the project is already designated as a TCM in the SIP and, if so, whether it implements the TCM in a timely manner and whether the project implements SIP control measures or measures relied upon in the RTP/TIP regional conformity analysis. If not, document that the project does not interfere with any TCMs.
The project is located in [NONATTAINMENT/MAINTENANCE AREA] and is in [NONATTAINMENT OR MAINTENANCE] for [POLLUTANT], thus a project-level hot-spot analysis for [POLLUTANT] is required under 40 CFR 93.109. The project is designated as a TCM in the [STATE IMPLEMENTATION PLAN], complies with all PM2.5 and PM10 measures in the plan, and implements measures relied upon in the RTP/TIP regional conformity analysis in a timely matter. The project does not cause or contribute to any new localized CO, PM2.5, and/or PM10 violations, or delay timely attainment of any NAAQS or any required interim emission reductions or other milestones during the timeframe of the transportation plan (or regional emissions analysis).
3.4.3 Interagency ConsultationDescribe the interagency consultation process, including when the consultation took place, the format of the consultation (e.g., in-person meeting at specified location or email exchange), who participated, what was discussed, and what the outcomes of the discussion were. It may be useful to summarize this information in a table (see example below). Documentation regarding interagency consultation, such as meeting minutes, should be included in an appendix.
Table [X]. Summary of Interagency Consultation Process.
Date Format Participants Discussion Summary Outcomes
Version 1.0 (12/15/2017) of Air Quality Report Annotated Outline28

Black Text = Headings Blue Text = Instructions to be deletedRed Text = Boilerplate Purple Text = Examples 3. Affected Environment
3.5 NEPA Analysis/RequirementNEPA applies to all projects that receive federal funding or involve a federal action. NEPA requires that all reasonable alternatives for the project are rigorously explored and objectively evaluated. For NEPA, the air quality study should address federal criteria pollutants (ozone, PM2.5, PM10, CO, NO2, SO2, and lead), MSATs, and asbestos. Analysis/documentation requirements vary by pollutant (see the table in Section 4.1); for example, in some cases documentation that the project is listed in a conforming RTP and TIP is sufficient, while in other cases emissions modeling may be required. If construction will last more than three years and/or will substantially impact traffic due to detours, road closures, and temporary terminations, then impacts of the resulting traffic flow changes may need to be analyzed. For NEPA analyses, analysts should compare emissions from the future year Build scenario to those from the future year No-Build scenario.
3.6 CEQA Analysis/RequirementCEQA applies to most California transportation projects (certain projects are statutorily exempt). CEQA requires that a range of reasonable alternatives to the project that would feasibly attain most of the basic objectives of the project but would avoid or substantially lessen any of the significant effects of the project are explored. For CEQA, the air quality study should address pollutants for which California has established air quality standards (ozone, PM10, PM2.5, carbon monoxide, NO2, SO2, lead, visibility-reducing particles, sulfates, hydrogen sulfide, and vinyl chloride), as well as GHGs, MSATs, and asbestos. Similar to NEPA, analysis/documentation requirements for CEQA vary by pollutant (see the table in Section 4.1); ranging from a narrative describing that the pollutant is typically not a transportation issue to an emissions analysis. If construction will last more than three years and/or will substantially impact traffic due to detours, road closures, and temporary terminations, then impacts of the resulting traffic flow changes may need to be analyzed. For CEQA analyses, analysts should compare emissions from the future year Build scenarios to emissions from the Baseline (existing conditions). The difference between future No Build and Build may help inform significance determinations, which will be made by the PDT.
Version 1.0 (12/15/2017) of Air Quality Report Annotated Outline29

Black Text = Headings Blue Text = Instructions to be deletedRed Text = Boilerplate Purple Text = Examples
4. Environmental Consequences
4. Environmental ConsequencesThere is a range of analysis methods for project-level air quality. In some cases, a generally accepted, documented sequence proceeds from a qualitative screening to a quantitative modeling analysis. In others, an appropriate method must be more fully documented because there may be some disagreement among experts as to the best method to apply to a specific situation. If a modeling procedure applicable to the pollutant of interest is described in U.S. EPA’s modeling guidance (40 CFR Part 51, Appendix W), that method can be used. In some cases, a different documented method may also be accepted by the U.S. EPA or local air quality authorities; in these cases, interagency consultation is required to determine the most appropriate method for the specific project.
In general, results from both Build and future No-Build (future No-Build is the NEPA and conformity baseline) alternatives must be presented at similar levels of detail to address NEPA, and all alternatives must be compared to existing conditions (the CEQA baseline) to address CEQA. Use of “latest planning assumptions” regarding traffic, vehicle fleet, and emission modeling must be documented, and traffic data should be shown to be traceable to the traffic volumes and speeds used in the regional model. Traffic data and projections for all alternatives should be consistent with the traffic data presented in Section 1. Detail all analysis steps and results such that the analyses could be reproduced by others. Most air quality standards that are relevant at the project scale (with the exception of CO) are based on standards with a 24-hr or longer averaging time, so traffic data should include AADT. For CO, since the worst-case 1-hr and 8-hr periods are the focus, hourly traffic data for the peak day are needed.
This section describes the methods, impact criteria, and results of air quality analyses of the proposed project. Analyses in this report were conducted using methodology and assumptions that are consistent with the requirements of NEPA, CEQA, the CAAAs of 1990, and the CCAA of 1988. The analyses also use guidelines and procedures provided in applicable air quality analysis protocols, such as the Transportation Project-Level Carbon Monoxide Protocol (CO Protocol) (Garza et al., 1997), Transportation Conformity Guidance for Quantitative Hot-Spot Analyses in PM10 and PM2.5 Nonattainment and Maintenance Areas (U.S. EPA, 2015), and the FHWA Updated Interim Guidance on Air Toxics Analysis in NEPA Documents (FHWA, 2016).
4.1 Impact CriteriaProject-related emissions will have an adverse environmental impact if they result in pollutant emissions levels that either create or worsen a violation of an ambient air quality standard (identified in Table [X]) or contribute to an existing air quality violation.
Table [X] summarizes project-level air quality analyses under transportation conformity, NEPA, and CEQA, and the impact criteria that determine whether a project meets air quality requirements or may have an adverse impact on air quality.
Version 1.0 (12/15/2017) of Air Quality Report Annotated Outline30

Black Text = Headings Blue Text = Instructions to be deletedRed Text = Boilerplate Purple Text = Examples 4. Environmental Consequences
Table [X]. Summary of Project-Level (Operational) Air Quality Analyses that May Be Needed to Address Conformity, NEPA, and CEQA (DELETE THIS TABLE).
For Conformity: Study only pollutants for which the area is in nonattainment or maintenance and use the latest U.S. EPA-approved version of EMFAC or CT-EMFAC for emissions analyses (http://www.arb.ca.gov/msei/modeling.htm).For NEPA and CEQA: Address CO, O3, PM10, and PM2.5, NO2, and other pollutants as relevant. Use appropriate version of EMFAC or CT-EMFAC to address NEPA and/or CEQA for criteria pollutants and MSAT analyses. For NEPA: General practice for emissions analysis focuses on comparison of Build scenario(s) and No-Build scenario.For CEQA: General practices for emissions analysis focuses on comparison of Build scenario(s) and Baseline (Existing Condition) scenario. The difference between future NO Build and Build may help inform significance determinations, which will be made by the PDT.
Pollutant Conformity NEPA CEQA
Ozone (O3)
O3 is a regional pollutant with indirect impacts and it is infeasible to model project-level impacts on O3 due to its photochemical nature. In O3 nonattainment and maintenance areas, document that the project is listed in the conforming RTP and TIP. In isolated rural areas, document that project is in a regional conformity analysis showing that Interim or Emission Budget tests are met. Analysis is usually only done when a regionally significant project is proposed. No hot-spot for O3.
O3 is a regional pollutant with indirect impacts and it is infeasible to model project-level impacts on O3 due to its photochemical nature. A precursor emissions burden analysis can be performed using EMFAC or CT-EMFAC (for NOx and VOC).Modeling Tools: EMFAC/CT-EMFAC
O3 is a regional pollutant with indirect impacts and it is infeasible to model project-level impacts on O3 due to its photochemical nature. A precursor emissions burden analysis can be performed using EMFAC or CT-EMFAC (for NOx and VOC).Modeling Tools: EMFAC/CT-EMFAC
Version 1.0 (12/15/2017) of Air Quality Report Annotated Outline31

Black Text = Headings Blue Text = Instructions to be deletedRed Text = Boilerplate Purple Text = Examples 4. Environmental Consequences
Pollutant Conformity NEPA CEQA
PM10
If the project is subject to conformity requirements (within a nonattainment or maintenance area), refer to 40 CFR 93.123(b) to determine if the project is a POAQC. State that the U.S. EPA guidance for PM hot-spot analysis and interagency consultation were used to determine whether the project is a POAQC and document the interagency consultation process. POAQC projects located in PM10 nonattainment/maintenance areas require dispersion modeling (PM hot-spot analysis) and use of the U.S. EPA’s 2015 Quantitative PM Hot-Spot Analysis Guidance8. Hot-spot analysis involves dispersion modeling (e.g., using AERMOD9) and must include direct vehicle emissions estimates from EMFAC/CT-EMFAC and paved road dust emissions estimates. ARB’s data source for calculating road dust emissions is recommended. The project must be exempt from all conformity analyses per 40 CFR 93.126 or 128 or modeling must show that the project does not cause or contribute to a NAAQS violation.Modeling Tools/Guidance.: U.S. EPA Quantitative PM Hot-Spot Guidance, EMFAC/CT-EMFAC, AERMOD (AERMOD View)
A comparative emissions analysis is needed and the analysis relies on modeling exhaust emissions from EMFAC or CT-EMFAC and road dust emissions estimates. ARB’s data source for calculating road dust emissions is recommended.Modeling Tools: EMFAC/CT-EMFAC,
Prepare a project-level comparative emissions analysis, including exhaust emissions estimates from EMFAC or CT-EMFAC and road dust emissions estimates. ARB’s data source for calculating road dust emissions is recommended.Modeling Tools: EMFAC/CT-EMFAC,
8 Transportation Conformity Guidance for Quantitative Hot-spot Analyses in PM2.5 and PM10 Nonattainment and Maintenance Areas; see http://www3.epa.gov/otaq/stateresources/transconf/projectlevel-hotspot.htm.9 www.epa.gov/ttn/scram/dispersion_prefrec.htm#aermod
Version 1.0 (12/15/2017) of Air Quality Report Annotated Outline32

Black Text = Headings Blue Text = Instructions to be deletedRed Text = Boilerplate Purple Text = Examples 4. Environmental Consequences
Pollutant Conformity NEPA CEQA
PM2.5
For PM2.5 direct vehicle emissions (exhaust, tire wear, and brake wear from on-road vehicles), follow the same conformity requirements for PM10. Non-direct vehicle emissions of PM2.5 (road dust) are typically considered as well (follow the same analysis approach for PM10). However, note that road dust must be considered in PM2.5 hot-spot analyses only if EPA or state air agency has made a finding that such emissions are a significant contributor to the PM2.5 air quality problem in a given nonattainment or maintenance area.Modeling Tools/Guidance: U.S. EPA Quantitative PM Hot-Spot Guidance, EMFAC/CT-EMFAC, AERMOD (AERMOD View)
For PM2.5 direct vehicle emissions (exhaust, tire wear, and brake wear from on-road vehicles), follow the same requirements for PM10. Non-direct vehicle emissions of PM2.5 (road dust) are typically considered as well (follow the same analysis approach for PM10).Modeling Tools: EMFAC/CT-EMFAC
For PM2.5 direct vehicle emissions (exhaust, tire wear, and brake wear from on-road vehicles), follow the same requirements for PM10. Non-direct vehicle emissions of PM2.5 (road dust) are typically considered as well (follow the same analysis approach for PM10).Modeling Tools: EMFAC/CT-EMFAC
CO
Use the Caltrans/UC Davis 1997 CO Protocol (http://www.dot.ca.gov/hq/env/air/pages/coprot.htm) if project is located in a CO nonattainment or maintenance area. If the qualitative screening procedure indicates that a quantitative analysis is required, the latest U.S. EPA-approved version of EMFAC or CT-EMFAC must be used. In cases where an emissions analysis is not sufficient and additional screening is needed, use CALINE4 to perform dispersion modeling. Refer to Appendix B for guidance on the use of CALINE4 (http://www.dot.ca.gov/hq/env/air/main_sections/analysistools.htm). The project cannot cause or worsen a violation of the NAAQS.Modeling Tools: CO Protocol, EMFAC/CT-EMFAC, CALINE4 (CL4)
The Caltrans/UC Davis 1997 CO Protocol (http://www.dot.ca.gov/hq/env/air/pages/coprot.htm) is commonly used for CO analyses. If the qualitative screening procedure indicates that a quantitative analysis is required, follow modeling instructions for using CALINE4 with EMFAC emissions factors. CT-EMFAC may also be used.Modeling Tools: CO Protocol, EMFAC/CT-EMFAC, CALINE4 (CL4)
The Caltrans/UC Davis 1997 CO Protocol (http://www.dot.ca.gov/hq/env/air/pages/coprot.htm) is commonly used for CO analyses. If the qualitative screening procedure indicates that a quantitative analysis is required, follow modeling instructions for using CALINE4 with EMFAC emissions factors. CT-EMFAC may also be used.Modeling Tools: CO Protocol, EMFAC/CT-EMFAC, CALINE4 (CL4)
Version 1.0 (12/15/2017) of Air Quality Report Annotated Outline33
Black Text = Headings Blue Text = Instructions to be deletedRed Text = Boilerplate Purple Text = Examples 4. Environmental Consequences
Pollutant Conformity NEPA CEQA
NO2
If in an NO2 nonattainment or maintenance area for the federal standard, project must also come from a conforming RTP and TIP.
Currently there is no federal project-level nitrogen dioxide (NO2) analysis requirement. For project-level analysis, NO2 assessment protocol is not available. EMFAC or CT-EMFAC provides NOx (combination of NO and NO2) emissions estimates that can serve as a useful analysis surrogate for NO2 emissions analysis. Caltrans Near-Road Nitrogen Dioxide Assessment report (Caltrans, 2012) can be used as reference.Modeling Tools: EMFAC/CT-EMFAC
For project-level analysis, NO2 assessment protocol is not available. EMFAC or CT-EMFAC provides NOx (combination of NO and NO2) emissions estimates that can serve as a useful analysis surrogate for NO2 emissions analysis. Caltrans Near-Road Nitrogen Dioxide Assessment report (Caltrans, 2012) can be used as reference.Modeling Tools: EMFAC/CT-EMFAC
SO2
Not required. All of California is in attainment or unclassified. Include a qualitative statement saying that SO2 impacts are de minimis for on- and off-road vehicles (except cargo ships) because gasoline and diesel fuel is low-sulfur by ARB requirement. Cite FHWA conformity guidance that only 4/6 criteria pollutants (not SO2) are of concern for transportation sources: http://www.fhwa.dot.gov/environment/air_quality/conformity/guide/guide04.cfm.
Include qualitative statement described under Conformity; SO2 is not of concern for transportation sources.
Include qualitative statement described under Conformity; SO2 is not of concern for transportation sources.
Lead (Pb)Not required. Typically not an air quality issue.
However, ADL (Aerially Deposited Lead) needs to be addressed under Hazardous Waste section.
Typically not an air quality issue.However, ADL (Aerially Deposited Lead) needs to be addressed under Hazardous Waste section.
Version 1.0 (12/15/2017) of Air Quality Report Annotated Outline34

Black Text = Headings Blue Text = Instructions to be deletedRed Text = Boilerplate Purple Text = Examples 4. Environmental Consequences
Pollutant Conformity NEPA CEQA
GHG
Not required. Not required. If the proposed project is a congestion relief project or will add capacity (including operational improvement projects that are expected to address future demand volumes), analyze GHG emissions using an EMFAC-based tool (e.g., CT-EMFAC or GHG Emissions Calculator). The latest version of the Caltrans GHG Analysis for Transportation Project report offers guidance. Non-capacity-increasing projects (e.g., pavement rehabilitation, shoulder widening, culvert/drainage/stormwater work, landscaping, CCTVs, maintenance vehicle pullouts, minor curve corrections) will likely result in a minimal increase in GHG emissions, and a qualitative discussion may be sufficient.However, EO B-30-15 requires all projects to calculate construction GHG emissions. Use a readily available model, such as CAL-CET or the Sacramento Metropolitan Air Quality Management District (SMAQMD) Road Construction Emissions Model RCEM, to quantify the expected construction-related GHG emissions related to the proposed project. Include the calculations results in a brief sentence or two, to include the emissions per year, expected construction duration, and the total expected GHG emissions.Software/Tools: EMFAC/CT-EMFAC, GHG Emissions Calculator, CAL-CET, SMAQMD’s RCEM Model
Version 1.0 (12/15/2017) of Air Quality Report Annotated Outline35

Black Text = Headings Blue Text = Instructions to be deletedRed Text = Boilerplate Purple Text = Examples 4. Environmental Consequences
Pollutant Conformity NEPA CEQA
MSATs
Not required. Follow FHWA’s “Updated Interim Guidance on Mobile Source Air Toxics Analysis in NEPA Documents” (FHWA, 2016). The analysis must identify which of the three MSAT categories the project belongs in based on screening criteria in the guidance. Caltrans’ CT-EMFAC and Ethylbenzene tool are recommended to provide emission estimates for the nine priority MSAT pollutants directly.Modeling Tools/Guidance : FHWA Guidance, CT-EMFAC, Caltrans’s Ethylbenzene tool
Although its focus is on siting new residential, schools, and other sensitive uses, generally the recommendations contained in the ARB Land Use Guidance (2005) should be used to inform the MSAT analysis. (Refer to Section 4.3.4 MSAT for more info). EMFAC or CT-EMFAC may be used but CT-EMFAC is recommended because EMFAC requires “off-model” application of toxic speciation factors.Software/Tools: FHWA Guidance, ARB Land Use Guidance, CT-EMFAC, Caltrans’s Ethylbenzene tool
Asbestos Not required. Not a mobile source issue.Refer to Section 4.2.2
Not a mobile source issue.Refer to Section 4.2.2
Visibility-Reducing Particles
Not required. Not required. Typically not a transportation issue and no analysis is required. Controls under current regulations only apply to stationary sources.
Sulfates Not required. Not required. Sulfate is typically not a mobile source issue.
Hydrogen Sulfide
Not required. Not required. H2S is typically not a mobile source issue.
Vinyl Chloride
Not required. Not required. Typically not a transportation issue and no analysis is required.
Version 1.0 (12/15/2017) of Air Quality Report Annotated Outline36

Black Text = Headings Blue Text = Instructions to be deletedRed Text = Boilerplate Purple Text = Examples 4. Environmental Consequences
4.2 Short-Term Effects (Construction Emissions)
4.2.1 Construction Equipment, Traffic Congestion, and Fugitive Dust
Document fugitive dust, construction equipment emissions, and emissions from detours or temporary traffic congestion. Address emissions of CO, NO2, VOCs, PM, SO2, and regional haze, as needed (See table in Section 4.1). If stationary source permitting is expected (such as for an on-site batch plant or fixed crusher operation), develop and document information about the expected emissions from the equipment. Discuss which pollutants are included in construction analysis, how long the construction period will last, and which activities construction includes. Also list standard measures that will be taken to reduce air quality impacts associated with construction, such as compliance with all applicable regulations.
Briefly mention all federal, state, air district, and local air quality laws and regulations that apply to construction activities at the project location (these should be described in more detail in Section 2), including applicable laws and regulations for construction impact minimization. Include standard conditions/control measures, fugitive dust controls, mobile and stationary source controls, and administrative controls. Commit to complying with the regulations.
Describe which activities would generate which pollutants. As needed, include tables of total, average, daily, and maximum daily construction emissions and provide model results in an Appendix. List federal, state, and local construction-related regulations and commit to complying with them.
Site preparation and roadway construction will involve clearing, cut‐and‐fill activities, grading, removing or improving existing roadways, and paving roadway surfaces. During construction, short‐term degradation of air quality is expected from the release of particulate emissions (airborne dust) generated by excavation, grading, hauling, and other activities related to construction. Emissions from construction equipment powered by gasoline and diesel engines are also anticipated and would include CO, NOX, VOCs, directly emitted PM10 and PM2.5, and toxic air contaminants (TACs) such as diesel exhaust particulate matter. Construction activities are expected to increase traffic congestion in the area, resulting in increases in emissions from traffic during the delays. These emissions would be temporary and limited to the immediate area surrounding the construction site.
Under the transportation conformity regulations (40 CFR 93.123(c)(5)), construction-related activities that cause temporary increases in emissions are not required in a hot-spot analysis. These temporary increases in emissions are those that occur only during the construction phase and last five years or less at any individual site. They typically fall into two main categories:
Fugitive Dust: A major emission from construction due to ground disturbance. All air districts and the California Health and Safety Code (Sections 41700-41701) prohibit “visible emissions” exceeding three minutes in one hour – this applies
Version 1.0 (12/15/2017) of Air Quality Report Annotated Outline37

Black Text = Headings Blue Text = Instructions to be deletedRed Text = Boilerplate Purple Text = Examples 4. Environmental Consequences
not only to dust but also to engine exhaust. In general, this is interpreted as visible emissions crossing the right-of-way line. Some air districts have additional regulations regarding fugitive dust; be sure to identify these in Section 2 if applicable and develop information as specified in the regulation for Section 4. If using equipment such as rock crushers or batch plants, consider noting whether siting is done to maximize the distance between the equipment and sensitive receptors.Sources of fugitive dust include disturbed soils at the construction site and trucks carrying uncovered loads of soils. Unless properly controlled, vehicles leaving the site may deposit mud on local streets, which could be an additional source of airborne dust after it dries. PM10 emissions may vary from day to day, depending on the nature and magnitude of construction activity and local weather conditions. PM10 emissions depend on soil moisture, silt content of soil, wind speed, and the amount of equipment operating. Larger dust particles would settle near the source, while fine particles would be dispersed over greater distances from the construction site.
Construction equipment emissions: Diesel exhaust particulate matter is a California-identified toxic air contaminant, and localized issues may exist if diesel-powered construction equipment is operated near sensitive receptors.
For conformity purposes, construction emissions need only be analyzed at the project level if:
Construction will last more than five years at one location (40 CFR 93.123(c)(5)); or
Transportation project construction emissions are identified as a significant contributor to nonattainment in an approved SIP, and an emission budget for construction emissions has been set in the SIP and found adequate or approved by the U.S. EPA (40 CFR 93.122).
In the latter case, construction emissions should be analyzed in the conformity analysis for the RTP. Reference may be made to that document, and the regional interagency consultation process should be used to define the level of detail needed to meet project-level conformity analysis requirements. In the former case, construction-related traffic congestion emissions and construction equipment emissions must be quantified. There are no set guidelines at this time for how to quantify construction emissions so interagency consultation will be needed to settle on an approach and suitable planning assumptions. Depending on the circumstances of the project, one resource for estimating construction emissions is the latest Sacramento Metropolitan Air Quality Management District's Roadway Construction Emissions Model (www.airquality.org/ceqa/ ). Some regions, such as South Coast Air Quality Management District, have approved this tool for use in other areas. Regardless of which tool is used, the tool should be described here. Use and explain project-specific activity data (if available) instead of using the spreadsheet’s defaults. If necessary, tool details can be included in an Appendix.
For projects with construction durations of five years or more at any one particular location, begin the discussion with the following text: The construction period for the proposed project spans [X] years, with construction lasting more than five years at one or more specific sites, and therefore, an analysis of construction emissions is provided.
Version 1.0 (12/15/2017) of Air Quality Report Annotated Outline38
Black Text = Headings Blue Text = Instructions to be deletedRed Text = Boilerplate Purple Text = Examples 4. Environmental Consequences
Describe the tool used to estimate construction emissions. Construction emissions were estimated using the latest Sacramento Metropolitan Air Quality Management District’s Road Construction Model (http://www.airquality.org/ceqa/, Version [VERSION NUMBER]). While the model was developed for Sacramento conditions in terms of fleet emission factors, silt loading, and other model assumptions, it is considered adequate for estimating road construction emissions by the San Joaquin Valley Air Pollution Control District (under its Indirect Source regulations) and the South Coast Air Quality Management District (in its CEQA guidance) and is used for that purpose in this project analysis.
While construction emissions typically need not be considered in conformity analyses where construction will last for five years or less, they may need to be considered for a wider variety of projects and shorter construction periods for both NEPA and CEQA. Construction impacts of a proposed project should be considered under CEQA guidelines; all construction-related air quality impacts should be considered, including GHG emissions estimation requirement to address EO-B-30-15 regardless of length of construction period. If construction will last longer than three years and/or will substantially impact traffic due to detours, road closures, and temporary terminations, then impacts of the resulting traffic flow changes may need to be analyzed. Changes in fleet mix, vehicle speed, and traffic volumes may be needed from design and traffic operations staff to assess changes from baseline during construction.
Construction emissions were estimated for the project alternatives using detailed equipment inventories and project construction scheduling information provided by [CONSTRUCTION ACTIVITY SOURCE] ([CITATION]) combined with emissions factors from the EMFAC [INSERT YEAR] and OFFROAD models. Construction‐related emissions for [BUILD ALTERNATIVES] are presented in Table [X]. The results of the construction emission calculations are included in Appendix [X]. The emissions presented are based on the best information available at the time of calculations. The emissions represent the peak daily construction emissions that would be generated by each alternative.
Table [X]. Construction Emissions for Roadways. Construction activities included in this table may vary by project; modify activities in the table as needed.
PM10
(lbs/day)PM2.5
(lbs/day)CO
(lbs/day) NOx
(lbs/day)CO2
(tons/day)
Land Clearing/ Grubbing
Roadway ExcavationStructural Excavation
Base/Subbase/ Imported Borrow
Structural ConcretePaving
Drainage/ Environment/ Landscaping
Version 1.0 (12/15/2017) of Air Quality Report Annotated Outline39
Black Text = Headings Blue Text = Instructions to be deletedRed Text = Boilerplate Purple Text = Examples 4. Environmental Consequences
PM10
(lbs/day)PM2.5
(lbs/day)CO
(lbs/day) NOx
(lbs/day)CO2
(tons/day)
Traffic Signalization / Signage / Striping /
PaintingOther OperationsMaximum daily or
average dailyProject Total
Implementation of the following measures, some of which may also be required for other purposes such as storm water pollution control, will reduce air quality impacts resulting from construction activities. Please note that although these measures are anticipated to reduce construction-related emissions, these reductions cannot be quantified at this time.
The construction contractor must comply with the Caltrans’ Standard Specifications in Section 14-9 (2015). - Section 14-9-02 specifically requires compliance by the contractor with all
applicable laws and regulations related to air quality, including air pollution control district and air quality management district regulations and local ordinances.
Water or a dust palliative will be applied to the site and equipment as often as necessary to control fugitive dust emissions. Fugitive emissions generally must meet a “no visible dust” criterion either at the point of emissions or at the right-of-way line depending on local regulations.
Soil binder will be spread on any unpaved roads used for construction purposes, and on all project construction parking areas.
Trucks will be washed as they leave the right-of-way as necessary to control fugitive dust emissions.
Construction equipment and vehicles will be properly tuned and maintained. All construction equipment will use low sulfur fuel as required by CA Code of Regulations Title 17, Section 93114.
A dust control plan will be developed documenting sprinkling, temporary paving, speed limits, and timely re-vegetation of disturbed slopes as needed to minimize construction impacts to existing communities.
Equipment and materials storage sites will be located as far away from residential and park uses as practicable. Construction areas will be kept clean and orderly.
Environmentally sensitive areas will be established near sensitive air receptors. Within these areas, construction activities involving the extended idling of diesel equipment or vehicles will be prohibited, to the extent feasible.
Track-out reduction measures, such as gravel pads at project access points to minimize dust and mud deposits on roads affected by construction traffic, will be used.
Version 1.0 (12/15/2017) of Air Quality Report Annotated Outline40
Black Text = Headings Blue Text = Instructions to be deletedRed Text = Boilerplate Purple Text = Examples 4. Environmental Consequences
All transported loads of soils and wet materials will be covered before transport, or adequate freeboard (space from the top of the material to the top of the truck) will be provided to minimize emission of dust during transportation.
Dust and mud that are deposited on paved, public roads due to construction activity and traffic will be promptly and regularly removed to reduce PM emissions.
To the extent feasible, construction traffic will be scheduled and routed to reduce congestion and related air quality impacts caused by idling vehicles along local roads during peak travel times.
Mulch will be installed or vegetation planted as soon as practical after grading to reduce windblown PM in the area. Be aware that certain methods of mulch placement, such as straw blowing, may themselves cause dust and visible emission issues and may require controls such as dampened straw.
4.2.2 AsbestosStructural asbestos (demolition) is regulated by federal and related state/air district regulations (federal regulations include National Emission Standards for Hazardous Air Pollutants [NESHAP], www.epa.gov/ttn/atw/asbes/asbespg.html), whereas naturally occurring asbestos (NOA) is regulated by ARB and worker-safety programs (www.arb.ca.gov/toxics/asbestos/asbestos.htm). Refer to the Caltrans NOA webpage (www.dot.ca.gov/hq/env/haz/hw_noa.htm) and the map on the ARB website that shows areas with NOA (www.arb.ca.gov/toxics/asbestos/geninfo.htm). Document air quality impacts related to naturally occurring and/or structural asbestos. Discuss whether the project is located in an NOA area. If NOA is present and may become airborne, a statement based on information verified by a registered geologist is needed. Mention if the project is located in a county known to contain NOA, and where applicable, address air district regulations (be sure to also include a discussion of air district regulations). Note ARB regulations and commit to following them, and note any special design features needed to avoid or manage NOA, including control measures and dust control plan submittal requirements. CEQA documentation may follow the guidance provided by OPR (http://opr.ca.gov/docs/asbestos_advisory.pdf).
Identify any bridges or other major structure/buildings that would be demolished or structurally modified as part of the project. Summarize results of asbestos investigations and note NESHAP requirements for investigation and notification prior to construction. If removal of asbestos is needed, documentation must be presented that shows commitment to use asbestos-certified contractors. Disclose any additional requirements based on local regulations.
4.2.3 LeadLead is normally not an air quality issue for transportation projects unless the project involves disturbance of soils containing high levels of aerially deposited lead or painting or modification of structures with lead-based coatings. In these cases, construction impact analysis should describe monitoring and abatement requirements of Caltrans’ Standard Specifications and Standard Special Provisions for aerially deposited lead or for lead paint removal and sandblasting. Identify any portions of the project site that will
Version 1.0 (12/15/2017) of Air Quality Report Annotated Outline41

Black Text = Headings Blue Text = Instructions to be deletedRed Text = Boilerplate Purple Text = Examples 4. Environmental Consequences
be subject to aerially deposited lead management or soil-bound lead management related to bridges during construction. Note whether the project is near an industrial lead emissions source, especially one related to a nonattainment designation, if applicable. Determine and document whether expected soil disturbance would generate lead concentrations high enough to trigger regulatory involvement. Disturbance of lead paint must meet U.S. EPA and air district rules (Caltrans Standard Specifications 14-9.02, 2015). Disclose any local and air district rules that apply to sandblasting and other activities related to lead paint removal or disturbance, if applicable.
4.3 Long-Term Effects (Operational Emissions)Long-term direct impacts are those that come from the operation of the project. At a minimum, analyses must cover the baseline year, the year of opening (may be multiple years if construction is phased), and the year of highest expected emissions (often the design year, when traffic volumes are typically highest). In areas subject to conformity requirements, also include the horizon year of the RTP if later than the design year, and at least one other year such that there are no more than 10 years between any two analysis years; consider using the analysis years the MPO uses for regional analysis for pollutants that trigger conformity requirements. Provide introductory remarks generally describing long-term impacts, and describing the issues analyzed in the following sub-sections.
Operational emissions take into account long-term changes in emissions due to the project (excluding the construction phase). The operational emissions analysis compares forecasted emissions for existing/baseline, No-Build, and all Build alternatives. Document the comparative emissions analysis in a summary table with more detailed results and illustrations in an appendix.
Table [X]. Summary of Comparative Emissions Analysis.
Scenario/Analysis Year
CO(tons/day)
PM10
(tons/day)PM2.5
(tons/day)NOx (surrogate for NO2)
(tons/day)Baseline (Existing Conditions) 2017No-Build 2020Build Alternative 1 2020Build Alternative 2 2020No-Build 2040Build Alternative 1 2040Build Alternative 2 2040
Version 1.0 (12/15/2017) of Air Quality Report Annotated Outline42

Black Text = Headings Blue Text = Instructions to be deletedRed Text = Boilerplate Purple Text = Examples 4. Environmental Consequences
4.3.1 CO AnalysisFollow the CO Protocol for a CO analysis (http://www.dot.ca.gov/hq/env/air/pages/coprot.htm). There are no CO non-attainment areas in California; all areas in California are currently designated attainment/unclassified or maintenance for the state and federal CO standards. For regulatory requirements regarding CO analysis in the conformity process, refer to 40 CFR 93.116 and 40 CFR 93.123. In rare cases when a quantitative analysis of CO is needed, refer to the CO Protocol for modeling instructions; use the appropriate versions of EMFAC/CT-EMFAC to support CO emissions estimation and use CALINE4/CL4 to conduct dispersion modeling to estimate CO concentrations. Note that Appendix A of the CO Protocol provides a quantitative screening method with supporting data from an obsolete version of the ARB’s EMFAC model. Because these EMFAC-based data reflect outdated emissions information, the screening process in Appendix A cannot be used for a project-level CO analysis.
The CO Protocol was developed for project-level conformity (hot-spot) analysis and was approved for use by the U.S. EPA in 1997. It provides qualitative and quantitative screening procedures, as well as quantitative (modeling) analysis methods to assess project-level CO impacts. The qualitative screening step is designed to avoid the use of detailed modeling for projects that clearly cannot cause a violation, or worsen an existing violation, of the CO standards. Although the protocol was designed to address federal standards, it has been recommended for use by several air pollution control districts in their CEQA analysis guidance documents and should also be valid for California standards because the key criterion (8-hour concentration) is similar: 9 ppm for the federal standard and 9.0 ppm for the state standard.
State that the CO protocol was followed and whether a quantitative analysis is necessary in light of the results of the protocol. If a quantitative CO hot-spot analysis is required, describe the model and data used to perform the analysis. Summarize the CO Protocol results and include details (all modeling inputs and outputs if CO Protocol Appendix B is used) in an appendix. Include responses to the flowchart in this section. If the flowchart indicates that a quantitative CO hot-spot analysis is needed, perform the analysis as indicated in the CO Protocol, document the results of the analysis here, and discuss whether or not the project would cause a violation of the 1-hr or 8-hr CO NAAQS (a violation of the 8-hr standard is more likely than a violation of the 1-hr standard). Begin the discussion with the following text:
Sections 3 and 4 of the CO Protocol describe the methodology for determining whether a CO hot-spot analysis is required. The Protocol provides two conformity requirement decision flowcharts that are designed to assist project sponsors in evaluating the requirements that apply to their project. The flowchart of the CO Protocol applies to new projects and was used here. Insert the flowchart in this section or Appendix [X] of this report. Below is a step‐by‐step explanation of the flowchart. Each level cited is followed by a response, which in turn determines the next applicable level of the flowchart for the project. Describe the results of following the flowchart.
Version 1.0 (12/15/2017) of Air Quality Report Annotated Outline43

Black Text = Headings Blue Text = Instructions to be deletedRed Text = Boilerplate Purple Text = Examples 4. Environmental Consequences
4.3.2 PM AnalysisEmissions AnalysisFor non-conformity project-level PM analysis, common practice is to conduct an emissions analysis by comparing PM emissions between the Build scenario and the No-Build scenario, and/or between the Build scenario and the Baseline scenario. The basic procedure for analyzing project-level PM emissions is to calculate emission factors using EMFAC or CT-EMFAC and apply the emission factors to speed and VMT data specific to the project area. EMFAC is an emissions model developed by the ARB that calculates emissions rates for California motor vehicles. CT‐EMFAC is an emission model developed by Caltrans that calculates project-level emissions using EMFAC-based emission rates.
Consider using the following sample text: PM emissions were estimated for Baseline, No-Build, and all Build alternatives for the opening year [YEAR] and horizon year [YEAR]. Summarize and discuss results of the PM emissions from the project.
Hot-Spot AnalysisIn PM nonattainment or maintenance areas, if a project is determined to be a project of air quality concern (POAQC), a hot-spot analysis needs to be conducted under the conformity requirement. The U.S. EPA guidance for PM hot-spot analysis, in concert with interagency consultation (interagency consultation is required) is used to determine whether a project is a POAQC.
In November 2015, the U.S. EPA released an updated version of Transportation Conformity Guidance for Quantitative Hot-Spot Analyses in PM2.5 and PM10 Nonattainment and Maintenance Areas (Guidance) for quantifying the local air quality impacts of transportation projects and comparing them to the PM NAAQS (75 FR 79370). The U.S. EPA originally released the quantitative guidance in December 2010, and released a revised version in November 2013 to reflect the approval of EMFAC 2011 and U.S. EPA’s 2012 PM NAAQS final rule. The November 2015 version reflects MOVES2014 and its subsequent minor revisions such as MOVES2014a, to revise design value calculations to be more consistent with other U.S. EPA programs, and to reflect guidance implementation and experience in the field. Note that EMFAC, not MOVES, should be used for project hot-spot analysis in California. The Guidance requires a hot-spot analysis to be completed for a project of air quality concern (POAQC). The final rule in 40 CFR 93.123(b)(1) defines a POAQC as:
(i) New or expanded highway projects that have a significant number of or significant increase in diesel vehicles;
(ii) Projects affecting intersections that are at Level-of-Service (LOS) D, E, or F with a significant number of diesel vehicles, or those that will change to LOS D, E, or F because of increased traffic volumes from a significant number of diesel vehicles related to the project;
(iii) New bus and rail terminals and transfer points that have a significant number of diesel vehicles congregating at a single location;
Version 1.0 (12/15/2017) of Air Quality Report Annotated Outline44

Black Text = Headings Blue Text = Instructions to be deletedRed Text = Boilerplate Purple Text = Examples 4. Environmental Consequences
(iv) Expanded bus and rail terminals and transfer points that significantly increase the number of diesel vehicles congregating at a single location; and
(v) Projects in or affecting locations, areas, or categories of sites which are identified in the PM2.5 and PM10 applicable implementation plan or implementation plan submission, as appropriate, as sites of violation or possible violation.
State that the U.S. EPA guidance for PM hot-spot analysis and interagency consultation were used to determine whether the project is a POAQC and document the interagency consultation process. State whether the project is a POAQC and whether a PM hot-spot analysis is required under transportation conformity. Note that to address conformity, the interagency consultation process must be followed.
If a PM hot-spot analysis was performed, summarize the results using tables and maps illustrating receptor placement. Include copies or screenshots of all model run files (including input data files and output reports) and input screens for emissions and dispersion modeling in an appendix. Describe methods used to obtain representative meteorological data and determine project-specific background concentrations, and document all interagency consultation. Consider using the following text as reference for the discussion: It was determined through interagency consultation that the project is a project of air quality concern as described in 40 CFR 93.123(b)(1)(i). A conformity hot-spot analysis for PM was prepared according to the procedures and methodology provided in the latest version of “Transportation Conformity Guidance for Quantitative Hot-Spot Analyses in PM2.5 and PM10 Nonattainment and Maintenance Areas” released by the U.S. EPA in November 2015 (Quantitative Guidance). Interagency consultation was initiated on [DATE], by providing methods and assumptions for review and concurrence. The interagency consultation concurred with the methods and assumptions on [DATE]. The PM hot-spot analysis results were presented as part of the interagency consultation process on [DATE]. The interagency consultation reviewed and concurred with the PM hot-spot analysis results on [DATE]. The PM hot-spot analysis and documentation of concurrence are provided in this section and in Appendix [X].
4.3.3 NO2 AnalysisThe U.S. EPA modified the NO2 NAAQS to include a 1-hr standard of 100 ppb in 2010. Currently there is no federal project-level nitrogen dioxide (NO2) analysis requirement. However, NO2 is among the near-road pollutants of concern and project analysts will be expected to explain how transportation projects affect near-road NO2.
For project-level analysis, NO2 assessment protocol is not available. If the project is in an NO2 maintenance area, the project must be included in a conforming RTP and TIP. Reference a suitable RTP EIR analysis if available. It is recommended to analyze NO2 impacts in urban or developed areas by performing an emission analysis. Neither EMFAC nor CT-EMFAC provides NO2 emissions estimates. Instead, they provide NOx (combination of NO and NO2) emissions estimates. Near-road NO2 concentrations will likely be dominated by overall NOx emissions. As long as ozone is present at relatively low (background) concentrations, most of the directly emitted NO will convert to NO2 within a few seconds. Therefore, NOx emissions overall can serve as a useful analysis surrogate for NO2. The Caltrans Near-Road Nitrogen Dioxide Assessment report can be used as a reference (Caltrans, 2012).
Version 1.0 (12/15/2017) of Air Quality Report Annotated Outline45

Black Text = Headings Blue Text = Instructions to be deletedRed Text = Boilerplate Purple Text = Examples 4. Environmental Consequences
For NEPA, future Build scenario emissions should be compared with future No-Build scenario emissions; for CEQA, future scenario emissions (Build and No-Build) should be compared with Baseline (Existing Conditions) emissions.
4.3.4 Mobile Source Air Toxics AnalysisRefer to “Mobile Source Air Toxics (MSAT) in the NEPA Process for Highways” flowchart at: www.dot.ca.gov/ser/vol1/sec3/physical/ch11air/msat_nepaprocess.pdf to determine the level of MSAT effects; document analysis results as directed by the 2016 FHWA “Updated Interim Guidance on Mobile Source Air Toxic Analysis in NEPA Documents” at https://www.fhwa.dot.gov/environment/air_quality/air_toxics/policy_and_guidance/msat/. Common practice for addressing MSAT emissions is to use the emission criterion that the Build scenario emissions are less than No-Build and Baseline for all analysis years. If a quantitative analysis is performed, begin with the following sample text: MSAT emissions were estimated for Baseline, No-Build, and all Build alternatives for the opening year [YEAR] and horizon year [YEAR]. The modeling results for the Baseline, No-Build, and Build alternatives are presented in Table [X] and Appendix [X]. Summarize results of the MSAT analysis.
Table [X]. Summary of Comparative MSAT Emissions Analysis.
Scenario/Analysis
Year
1,3-butadien
e(lbs/day)
Acetal-dehyde
(lbs/day)
Acrolein
(lbs/day)
Benzene
(lbs/day)
Diesel PM
(lbs/day)
Ethyl-benzen
e(lbs/day)
Formal-dehyde
(lbs/day)
Naph-thalene
(lbs/day)
Polycyclic
Organic Matter(lbs/day)
Baseline (Existing Conditions) 2017No-Build 2020Build Alternative 1 2020Build Alternative 2 2020No-Build 2040Build Alternative 1 2040Build Alternative 2 2040
Version 1.0 (12/15/2017) of Air Quality Report Annotated Outline46

Black Text = Headings Blue Text = Instructions to be deletedRed Text = Boilerplate Purple Text = Examples 4. Environmental Consequences
Typical methods to complete emissions analysis (quantitative analysis) based on the 2016 FHWA guidance with key modifications for California conditions include:
Use of CT-EMFAC (or EMFAC and ARB’s MSAT speciation factors or speciation database) instead of MOVES and U.S. EPA’s speciation factors.
Use of ARB’s AADT, facility type, and critical distance criteria from the Land Use Handbook rather than FHWA’s AADT criteria for determining when detailed (emission) analysis is needed10.
School/school district notification as specified in the California Public Resource Code Section 21151.4.
The basic procedure for analyzing emissions for on‐road MSATs is to calculate emission factors using EMFAC or CT-EMFAC and apply the emission factors to speed and VMT data specific to the project area. EMFAC is an emissions model developed by the ARB that calculates emissions rates for California motor vehicles. EMFAC provides emission factor information for diesel PM but does not provide emission factors for other MSATs. The ARB has developed speciation factors to convert the total organic gas emissions provided by EMFAC to the corresponding emissions of each MSAT.
CT‐EMFAC is an emission model developed by Caltrans that calculates emission inventories for motor vehicles using EMFAC emission rates and ARB speciation factors. CT-EMFAC allows project analysts to model project-level emissions of criteria pollutants, CO2, CH4, and all U.S. EPA priority MSATs (1,3-butadiene, acetaldehyde, acrolein, benzene, diesel particulate matter, formaldehyde, naphthalene, and polycyclic organic matter) except for ethylbenzene. The Caltrans Ethylbenzene Emissions Calculator can be used to estimate project-level ethylbenzene emissions. If the analysis goes beyond the common MSATs, speciation factors are extracted from ARB’s speciation data database and applied to ROG/VOC and/or PM10/TSP emissions or emission factors from EMFAC. Note that the MATES II and III studies in the South Coast Air Basin (SCAQMD, 2014) strongly suggest that 70−80% of the regional health risk related to all air toxics (not just mobile) comes from DPM, with the majority of the remaining risk from benzene (one of the common MSATs), so addressing the traditional MSATs will typically capture a majority of the risk from highways.
In rare cases, due to past practice by a local partner or to satisfy a request by U.S. EPA or another regulatory agency for a project that has unique circumstances, it may be necessary to perform a Health Risk Assessment (HRA). If an HRA is requested, the project analyst should consult with headquarters on the criteria evaluation. Full documentation of such a study must be presented as a separate volume, but a summary should be included in the air quality report and the environmental document (consider extracting all or part of the Executive Summary of the HRA report). For more information about HRA development and documentation, see the Office of Environmental Health Hazard Assessment (OEHHA) web site (oehha.ca.gov/risk.html).
10 The ARB Land Use Guidance (2005) recommends avoiding siting new sensitive land uses within 500 feet of a freeway, urban roads with 100,000 vehicles/day, or rural roads with 50,000 vehicles/day. Generally, projects should use the criteria established in ARB’s Land Use Guidance. However, this criteria is advisory and its use is not mandatory. Districts have the option to use alternate criteria if appropriate for their project.
Version 1.0 (12/15/2017) of Air Quality Report Annotated Outline47
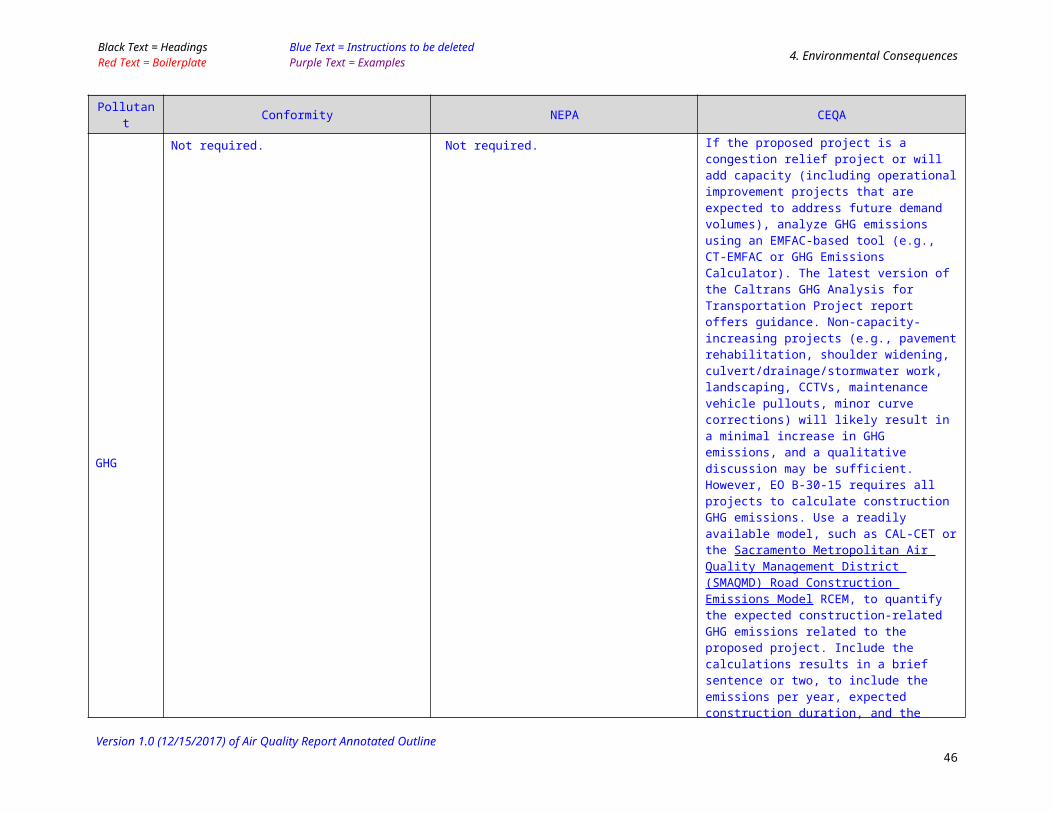
Black Text = Headings Blue Text = Instructions to be deletedRed Text = Boilerplate Purple Text = Examples 4. Environmental Consequences
State whether or not the project is categorically excluded by 23 CFR 771.117(c)11, CAA pursuant to 40 CRF 93.126, and why. If the project is not categorically excluded, include the following text: FHWA released updated guidance in October 2016 (FHWA, 2016) for determining when and how to address MSAT impacts in the NEPA process for transportation projects. FHWA identified three levels of analysis:
No analysis for exempt projects or projects with no potential for meaningful MSAT effects;
Qualitative analysis for projects with low potential MSAT effects; and Quantitative analysis to differentiate alternatives for projects with higher
potential MSAT effects.
Projects with no impacts generally include those that a) qualify as a categorical exclusion under 23 CFR 771.117, b) qualify as exempt under the FCAA conformity rule under 40 CFR 93.126, and c) are not exempt, but have no meaningful impacts on traffic volumes or vehicle mix.
Projects that have low potential MSAT effects are those that serve to improve highway, transit, or freight operations or movement without adding substantial new capacity or creating a facility that is likely to substantially increase emissions. The large majority of projects fall into this category.
Projects with high potential MSAT effects include those that: Create or significantly alter a major intermodal freight facility that has the
potential to concentrate high levels of Diesel Particulate Matter in a single location; or
Create new or add significant capacity to urban highways such as interstates, urban arterials, or urban collector-distributor routes with traffic volumes where the AADT is projected to be in the range of 140,000 to 150,000, or greater, by the design year; and
Are proposed to be located in proximity to populated areas or, in rural areas, in proximity to concentrations of vulnerable populations (i.e., schools, nursing homes, hospitals).
Based on the ARB Land Use Handbook (Cal/EPA and ARB, 2005), it is generally recommended in California that projects perform an emissions analysis to address CEQA requirements if any of the following criteria are met:
The project changes capacity or realigns a freeway, or urban road with AADT of 100,000 or more and there are sensitive land uses within 500 feet of the roadway.
The project changes capacity or realigns a rural road (non-freeway) with AADT of 50,000 or more and there are sensitive land uses within 500 feet of the roadway.
In addition, explicit notice of the project may be required to any schools and school districts that are within ¼ mile of the project boundaries (California Public Resource Code Section 21151.4)12.11 Please note that a MSAT analysis may be required for projects qualified for a NEPA CE pursuant to 23 CFR 771.117 (c)[22], (c)[23], (c)[26], (c)[27] or (c)[28].12 Public Resource Code 21151.4: (a) An environmental impact report shall not be certified or a negative declaration shall not be approved for any project involving the construction or alteration of a facility within one-fourth of a mile of a school that might reasonably be anticipated to emit hazardous air emissions, or that would handle an extremely hazardous
Version 1.0 (12/15/2017) of Air Quality Report Annotated Outline48

Black Text = Headings Blue Text = Instructions to be deletedRed Text = Boilerplate Purple Text = Examples 4. Environmental Consequences
FHWA guidance defines MSATs as in the 2007 U.S. EPA regulations; however, in addition, EPA identified nine compounds with significant contributions from mobile sources that are among the national and regional-scale cancer risk drivers or contributors and non-cancer hazard contributors from the 2011 National Air Toxic Assessment (NATA) (https://www.epa.gov/national-air-toxics-assessment). These are 1,3-butadiene,acetaldehyde, acrolein, benzene, diesel particulate matter (diesel PM), ethylbenzene, formaldehyde, naphthalene, and polycyclic organic matter. While FHWA considers these the priority mobile source air toxics, the list is subject to change and may be adjusted in consideration of future EPA rules. For CEQA analyses, DPM should be highlighted because the ARB considers it to be the most important toxic air contaminant.
State whether the project involves meaningful MSAT effects and why. Summarize the screening process used for the project and identify which of three FHWA analysis categories the project falls into: (1) no meaningful potential MSAT effects, (2) low potential MSAT effects, or (3) higher potential MSAT effects. If an emissions analysis is conducted, present the emissions of the seven U.S. EPA-identified priority MSATs for each alternative (including No-Build) and for the Baseline conditions. Include a narrative describing what the expected level of impact would be from each alternative (including No-Build) and the Baseline conditions.
The latest version of CT-EMFAC, CT-EMFAC2014 released in [INSERT MONTH YEAR], was used to estimate emissions of benzene, 1,3-butadiene, formaldehyde, acrolein, naphthalene, DPM, and POM. Figure [X] illustrates the extent of the area considered in the MSAT analysis. Traffic activity data were estimated for each of different periods of a representative day in the baseline, opening ([YEAR]), and horizon ([YEAR]) years. Appendix [X] includes traffic activity data. Emissions were estimated for all MSATs using CT-EMFAC, based on EMFAC and speciation factors provided by ARB and U.S. EPA.
substance or a mixture containing extremely hazardous substances in a quantity equal to or greater than the state threshold quantity specified pursuant to subdivision (j) of Section 25532 of the Health and Safety Code , that may pose a health or safety hazard to persons who would attend or would be employed at the school, unless both of the following occur:(1) The lead agency preparing the environmental impact report or negative declaration has consulted with the school district having jurisdiction regarding the potential impact of the project on the school.(2) The school district has been given written notification of the project not less than 30 days prior to the proposed certification of the environmental impact report or approval of the negative declaration.
Version 1.0 (12/15/2017) of Air Quality Report Annotated Outline49
Insert a map illustrating the extent of the
analysis area

Black Text = Headings Blue Text = Instructions to be deletedRed Text = Boilerplate Purple Text = Examples 4. Environmental Consequences
Figure [X]. The Extent of Area Considered in the MSAT Analysis.
4.3.5 Greenhouse Gas Emissions AnalysisAnalysis for Congestion Relief and Other Capacity-Increasing Projects
Using the latest approved version of the EMFAC model (http://www.dot.ca.gov/hq/env/air/main_sections/analysistools.htm), conduct a separate model run for existing/baseline conditions (existing conditions at the time of the Notice of Preparation [NOP] or existing conditions at the time the environmental analysis began), as well as the design-year for both the Build and No-Build alternatives. It is also helpful to include an intermediate year such as the open-to-traffic year. Summarize this information in a table that includes the VMT projections used for the EMFAC model run along with the CO2 emission results. A sample table format is provided for your convenience.
Table [X]. Modeled Annual CO2 Emissions and Vehicle Miles Traveled, by Alternative.
Alternative CO2 Emissions (Metric Tons/Year)
Annual Vehicle Miles Traveled1
Existing/Baseline [YEAR] XX XXOpen to Traffic [YEAR]
No Build XX XXBuild Alternative 1 XX XXBuild Alternative 2 XX XX
20-Year Horizon/Design-Year [YEAR]
No Build XX XXBuild Alternative 1 XX XXBuild Alternative 2 XX XX
CO2 = carbon dioxideSource: EMFAC2014 1 Annual VMT values derived from Daily VMT values multiplied by 347, per ARB methodology (ARB 2008).
List all alternatives, including the No-Build Alternative, on a separate row under each timeframe. Add or delete rows from the sample table as needed.Include a table note stating which model was used for the analysis (e.g., EMFAC 2014) and any additional clarifying information regarding the modeling. Revise the table’s footnote as needed.In the text, justify the basis for using 20-year horizon, project design life, or other project end date. Be sure to state any other assumptions used in the model, such as where traffic data were obtained.
State the CO2 emissions numbers for the alternatives in both the existing and design-years. Explain the reasons for a predicted decrease or increase in CO2 emissions between alternatives as well as between years. For the purposes of CEQA, the text must specifically discuss the difference between the baseline and the design-year emissions.
Version 1.0 (12/15/2017) of Air Quality Report Annotated Outline50

Black Text = Headings Blue Text = Instructions to be deletedRed Text = Boilerplate Purple Text = Examples 4. Environmental Consequences
Also include a discussion of the design-year Build alternative versus the design-year No-Build alternative. In the text, make it clear that the CO2 emissions numbers are only useful for a comparison of alternatives.
While EMFAC has a rigorous scientific foundation and has been vetted through multiple stakeholder reviews, its emission rates are based on tailpipe emission test data and have limitations. The EMFAC-based CO2 emissions estimates are used for comparison of alternatives. However, the model does not account for factors such as the vehicle operation mode (e.g., rate of acceleration) and the vehicles’ aerodynamics, which would influence CO2 emissions. ARB’s GHG Inventory follows the IPCC guideline by assuming complete fuel combustion, while still using EMFAC data to calculate CH4 and N2O emissions.
Analysis for Non Capacity-Increasing and Other Projects
These types of projects most likely will have minimal or no increase in operational GHG emissions: Pavement rehabilitation Shoulder widening Culvert/drainage/storm water work Landscaping CCTVs Maintenance vehicle pullouts Minor curve corrections
If the project type is one of the above, include a qualitative discussion about the operation of the project and the low- to no-potential for an increase in GHG emissions. Acknowledge that construction emissions will be unavoidable but there will likely be long-term GHG benefits by improved operation and smoother pavement surfaces, as applicable.
If the project is a ramp metering or signalization project, provide a discussion of what traffic-smoothing effects the project will have; to the extent that the signal or meter provides a smoother traffic flow, there will likely be an overall reduction in GHGs emitted. If the backup at the ramp meters or signals will be lengthy, then conduct a quantitative analysis using EMFAC as described above for congestion relief/capacity-increasing project.
4.4 Cumulative/Regional/Indirect Effects Ozone, secondary PM10, and secondary PM2.5 are normally regional issues because they are formed by photochemical and chemical reactions over time in the atmosphere. For these pollutants, localized impact analysis is not meaningful. However, emissions analyses may be required in order to make some comparison with baseline and No Project conditions. Formation of ozone and secondary PM are a function of VOC and NOx emissions; therefore, emissions analyses would concentrate on quantifying VOC and NOx emissions. Emissions analyses employ traffic volume, speed, and fleet mix information to determine an emission “burden” using EMFAC (or CT-EMFAC).
Version 1.0 (12/15/2017) of Air Quality Report Annotated Outline51

Black Text = Headings Blue Text = Instructions to be deletedRed Text = Boilerplate Purple Text = Examples 4. Environmental Consequences
The cumulative impact analysis is conducted based on a summary of projections of future development and impacts contained in an adopted general planning or related planning document, or in a prior environmental document that has been certified. Ideally, the project (at least one viable alternative other than No Project) will be included in the RTP with a CEQA document that provides a regional emissions analysis for ozone and PM. If this is the case, summarize the RTP CEQA document conclusions, and use its findings by reference. These documents must be available to the public and actually describe or evaluate the regional or area-wide conditions contributing to the cumulative impact.
Version 1.0 (12/15/2017) of Air Quality Report Annotated Outline52

Black Text = Headings Blue Text = Instructions to be deletedRed Text = Boilerplate Purple Text = Examples
5. Minimization Measures
5. Minimization MeasuresCEQA requires that feasible measures that can eliminate or substantially reduce project impacts be addressed. FHWA requires a project to incorporate measures to mitigate adverse impacts caused by the action and requires the project applicant to be responsible for the implementation of the mitigation measures (23 CFR 771). Include a list of Reasonably Available Control Measures (RACM) or Best Available Control Measures (BACM) from the SIP implemented by the project or indicate that project does not interfere with control measures. The ARB’s technical advisory on Strategies to Reduce Air Pollution Exposure Near High-Volume Roadways (https://www.arb.ca.gov/ch/rd_technical_advisory_final.PDF ) discusses potential measures.
For GHG emissions, consider specific measures in the EIR for applicable Regional Transportation Plan, local climate action plans, and local air district guidance for reduction of GHG emissions.
5.1 Short-Term (Construction)Any standard project feature should be included in the project description and should not be listed as an avoidance, minimization, or mitigation measure. List any additional avoidance, minimization, and/or mitigation measures that go beyond standard measures included on all (or most) Caltrans projects here. Sample minimization measures for short-term construction-related emissions include:
Application of most stringent available regulations or best practices even if not required by local/state regulations at the site (identify)
Possible designation of areas where construction equipment servicing and storage are not allowed (near sensitive receptors)
Construction staging (such as constructing a sound wall first) Temporary programs to reduce detour- and construction-related traffic congestion
such as special transit programs and subsidies A construction equipment emission reduction program to encourage or require
the contractor to use cleaner (newer) diesel engines or retrofit older engines
5.2 Long-Term (Operational)If any avoidance, minimization, and mitigation measures are needed to reduce operational air quality impacts or GHG emissions, discuss those steps here. Specify the target pollutant, if applicable. Potential measures for long-term operation air quality impacts include the following:
Add operational measures to further reduce congestion and increase average speed (but not to more than approximately 50 mph, on average)
Version 1.0 (12/15/2017) of Air Quality Report Annotated Outline53

Black Text = Headings Blue Text = Instructions to be deletedRed Text = Boilerplate Purple Text = Examples
5. Minimization Measures
Use a wide paved shoulder and stabilization/landscaping of unpaved areas to minimize re-entrained dust
Consider landscaping with dense, evergreen trees such as redwoods where appropriate from a climate and water use standpoint (experimental—effectiveness is not well-documented yet).
In extreme cases, consider retrofitting sensitive receptors with sealed windows and forced-air, filtered ventilation (but consider long-term liability, energy, and maintenance issues—this is probably a realistic option only for critical sites like schools or hospitals that are immediately adjacent to the road, cannot practically be moved, and do not have large open “play” areas also near the road).
For all projects, there is a need for an Environmental Commitments Record (ECR) or an equivalent document. If the items above are part of an ECR, they should be noted as such and documentation should be consistent with the requirements for the ECR.
Version 1.0 (12/15/2017) of Air Quality Report Annotated Outline54

Black Text = Headings Blue Text = Instructions to be deletedRed Text = Boilerplate Purple Text = Examples 6. Conclusions
6. ConclusionsSummarize short- and long-term air quality impacts; no determination regarding the significance of the project impact should be discussed in this section. Summarize conformity analysis results, as well as relevant conclusions for NEPA and CEQA analyses. This section should include the same material provided in the Executive Summary (which may be external to this report), with additional analysis details as needed.
Version 1.0 (12/15/2017) of Air Quality Report Annotated Outline55

Black Text = Headings Blue Text = Instructions to be deletedRed Text = Boilerplate Purple Text = Examples 7. References
7. ReferencesCalifornia Environmental Protection Agency and California Air Resources Board (Cal/EPA
and ARB, 2005) Air quality and land use handbook: a community health perspective. April. Available at http://www.arb.ca.gov/ch/handbook.pdf.
California Department of Transportation (2012) Near-Road Nitrogen Dioxide Assessment. Final report, CTAQ-RT-12-270.09.02, August.
California Department of Transportation (2015) Standard Specifications. Prepared by the State of California Department of Transportation. Available at http://www.dot.ca.gov/hq/esc/oe/construction_contract_standards/std_specs/2015_StdSpecs/2015_StdSpecs.pdf.
Federal Highway Administration (2016) Updated Interim guidance update on mobile source air toxic analysis in NEPA documents. Available at https://www.fhwa.dot.gov/environment/air_quality/air_toxics/policy_and_guidance/msat/.
Garza V., Graney P., Sperling D., Niemeier D., Eisinger D., Kear T., and Chang D. (1997) Transportation project-level carbon monoxide protocol revised. Prepared for Environmental Program California Department of Transportation by the Institute of Transportation Studies, University of California, Davis, UCD-ITS-RR-97-21, December. Available at http://www.dot.ca.gov/hq/env/air/pages/coprot.htm.
South Coast Air Quality Management District (SCAQMD, 2014) Multiple Air Toxics Exposure Study: MATES IV draft report. Findings presented at the SCAQMD Governing Board Meeting, October 3.
U.S. Environmental Protection Agency (1995) Compilation of air pollutant emission factors, AP-42. Vol. 1: stationary point and area sources. 5th ed. (January 1995). Report prepared by the Office of Air Quality Planning and Standards, U.S. Environmental Protection Agency, Research Triangle Park, NC. Available at http://www.epa.gov/ttnchie1/ap42/.
U.S. Environmental Protection Agency (2015) Transportation conformity guidance for quantitative hot-spot analyses in PM2.5 and PM10 nonattainment and maintenance areas. Prepared by the U.S. EPA Office of Transportation and Air Quality, Transportation and Climate Division, EPA-420-B-15-084, November. Available at http://www3.epa.gov/otaq/stateresources/transconf/projectlevel-hotspot.htm.
Version 1.0 (12/15/2017) of Air Quality Report Annotated Outline56

Black Text = Headings Blue Text = Instructions to be deletedRed Text = Boilerplate Purple Text = Examples 8. Appendices
8. AppendicesInclude relevant modeling input/output data, including but not limited to the following:
RTP and TIP Listings for the Project and FHWA Conformity Determination – Include photocopies of relevant pages from the RTP and TIP listing conforming projects, analyses, and supporting data.
Summary of Forecast Travel Activities – Summarize Build, No-Build, and Baseline conditions. Address mainline and arterial volumes, speeds, and VMT. Use the following table as a starting point.
Scenario Location
AADT
% Truck VMT (mi)
Average Speed During
Peak Travel (mph)
Average Speed
During Off-Peak Travel (mph)
Total Truck
Baseline (existing)
No-Build
[NAME OF BUILD
ALTERNATIVE 1]
[NAME OF BUILD
ALTERNATIVE 2]
Note: If the percentage of vehicles that are trucks differs between peak and off-peak periods, specify truck percentages during peak and off-peak periods separately. Additionally, if the facility includes HOV lane(s), the travel speeds for the HOV lane(s) must be presented separately from travel speeds for the mixed flow lane(s).
Construction Emissions Calculation Construction Emissions Modeling Results (from CAL-CET or RCEM) CO Flow Chart (Based on the CO Protocol) Summary of Emissions Input for PM Hot-Spot Modeling Quantitative PM Hot-Spot Analysis – Include model inputs (files or screenshots)
and results, and document interagency consultation and public involvement
Version 1.0 (12/15/2017) of Air Quality Report Annotated Outline57

Black Text = Headings Blue Text = Instructions to be deletedRed Text = Boilerplate Purple Text = Examples 8. Appendices
Summary Tables for Changes in MSAT Emissions – Include input and output printouts from modeling and analysis
Grid Maps for Changes in Emissions of DPM and Benzene Summary Tables for Changes in Regional Emissions of PM and Other Pollutants Grid Maps for Changes in PM Emissions Summary Tables for GHG emissions NO2 Analysis Information and Results (if applicable) Summary Tables of EMFAC Emissions Results Interagency Consultation Documentation
Version 1.0 (12/15/2017) of Air Quality Report Annotated Outline58