still an active life - john c. boglejohncbogle.com/wordpress/wp-content/uploads/2015/10… · ·...
TRANSCRIPT

Bogleheads XIV
As My 65th Anniversary
and 87th Birthday Approach,
Still an Active Life
John C. Bogle
Philadelphia, PA
October 15, 2015

Welcome, Bogleheads…
Why are you here?
2

Kiplinger’s journalist Daren Fonda asked: “Why would all those Bogleheads come all the way to
Valley Forge when they must know exactly what you’ll tell them?”
My Response: When Pope Francis made his resent visit to the United States, everyone also knew
what he would speak about: the importance of faith; keeping families strong; caring for those less
fortunate; religious liberty; environmental issues. And yet wherever he went, tens of thousands—
even hundreds of thousands—came to hear him speak.
Perhaps we don’t expect our leaders to say something new whenever they speak. We want them to
reinforce the truth—to speak from the heart about the things they care about. We do not seek
novelty in our leaders, but knowledge, conviction, passion, integrity, common sense, and some fun.
These are the things that I will try to deliver during these next few days.
***
Of course, I’m no Pope, even though one of our veteran crew members thought that the analogy was
fair:
Note from a Veteran Vanguard Crew Member:
YOU are Vanguard’s Pope. Your heart and soul has always been with Vanguard. No one knows what
the future holds, but as long as you stay the course we here at Vanguard will strive to follow in your
footsteps to keep Vanguard the best in the world. YOU are Vanguard’s Shepherd—past, present, and
future—and may you always feel the presence of God with you!
3
WHATEVER THE CASE, I’M STILL HERE . . .

Despite the Empty Chair. Ouch!
Bloomberg Markets, April 2015
Forbes, June 2015
4
LET’S FIX THIS IMPRESSION . . .

Still in the Empty Chair. Yes!
Photoshopped by a Vanguard client, September 2015
5
NOW LET’S GET TO THE PAST YEAR . . .

A Year in My Life … I. Books and Papers
• Wiley Investment Classics: Two more books with new introductions – Bogle on Mutual Funds: New Perspectives for the
Intelligent Investor
– John Bogle on Investing: The First 50 Years
• A Book Chapter: Adam Smith: His Life, Thought, and Legacy (Princeton University Press, forthcoming)
• Articles in Professional Journals – Journal of Portfolio Management
– Financial Analysts Journal
6
START WITH THE CLASSICS . . .

Wiley Investment Classics (April 2015)
Dear Jack: I read your book
from cover to cover and
enjoyed it immensely. It is
honest, sensible, and
readable—a very rare
combination. Your book is
going to be an important
one for mutual fund
investors for many years to
come.
—Warren E. Buffett
1993
7

Wiley Investment Classics (April 2015)
Jack, I just re-read parts of
“The First 50 Years”—and
the remarkable thesis! Rest
easy. It is an “investment
classic.” Maybe the
investment classic.
I take pride in my small
part!
—Paul A. Volcker
2015
8
AND A NEW COVER . . .

Common Sense on Mutual Funds 9
AND THEN THERE’S MY LITTLE BOOK . . .

The Little Book of Common Sense Investing The #1 best-seller on Amazon in the
Mutual Funds category since its
release on March 5, 2007, some 3,137
out of 3,162 days.
Why? It’s short, simple, and
persuasive.
Number of Amazon Reviews: 362,
104 so far in 2015:
5 Star 77
4 Star 20
3 Star 5
2 Star 1
1 Star 1
Total 104
10
WHAT ABOUT
THAT 1-STAR
REVIEW? . . .
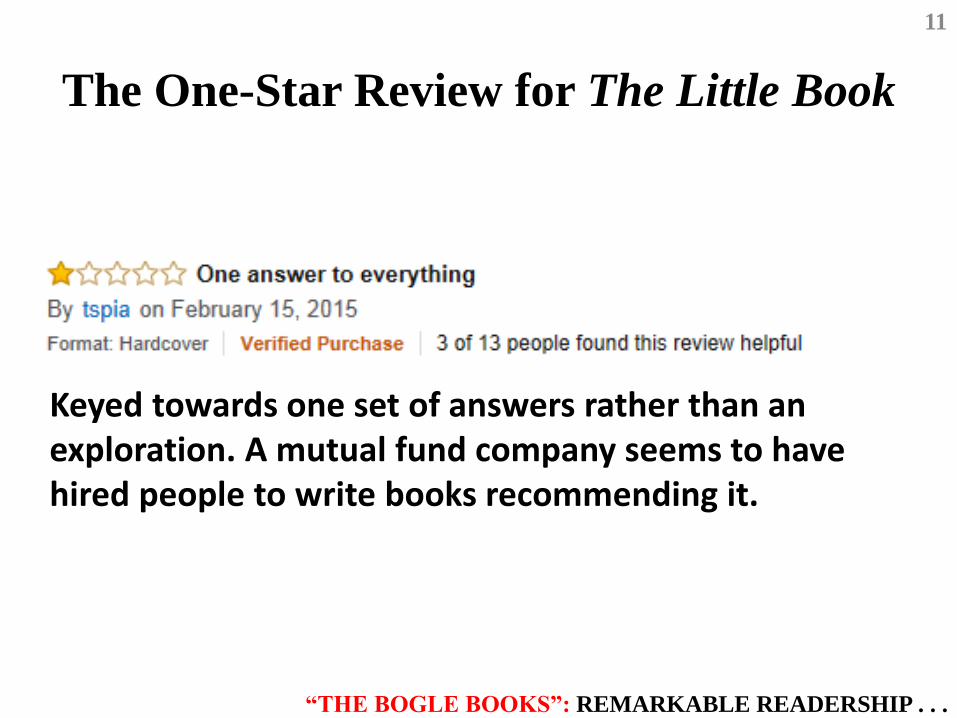
The One-Star Review for The Little Book
11
Keyed towards one set of answers rather than an exploration. A mutual fund company seems to have hired people to write books recommending it.
“THE BOGLE BOOKS”: REMARKABLE READERSHIP . . .

Bogle Book Sales
0
100
200
300
400
500
600
700 Little Book of
Common Sense
Investing
Common Sense on
Mutual Funds (10th
Anniversary Edition)
Clash of the Cultures
Sept.
2012
Sept.
2013
Sept.
2014
Sept.
2015
1020 Weekly Sales
Cumulative Sales:
Little Book: 202,415
Common Sense on Mutual
Funds (all editions): 113,838
Clash of the Cultures: 34,803
Enough.: 90,694
Bogle Books Total: 875,000
12
A WORD ABOUT ENOUGH. TRUE MEASURES OF MONEY, BUSINESS, AND LIFE . . .

13
Competition for Enough.?
LOTS OF BOOKS, YES, BUT ALSO LOTS OF PAPERS . . .

Journal Papers by John C. Bogle
Forthcoming The Index Mutual Fund—
40 Years of Growth, Change, and Challenge
Jan/Feb 2014 The Arithmetic of "All-In" Investment Expenses
Mar/Apr 2009 The End of "Soft Dollars"?
Jan/Feb 2009 Markets in Crisis (Interview w/ Rodney Sullivan)
Mar/Apr 2008 Black Monday and Black Swans
Nov/Dec 2005 The Relentless Rules of Humble Arithmetic
Jan/Feb 2005 The Mutual Fund Industry 60 Years Later:
For Better or Worse?
Jan/Feb 1980 Institutional Investment Performance Compared…
(with Jan M. Twardowski)
Nov/Dec 1970 Mutual Fund Performance Evaluation:
Conventional vs. Unconventional
May/June 1960 The Case for Mutual Fund Management
(as John B. Armstrong)
Financial Analysts Journal (10 papers)
14
*
*
*
*Graham and Dodd award winners AND THE JPM. . .

Journal Papers by John C. Bogle
Winter 2016 (Forthcoming) Putting Investors First
Fall 2015 (Forthcoming)
Occam’s Razor Redux: Establishing Resonable
Expectations for Financial Market Returns
(with Michael W. Nolan)
Summer 2014 No Speed Limits: High-Frequency Trading and Flash Boys
Fall 2013 Big Money in Boston…
Spring 2011 The Clash of the Cultures
Fall 2009 The Fiduciary Principle: No Man Can Serve Two Masters
Summer 2009 Peter Bernstein Commemorative Issue
Winter 2008 A Question So Important…
Spring 2002 An Index Fund Fundamentalist
Summer 1998 The Implications of Style Analysis…
Summer 1995 The 1990s at the Halfway Mark
Winter 1992 Selecting Equity Mutual Funds
Fall 1991 Investing in the 1990s--Occam's Razor Revisited
Spring 1991 Investing in the 1990s
Journal of Portfolio Management (14 papers)
15
*
*
* “Outstanding Article” Award FROM “OCCAM’S RAZOR REDUX” . . .

16
HIGHLIGHTS . . .

0
1
10
100
1,000
10,000
100,000
Cumulative Investment Return
Cumulative Speculative Return
Cumulative Total Returns
Investment and Speculative Returns, 1900-2015
$ Value of Initial $1
9.2%
Annual Real Return
0.4%
Initial Dividend Yield + 10-Year Earnings Growth
Annualized Impact of P/E Change
From JPM Fall 2015 17
DON’T FORGET REVERSION TO THE MEAN (RTM) . . .

-6%
-4%
-2%
0%
2%
4%
6%
8%
Real Returns: Stock Market* Versus Investment Fundamentals,
Rolling 25-Year Periods, 1896-2015
1916 1953
1972
1979 1983
2001
2008
2011
From Common Sense on Mutual Funds 18
1928
*Stock Market Return = Investment Return + Speculative Return
Market Returns Revert to
Fundamental Investment Returns

The Bogle Sources of Return Model for Stocks 19
-5
0
5
10
15
20
25
-4 -2 0 2 4 6 8 10 12
Act
ual
S&
P 5
00 R
etu
rn
Estimated Return
Correlation = 0.81
R-squared = 0.65
BUT I DO MORE THAN WRITE . . .

A Year in My Life . . . II. Vanguard
2014 September 16 Washington, D.C.—Lead Witness, US Senate Finance Committee Hearing on
Retirement System
18 PrimeCap 30th Anniversary Meeting with Principals.
22 NYC Bloomberg “Most Admired Investor” Forum (with AQR’s Cliff Asness).
October 17 Speech, Easttown (PA) Library.
22-24 BOGLEHEADS XIII!
31 Speech, Georgetown Law School (D.C.).
November 4 Visit from Georgetown Law Students.
13 Princeton/Federal Reserve Economics conference, with Paul Volcker.
14 Interview Session with Wharton Executive MBA Students.
20 Princeton—Business Ethics Seminar.
December 16 Full day’s visit from Stanford MBA Class.
30 White House Staff Re: DOL Fiduciary Standards.
2015 January 16 Skype Interview, Durham Bogleheads.
26 Phone Meeting with White House Staff Re: Fiduciary Duty.
28 Phone Meeting with White House Staff Re: Fiduciary Duty.
29 Presentation: Committee for Fiduciary Responsibility.
March 12 Jon Stein, Betterment (Robo Advisor)
17 Quarry Ridge (Vanguard) talk with Crew.
Major Presentations and Events
20

A Year in My Life . . . II. Vanguard April 7 NYC – “Great Debate” on Indexing, at publisher James Grant’s Forum.
16 Lecture, Aspen Institute, D.C.
20 Blair Academy—Speech to student assembly.
28 Lecture, SEC Enforcement Staff, D.C.
May 6-7 ICI General Membership Meeting.
June 4 Speech to the CFA Society of Philadelphia, “Putting Investors First.”
July/August
“Working Vacation” in Adirondacks. Editing book chapter on Adam Smith, AQR
extended interview, and JPM papers, correspondence; DOL and Labor Secretary Perez
on fiduciary duty rule; and more.
September 24 Skype Interview, iMoney
29 SEC-Lead Presenter at 1940 Act 75th Anniversary Forum.
October 2 Princeton Humanities Seminar.
7 Princeton Lecture on “Business Ethics and Modern Religious Thought.”
14-16 Bogleheads XIV!
. . . . And the “Day-to-Day”
Events:
Awards for Excellence 21 TV Appearances 11
Client Visits 18 Crew/Team Meetings 84
PR Interviews 45 Speeches 32
TOTAL 211*
*Oh, yeah. Also 17
appointments with doctors.
And 40 physical therapy
sessions.
21
NOW LET’S TURN TO THE INDUSTRY . . .

My Long Career in the Fund Industry
How Many Hits, How Many Eras?
(“Follow the Money”)
An Industry that Sells What It Makes • 1924-59. The mutual fund industry in its promising formative era
An Industry that Makes What Will Sell • 1960-64. Public ownership of advisors—The New Paradigm
• 1965-69. The “Go-Go” Era—Equity “junk”
• 1970-74. The rise and fall of the “Favorite [Nifty?] Fifty”
• 1975-90. Money market funds and bond funds—a new industry
• 1991-01. The Information Age and the rise of technology funds
• 1995-07. The TIF (Traditional Index Fund) Era
• 2008-15. The ETF (Exchange-Traded Index Fund) Era
What’s Next?
• 2015-25. The return to a new normalcy—The triumph of TIF indexing
22
A GROWING INDUSTRY . . .

704B 4
0
1
10
100
1,000
10,000
1951 1960 1970 1980 1990 2000 2015
Equity
Bond
Money Market
Balanced
$
“I Was There (And I Am Here!)”
A Tiny Industry Grows into a Behemoth TOTAL ASSETS
August 2015
$9.4T 58%
3.7T 22
2.6T 16
$16.3T TOTAL
TOTAL ASSETS
December 1951
Equity $2.45B 78%
Balanced 680M 22
TOTAL $3.13B
Annual Growth Rate
1951-2015: 15%
1951
Equity
78%
1972
Equity
87%
1981
MMF + Bond
83%
2015
Index Funds
34% of Equity
Fund Assets
23
BUT A LARGELY UNRECOGNIZED EARLY FLAW . . .

Along the Way, a Funny Thing Happened
Ownership of 50 Largest Mutual Fund
Management Companies—2015 Privately Owned (10)
Plus Mutual (1)
Publicly Owned
11
Conglomerate
28
Total Firms with Public Ownership: 39
Note: Firms with Public Ownership in 1951: 1
11
(Includes 3
largest firms)
24
BUT LOTS OF OTHER BIG CHANGES, INCLUDING THE RISE OF INDEXING . . .

1945-1975
Presentation to
Vanguard Board
September 18, 1975
1985-2015
Paper Submitted to
Financial Analysts Journal
September 28, 2015
Average
Equity
Fund
S&P 500
Index
Average
Large-Cap
Fund*
S&P 500
Index
Annualized Return 9.7% 11.3% 9.6% 11.2%
Index Advantage -- 1.6% -- 1.6%
Cumulative Return
Index Advantage
1539%
---
2402%
963%
1548%
---
2494%
946%
Standard Deviation 16.4% 18.6% 16.8% 17.3%
Sharpe Ratio 0.38 0.42 0.39 0.48
R-Squared 0.96 1.00 0.99 1.00
Old Times or New,
The Durability of Index Fund Superiority
25
YES, THE U.S. INDEX FUND IS CHALLENGED. BUT . . .

0.0
0.2
0.4
0.6
0.8
1.0
1.2
1.4
1.6
1.8
2.0
1970 1980 1990 2000 2015
Reversion to the Mean I.
S&P 500 / MSCI EAFE, 1970-2015
MSCI EAFE
Outperforming
S&P 500
Outperforming
1970
1988
2001
2007
2015
Annual
Return
Annual
Return
S&P 500 11.1% 8.8%
MSCI EAFE 10.9 4.7
1993-2015
26
1970-2007
TRUE EVEN IN EMERGING MARKETS . . .

0.0
0.2
0.4
0.6
0.8
1.0
1.2
1.4
1.6
1.8
2.0
1987 1995 2005 2015
Reversion to the Mean II.
S&P 500 / MSCI Emerging Markets, 1987-2015
Emerging Markets
Outperforming
1998-2010
S&P 500
Outperforming
1993-1998
1993
1998
2010
Annual
Return
Annual
Return
S&P 500 10.1% 8.8%
Emerg Mkts 10.3 4.3
1993-2015
27
1987-2015
SO WHY NOT JUST BUY FUNDS THAT WIN? . . .

Rankings for the 5 years ending 2009 Where they ranked
in the subsequent 5 years
Quintile 5-Year
Return*
Number of
Funds
Highest
Quintile
Lowest
Quintile
Merged/
Closed
1 Highest 1,091 14% 24% 10%
2 High 1,083 12 16 22
3 Medium 1,084 15 13 26
4 Low 1,085 14 10 38
5 Lowest 1,032 14 9 45
Total 5,375 14% 14% 28%
Equity Fund Returns:
No, Pal, The Past Is Not Prologue. RTM
*Excess return vs. benchmark.
Note: Number of failed funds—1,499
28
NOW LET’S TURN TO THIS CHANGING INDUSTRY . . .

Changes in Mutual Fund Leadership:
Then and Now
Rank
1951
Fund Name
Total
Assets*
(Millions)
2015
Manager Name
Total
Assets
(Billions)
1 M.I.T. $472 Vanguard $2,988
2 Investors Mutual 365 Fidelity 1,615
3 Keystone Funds 213 BlackRock 1,230
4 Tri-Continental 209 American Funds 1,216
5 Affiliated Funds 209 JPMorgan Funds 519
6 Wellington Fund 194 State Street Global 497
7 Dividend Shares 186 T Rowe Price 493
8 Fundamental Investors 179 Franklin Templeton 480
9 State Street Investment 106 PIMCO 375
10 Boston Fund 106 Federated 272
Total $2,239 Total $9,686
Percentage of Industry 72% Percentage of Industry 57%
Total industry assets: $3.1 billion. Total industry assets: $16.9 trillion
*Includes associated funds.
**
**
**
** No longer in business.
***New leaders.
29
***
***
***
***
***
THE NUMBER OF FUNDS EXPLODES . . .

Number of Funds—1951 & Today
Original Name
Total
Assets
(Millions)
No. of
Funds
Managed
Current
Name
Total
Assets
(Billions)
No. of
Funds
Managed
M.I.T. $472 2 MFS $180 78
Investors Mutual 365 3 Columbia 165 116
Affiliated 209 3 Lord Abbett 108 37
Wellington 194 1 Vanguard 2,988 140
Eaton & Howard 90 2 Eaton Vance 101 130
Fidelity 64 1 Fidelity 1,615 321
Putnam 52 1 Putnam 81 77
American 27 2 American 1216 35
T. Rowe Price 1 1 T. Rowe Price 493 116
Dreyfus 0.8 1 Dreyfus 248 151
Total/Average $1,475 1.7 Total/Average $7,195 120
20141951
Major Mutual Fund Groups
30
FUND EXPENSES EXPLODE TOO . . .

1951 2014 Change
Conventional Industry Model
MIT/MFS (C) 0.42% 1.29% +208%
Investors Mutual/Columbia (C) 0.56 1.15 105
Eaton Howard/Eaton Vance (SH) 0.64 1.27 99
Putnam (C) 0.66 1.31 98
Fidelity (P) 0.63 1.06 68
T. Rowe Price (SH) 0.50 0.84 68
Affiliated/Lord Abbett (P) 0.75 1.12 49
American (P) 0.84 0.99 17
Average 0.62% 1.13% +80%
New Industry Model
Wellington/Vanguard (M) 0.55% 0.17 -69%
1951 Assets 1951 Expenses 2014 Assets 2014 Expenses
Conventional Model (above firms) $1B $7M $3.8 T $40 B
New Model -- -- $3.0 T $5 B
Mutual Fund Expense Ratios 1951 and 2014
Ownership types: (C) Conglomerate, (SH) public shareholders, (P) private, (M) mutual
31
EQUITY FUNDS BECOME LESS HOMOGENOUS, MORE RISKY . . .

Equity Funds—Less Relative Predictability
More Risk
Relative Volatility* 1951-56 2009-15** Difference
Over 1.11 0% 18% +18%
0.95-1.11 34 53 +19
0.85-0.94 30 16 -14
0.70-0.84 36 10 -24
Below 0.70 0 4 +4
*S&P 500 = 1.00
**Sample of the 200 largest equity funds.
32
FUND INVESTOR HOLDING PERIODS SHORTEN DRAMATICALLY . . .

0
10
20
30
40
50
60
70
80
1951 1960 1970 1980 1990 2000 2014
%
Then, Long-Term Shareholders, Now . . . ?
Equity Fund Redemption Rates Redemptions and Exchanges Out as a Percentage of Average Net Assets
6%
24%
73%, 1987
39%, 2000-2002
25%
33
ACTIVE MANAGERS CONTINUE TO LAG . . .

0
5
10
15
20
25
30
Larg
e B
len
d
Larg
e G
row
th
Larg
e V
alu
e
Mid
-Ca
p B
len
d
Mid
-Cap
Gro
wth
Mid
-Cap
Valu
e
Sm
all
Ble
nd
Sm
all
Gro
wth
Sm
all
Valu
e
Percentage of Active Funds Outpeforming Their Benchmarks
15 Years through 2014
Do You Like These Odds?
Average: 20% Outperform
Source: Vanguard, Morningstar.
% 30%
14%
34
AND SO, THE TRIUMPH OF INDEXING . . .

-100
-50
0
50
100
150
200
1
Series2
Series1
$
Vanguard Dominates Industry Cash Flow
Mutual Fund Industry Net Cash Flow YTD Through August 2015
Vanguard
+$168 Billion
All Other Firms
-$48 Billion
Vanguard
accounted for
141% of the mutual
fund industry’s
year-to-date net
cash flow through
August 2015
Industry Total
$119 Billion
35
OUR CASH FLOW EXPLODES . . .

-50
0
50
100
150
200
250
300
1988 1995 2000 2005 2010 2015*
Index Stock and Bond Funds
Active Stock and Bond Funds
Money Market Funds
Vanguard Cash Flow, 1988 – 2015 Annually, in billions
$
Bil
lion
s of
Doll
ars
*Annualized based on actual data through 8/2015.
$251B
$4B
$18B
$57B $46B
$58B
$100B
36
DRIVEN BY INDEX FUNDS . . .

-500
0
500
1,000
1,500
2,000
2000 2005 2010 2015
"The Indexers" Vanguard,
BlackRock, and State Street
The Rest of the Industry
The Triumph of Indexing:
Rolling 3-Year Net Cash Flow $
Bil
lion
s of
doll
ars
Net Cash Flow
2009-2015
$1.3 T
-$4.5 B
37
RESULT: COMPETITION’S LEFT IN THE DUST . . . SO FAR . . .

Competition!
Largest U.S. Mutual Fund Managers, 2000-2015
$
Vanguard: $3.0 T
Fidelity: $1.6 T
American: $1.2 T
BlackRock: $1.2 T
JP Morgan: $525 B
Bil
lion
s of
Doll
ars
0
500
1000
1500
2000
2500
3000
3500
2000 2005 2010
V: $561 B F: $765 B
B: $270 B A: $334 B J: $154 B
10/
2014
10/
2015
38
RESULT: OUR MARKET SHARE GROWTH CONTINUES . . .
V vs. F
-$204 B
V vs. F
+$1.4 T

0
5
10
15
20
25
1974 1980 1990 2000 2015
Vanguard’s Market Share of Stock and Bond Funds, 1974-2015
%
5.9% 6.6%
4.1%
6.6%
9.8%
11.8%
14.6%
20.2%
The Hard Times
The Momentum — “Staying the Course”
39
OUR PRINCIPLES HAVE CHANGED THE INDUSTRY . . .

1
10
100
1,000
10,000
100,000
1,000,000
10,000,000
1975 1985 1995 2005 2014
Active
Index
$49B
$1.1T
$1.2T
Index Share
0%
$14M
$39B
$257B
$3B
Index Share
1%
Index Share
4%
Index Share
19%
Mil
lio
ns
of
Do
lla
rs
$
$6.4 Trillion
$3.3 Trillion
$10.6 Trillion
Growth of Equity Fund Assets—Active vs. Index
$5.3T
40
YET THE ORIGINAL PRINCIPLES OF INDEXING HAVE BEEN CHALLENGED . . .
Index Share
33%

The Rise of the ETF 41
Equity Index Fund Assets 1995-2008 2009-2015
1995 2015 Annual
Increase
Annual
Increase
TIFs* $48B $1.63T +19% +19%
ETFs $1B $1.68T +59% +19%
Total $49B $3.31T +25% +19%
*Traditional Index Funds
THERE IS A DIFFERENCE . . .
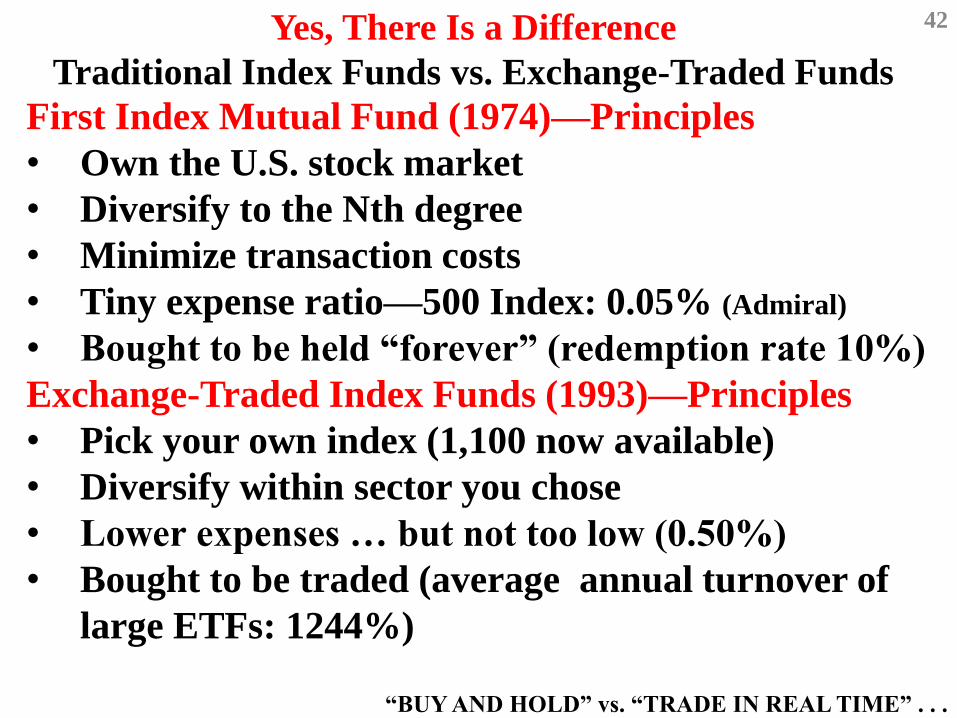
First Index Mutual Fund (1974)—Principles
• Own the U.S. stock market
• Diversify to the Nth degree
• Minimize transaction costs
• Tiny expense ratio—500 Index: 0.05% (Admiral)
• Bought to be held “forever” (redemption rate 10%)
Exchange-Traded Index Funds (1993)—Principles
• Pick your own index (1,100 now available)
• Diversify within sector you chose
• Lower expenses … but not too low (0.50%)
• Bought to be traded (average annual turnover of
large ETFs: 1244%)
Yes, There Is a Difference
Traditional Index Funds vs. Exchange-Traded Funds
42
“BUY AND HOLD” vs. “TRADE IN REAL TIME” . . .

Speculation or Investment? A Tale of Two Strategies
Trading in the 100 Largest Stocks and ETFs
100 Largest Stocks 100 Largest ETFs
ETF $ Vol
% of Stock
$ Trading
Volume
Turnover
Ratio
$ Trading
Volume
Turnover
Ratio
1995
(Low) $2.4 T 128% $4.5 B 90% 0.2%
2000 17.0 T 222 1.2 T 292 7
2005 10.6 T 166 4.7 T 1879 44
2008
(High) 23.0 T 326 23.7 T 5410 103
2010 18.3 T 262 16.7 T 2838 92
2015* 19.2 T 167 17.1 T 1411 89
Growth
Rate 11% 51%
Average 188% 1895%
*Annualized
43
HOWEVER, WITHIN ETFs, MANY DIFFERENCES

Largest Total Institutional Annualized Annualized
ETF Sponsors Assets Ownership Turnover Turnover %
BlackRock $809 B 62% $4,910 B 606%
Vanguard 469 43 908 193
State Street Global 409 63 8,692 2,122
Total $1,687 B 56% $14,510 B 859%
Most Active ETF Sponsors
PowerShares $97 B 40% $928 B 953%
ProShares 25 12 873 3,444
Direxion 9 5 506 5,551
VelocityShares 3 7 299 10,308
Total $134 B 16% $2,606 B 1,936%
All ETFs Are Not the Same Assets, Institutional Ownership, and Turnover
44
TIFs MAY HAVE CLOSE “ACTIVE” COUNTERPARTS . . .

Vanguard
Fund
Correlations
The Triumph of
Indexing (and
Virtual Indexing)
R2: The percentage of a
fund’s return explained by
the return of its best-fit
index.
Fund Name R2
(10-Year)
R2
(3-Year)*
Index Funds
Total Stock Market Index 1.00 1.00
Total Bond Market Index 0.99 0.99
Active Funds
STAR Fund 0.99 0.99
Explorer Fund 0.99 0.97
Wellington Fund 0.97 0.97
Intermediate-Term Tax-Exempt 0.97 0.99
Windsor Fund 0.95 0.94
PRIMECAP Fund 0.93 0.88
Health Care Fund 0.92 0.90
Average Vanguard Active
Equity Fund 0.95 0.93
Average Industry Active
Equity Fund 0.88 0.79
In 1974, “Relative Predictability.” Now, “High R2.” 45

Note: “Virtual Index Fund” – R-Squared of 0.96 or higher relative to best-fit index.
“Relative Predictability” Dominates
Vanguard’s Asset Base 91% of Vanguard’s Assets Have High Relative Predictability
(Average pre-cost returns . . . superior post-cost returns)
Index
Funds
Virtual
Index
Funds
19%
Active
Funds
9%
46
NOW LET’S LOOK AHEAD AT FUTURE RETURNS ON STOCKS AND BONDS . . .

4.7%
5%
4%
2%
0.4% -1%
-2%
0%
2%
4%
6%
8%
10%
Historical Next 10 Years
Earnings Growth*
Dividend Yield
Speculative Return*
Looking Ahead 1.—No Great Alternatives Reasonable Expectations for Stocks—Below Long-Term Norms
9.1%
6%
Historical
Returns
9%
-2
7%
Active
6%
-2
4%
Index
6%
-0.05
5.95%
Prospective
Gross Return
Costs
Net Return
*Assumed decline in
P/E from 20x to 17x
Sources of Annual
Returns on Stocks
47
WHAT ABOUT BONDS? . . .

4.6%
3%
0%
1%
2%
3%
4%
5%
Historical Next 10 Years*
Looking Ahead 2.—No Great Alternatives Reasonable Expectations for Bond Returns—Below Long-Term Norms
Source of Annual Returns on
Bonds—Initial Yield
*Assumes accepting slight additional credit risk
and interest rate risk vs. the broad bond market
48
YET, REAL INTEREST RATES CLOSE TO LONG-TERM NORMS . . .

-25
-20
-15
-10
-5
0
5
10
15
20
25Nominal 10-Year Treasury
Real 10-Year Treasury
1900 1920 1940 1960 1980 2000 2015
Real versus Nominal Treasury Rates 49
Average 1900-
2015
1950-
2015
10/
2015
Nominal 4.8% 5.8% 2.1%
Real 1.6 2.2 1.8
SO, EXPECTATIONS FOR LOW RETURN ON A BALANCED PORTFOLIO . . .

Balanced Portfolio Returns Also Below Norm of 7%
Reasonable Expectations: Nominal Gross Return
(50/50 Stock/Bond):
4.5%
Don’t Forget These Deductions
-1.5% Active Fund Costs
or
-0.05% Index Fund Costs
* * *
-2% Inflation
-0.5% Taxes
-1.5% Investor Behavior
Looking Ahead 3.—No Great Alternatives 50
YET MUTUAL FUNDS WILL CONTINUE TO DOMINATE INVESTOR SAVINGS. WHY? . . .

“The vast majority of American
families are sentenced to a lifetime
of investing in the existing mutual
fund penal system. But if they’re
smart, they’ll do their time in an
index fund.”
John Bogle
Grant’s “Great Debate”
April 7, 2015
Mutual Funds Are the Only Practical
Investment Option for Individual Investors
51
AS YOU CONSIDER YOUR FUND STRATEGY, REMEMBER THESE WORDS . . .

1. Tibble v. Edison
Unanimous ruling of the U.S. Supreme Court
reaffirming fiduciary duty for retirement plans
From The New York Times, 2/24/2015:
Jonathan Hacker, a lawyer for Edison, said it can’t be the case that companies have to “constantly look and scour the market for … cheaper investment options,” for retirement-plan participants.
“Well, you certainly do, if that’s what a prudent trustee would do,” Justice Anthony Kennedy responded.
Four Closing Quotations: 52

2. Andrew Ang Professor, Columbia Business School; Author, Asset Management
“… Fund managers’ real loyalty lies with the firm that runs the funds, rather than with the investors who are the owners of the fund. The relationship is incestuous, and investors lose. Many directors of the mutual fund—especially the board chair—are insiders of the investment advisory firm. Fund directors usually do not, and in many cases cannot, independently verify the information given by the advisor. Separating the fund’s governance from its sponsor is not enough to ensure protection of the investors.”
53

“Ultimately, a passive index fund managed by a
non-for-profit investment management
organization represents the combination most
likely to satisfy investor aspirations. … Out of
the enormous breadth and complexity of the
mutual-fund world, the preferred solution for
investors stands alone in stark simplicity.”
3. David Swensen Manager, Yale University Endowment Fund
54

“The interest of the producer ought to be
attended to, only so far as it may be necessary
for promoting that of the consumer. The maxim
is so perfectly self-evident, that it would be
absurd to attempt to prove it. … The interest of
the consumer must be the ultimate end and
object of all industry and commerce.”
4. Adam Smith From The Wealth of Nations, 1776
55
Yes, the interests of fund shareholders (consumers) will, finally,
triumph over the interests of fund managers (producers).
Thank you for your confidence. “STAY THE COURSE”