steward funds semi-annual report - … · we are pleased to present the steward funds semi-annual...
TRANSCRIPT
CROSSMARKGLOBAL.COM October 31, 2017
STEWARD FUNDSSEMI-ANNUAL REPORT(UNAUDITED)

TABLE OF CONTENTS
Letter to Shareholders and Manager Commentaries . . . . . . . . . . . . . . . . . . . . . . . . . . . . . . . . . . . . . . . . . . . . . . 1
Schedules of Portfolio Investments . . . . . . . . . . . . . . . . . . . . . . . . . . . . . . . . . . . . . . . . . . . . . . . . . . . . . . . . . 7
Financial Statements . . . . . . . . . . . . . . . . . . . . . . . . . . . . . . . . . . . . . . . . . . . . . . . . . . . . . . . . . . . . . . . . . . . 40
Notes to Financial Statements . . . . . . . . . . . . . . . . . . . . . . . . . . . . . . . . . . . . . . . . . . . . . . . . . . . . . . . . . . . . . 50
General Information . . . . . . . . . . . . . . . . . . . . . . . . . . . . . . . . . . . . . . . . . . . . . . . . . . . . . . . . . . . . . . . . . . . 59

Semi-Annual ReportSteward Large Cap Enhanced Index Fund
Steward Small-Mid Cap Enhanced Index FundSteward International Enhanced Index Fund
Steward Select Bond FundSteward Global Equity Income Fund
October 31, 2017
Dear Shareholder:
We are pleased to present the Steward Funds Semi-Annual Report for the six months ended October 31, 2017. The Semi-AnnualReport includes commentary on the Funds’ screening process, as well as performance reviews and current strategy from theportfolio managers.
Steward Funds Offer Diversification to Your Portfolio
The asset allocation decision is one of the most important decisions an investor will make and the Steward Funds make itpossible to achieve a diverse asset allocation for your investment portfolio. The Funds offer fixed income, large-cap equity,small/mid-cap equity, international equity and global equity income for your investing solutions.
The Steward Funds’ Values-Based Screens
Values-based screens are applied to all of the investments within the Steward Funds family. The Steward Funds seek to avoidinvestment in mature content and life ethics, as well as companies that are substantial producers of alcohol, gambling andtobacco. The Funds’ screening resource firm, Crossmark Consulting Services, LLC (formerly, CFS Consulting Services, LLC)(‘‘CCS’’), has extensive experience in the values-based investing business and brings a wealth of knowledge of screening forinvestors.
The following details each of the Fund’s semi-annual performance and strategies.
STEWARD LARGE CAP ENHANCED INDEX FUNDFund Performance
For the six months ended October 31, 2017, the Steward Large Cap Enhanced Index Fund returned 9.41% for the Individualclass shares and 9.57% for the Institutional class shares. For comparison purposes, the return for the S&P 500 Index for thesame period was 9.10%. The S&P Pure Index returns were 13.82% for the S&P 500 Pure Growth Index and 7.30% for the S&P500 Pure Value Index.
Factors Affecting Performance
The Fund’s blended-factor structure remained at neutral for the six-month period at 60% large cap stocks, 20% in value stocksand 20% in growth stocks. Performance has been aided by an equity rally, which started after last year’s election and hascontinued through this October. The economy has also been improving to the point that the Federal Reserve has resumed its ratehike plan and announced a detailed plan to shrink its balance sheet after years of expansion. The Purchasing Managers Indexeshave both moved solidly above 50 indicating expansion in both the manufacturing and service sectors. The October readingswere 58.7 and 60.1, respectively. Currently, economies worldwide appear to be in a globally synchronized expansion includingthe U.S., Europe and the Far East. Generally, this is quite positive for stock prices. Corporate profits have improved markedlysince last year with third quarter expectations rising from 3.1% in September to 6.1% currently. Expectations for calendar year2017 are for S&P 500 per share profits to rise about 10%.
The factor-focused growth and value components, when combined, have outperformed their cap-weighted counterparts over theperiod, contributing to the Fund’s superior return.
Performance of the Fund can also be affected by the Fund’s values-based investment policies, which avoid investments incompanies whose primary business is associated with alcohol, tobacco products, life ethics, gambling and mature content. Forthe six months ended October 31, 2017, the values-based investment policies had a net positive performance impact on theFund. Companies such as General Electric (life ethics), down 29.18%, and Merck (life ethics), down 10.33%, significantlyunderperformed the benchmark and added approximately 77 basis points to Fund performance. Compensating for a specificrestricted industry or company whose total return deviates dramatically from the overall benchmark is extremely difficultregardless of its weight within that specific benchmark.
1
Current Strategy
The Fund is not a passively managed index Fund. The Fund’s strategy seeks to enhance its performance over that of its primarybenchmark index by 1) changing the relative weighting in the Fund’s portfolio of growth versus value style securities and2) utilizing computer-aided quantitative analysis of valuation, growth, dividend yield, industry and other factors to attempt tocompensate for the exclusion of certain index securities due to the Fund’s values-based investment policies.
STEWARD SMALL-MID CAP ENHANCED INDEX FUND
Fund Performance
For the six months ended October 31, 2017, the Steward Small Mid-Cap Enhanced Index Fund returned 6.91% for theIndividual class shares and 7.11% for the Institutional class shares. For comparison purposes, the return for the S&P 1000 Indexfor the same period was 7.08%. The S&P Pure Index component returns were 9.08% for the S&P 1000 Pure Growth Index and5.25% for the S&P 1000 Pure Value Index.
Factors Affecting Performance
The Fund’s blended-factor structure remained at neutral for the six-month period at 60% small and mid cap stocks, 20% in valuestocks and 20% in growth stocks. Performance has been aided by an equity rally which started after last year’s election and hascontinued through this October. The economy has also been improving to the point that the Federal Reserve has resumed its ratehike plan and announced a detailed plan to shrink its balance sheet after years of expansion. The Purchasing Managers Indexeshave both moved solidly above 50 indicating expansion in both the manufacturing and service sectors. The October readingswere 58.7 and 60.1, respectively. Currently, economies worldwide appear to be in a globally synchronized expansion includingthe U.S., Europe and the Far East. Generally, this is quite positive for stock prices. Corporate profits have improved markedlysince last year with third quarter expectations rising from 3.1% in September to 6.1% currently. Expectations for calendar year2017 are for S&P 500 per share profits to rise about 10%. For the six month period ended October 31, 2017, the S&P 1000Small Cap Index underperformed its large cap counterpart, the S&P 500 Index, by 202 basis points due to the superiorperformance of larger cap stocks for the period.
The factor-focused growth and value components, when combined, have outperformed their cap-weighted counterparts over theperiod, contributing to the Fund’s return.
Performance of the Fund can also be affected by the Fund’s values-based investment policies which avoid investments incompanies whose primary business is associated with alcohol, tobacco products, life ethics, gambling and mature content. Forthe six months ended October 31, 2017, the values-based investment policies had a positive performance impact on the Fund.Companies such as MEDNAX, Inc. (life ethics) and Cheesecake Factory Inc. (alcohol) significantly underperformed thebenchmark with losses of 27.45% and 29.53%, respectively. Compensating for a specific restricted industry or company whosetotal return deviates dramatically from the overall benchmark is extremely difficult regardless of its weight within that specificbenchmark.
Current Strategy
The Fund is not a passively managed index Fund. The Fund’s strategy seeks to enhance its performance over that of its primarybenchmark index by 1) changing the relative weighting in the Fund’s portfolio of growth versus value style securities and2) utilizing computer-aided quantitative analysis of valuation, growth, dividend yield, industry and other factors to attempt tocompensate for the exclusion of certain index securities due to the Fund’s values-based investment policies.
2

STEWARD INTERNATIONAL ENHANCED INDEX FUND
Fund Performance
For the six months ended October 31, 2017, the Steward International Enhanced Index Fund returned 12.05% for the Individualclass shares and 12.19% for the Institutional class shares. The return for the S&P ADR Index was 10.83%. The BLDRSEmerging Markets 50 ADR Index Fund, used to represent the emerging markets component, returned 18.05% for the sameperiod.
Factors Affecting Performance
For the six months ended October 31, 2017, the Fund’s dual market structure of allocating a portion of the portfolio towarddeveloped and emerging markets was allocated at 80% and 20%, respectively. This represents a 5% tilt towards emergingmarkets. The Fund has maintained this allocation for the entire period. The emerging markets tilt significantly boosted theFund’s performance during the six month period. Markets worldwide continue their strong upward trend. In the U.S. thepost-election rally has continued through October without posting a down month (dividends included), making it the twelfthmonth in a row of positive total returns. Also, in September, the U.S. bull market officially became the second strongest bullmarket since World War II. The market has been quite resilient, powering through the failure of healthcare legislation, fightsover tax legislation, continued gridlock in Washington D.C. and a host of other problems. Even three massive hurricanes couldnot slow this market down.
As strong as stocks have been in the U.S., overseas markets have been stronger in many cases. The MSCI World Index (ex-US)recently hit a new nine-year high has returned 12.28% over the last six months and besting the S&P 500 Index by 318 basispoints. Emerging markets, as represented by the BLDRS Emerging Markets 50 ADR Index, have performed exceptionally wellover the period, returning 18.05%. It appears that we are in a synchronized global recovery, which is quite positive for stockprices. Surveys from the European Union are strong. IHS Markit’s survey for the Europe Sector PMI posted a solid 56 forOctober (a reading above 50 indicates expansion). The United Kingdom, which was supposed to be hobbled by 2016’s Brexitdecision, posted a 55.6 reading. Corporate earnings also look impressive. In the U.S., corporate profits have improved markedlysince last year with third quarter growth expectations rising from 3.1% in September to 6.1% currently. Expectations forcalendar year 2017 are for S&P 500 per share profits to rise about 10%. According to Factset’s earnings service, earnings shouldgrow at a double digit rate for the next twelve months for the U.S., developed markets and emerging markets. When PresidentTrump was first elected, many feared his ‘‘America First’’ policy would hurt foreign markets but those fears have fadedover time.
The emerging markets component of the Fund outperformed the international developed markets during the period. Emergingmarket companies such as Sociedad Quimica Y Minera De Chile S.A. and Alibaba Group Holding were among the chief factorswith returns of 71.49% and 60.08%, respectively.
Performance of the Fund can also be affected by the Fund’s values-based investment policies which avoids investments incompanies whose primary business is associated with alcohol, tobacco products, life ethics, gambling and mature content. Forthe six months ended October 31, 2017, the values-based investment policies had a positive performance impact of 52 basispoints on the Fund. Companies such as GlaxoSmithKline (life ethics) and British American Tobacco (tobacco) substantiallyunderperformed the benchmark with returns of -8.78% and -4.22%, respectively.
Compensating for a specific restricted industry or company whose total return deviates dramatically from the overall benchmarkis extremely difficult regardless of its weight within that specific benchmark.
Current Strategy
The Fund is not a passively managed index Fund. The Fund’s strategy seeks to enhance its performance over that of its primarybenchmark index by 1) changing the relative weighting in the Fund’s portfolio of equity securities of developed marketcompanies and of emerging market companies and 2) utilizing computer-aided quantitative analysis of valuation, growth,dividend yield, industry and other factors to attempt to compensate for the exclusion of certain index securities due to the Fund’svalues-based investment policies.
3

STEWARD SELECT BOND FUND
Market Overview
The final days of October were filled with events pushing and pulling the markets in different directions. Besides the earningsreporting season, we had the announcement of a new Federal Reserve chairperson, the Federal Open Market Committee(FOMC) meeting and the introduction of the proposed tax plan from Congress. So what do we do with all of this informationand how does that affect you as an investor?
For the immediate future, we believe investors should continue on their current path with business as usual. Therecommendation from President Trump of Jerome Powell as the new Federal Reserve chairperson will most likely result in acontinued measured raising of the Fed Funds rate towards the neutral rate of about 2%. As the remainder of the vacant seats onthe committee are filled, we could see a shift in the tone of the FOMC over time, but for the rest of this year and into 2018, theintentions of the FOMC have been well telegraphed. And due to this previously laid out plan, there was no expectation of a ratehike at the November 1st meeting. The language was slightly altered to show stronger growth in the economy over the lastmonth, but no shifts in the presumption of one more hike this year at the December meeting which futures are currently givingabout a 92% chance of happening.
Although the new Federal Reserve chairperson announcement and the November meeting did not substantially shake up themarket, we have seen movement from both earnings and the proposed tax plan. For the majority of companies that have reportedso far, earnings were strong this quarter and the tax plan gives additional information for corporations and individuals to digestin what their tax expense looks like going forward. With continued uncertainty in the market regarding earnings and policies outof Washington D.C., the Steward Select Bond Fund will continue with a conservative strategy for its taxable fixed incomeinvestments. We accomplish this by reducing the Fund’s sensitivity to interest rate movements as it appears rates will movehigher over the coming quarters and couple that with higher levels of income to buffer any volatility in market values. When wesee the U.S. 10yr Treasury rates break above the higher-end of the current trading range towards the recent year highs of around2.60%, we will have the opportunity to adjust our strategy, move further out the yield curve, and benefit from differing marketdynamics.
Fund Performance
As we look over the past six months, the U.S. 10yr Treasury yield has moved from 2.28% at the end of April to 2.38% as wewrapped up the month of October. However, just examining the two end points does not give us a clear picture of whathappened in between. From the end of April until the second week of September, yields continued their slide downwards to2.04% on September 7th. During this falling rate environment, the Steward Select Bond Fund lagged the Barclay’s indices as theFund has a more conservative positioning that reduces volatility to interest rate movements and therefore less fluctuations inmarket value. Following the 2.04% level in September, yields shifted their trajectory and began moving higher through the endof October. During September and October, the Fund was in a favorable position and outperformed the Barclays CapitalIntermediate US Aggregate Bond Index during both months with duration, allocation and income components providing thelargest positive contributions to return. With the quick rise in September, the Fund also outperformed the Barclays Capital USGovernment/Credit Bond Index for that month while performing roughly in line during October with just a 4 basis pointdifference between them. Although the short duration strategy worked well towards the end of this six-month stretch, fallingrates for the first four months worked against us and the Fund returned 0.97% for the period versus 1.01% for the BarclaysCapital Intermediate US Aggregate Bond Index and 1.76% for the Barclays Capital US Government/Credit Bond Index.
Portfolio Strategy
The FOMC will hold its next meeting in December concluding with a press conference on December 13th. The futures markethas priced in over a 92% probability that the Federal Reserve will raise the Fed Funds Rate to a range of 1.25 − 1.50%. Themarkets have been well prepared by the Fed for such a move along with the possibility of 2 − 3 additional hikes in 2018. Basedon our 4-step investment process which includes decisions on duration, yield curve placement, sector and security selection, ourstrategy for the immediate future will be to maintain a lower duration positioning in the Fund versus the Barclays CapitalUS Government/Credit Bond Index in order to buffer volatility around interest rate movements. As we see treasury yields beginto reach the upper regions of recent trading ranges, we will take the opportunity to extend our duration and move out the yieldcurve. We maintain an overweight to the investment-grade corporate allocation to benefit from the income flow it provides whileadding a small allocation to fixed-rate preferred stocks to further the benefit from income to total return.
4

STEWARD GLOBAL EQUITY INCOME FUND
Fund Performance
For the six months ended October 31, 2017, the Steward Global Equity Income Fund returned 10.46% for the Individual classshares and 10.64% for the Institutional class shares. The return for the S&P 500 Index was 9.10% and the return for the globalmarket as represented by the S&P Global 1200 Index was 10.37% for the same period. For dividend income comparisonpurposes, the MSCI World High Dividend Yield Index returned 7.88%.
Factors Affecting Performance
The U.S. economy appears to be picking up momentum as the second quarter GDP came in stronger than expected at 3.1%. Theearly initial estimate for the third quarter is also coming in at a similar strong pace of 3.0%. The Federal Reserve is expected tohave one more rate hike in December and to begin the balance sheet normalization process. On the political front, a dealreaching across the aisle resulted in putting spending and debt ceiling debates on hold until December. The next significant itemis tax reform and whether the Republicans can produce a tax plan that will be capable of getting enough votes. The prospects forpassing such tax legislation will ultimately depend on whether they can reconcile their desire for tax cuts versus not wanting toincrease the deficit. The Canadian economy is anticipated to continue with above trend growth for 2017. The Bank of Canadahas begun raising interest rates to moderate the economy’s unexpected strength. Stronger than expected economic growth in theUnited Kingdom has shifted the Bank of England’s concern of a drag from Brexit. Japan has joined this economic pattern withthree consecutive quarters of growth at nearly double its normal trend rate. Global growth in the first half of 2017 has averaged3.5% making this the strongest economic start since 2014.
Company earnings have moderated slightly from the strong start of 2017. For the second quarter as represented by the S&P 500Index, earnings grew 10.4% over the previous quarter. Estimated earnings growth for the full year of 2017 is now expected toincrease 9.0%. While a strong rebound from the energy sector is making a significant contribution, all sectors have participatedin positive earnings growth for the second quarter.
The Fund’s allocation at the end of the period was 59% U.S. and 41% international with international stocks outperforming theirdomestic counterparts during the period. Positive contributors to relative return were once again led by Taiwan SemiconductorManufacturing Co. +31.26%. The chip supplier generates 64% of its revenue from the U.S. and Apple Inc. is its largest clientrepresenting one fifth of sales. The Fund trimmed the position slightly in August. Banco Santander-Chile +32.37% shares roseon quarterly earnings that easily beat analyst consensus estimates. Revenue soared to $704 million during the quarter, which wassubstantially higher than analyst expectations of $459 million. Shares of Magna International Inc. +32.17% climbed on a solidsecond quarter earnings report with revenues of $9.7 billion. In addition, the company raised its full year 2017 guidanceexpectations by $1.1 billion. The innovative company is at the forefront of self-driving automation technology that can beintegrated into any vehicle.
Underperforming holdings on a relative basis for the quarter included Quest Diagnostics Inc. -10.32%. An analyst downgrade tomarket perform from outperform negatively impacted the stock. This follows a quarter where the stock significantlyoutperformed the market. The downgrade was issued despite good second quarter results with solid earnings, revenue thatmatched analyst expectations and a slight increase to full year guidance. Shares of advertising firm WPP Plc -14.30% droppedafter the company reported an organic revenue decline of 1.7% versus expectations of a 1.0% increase. This coincided with asimilar reduction of guidance for the year which reflected the drop in revenue. The significant decline in the stock’s valuehowever appears to be worse than warranted by the results. Overall, the Fund’s methodology has performed very well for theperiod and will continue to seek high quality dividend paying companies that can provide solid performance over the long term.
Performance of the Fund can also be affected by the Fund’s values-based values investment policies which avoid investments incompanies whose primary business is associated with alcohol, tobacco products, life ethics, gambling and mature content.Compensating for a specific restricted industry or company whose total return deviates dramatically from the overall benchmarkis extremely difficult regardless of its weight within that specific benchmark.
5

Current Strategy
The Fund’s strategy pursues its objective through the investment of dividend paying stocks that have demonstrated abovemedian yield and a favorable trend in dividend and earnings growth. In addition to domestic stocks, this strategy includes theability to invest in international securities traded on U.S. market exchanges. As the international market’s share of the world’stotal market capitalization continues to grow, the ability to access these markets becomes increasingly important.
The benefits of dividend paying stocks include lower volatility versus non-dividend payers and the overall market. Dividends arean important indicator of corporate strength. Therefore companies are reluctant to change a policy that encourages disciplinedmanagement, since that could signal corporate distress. Unlike earnings, which can be affected by various accounting methods,dividends are transparent and cannot be manipulated. In addition, dividends have historically provided a major component of thestock market’s total return. The strategy provides income with capital appreciation while lowering overall risk. This isaccomplished while adhering to the Fund’s values-based investment policies.
We Thank You for Your Continued Investment in the Steward Funds
Your business is important to us. The current total net assets of the Funds have exceeded $1 billion. This growth would not havebeen possible without the many referrals that we have received from our existing clients, as well as your continued investment. Formore information on the Steward Funds, we invite you to visit our website at http://www.crossmarkglobal.com/stewardfunds/ or callus at 800-262-6631. We look forward to fulfilling your investment needs for many years to come.
Sincerely,
Michael L. Kern, III, CFAPresident
Melville CodySenior Portfolio Manager
Zachary Wehner, JDPortfolio Manager
Victoria FernandezManaging Director — Fixed Income Investments
John WolfManaging Director — Equity Investments
6

The table below sets forth the diversification of the Steward Large Cap Enhanced Index Fund investments by Industry.
Industry Diversification Percent*
Banks 6.1%Insurance 6.0Semiconductors & Semiconductor Equipment 5.7Software 4.5Oil, Gas & Consumable Fuels 4.4Health Care Equipment & Supplies 4.3Health Care Providers & Services 4.0IT Services 4.0Internet Software & Services 3.9Equity Real Estate Investment Trusts 3.7Technology Hardware, Storage & Peripherals 3.3Capital Markets 3.1Aerospace & Defense 2.7Biotechnology 2.6Electric Utilities 2.3Specialty Retail 2.1Chemicals 1.9Food & Staples Retailing 1.9Diversified Financial Services 1.8Media 1.8Hotels, Restaurants & Leisure 1.7Machinery 1.7Food Products 1.6Diversified Telecommunication Services 1.5Beverages 1.4Multi-Utilities 1.4Household Durables 1.3Household Products 1.3Communications Equipment 1.2Automobiles 1.0Industrial Conglomerates 1.0Pharmaceuticals 1.0
Industry Diversification Percent*
Consumer Finance 0.9%Multiline Retail 0.9Textiles, Apparel & Luxury Goods 0.8Internet & Direct Marketing Retail 0.8Construction & Engineering 0.7Containers & Packaging 0.7Electronic Equipment, Instruments & Components 0.7Airlines 0.7Commercial Services & Supplies 0.6Life Sciences Tools & Services 0.6Electrical Equipment 0.6Money Market Funds 0.6Air Freight & Logistics 0.6Road & Rail 0.6Building Products 0.5Construction Materials 0.5Auto Components 0.5Energy Equipment & Services 0.5Independent Power & Renewable Electricity
Producers 0.4Metals & Mining 0.3Professional Services 0.3Distributors 0.3Health Care Technology 0.2Trading Companies & Distributors 0.2Personal Products 0.1Water Utilities 0.1Leisure Products 0.1Diversified Consumer Services 0.0Real Estate Management & Development 0.0
Total Investments 100.0%
* Percentages indicated are based on net assets as of October 31, 2017.
STEWARD FUNDSSCHEDULE OF PORTFOLIO INVESTMENTS — October 31, 2017 (Unaudited)
STEWARD LARGE CAP ENHANCED INDEX FUND
See notes to financial statements.7

Shares ValueCOMMON STOCKS (99.4%)
AEROSPACE & DEFENSE (2.7%)Arconic, Inc. 70,273 $ 1,765,258General Dynamics Corp. 5,950 1,207,731L3 Technologies, Inc. 1,190 222,744Lockheed Martin Corp. 3,119 961,151Northrop Grumman Corp. 4,220 1,247,137Raytheon Co. 4,090 737,018Rockwell Collins, Inc. 2,100 284,760Textron, Inc. 10,130 534,256The Boeing Co. 6,438 1,660,875TransDigm Group, Inc. 2,670 740,925United Technologies Corp. 9,320 1,116,163
10,478,018
AIR FREIGHT & LOGISTICS (0.6%)C.H. Robinson Worldwide, Inc. 1,690 132,715Expeditors International of
Washington, Inc. 2,060 120,263FedEx Corp. 4,832 1,091,114United Parcel Service, Inc., Class B 8,560 1,006,057
2,350,149
AIRLINES (0.7%)Alaska Air Group, Inc. 1,880 124,136American Airlines Group, Inc. 10,320 483,182Delta Air Lines, Inc. 11,350 567,840Southwest Airlines Co. 15,210 819,211United Continental Holdings, Inc.(a) 13,520 790,650
2,785,019
AUTO COMPONENTS (0.5%)BorgWarner, Inc. 13,640 719,101Delphi Automotive PLC 3,260 323,979Goodyear Tire & Rubber Co. 27,400 838,166
1,881,246
AUTOMOBILES (1.0%)Ford Motor Co. 99,080 1,215,712General Motors Co. 51,300 2,204,874Harley-Davidson, Inc. 8,760 414,698
3,835,284
BANKS (6.1%)Bank of America Corp. 152,729 4,183,247BB&T Corp. 17,600 866,624Citigroup, Inc. 42,420 3,117,870Citizens Financial Group, Inc. 3,890 147,859Comerica, Inc. 2,170 170,497Fifth Third Bancorp 30,320 876,248Huntington Bancshares, Inc. 21,010 289,938JPMorgan Chase & Co. 45,454 4,573,127KeyCorp 31,130 568,123
Shares ValueM&T Bank Corp. 1,020 $ 170,105People’s United Financial, Inc. 27,500 513,150PNC Financial Services Group, Inc. 8,644 1,182,413Regions Financial Corp. 86,492 1,338,896SunTrust Banks, Inc. 15,600 939,276U.S. Bancorp 17,450 948,931Wells Fargo & Co. 50,758 2,849,554Zions Bancorp 12,840 596,546
23,332,404
BEVERAGES (1.4%)Coca-Cola Co. 52,040 2,392,799Dr Pepper Snapple Group, Inc. 5,140 440,292Monster Beverage Corp.(a) 7,090 410,724PepsiCo, Inc. 20,921 2,306,122
5,549,937
BIOTECHNOLOGY (2.6%)AbbVie, Inc. 18,680 1,685,870Alexion Pharmaceuticals, Inc.(a) 2,851 341,151Amgen, Inc. 9,123 1,598,532Biogen Idec, Inc.(a) 4,807 1,498,150Celgene Corp.(a) 16,000 1,615,520Gilead Sciences, Inc. 20,610 1,544,926Incyte Corp.(a) 7,010 793,882Regeneron Pharmaceuticals, Inc.(a) 1,063 427,985Vertex Pharmaceuticals, Inc.(a) 3,150 460,624
9,966,640
BUILDING PRODUCTS (0.5%)A.O. Smith Corp. 7,370 436,304Allegion PLC 963 80,304Fortune Brands Home & Security, Inc. 3,530 233,192Johnson Controls International PLC 16,551 685,046Masco Corp. 7,480 297,854
1,732,700
CAPITAL MARKETS (3.1%)Affiliated Managers Group, Inc. 544 101,456Ameriprise Financial, Inc. 2,036 318,715Bank of New York Mellon Corp. 18,731 963,710BlackRock, Inc., Class A 1,433 674,699CBOE Holdings, Inc. 1,410 159,415Charles Schwab Corp. 23,640 1,060,018CME Group, Inc. 4,135 567,198E*TRADE Financial Corp.(a) 22,668 988,098Franklin Resources, Inc. 2,760 116,279Goldman Sachs Group, Inc. 5,994 1,453,425IntercontinentalExchange Group, Inc. 19,055 1,259,535Invesco Ltd. 6,020 215,456Moody’s Corp. 2,240 318,998Morgan Stanley 27,040 1,352,000Northern Trust Corp. 2,560 239,411
STEWARD FUNDSSCHEDULE OF PORTFOLIO INVESTMENTS — October 31, 2017 (Unaudited)
STEWARD LARGE CAP ENHANCED INDEX FUND
See notes to financial statements.8

Shares ValueRaymond James Financial, Inc. 970 $ 82,237S&P Global, Inc. 6,670 1,043,655State Street Corp. 6,937 638,204T. Rowe Price Group, Inc. 2,590 240,611The NASDAQ OMX Group, Inc. 1,600 116,240
11,909,360
CHEMICALS (1.9%)Air Products & Chemicals, Inc. 3,200 510,176Albemarle Corp. 7,940 1,118,667CF Industries Holdings, Inc. 1,930 73,301DowDuPont, Inc.(a) 26,396 1,908,695Ecolab, Inc. 4,180 546,159FMC Corp. 1,470 136,504International Flavors & Fragrances, Inc. 1,000 147,420LyondellBasell Industries N.V., Class A 3,320 343,720Monsanto Co. 6,110 739,921PPG Industries, Inc. 3,378 392,659Praxair, Inc. 3,460 505,575The Mosaic Co. 25,480 569,223The Sherwin-Williams Co. 975 385,271
7,377,291
COMMERCIAL SERVICES & SUPPLIES (0.6%)Cintas Corp. 5,280 786,931Republic Services, Inc., Class A 10,246 666,708Stericycle, Inc.(a) 1,300 92,105Waste Management, Inc. 6,860 563,686
2,109,430
COMMUNICATIONS EQUIPMENT (1.2%)Cisco Systems, Inc. 55,020 1,878,933F5 Networks, Inc.(a) 7,010 850,103Harris Corp. 5,810 809,449Juniper Networks, Inc. 8,520 211,552Motorola Solutions, Inc. 11,351 1,027,719
4,777,756
CONSTRUCTION & ENGINEERING (0.7%)Fluor Corp. 16,440 708,400Jacobs Engineering Group, Inc. 10,960 637,982Quanta Services, Inc.(a) 34,050 1,284,706
2,631,088
CONSTRUCTION MATERIALS (0.5%)Martin Marietta Materials, Inc. 3,350 726,447Vulcan Materials Co. 9,273 1,128,988
1,855,435
CONSUMER FINANCE (0.9%)American Express Co. 8,670 828,159Capital One Financial Corp. 13,878 1,279,274
Shares ValueDiscover Financial Services 9,280 $ 617,398Navient Corp. 28,500 355,110Synchrony Financial 9,160 298,799
3,378,740
CONTAINERS & PACKAGING (0.7%)Avery Dennison Corp. 1,750 185,797Ball Corp. 3,960 170,003International Paper Co. 4,550 260,578Packaging Corporation of America 9,610 1,117,355Sealed Air Corp. 2,090 92,441WestRock Co. 14,069 862,852
2,689,026
DISTRIBUTORS (0.3%)Genuine Parts Co. 1,430 126,169LKQ Corp.(a) 24,520 924,159
1,050,328
DIVERSIFIED CONSUMER SERVICES (0.0%)H&R Block, Inc. 3,060 75,704
DIVERSIFIED FINANCIAL SERVICES (1.8%)Berkshire Hathaway, Inc., Class B(a) 31,250 5,841,875Leucadia National Corp. 47,590 1,204,027
7,045,902
DIVERSIFIED TELECOMMUNICATION SERVICES (1.5%)AT&T, Inc. 74,308 2,500,464CenturyLink, Inc. 50,204 953,374Level 3 Communications, Inc.(a) 3,560 190,923Verizon Communications, Inc. 47,410 2,269,517
5,914,278
ELECTRIC UTILITIES (2.3%)Alliant Energy Corp. 2,760 119,398American Electric Power Company, Inc. 8,330 619,835Duke Energy Corp. 13,694 1,209,317Edison International 5,000 399,750Entergy Corp. 9,440 814,294Eversource Energy 8,320 521,165Exelon Corp. 33,749 1,357,047FirstEnergy Corp. 22,719 748,591NextEra Energy, Inc. 5,700 883,899PG&E Corp. 8,380 484,113Pinnacle West Capital Corp. 1,620 142,090PPL Corp. 7,780 292,217Southern Co. 10,160 530,352Xcel Energy, Inc. 13,550 670,996
8,793,064
STEWARD FUNDSSCHEDULE OF PORTFOLIO INVESTMENTS — October 31, 2017 (Unaudited)
STEWARD LARGE CAP ENHANCED INDEX FUND
See notes to financial statements.9

Shares ValueELECTRICAL EQUIPMENT (0.6%)Acuity Brands, Inc. 2,330 $ 389,576AMETEK, Inc. 2,850 192,346Eaton Corp. PLC 10,030 802,601Emerson Electric Co. 7,540 486,028Rockwell Automation, Inc. 1,940 389,591
2,260,142
ELECTRONIC EQUIPMENT, INSTRUMENTS &COMPONENTS (0.7%)
Amphenol Corp., Class A 11,550 1,004,850Corning, Inc. 42,080 1,317,525FLIR Systems, Inc. 1,070 50,097TE Connectivity Ltd. 3,650 332,041
2,704,513
ENERGY EQUIPMENT & SERVICES (0.5%)Baker Hughes, a GE company LLC 5,539 174,091Halliburton Co. 10,250 438,085Helmerich & Payne, Inc. 870 47,250National-Oilwell Varco, Inc. 4,946 169,104Schlumberger Ltd. 14,824 948,736TechnipFMC PLC(a) 2,770 75,870
1,853,136
EQUITY REAL ESTATE INVESTMENT TRUSTS (3.7%)Alexandria Real Estate Equities, Inc. 1,260 156,190American Tower Corp. 10,000 1,436,700Apartment Investment & Management Co.,
Class A 17,639 775,763AvalonBay Communities, Inc. 4,804 871,109Boston Properties, Inc. 1,890 229,030Crown Castle International Corp. 5,280 565,382Digital Realty Trust, Inc. 6,800 805,392Duke Realty Corp. 9,360 266,573Equinix, Inc. 904 419,004Equity Residential 6,380 429,119Essex Property Trust, Inc. 715 187,637Extra Space Storage, Inc. 6,620 540,126Federal Realty Investment Trust 860 103,647General Growth Properties, Inc. 21,680 421,893HCP, Inc. 5,330 137,727Host Hotels & Resorts, Inc. 32,363 633,020Iron Mountain, Inc. 2,549 101,960Kimco Realty Corp. 21,130 383,721Macerich Co. 1,210 66,066Mid-America Apartment Communities, Inc. 1,740 178,089Prologis, Inc. 24,202 1,562,965Public Storage, Inc. 1,667 345,486Realty Income Corp. 3,960 212,533Regency Centers Corp. 1,050 64,628SBA Communications Corp.(a) 1,520 238,914
Shares ValueSimon Property Group, Inc. 3,590 $ 557,635SL Green Realty Corp. 990 94,723UDR, Inc. 21,830 846,786Ventas, Inc. 4,480 281,120Vornado Realty Trust 2,105 157,580Welltower, Inc. 11,900 796,824Weyerhaeuser Co. 7,989 286,885
14,154,227
FOOD & STAPLES RETAILING (1.9%)Costco Wholesale Corp. 7,900 1,272,532CVS Corp. 21,405 1,466,885SYSCO Corp. 8,060 448,297The Kroger Co. 30,080 622,656Walgreens Boots Alliance, Inc. 13,260 878,740Wal-Mart Stores, Inc. 31,390 2,740,661
7,429,771
FOOD PRODUCTS (1.6%)Archer-Daniels-Midland Co. 33,130 1,354,023Campbell Soup Co. 3,910 185,217ConAgra Foods, Inc. 6,230 212,817General Mills, Inc. 10,390 539,449Hormel Foods Corp. 7,560 235,570J.M. Smucker Co. 1,680 178,164Kellogg Co. 5,120 320,154McCormick & Company, Inc. 2,610 259,773Mondelez International, Inc., Class A 20,570 852,215The Hershey Co. 2,570 272,882The Kraft Heinz Co. 7,856 607,504Tyson Foods, Inc., Class A 15,440 1,125,730
6,143,498
HEALTH CARE EQUIPMENT & SUPPLIES (4.3%)Abbott Laboratories 26,252 1,423,646Align Technology, Inc.(a) 9,530 2,277,479Baxter International, Inc. 10,800 696,276Becton, Dickinson & Co. 6,031 1,258,489Boston Scientific Corp.(a) 45,127 1,269,874C.R. Bard, Inc. 2,836 927,571Danaher Corp. 10,210 942,077Dentsply Sirona, Inc. 4,300 262,601Edwards Lifesciences Corp.(a) 7,250 741,168Hologic, Inc.(a) 9,160 346,706IDEXX Laboratories, Inc.(a) 9,720 1,615,172Intuitive Surgical, Inc.(a) 3,231 1,212,788Medtronic PLC 19,013 1,530,927ResMed, Inc. 1,590 133,846Stryker Corp. 7,430 1,150,684Varian Medical Systems, Inc.(a) 2,660 277,145Zimmer Holdings, Inc. 3,020 367,292
16,433,741
STEWARD FUNDSSCHEDULE OF PORTFOLIO INVESTMENTS — October 31, 2017 (Unaudited)
STEWARD LARGE CAP ENHANCED INDEX FUND
See notes to financial statements.10

Shares ValueHEALTH CARE PROVIDERS & SERVICES (4.0%)Aetna, Inc. 11,004 $ 1,871,010AmerisourceBergen Corp. 11,510 885,694Anthem, Inc. 12,370 2,587,928Cardinal Health, Inc. 15,660 969,354Centene Corp.(a) 22,810 2,136,613CIGNA Corp. 7,130 1,406,178DaVita, Inc.(a) 7,730 469,520Envision Healthcare Corp.(a) 1,860 79,236Express Scripts Holding Co.(a) 16,141 989,282Henry Schein, Inc.(a) 3,240 254,664Humana, Inc. 5,143 1,313,265Laboratory Corporation of America
Holdings(a) 2,160 332,014McKesson Corp. 8,695 1,198,867Patterson Companies, Inc. 12,970 479,890Quest Diagnostics, Inc. 3,000 281,340
15,254,855
HEALTH CARE TECHNOLOGY (0.2%)Cerner Corp.(a) 11,000 742,720
HOTELS, RESTAURANTS & LEISURE (1.7%)Carnival Corp., Class A 9,560 634,688Chipotle Mexican Grill, Inc.(a) 328 89,183Hilton Worldwide Holdings, Inc. 2,930 211,780Marriott International, Inc., Class A 8,476 1,012,712McDonald’s Corp. 10,160 1,695,806Royal Caribbean Cruises Ltd. 2,180 269,819Starbucks Corp. 33,840 1,855,786Wyndham Worldwide Corp. 1,780 190,193YUM! Brands, Inc. 5,490 408,731
6,368,698
HOUSEHOLD DURABLES (1.3%)D.R. Horton, Inc. 27,016 1,194,377Garmin Ltd. 9,800 554,778Leggett & Platt, Inc. 1,580 74,671Lennar Corp., Class A 15,490 862,328Mohawk Industries, Inc.(a) 744 194,750Newell Rubbermaid, Inc. 7,080 288,722Pulte Group, Inc. 32,985 997,137Whirlpool Corp. 4,602 754,406
4,921,169
HOUSEHOLD PRODUCTS (1.3%)Church & Dwight Company, Inc. 5,740 259,276Clorox Co. 2,270 287,223Colgate-Palmolive Co. 12,280 865,126Kimberly-Clark Corp. 5,950 669,434Procter & Gamble Co. 31,811 2,746,562
4,827,621
Shares ValueINDEPENDENT POWER & RENEWABLE ELECTRICITY
PRODUCERS (0.4%)NRG Energy, Inc. 34,820 $ 870,500The AES Corp. 75,140 798,738
1,669,238
INDUSTRIAL CONGLOMERATES (1.0%)3M Co. 8,014 1,844,743Honeywell International, Inc. 10,140 1,461,782Roper Industries, Inc. 1,392 359,373
3,665,898
INSURANCE (6.0%)AFLAC, Inc. 12,900 1,082,181American International Group, Inc. 22,754 1,470,136Aon PLC 3,910 560,811Arthur J. Gallagher & Co. 7,920 501,574Assurant, Inc. 12,720 1,280,268Brighthouse Financial, Inc.(a) 2,758 171,492Chubb Ltd. 10,441 1,574,712Cincinnati Financial Corp. 2,032 142,585Everest Re Group, Ltd. 3,170 752,717Hartford Financial Services Group, Inc. 23,250 1,279,912Lincoln National Corp. 16,486 1,249,309Loews Corp. 22,970 1,137,245Marsh & McLennan Companies, Inc. 11,040 893,467MetLife, Inc. 30,340 1,625,617Principal Financial Group, Inc. 10,170 669,694Progressive Corp. 17,570 854,781Prudential Financial, Inc. 17,665 1,951,276The Allstate Corp. 16,770 1,574,032The Travelers Companies, Inc. 10,020 1,327,149Torchmark Corp. 4,507 379,174Unum Group 21,930 1,141,237Willis Towers Watson PLC 1,670 269,004XL Group Ltd. 26,730 1,081,763
22,970,136
INTERNET & DIRECT MARKETING RETAIL (0.8%)Expedia, Inc. 7,195 896,929Priceline.com, Inc.(a) 1,147 2,193,018TripAdvisor, Inc.(a) 3,565 133,687
3,223,634
INTERNET SOFTWARE & SERVICES (3.9%)Akamai Technologies, Inc.(a) 11,160 583,110Alphabet, Inc., Class A(a) 3,447 3,560,889Alphabet, Inc., Class C(a) 3,490 3,548,074eBay, Inc.(a) 16,280 612,779Facebook, Inc.(a) 33,140 5,967,188VeriSign, Inc.(a) 5,810 624,691
14,896,731
STEWARD FUNDSSCHEDULE OF PORTFOLIO INVESTMENTS — October 31, 2017 (Unaudited)
STEWARD LARGE CAP ENHANCED INDEX FUND
See notes to financial statements.11
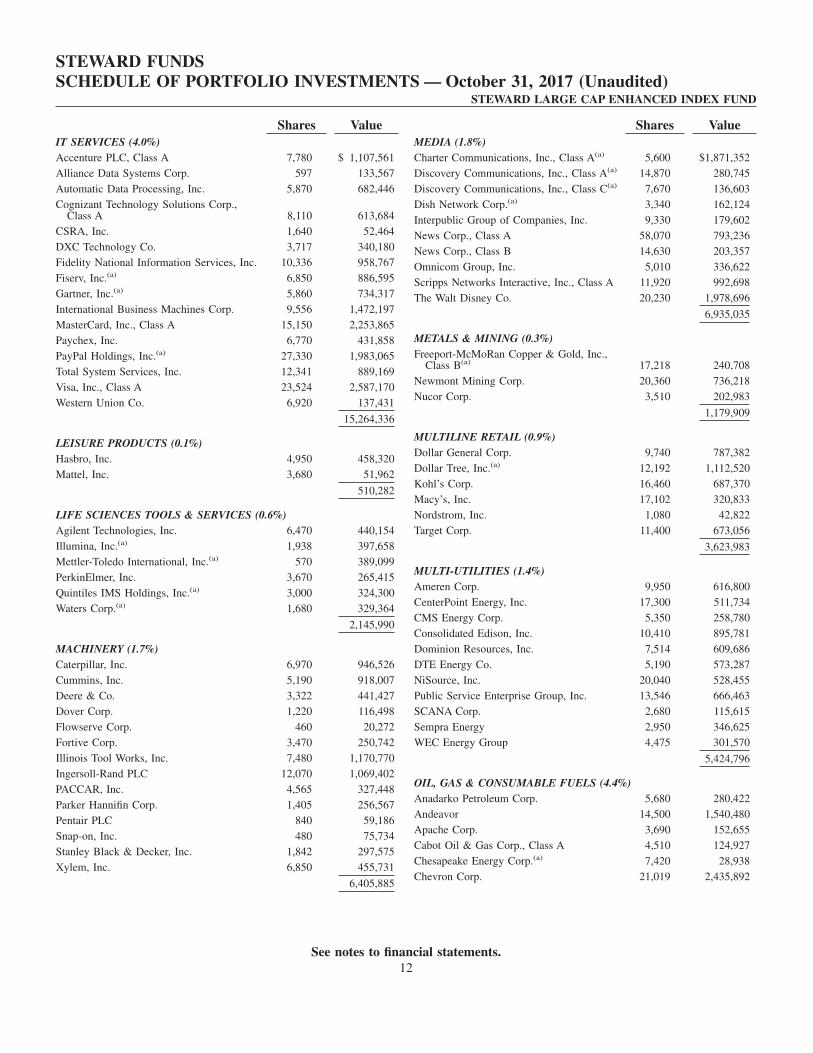
Shares ValueIT SERVICES (4.0%)Accenture PLC, Class A 7,780 $ 1,107,561Alliance Data Systems Corp. 597 133,567Automatic Data Processing, Inc. 5,870 682,446Cognizant Technology Solutions Corp.,
Class A 8,110 613,684CSRA, Inc. 1,640 52,464DXC Technology Co. 3,717 340,180Fidelity National Information Services, Inc. 10,336 958,767Fiserv, Inc.(a) 6,850 886,595Gartner, Inc.(a) 5,860 734,317International Business Machines Corp. 9,556 1,472,197MasterCard, Inc., Class A 15,150 2,253,865Paychex, Inc. 6,770 431,858PayPal Holdings, Inc.(a) 27,330 1,983,065Total System Services, Inc. 12,341 889,169Visa, Inc., Class A 23,524 2,587,170Western Union Co. 6,920 137,431
15,264,336
LEISURE PRODUCTS (0.1%)Hasbro, Inc. 4,950 458,320Mattel, Inc. 3,680 51,962
510,282
LIFE SCIENCES TOOLS & SERVICES (0.6%)Agilent Technologies, Inc. 6,470 440,154Illumina, Inc.(a) 1,938 397,658Mettler-Toledo International, Inc.(a) 570 389,099PerkinElmer, Inc. 3,670 265,415Quintiles IMS Holdings, Inc.(a) 3,000 324,300Waters Corp.(a) 1,680 329,364
2,145,990
MACHINERY (1.7%)Caterpillar, Inc. 6,970 946,526Cummins, Inc. 5,190 918,007Deere & Co. 3,322 441,427Dover Corp. 1,220 116,498Flowserve Corp. 460 20,272Fortive Corp. 3,470 250,742Illinois Tool Works, Inc. 7,480 1,170,770Ingersoll-Rand PLC 12,070 1,069,402PACCAR, Inc. 4,565 327,448Parker Hannifin Corp. 1,405 256,567Pentair PLC 840 59,186Snap-on, Inc. 480 75,734Stanley Black & Decker, Inc. 1,842 297,575Xylem, Inc. 6,850 455,731
6,405,885
Shares ValueMEDIA (1.8%)Charter Communications, Inc., Class A(a) 5,600 $1,871,352Discovery Communications, Inc., Class A(a) 14,870 280,745Discovery Communications, Inc., Class C(a) 7,670 136,603Dish Network Corp.(a) 3,340 162,124Interpublic Group of Companies, Inc. 9,330 179,602News Corp., Class A 58,070 793,236News Corp., Class B 14,630 203,357Omnicom Group, Inc. 5,010 336,622Scripps Networks Interactive, Inc., Class A 11,920 992,698The Walt Disney Co. 20,230 1,978,696
6,935,035
METALS & MINING (0.3%)Freeport-McMoRan Copper & Gold, Inc.,
Class B(a) 17,218 240,708Newmont Mining Corp. 20,360 736,218Nucor Corp. 3,510 202,983
1,179,909
MULTILINE RETAIL (0.9%)Dollar General Corp. 9,740 787,382Dollar Tree, Inc.(a) 12,192 1,112,520Kohl’s Corp. 16,460 687,370Macy’s, Inc. 17,102 320,833Nordstrom, Inc. 1,080 42,822Target Corp. 11,400 673,056
3,623,983
MULTI-UTILITIES (1.4%)Ameren Corp. 9,950 616,800CenterPoint Energy, Inc. 17,300 511,734CMS Energy Corp. 5,350 258,780Consolidated Edison, Inc. 10,410 895,781Dominion Resources, Inc. 7,514 609,686DTE Energy Co. 5,190 573,287NiSource, Inc. 20,040 528,455Public Service Enterprise Group, Inc. 13,546 666,463SCANA Corp. 2,680 115,615Sempra Energy 2,950 346,625WEC Energy Group 4,475 301,570
5,424,796
OIL, GAS & CONSUMABLE FUELS (4.4%)Anadarko Petroleum Corp. 5,680 280,422Andeavor 14,500 1,540,480Apache Corp. 3,690 152,655Cabot Oil & Gas Corp., Class A 4,510 124,927Chesapeake Energy Corp.(a) 7,420 28,938Chevron Corp. 21,019 2,435,892
STEWARD FUNDSSCHEDULE OF PORTFOLIO INVESTMENTS — October 31, 2017 (Unaudited)
STEWARD LARGE CAP ENHANCED INDEX FUND
See notes to financial statements.12

Shares ValueCimarex Energy Co. 650 $ 76,004Concho Resources, Inc.(a) 1,350 181,183ConocoPhillips 12,099 618,864Devon Energy Corp. 5,100 188,190EOG Resources, Inc. 6,234 622,589EQT Corp. 1,730 108,194Exxon Mobil Corp. 46,940 3,912,449Hess Corp. 3,010 132,922Kinder Morgan, Inc. 18,460 334,311Marathon Oil Corp. 26,880 382,234Marathon Petroleum Corp. 24,310 1,452,279Newfield Exploration Co.(a) 2,030 62,504Noble Energy, Inc. 3,840 107,021Occidental Petroleum Corp. 8,342 538,643ONEOK, Inc. 3,710 201,342Phillips 66 12,179 1,109,263Pioneer Natural Resources Co. 1,676 250,847Range Resources Corp. 1,660 30,063Valero Energy Corp. 24,570 1,938,327Williams Companies, Inc. 7,920 225,720
17,036,263
PERSONAL PRODUCTS (0.1%)Coty, Inc. 9,640 148,456The Estee Lauder Companies, Inc., Class A 3,330 372,327
520,783
PHARMACEUTICALS (1.0%)Allergan PLC 7,130 1,263,650Eli Lilly & Co. 15,500 1,270,070Mylan N.V.(a) 7,470 266,754Perrigo Co. PLC 2,851 230,902Zoetis, Inc. 11,730 748,609
3,779,985
PROFESSIONAL SERVICES (0.3%)Equifax, Inc. 1,640 177,989IHS Markit, Ltd.(a) 2,890 123,143Nielsen Holdings PLC 5,520 204,626Robert Half International, Inc. 1,070 55,394Verisk Analytics, Inc.(a) 8,450 718,673
1,279,825
REAL ESTATE MANAGEMENT & DEVELOPMENT (0.0%)CBRE Group, Inc., Class A(a) 4,580 180,086
ROAD & RAIL (0.6%)CSX Corp. 9,020 454,879J.B. Hunt Transport Services, Inc. 4,310 458,541Kansas City Southern Industries, Inc. 990 103,178Norfolk Southern Corp. 2,990 392,946Union Pacific Corp. 8,912 1,031,920
2,441,464
Shares ValueSEMICONDUCTORS & SEMICONDUCTOR EQUIPMENT (5.7%)Advanced Micro Devices, Inc.(a) 4,590 $ 50,421Analog Devices, Inc. 10,254 936,190Applied Materials, Inc. 64,720 3,652,150Broadcom Ltd. 9,785 2,582,359Intel Corp. 50,280 2,287,237KLA-Tencor Corp. 2,140 233,025Lam Research Corp. 11,553 2,409,609Microchip Technology, Inc. 14,230 1,349,004Micron Technology, Inc.(a) 10,870 481,650NVIDIA Corp. 18,955 3,920,085Qorvo, Inc.(a) 1,520 115,231QUALCOMM, Inc. 22,190 1,131,912Skyworks Solutions, Inc. 9,170 1,044,096Texas Instruments, Inc. 17,460 1,688,207Xilinx, Inc. 2,730 201,174
22,082,350
SOFTWARE (4.5%)Activision Blizzard, Inc. 24,000 1,571,760Adobe Systems, Inc.(a) 10,524 1,843,384ANSYS, Inc.(a) 1,480 202,331Autodesk, Inc.(a) 2,510 313,650CA, Inc. 4,340 140,529Cadence Design Systems, Inc.(a) 80 3,453Citrix Systems, Inc.(a) 8,100 669,141Intuit, Inc. 3,170 478,733Microsoft Corp. 84,130 6,997,933Oracle Corp. 35,001 1,781,551Red Hat, Inc.(a) 8,350 1,008,931Salesforce.com, Inc.(a) 16,530 1,691,680Symantec Corp. 9,232 300,040Synopsys, Inc.(a) 2,220 192,074
17,195,190
SPECIALTY RETAIL (2.1%)Advance Auto Parts, Inc. 3,011 246,119AutoZone, Inc.(a) 338 199,251Best Buy Company, Inc. 3,790 212,164CarMax, Inc.(a) 1,810 135,931Foot Locker, Inc. 1,890 56,851Gap, Inc. 16,850 437,931Home Depot, Inc. 13,860 2,297,711L Brands, Inc. 2,470 106,309Lowe’s Companies, Inc. 11,550 923,423O’Reilly Automotive, Inc.(a) 2,296 484,341Ross Stores, Inc. 13,610 864,099Signet Jewelers Ltd. 3,490 228,839Tiffany & Co. 1,350 126,387TJX Companies, Inc. 8,870 619,126Tractor Supply Co. 2,620 157,881Ulta Salon Cosmetics & Fragrance, Inc.(a) 5,530 1,115,899
8,212,262
STEWARD FUNDSSCHEDULE OF PORTFOLIO INVESTMENTS — October 31, 2017 (Unaudited)
STEWARD LARGE CAP ENHANCED INDEX FUND
See notes to financial statements.13

Shares ValueTECHNOLOGY HARDWARE, STORAGE & PERIPHERALS (3.3%)Apple Computer, Inc. 54,241 $ 9,168,899Hewlett Packard Enterprise Co. 47,350 659,112HP, Inc. 48,330 1,041,511NetApp, Inc. 2,550 113,271Seagate Technology PLC 2,840 104,995Western Digital Corp. 7,001 624,979Xerox Corp. 33,541 1,016,628
12,729,395
TEXTILES, APPAREL & LUXURY GOODS (0.8%)Hanesbrands, Inc. 8,350 187,875Michael Kors Holdings Ltd.(a) 16,570 808,782NIKE, Inc., Class B 16,940 931,530PVH Corp. 5,280 669,557Ralph Lauren Corp. 505 45,162Tapestry, Inc. 3,340 136,773Under Armour, Inc., Class A(a) 5,780 72,365Under Armour, Inc., Class C(a) 1,024 11,807VF Corp. 3,435 239,248
3,103,099
TRADING COMPANIES & DISTRIBUTORS (0.2%)Fastenal Co. 2,990 140,440United Rentals, Inc.(a) 5,100 721,548W.W. Grainger, Inc. 445 87,977
949,965
WATER UTILITIES (0.1%)American Water Works Company, Inc. 5,160 452,842
TOTAL COMMON STOCKS(COST $314,158,846) 382,492,252
Shares ValueRIGHTS (0.0%)FOOD & STAPLES RETAILING (0.0%)Safeway, Inc.(a)(b) 25,130 $ —Safeway, Inc.(a)(b) 25,130 —
TOTAL RIGHTS (COST $—) —
MONEY MARKET FUND (0.6%)Federated Government Obligations Fund,
Institutional Shares, 0.91%(c) 2,340,332 2,340,332
TOTAL MONEY MARKET FUND(COST $2,340,332) 2,340,332
TOTAL INVESTMENTS(COST $316,499,178) 100.0% 384,832,584
OTHER ASSETS IN EXCESS OFLIABILITIES 0.0% 98,408
NET ASSETS 100.0% $384,930,992
(a) Represents non-income producing security.(b) These securities have been deemed illiquid and represent
0.0% of the Fund’s net assets.(c) Variable rate money market investment. The rate shown
represents the rate as of October 31, 2017.
LLC − Limited Liability Company
PLC − Public Limited Company
STEWARD FUNDSSCHEDULE OF PORTFOLIO INVESTMENTS — October 31, 2017 (Unaudited)
STEWARD LARGE CAP ENHANCED INDEX FUND
See notes to financial statements.14
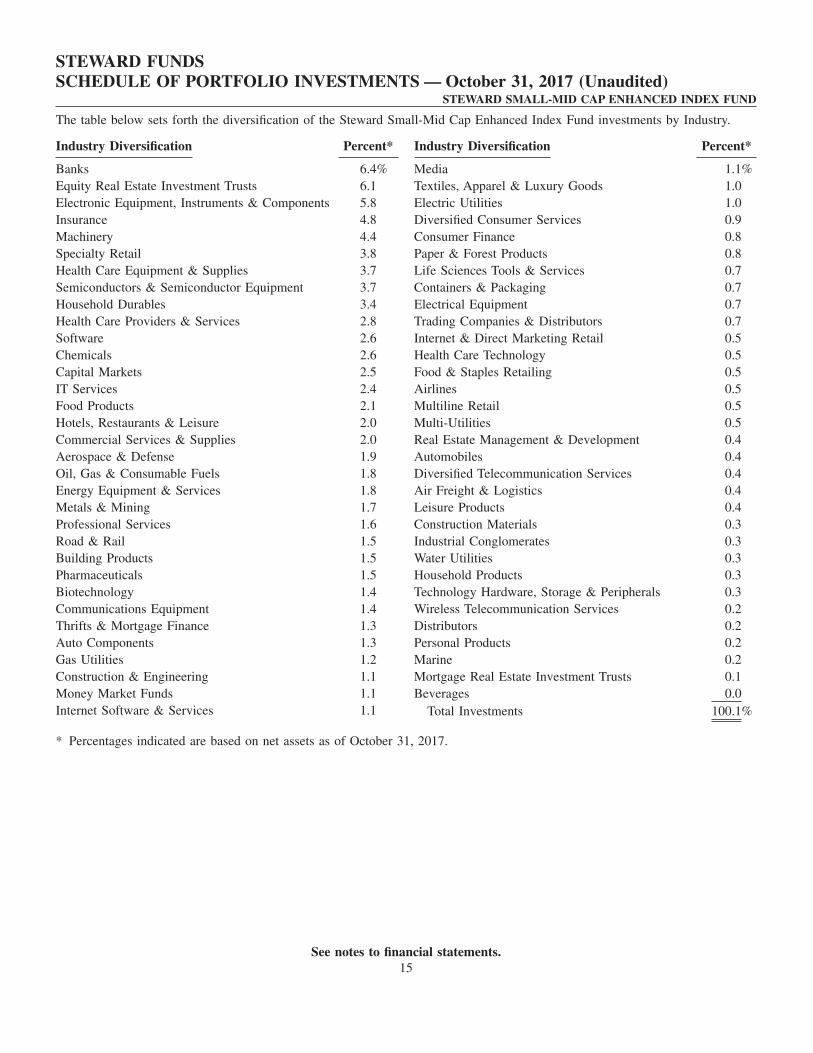
The table below sets forth the diversification of the Steward Small-Mid Cap Enhanced Index Fund investments by Industry.
Industry Diversification Percent*
Banks 6.4%Equity Real Estate Investment Trusts 6.1Electronic Equipment, Instruments & Components 5.8Insurance 4.8Machinery 4.4Specialty Retail 3.8Health Care Equipment & Supplies 3.7Semiconductors & Semiconductor Equipment 3.7Household Durables 3.4Health Care Providers & Services 2.8Software 2.6Chemicals 2.6Capital Markets 2.5IT Services 2.4Food Products 2.1Hotels, Restaurants & Leisure 2.0Commercial Services & Supplies 2.0Aerospace & Defense 1.9Oil, Gas & Consumable Fuels 1.8Energy Equipment & Services 1.8Metals & Mining 1.7Professional Services 1.6Road & Rail 1.5Building Products 1.5Pharmaceuticals 1.5Biotechnology 1.4Communications Equipment 1.4Thrifts & Mortgage Finance 1.3Auto Components 1.3Gas Utilities 1.2Construction & Engineering 1.1Money Market Funds 1.1Internet Software & Services 1.1
Industry Diversification Percent*
Media 1.1%Textiles, Apparel & Luxury Goods 1.0Electric Utilities 1.0Diversified Consumer Services 0.9Consumer Finance 0.8Paper & Forest Products 0.8Life Sciences Tools & Services 0.7Containers & Packaging 0.7Electrical Equipment 0.7Trading Companies & Distributors 0.7Internet & Direct Marketing Retail 0.5Health Care Technology 0.5Food & Staples Retailing 0.5Airlines 0.5Multiline Retail 0.5Multi-Utilities 0.5Real Estate Management & Development 0.4Automobiles 0.4Diversified Telecommunication Services 0.4Air Freight & Logistics 0.4Leisure Products 0.4Construction Materials 0.3Industrial Conglomerates 0.3Water Utilities 0.3Household Products 0.3Technology Hardware, Storage & Peripherals 0.3Wireless Telecommunication Services 0.2Distributors 0.2Personal Products 0.2Marine 0.2Mortgage Real Estate Investment Trusts 0.1Beverages 0.0
Total Investments 100.1%
* Percentages indicated are based on net assets as of October 31, 2017.
STEWARD FUNDSSCHEDULE OF PORTFOLIO INVESTMENTS — October 31, 2017 (Unaudited)
STEWARD SMALL-MID CAP ENHANCED INDEX FUND
See notes to financial statements.15

Shares ValueCOMMON STOCKS (99.0%)
AEROSPACE & DEFENSE (1.9%)AAR Corp. 4,600 $ 178,894Aerojet Rocketdyne Holdings, Inc.(a) 3,560 112,425AeroVironment, Inc.(a) 1,220 62,415Axon Enterprise, Inc.(a) 11,580 265,993Cubic Corp. 1,530 83,461Curtiss-Wright Corp. 3,530 417,423Engility Holdings, Inc.(a) 1,070 36,027Esterline Technologies Corp.(a) 2,630 249,456Huntington Ingalls Industries, Inc. 3,144 732,018KLX, Inc.(a) 6,920 379,631Mercury Computer Systems, Inc.(a) 10,070 508,233Moog, Inc., Class A(a) 2,000 175,520National Presto Industries, Inc. 590 68,971Orbital ATK, Inc. 3,393 451,031Teledyne Technologies, Inc.(a) 2,390 406,204Triumph Group, Inc. 2,960 91,908
4,219,610
AIR FREIGHT & LOGISTICS (0.4%)Atlas Air Worldwide Holdings(a) 5,690 349,081Echo Global Logistics, Inc.(a) 7,350 176,768Forward Air Corp. 1,510 86,734Hub Group, Inc., Class A(a) 5,790 250,707
863,290
AIRLINES (0.5%)Allegiant Travel Co. 936 127,670Hawaiian Holdings, Inc.(a) 6,550 219,425JetBlue Airways Corp.(a) 21,930 419,960SkyWest, Inc. 9,070 427,197
1,194,252
AUTO COMPONENTS (1.3%)American Axle & Manufacturing
Holdings, Inc.(a) 15,130 269,163Cooper Tire & Rubber Co. 6,670 218,776Cooper-Standard Holding, Inc.(a) 2,880 321,062Dana, Inc. 15,110 460,704Dorman Products, Inc.(a) 4,330 299,246Fox Factory Holding Corp.(a) 8,140 346,357Gentex Corp. 18,480 358,697Gentherm, Inc.(a) 2,220 74,370LCI Industries 3,730 461,774Motorcar Parts of America, Inc.(a) 1,270 36,716Standard Motor Products, Inc. 1,230 53,714Superior Industries International, Inc. 5,010 77,905
2,978,484
AUTOMOBILES (0.4%)Thor Industries, Inc. 5,200 708,344Winnebago Industries, Inc. 5,890 289,494
997,838
Shares ValueBANKS (6.4%)Ameris Bancorp 5,750 $275,425Associated Bancorp 13,150 332,695Banc of California, Inc. 11,550 243,127BancorpSouth, Inc. 4,170 131,772Bank of Hawaii Corp. 2,840 231,772Bank of the Ozarks, Inc. 8,810 410,722Banner Corp. 1,990 114,067Boston Private Financial Holdings, Inc. 6,690 106,371Brookline Bancorp, Inc. 6,090 93,786Cathay General Bancorp 3,620 151,316Central Pacific Financial Corp. 3,700 115,144Chemical Financial Corp. 4,104 216,240City Holding Co. 1,210 85,293Columbia Banking System, Inc. 2,830 123,133Commerce Bancshares, Inc. 4,607 267,943Community Bank System, Inc. 2,850 157,576Cullen/Frost Bankers, Inc. 3,590 353,615Customers Bancorp, Inc.(a) 5,740 156,932CVB Financial Corp. 3,720 88,759East West Bancorp, Inc. 8,000 478,720F.N.B. Corp. 9,910 133,686Fidelity Southern Corp. 560 12,281First Bancorp(a) 48,752 251,073First Commonwealth Financial Corp. 4,950 72,072First Financial Bancorp 2,060 56,238First Financial Bankshares, Inc. 5,080 231,902First Horizon National Corp. 18,240 342,365First Midwest Bancorp, Inc. 6,240 144,082Fulton Financial Corp. 11,130 202,566Glacier Bancorp, Inc. 3,730 141,591Great Western Bancorp, Inc. 3,280 133,135Hancock Holding Co. 4,619 225,176Hanmi Financial Corp. 5,311 163,313Home Bancshares, Inc. 13,032 292,959Hope Bancorp, Inc. 7,602 140,257Independent Bank Corp. − Massachusetts 1,760 126,896International Bancshares Corp. 3,120 126,672LegacyTexas Financial Group, Inc. 7,260 289,601MB Financial, Inc. 4,421 203,101National Bank Holdings Corp. 6,130 201,187NBT Bancorp 1,690 64,457OFG Bancorp 11,330 100,837Old National Bancorp 4,940 89,908Opus Bank(a) 4,970 128,723Pacific Premier Bancorp, Inc.(a) 6,810 275,124PacWest Bancorp 6,910 333,891Pinnacle Financial Partners, Inc. 6,750 446,850Prosperity Bancshares, Inc. 4,510 296,668S & T Bancorp, Inc. 1,570 64,197ServisFirst Bancshares, Inc. 6,600 270,666Signature Bank(a) 3,490 453,735Simmons First National Corp., Class A 2,120 122,324
STEWARD FUNDSSCHEDULE OF PORTFOLIO INVESTMENTS — October 31, 2017 (Unaudited)
STEWARD SMALL-MID CAP ENHANCED INDEX FUND
See notes to financial statements.16

Shares ValueSouthside Bancshares, Inc. 3,724 $ 131,867Sterling Bancorp 16,249 407,037SVB Financial Group(a) 3,320 728,010Synovus Financial Corp. 6,302 295,249TCF Financial Corp. 8,990 163,798Texas Capital Bancshares, Inc.(a) 3,100 266,755Tompkins Financial Corp. 2,199 191,577Trustmark Corp. 4,470 147,242UMB Financial Corp. 2,830 208,090Umpqua Holdings Corp. 14,270 291,964United Bankshares, Inc. 7,243 260,386United Community Banks, Inc. 7,752 212,560Valley National Bancorp 12,762 146,763Webster Financial Corp. 5,860 322,241WestAmerica Bancorp 1,620 94,333Wintrust Financial Corp. 3,580 291,018
14,430,831
BEVERAGES (0.0%)Coca-Cola Bottling Co. Consolidated 399 89,998
BIOTECHNOLOGY (1.4%)Acorda Therapeutics, Inc.(a) 2,970 78,928AMAG Pharmaceuticals, Inc.(a) 9,150 143,655Bioverativ, Inc.(a) 9,260 523,190Cytokinetics, Inc.(a) 15,880 216,762Eagle Pharmaceuticals, Inc.(a) 1,710 91,912Emergent BioSolutions, Inc.(a) 1,940 79,521Enanta Pharmaceuticals, Inc.(a) 3,950 196,196Ligand Pharmaceuticals, Inc., Class B(a) 2,390 347,387MiMedx Group, Inc.(a) 36,890 467,765Momenta Pharmaceuticals, Inc.(a) 8,090 114,069Myriad Genetics, Inc.(a) 8,670 297,208Progenics Pharmaceuticals, Inc.(a) 32,430 200,742Repligen Corp.(a) 2,080 77,376Spectrum Pharmaceuticals, Inc.(a) 2,900 56,811United Therapeutics Corp.(a) 2,563 303,946
3,195,468
BUILDING PRODUCTS (1.5%)AAON, Inc. 5,058 177,030American Woodmark Corp.(a) 900 86,940Apogee Enterprises, Inc. 1,630 77,800Gibraltar Industries, Inc.(a) 6,590 219,117Griffon Corp. 11,460 258,423Insteel Industries, Inc. 4,730 120,852Lennox International, Inc. 2,480 474,002Patrick Industries, Inc.(a) 4,950 460,350PGT, Inc.(a) 13,760 194,016Quanex Building Products Corp. 8,765 192,392Simpson Manufacturing Company, Inc. 3,660 204,008Trex Company, Inc.(a) 5,960 652,322Universal Forest Products, Inc. 1,430 161,447
3,278,699
CAPITAL MARKETS (2.5%)Donnelley Financial Solutions, Inc.(a) 2,051 44,096Eaton Vance Corp. 5,940 299,792
Shares ValueEvercore Partners, Inc. 4,280 $ 342,828FactSet Research Systems, Inc. 2,580 489,865Federated Investors, Inc., Class B 4,120 128,008Financial Engines, Inc. 3,410 123,101Greenhill & Company, Inc. 1,430 26,169Interactive Brokers Group, Inc., Class A 4,150 224,183INTL FCStone, Inc.(a) 6,250 259,437Investment Technology Group, Inc. 5,970 140,116Janus Henderson Group PLC 11,290 392,328Legg Mason, Inc. 9,960 380,273MarketAxess Holdings, Inc. 3,610 628,140MSCI, Inc., Class A 6,540 767,534Piper Jaffray Companies, Inc. 4,720 345,032SEI Investments Co. 6,800 438,668Stifel Financial Corp. 6,045 320,566Virtus Investment Partners, Inc. 637 74,147Waddell & Reed Financial, Inc., Class A 7,210 134,755WisdomTree Investments, Inc. 6,900 76,521
5,635,559
CHEMICALS (2.6%)A. Schulman, Inc. 1,830 71,919AdvanSix, Inc.(a) 9,850 455,759American Vanguard Corp. 1,340 30,150Ashland Global Holdings, Inc. 3,800 258,324Balchem Corp. 3,315 279,421Cabot Corp. 3,400 207,264Calgon Carbon Corp. 2,250 48,825Flotek Industries, Inc.(a) 2,490 12,251FutureFuel Corp. 1,380 20,948H.B. Fuller Co. 2,900 164,923Hawkins, Inc. 670 25,527Ingevity Corp.(a) 2,420 172,377Innophos Holdings, Inc. 1,150 56,270Innospec, Inc. 1,580 97,723Koppers Holdings, Inc.(a) 1,320 64,086Kraton Performance Polymers, Inc.(a) 8,690 426,071LSB Industries, Inc.(a) 13,010 98,226Mineral Technologies, Inc. 4,560 327,864NewMarket Corp. 764 305,898Olin Corp. 11,640 425,209PolyOne Corp. 4,210 193,955Quaker Chemical Corp. 1,770 274,916Rayonier, Inc. 7,313 105,088RPM International, Inc. 7,210 384,509Sensient Technologies Corp. 2,490 189,365Stepan Co. 1,270 101,422The Chemours Co. 10,010 566,666The Scotts Miracle-Gro Co., Class A 2,620 261,004Tredegar Industries, Inc. 1,590 30,767Valvoline, Inc. 10,366 248,991
5,905,718
COMMERCIAL SERVICES & SUPPLIES (2.0%)ABM Industries, Inc. 3,190 133,884Brady Corp., Class A 2,510 95,505Clean Harbors, Inc.(a) 3,320 177,653
STEWARD FUNDSSCHEDULE OF PORTFOLIO INVESTMENTS — October 31, 2017 (Unaudited)
STEWARD SMALL-MID CAP ENHANCED INDEX FUND
See notes to financial statements.17

Shares ValueCopart, Inc.(a) 15,340 $ 556,689Deluxe Corp. 2,990 208,254Essendant, Inc. 15,290 148,007Healthcare Services Group, Inc. 4,652 246,044Herman Miller, Inc. 3,000 100,800HNI Corp. 2,460 84,181Interface, Inc. 4,180 95,304LSC Communications, Inc. 12,241 198,059Matthews International Corp., Class A 2,220 139,527Mobile Mini, Inc. 2,490 82,419MSA Safety, Inc. 2,140 170,130Multi-Color Corp. 930 76,911Pitney Bowes, Inc. 7,730 106,210R.R. Donnelley & Sons Co. 15,353 141,248Rollins, Inc. 5,255 230,747Team, Inc.(a) 1,770 21,771Tetra Tech, Inc. 9,350 460,488The Brink’s Co. 2,830 215,363UniFirst Corp. 1,190 187,425US Ecology, Inc. 5,320 252,966Viad Corp. 7,490 434,795
4,564,380
COMMUNICATIONS EQUIPMENT (1.4%)ADTRAN, Inc. 2,280 48,108Applied Optoelectronics, Inc.(a) 1,140 46,444ARRIS International PLC(a) 9,759 278,132Bel Fuse, Inc., Class B 730 23,615Black Box Corp. 6,110 18,941Brocade Communications Systems, Inc. 19,530 227,524CalAmp Corp.(a) 1,750 39,777Ciena Corp.(a) 7,440 158,249Comtech Telecommunications Corp. 22,190 477,307Digi International, Inc.(a) 6,000 62,400Harmonic, Inc.(a) 7,510 27,787InterDigital, Inc. 6,010 440,833Lumentum Holdings, Inc.(a) 6,994 441,671NETGEAR, Inc.(a) 2,090 97,499NetScout Systems, Inc.(a) 4,860 138,024Oclaro, Inc.(a) 24,220 200,299Plantronics, Inc. 1,960 88,906ViaSat, Inc.(a) 3,360 218,736VIAVI Solutions, Inc.(a) 9,570 88,810
3,123,062
CONSTRUCTION & ENGINEERING (1.1%)AECOM Technology Corp.(a) 14,482 507,739Aegion Corp.(a) 5,670 132,054Comfort Systems USA, Inc. 2,010 89,043Dycom Industries, Inc.(a) 1,830 160,729EMCOR Group, Inc. 3,420 275,344Granite Construction, Inc. 5,250 334,373KBR, Inc. 13,640 267,753MYR Group, Inc.(a) 5,200 165,828Orion Group Holdings, Inc.(a) 41,000 295,200Valmont Industries, Inc. 1,510 239,939
2,468,002
Shares ValueCONSTRUCTION MATERIALS (0.3%)Eagle Materials, Inc., Class A 4,820 $ 508,847U.S. Concrete, Inc.(a) 1,040 81,328
590,175
CONSUMER FINANCE (0.8%)Encore Capital Group, Inc.(a) 8,730 405,508Enova International, Inc.(a) 13,563 201,411EZCORP, Inc., Class A(a) 13,910 142,577Firstcash, Inc. 2,688 171,629Green Dot Corp., Class A(a) 2,850 161,367PRA Group, Inc.(a) 2,630 73,377SLM Corp.(a) 39,110 414,175World Acceptance Corp.(a) 2,900 253,750
1,823,794
CONTAINERS & PACKAGING (0.7%)AptarGroup, Inc. 3,620 315,194Bemis Company, Inc. 5,400 243,108Greif, Inc., Class A 2,870 159,371Myers Industries, Inc. 1,120 24,192Owens-Illinois, Inc.(a) 15,160 362,172Silgan Holdings, Inc. 4,060 118,755Sonoco Products Co. 4,710 243,931
1,466,723
DISTRIBUTORS (0.2%)Pool Corp. 3,550 428,769
DIVERSIFIED CONSUMER SERVICES (0.9%)Adtalem Global Education, Inc. 7,920 292,644American Public Education, Inc.(a) 4,480 89,600Capella Education Co. 2,220 180,819Career Education Corp.(a) 3,860 41,225Graham Holdings Co. 785 436,814Regis Corp.(a) 17,670 263,813Service Corporation International 11,300 400,698Sotheby’s(a) 4,610 238,890Strayer Education, Inc. 792 74,234
2,018,737
DIVERSIFIED TELECOMMUNICATION SERVICES (0.4%)ATN International, Inc. 980 53,204Cincinnati Bell, Inc.(a) 2,552 48,743Cogent Communications Holdings, Inc. 5,020 270,578Consolidated Communications
Holdings, Inc. 2,910 55,785Frontier Communications Corp. 10,592 128,269General Communication, Inc., Class A(a) 2,320 94,865Iridium Communications, Inc.(a) 16,730 200,760Lumos Networks Corp.(a) 1,120 20,115Vonage Holdings Corp.(a) 4,630 37,642
909,961ELECTRIC UTILITIES (1.0%)ALLETE, Inc. 2,740 214,679El Paso Electric Co. 1,850 106,375Great Plains Energy, Inc. 14,971 491,498Hawaiian Electric Industries, Inc. 7,040 256,679
STEWARD FUNDSSCHEDULE OF PORTFOLIO INVESTMENTS — October 31, 2017 (Unaudited)
STEWARD SMALL-MID CAP ENHANCED INDEX FUND
See notes to financial statements.18

Shares ValueIDACORP, Inc. 2,860 $ 263,206OGE Energy Corp. 9,110 335,612PNM Resources, Inc. 5,530 240,002Westar Energy, Inc. 7,250 387,730
2,295,781
ELECTRICAL EQUIPMENT (0.7%)AZZ, Inc. 1,640 78,392Encore Wire Corp. 3,190 144,028EnerSys 3,490 242,101General Cable Corp. 7,530 157,753Hubbell, Inc. 3,330 418,981Powell Industries, Inc. 2,840 82,303Regal-Beloit Corp. 4,210 341,642Vicor Corp.(a) 8,590 185,115
1,650,315
ELECTRONIC EQUIPMENT, INSTRUMENTS &COMPONENTS (5.8%)
Agilysys, Inc.(a) 570 6,994Anixter International, Inc.(a) 4,240 291,288Arrow Electronics, Inc.(a) 9,420 787,418Avnet, Inc. 13,600 541,280Badger Meter, Inc. 1,540 67,452Belden CDT, Inc. 2,580 206,168Benchmark Electronics, Inc.(a) 10,170 314,761Cognex Corp. 8,590 1,057,858Coherent, Inc.(a) 2,294 602,657Control4 Corp.(a) 1,000 29,450CTS Corp. 14,790 402,288Daktronics, Inc. 3,000 30,810Electro Scientific Industries, Inc.(a) 17,800 318,442ePlus, Inc.(a) 980 93,688Fabrinet(a) 8,040 298,927FARO Technologies, Inc.(a) 1,070 55,426II-VI, Inc.(a) 10,480 473,696Insight Enterprises, Inc.(a) 8,350 376,167IPG Photonics Corp.(a) 2,980 634,472Itron, Inc.(a) 3,690 288,373Jabil Circuit, Inc. 21,660 612,545KEMET Corp.(a) 2,250 57,803Keysight Technologies, Inc.(a) 9,610 429,279Knowles Corp.(a) 3,970 65,743Littelfuse, Inc. 2,410 503,690Methode Electronics, Inc., Class A 2,020 94,738MTS Systems Corp. 1,110 57,776National Instruments Corp. 5,035 226,575OSI Systems, Inc.(a) 1,160 102,521Park Electrochemical Corp. 760 14,349Plexus Corp.(a) 3,870 237,734Rogers Corp.(a) 1,120 170,330Sanmina Corp.(a) 11,330 370,774ScanSource, Inc.(a) 8,810 378,390SYNNEX Corp. 3,590 484,219Tech Data Corp.(a) 5,500 510,235Trimble Navigation Ltd.(a) 12,980 530,622TTM Technologies, Inc.(a) 22,180 350,000
Shares ValueVeriFone Systems, Inc.(a) 5,250 $ 100,170Vishay Intertechnology, Inc. 15,180 337,755Zebra Technologies Corp., Class A(a) 4,220 489,478
13,002,341
ENERGY EQUIPMENT & SERVICES (1.8%)Archrock, Inc. 3,970 47,640Bristow Group, Inc. 12,960 122,342CARBO Ceramics, Inc.(a) 1,100 9,108Core Laboratories N.V. 2,920 291,708Diamond Offshore Drilling, Inc.(a) 4,660 77,962Dril-Quip, Inc.(a) 2,960 124,616Ensco PLC, Class A, Sponsored ADR 56,064 302,185Era Group, Inc.(a) 13,400 144,184Exterran Corp.(a) 15,515 500,669Geospace Technologies Corp.(a) 570 8,561Gulf Island Fabrication, Inc. 16,470 216,580Helix Energy Solutions Group, Inc.(a) 6,430 43,853Matrix Service Co.(a) 10,810 152,421McDermott International, Inc.(a) 10,160 67,259Nabors Industries Ltd. 13,530 76,174Newpark Resources, Inc.(a) 7,090 62,037Noble Corp. PLC(a) 50,180 208,749Oceaneering International, Inc. 8,590 173,690Oil States International, Inc.(a) 3,410 78,600Patterson-UTI Energy, Inc. 11,690 231,228Pioneer Energy Services Corp.(a) 5,130 9,747Rowan Companies, Inc., Class A(a) 17,860 255,934SEACOR Holdings, Inc.(a) 1,590 75,048Superior Energy Services, Inc.(a) 7,690 67,826Tesco Corp.(a) 3,670 14,130TETRA Technologies, Inc.(a) 4,190 11,900Transocean Ltd.(a) 43,500 456,750Unit Corp.(a) 2,960 55,411US Silica Holdings, Inc. 4,680 142,787
4,029,099
EQUITY REAL ESTATE INVESTMENT TRUSTS (6.1%)Acadia Realty Trust 5,997 168,816Agree Realty Corp. 4,150 196,253American Assets Trust, Inc. 5,320 206,363American Campus Communities, Inc. 7,750 322,245Camden Property Trust 5,420 494,521CareTrust REIT, Inc. 12,218 230,920CBL & Associates Properties, Inc. 6,320 49,549Cedar Shopping Centers, Inc. 4,120 22,413Chatham Lodging Trust 1,440 31,320Chesapeake Lodging Trust 5,580 155,682Corecivic, Inc. 9,158 225,836Coresite Realty Corp. 2,260 250,295Corporate Office Properties Trust 5,190 165,717Cousins Properties, Inc. 20,119 181,473Cyrusone, Inc. 5,380 330,278DCT Industrial Trust, Inc. 8,340 483,887DiamondRock Hospitality Co. 11,740 127,496Douglas Emmett, Inc. 8,050 320,309EastGroup Properties, Inc. 2,520 228,287
STEWARD FUNDSSCHEDULE OF PORTFOLIO INVESTMENTS — October 31, 2017 (Unaudited)
STEWARD SMALL-MID CAP ENHANCED INDEX FUND
See notes to financial statements.19

Shares ValueEducation Realty Trust, Inc. 7,310 $ 255,119EPR Properties 4,830 334,139First Industrial Realty Trust, Inc. 10,710 330,725Four Corners Property Trust, Inc. 15,947 393,572Franklin Street Properties Corp. 3,250 32,500Getty Realty Corp. 5,460 155,119Government Properties Income Trust 4,270 77,586Healthcare Realty Trust, Inc. 7,960 256,630Hersha Hospitality Trust 1,620 28,658Highwood Properties, Inc. 5,600 285,880Hospitality Properties Trust 8,030 229,497JBG Smith Properties(a) 4,780 149,184Kilroy Realty Corp. 8,020 571,265Kite Realty Group Trust 6,325 118,214Lamar Advertising Co. 6,330 445,885LaSalle Hotel Properties 9,130 257,557Lexington Corporate Properties Trust 17,775 179,883Liberty Property Trust 9,520 408,218Life Storage, Inc. 3,300 266,706LTC Properties, Inc. 2,550 118,600Mack-Cali Realty Corp. 4,340 98,822Medical Properties Trust, Inc. 26,430 349,669National Retail Properties, Inc. 9,000 361,620National Storage Affiliates 18,440 457,128OMEGA Healthcare Investors, Inc. 10,826 312,438Pennsylvania Real Estate Investment Trust 3,840 37,325Potlatch Corp. 2,330 120,694PS Business Parks, Inc. 1,650 218,345Quality Care Properties(a) 14,400 227,952Ramco-Gershenson Properties Trust 2,280 28,796Rayonier, Inc. 5,360 160,693Retail Opportunity Investments Corp. 8,980 161,460Sabra Healthcare REIT, Inc. 8,809 175,475Saul Centers, Inc. 1,280 78,234Senior Housing Properties Trust 14,200 261,280Summit Hotel Properties, Inc. 15,130 239,205Tanger Factory Outlet Center 6,890 156,748Taubman Centers, Inc. 4,590 216,740The Geo Group, Inc. 6,654 172,671Uniti Group, Inc. 16,114 281,995Universal Health Realty Income Trust 1,070 78,335Urban Edge Properties 4,870 114,250Urstadt Biddle Properties, Inc., Class A 3,690 80,184Washington Prime Group, Inc. 7,720 60,448Weingarten Realty Investors 10,500 319,725
13,856,829FOOD & STAPLES RETAILING (0.5%)SpartanNash Co. 9,224 226,449Sprouts Farmers Markets, Inc.(a) 7,830 144,777SUPERVALU, Inc.(a) 5,721 93,195The Andersons, Inc. 6,415 240,242United Natural Foods, Inc.(a) 8,620 334,197
1,038,860
Shares ValueFOOD PRODUCTS (2.1%)B&G Foods, Inc. 7,360 $ 234,048Calavo Growers, Inc. 3,040 224,048Cal-Maine Foods, Inc.(a) 1,850 83,250Darling International, Inc.(a) 22,800 416,100Dean Foods Co. 12,860 125,385Flowers Foods, Inc. 12,113 230,510Hain Celestial Group, Inc.(a) 5,690 204,954Ingredion, Inc. 4,090 512,682J & J Snack Foods Corp. 1,150 153,146John B. Sanfilippo & Son, Inc. 580 34,133Lamb Weston Holding, Inc. 7,720 393,643Lancaster Colony Corp. 1,310 164,038Post Holdings, Inc.(a) 5,565 461,505Sanderson Farms, Inc. 2,990 447,214Seneca Foods Corp., Class A(a) 10,130 364,680Snyders-Lance, Inc. 4,480 168,582Tootsie Roll Industries, Inc. 986 35,102TreeHouse Foods, Inc.(a) 5,770 383,013
4,636,033
GAS UTILITIES (1.2%)Atmos Energy Corp. 5,530 482,437National Fuel Gas Co. 4,770 276,898New Jersey Resources Corp. 4,370 194,246Northwest Natural Gas Co. 1,590 105,497One Gas, Inc. 2,800 215,544South Jersey Industries, Inc. 7,180 243,905Southwest Gas Corp. 4,310 355,101Spire, Inc. 2,780 219,481UGI Corp. 9,280 444,141WGL Holdings, Inc. 2,730 233,961
2,771,211
HEALTH CARE EQUIPMENT & SUPPLIES (3.7%)Abaxis, Inc. 1,270 61,468ABIOMED, Inc.(a) 4,820 929,874Analogic Corp. 1,000 80,300AngioDynamics, Inc.(a) 3,070 52,098Anika Therapeutics, Inc.(a) 990 54,084Cantel Medical Corp. 4,087 400,853CONMED Corp. 1,540 80,419CryoLife, Inc.(a) 7,540 146,653Globus Medical, Inc.(a) 3,680 117,282Haemonetics Corp.(a) 2,780 132,217Halyard Health, Inc.(a) 4,800 202,320Hill-Rom Holdings, Inc. 3,960 319,612ICU Medical, Inc.(a) 1,050 200,655Inogen, Inc.(a) 1,090 107,834Integer Holdings Corp.(a) 6,870 333,882Integra LifeSciences Holdings Corp.(a) 3,520 164,666Invacare Corp. 23,980 371,690Lantheus Holdings, Inc.(a) 14,440 287,356Lemaitre Vascular, Inc. 7,110 227,591
STEWARD FUNDSSCHEDULE OF PORTFOLIO INVESTMENTS — October 31, 2017 (Unaudited)
STEWARD SMALL-MID CAP ENHANCED INDEX FUND
See notes to financial statements.20

Shares ValueLivaNova PLC(a) 2,520 $ 186,228Masimo Corp.(a) 6,040 530,070Meridian Bioscience, Inc. 1,900 28,405Merit Medical Systems, Inc.(a) 6,495 247,135Natus Medical, Inc.(a) 1,870 79,288Neogen Corp.(a) 3,332 267,226NuVasive, Inc.(a) 6,540 371,014OraSure Technologies, Inc.(a) 26,530 523,967Orthofix International N.V.(a) 1,200 64,476STERIS PLC 4,780 446,117SurModics, Inc.(a) 4,300 127,925Teleflex, Inc. 2,723 645,297Varex Imaging Corp.(a) 2,050 70,458West Pharmaceutical Services, Inc. 4,270 432,978
8,291,438
HEALTH CARE PROVIDERS & SERVICES (2.8%)Acadia Healthcare(a) 5,140 161,190Aceto Corp. 2,490 25,074Almost Family, Inc.(a) 5,210 230,543Amedisys, Inc.(a) 1,969 94,729AMN Healthcare Services, Inc.(a) 8,190 359,541Biotelemetry, Inc.(a) 15,960 463,638Chemed Corp. 1,320 294,928CorVel Corp.(a) 1,540 92,400Cross Country Healthcare, Inc.(a) 15,630 213,350Diplomat Pharmacy, Inc.(a) 19,800 416,790HealthEquity, Inc.(a) 2,990 150,158HealthSouth Corp. 9,460 436,484Kindred Healthcare, Inc. 18,648 112,820LHC Group, Inc.(a) 2,930 195,753Magellan Health Services, Inc.(a) 1,510 128,803Molina Healthcare, Inc.(a) 7,165 486,002Owens & Minor, Inc. 10,625 261,056PharMerica Corp.(a) 12,370 362,441Providence Service Corp.(a) 4,450 247,420Select Medical Holdings Corp.(a) 25,260 483,729The Ensign Group, Inc. 3,020 69,702Tivity Health, Inc.(a) 2,180 100,825U.S. Physical Therapy, Inc. 2,520 171,234WellCare Group, Inc.(a) 4,330 856,214
6,414,824
HEALTH CARE TECHNOLOGY (0.5%)Allscripts Healthcare Solutions, Inc.(a) 8,526 114,930Computer Programs & Systems, Inc. 830 25,024Healthstream, Inc.(a) 1,710 41,827HMS Holdings Corp.(a) 8,390 161,424Medidata Solutions, Inc.(a) 5,890 443,105Omnicell, Inc.(a) 6,830 340,134Quality Systems, Inc.(a) 2,170 30,532
1,156,976HOTELS, RESTAURANTS & LEISURE (2.0%)Belmond Ltd.(a) 11,210 147,412Biglari Holdings, Inc.(a) 287 102,585Bob Evans Farms, Inc. 1,540 118,873Cracker Barrel Old Country Store, Inc. 1,930 301,331
Shares ValueDineEquity, Inc. 2,490 $ 118,549Domino’s Pizza, Inc. 4,234 774,822Dunkin’ Brands Group, Inc. 7,880 465,472El Pollo Loco Holdings, Inc.(a) 1,320 15,180Fiesta Restaurant Group, Inc.(a) 1,790 29,624ILG, Inc. 5,300 157,251International Speedway Corp., Class A 3,990 155,011Jack in the Box, Inc. 3,580 370,566Marcus Corp. 7,680 208,512Marriott Vacations Worldwide Corp. 1,630 214,541Papa John’s International, Inc. 4,070 276,964Shake Shack, Inc.(a) 1,440 54,662Six Flags Entertainment Corp. 4,760 298,880Sonic Corp. 3,470 88,138The Wendy’s Co. 21,200 322,452Wingstop, Inc. 9,260 313,636
4,534,461
HOUSEHOLD DURABLES (3.4%)CalAtlantic Group, Inc. 12,691 626,174Cavco Industries, Inc.(a) 640 100,416Ethan Allen Interiors, Inc. 1,690 50,277Helen of Troy Ltd.(a) 1,740 161,646Installed Building Products, Inc.(a) 9,850 686,545iRobot Corp.(a) 5,250 352,747KB HOME 27,900 765,297La-Z-Boy, Inc. 2,750 74,112LGI Homes, Inc.(a) 6,760 407,831M.D.C. Holdings, Inc. 11,353 420,515M/I Homes, Inc.(a) 14,430 481,962Meritage Homes Corp.(a) 10,020 487,974NVR, Inc.(a) 295 968,004Tempur-Pedic International, Inc.(a) 2,850 186,305Toll Brothers, Inc. 13,890 639,496TopBuild Corp.(a) 7,650 504,824TRI Pointe Group, Inc.(a) 21,690 383,696Tupperware Corp. 2,990 175,663Universal Electronics, Inc.(a) 2,670 160,200William Lyon Homes, Class A(a) 1,290 35,797
7,669,481
HOUSEHOLD PRODUCTS (0.3%)Central Garden & Pet Co.(a) 3,170 121,031Central Garden & Pet Co., Class A(a) 8,050 297,125Energizer Holdings, Inc. 3,680 158,203WD-40 Co. 990 109,742
686,101
INDUSTRIAL CONGLOMERATES (0.3%)Carlisle Companies, Inc. 5,210 572,214Raven Industries, Inc. 1,790 60,234
632,448INSURANCE (4.8%)Alleghany Corp.(a) 1,461 827,248American Equity Investment Life
Holding Co. 13,460 397,205American Financial Group, Inc. 5,860 618,171
STEWARD FUNDSSCHEDULE OF PORTFOLIO INVESTMENTS — October 31, 2017 (Unaudited)
STEWARD SMALL-MID CAP ENHANCED INDEX FUND
See notes to financial statements.21

Shares ValueAmerisafe, Inc. 1,250 $ 80,875Aspen Insurance Holdings Ltd. 8,020 344,058Brown & Brown, Inc. 8,710 434,106CNO Financial Group, Inc. 22,740 545,078eHealth, Inc.(a) 810 20,558Employers Holdings, Inc. 3,930 187,461First American Financial Corp. 10,670 580,661Genworth Financial, Inc., Class A(a) 73,220 242,358HCI Group, Inc. 4,060 152,088Horace Mann Educators Corp. 4,700 205,860Infinity Property & Casualty Corp. 2,890 272,672Kemper Corp. 7,230 463,443Maiden Holdings Ltd. 20,180 166,485Mercury General Corp. 3,650 204,291Old Republic International Corp. 20,310 412,090Primerica, Inc. 4,990 441,615ProAssurance Corp. 3,160 177,118Reinsurance Group of America, Inc. 6,430 960,513Renaissancere Holdings Ltd. 3,120 431,683RLI Corp. 2,300 135,907Safety Insurance Group, Inc. 1,970 161,934Selective Insurance Group, Inc. 5,410 322,436Stewart Information Services Corp. 4,260 161,624The Hanover Insurance Group, Inc. 5,030 494,851The Navigators Group, Inc. 2,980 172,840Third Point Reinsurance, Ltd.(a) 2,060 34,402United Fire Group, Inc. 3,710 170,994United Insurance Holdings Corp. 16,250 255,775Universal Insurance Holdings, Inc. 10,430 248,756W.R. Berkley Corp. 7,480 512,978
10,838,134
INTERNET & DIRECT MARKETING RETAIL (0.5%)FTD Companies, Inc.(a) 5,980 64,584HSN, Inc. 4,010 151,177Nutrisystem, Inc. 11,580 578,421PetMed Express, Inc. 1,240 43,846Shutterfly, Inc.(a) 5,830 248,941
1,086,969
INTERNET SOFTWARE & SERVICES (1.1%)Blucora, Inc.(a) 2,450 53,165Cars.com, Inc.(a) 5,970 142,205DHI Group, Inc.(a) 3,130 6,886j2 Global, Inc. 3,030 224,644Liquidity Services, Inc.(a) 1,710 9,747LivePerson, Inc.(a) 2,250 31,613LogMeIn, Inc. 5,750 696,038NIC, Inc. 6,990 118,830QuinStreet, Inc.(a) 40,190 357,691Shutterstock, Inc.(a) 5,280 205,867SPS Commerce, Inc.(a) 2,740 134,698Stamps.com, Inc.(a) 2,170 486,948XO Group, Inc.(a) 1,580 31,537
2,499,869
Shares ValueIT SERVICES (2.4%)Acxiom Corp.(a) 3,750 $ 94,350Broadridge Financial Solutions, Inc. 7,680 659,866CACI International, Inc., Class A(a) 2,170 311,937Cardtronics PLC, Class A(a) 5,950 136,255Convergys Corp. 5,960 153,351CoreLogic, Inc.(a) 8,270 387,863CSG Systems International, Inc. 1,930 81,716DST Systems, Inc. 3,710 217,480ExlService Holdings, Inc.(a) 2,080 129,834Forrester Research, Inc. 2,800 122,360Jack Henry & Associates, Inc. 4,580 504,395Leidos Holdings, Inc. 9,920 620,198ManTech International Corp., Class A 3,720 172,645MAXIMUS, Inc. 5,850 388,616Perficient, Inc.(a) 1,860 36,177Sabre Corp. 10,580 206,945Science Applications International Corp. 4,170 305,828Sykes Enterprises, Inc.(a) 5,150 149,041TeleTech Holdings, Inc. 940 39,151Teradata Corp.(a) 6,900 230,805Virtusa Corp.(a) 6,180 235,829WEX, Inc.(a) 2,520 311,447
5,496,089
LEISURE PRODUCTS (0.4%)Brunswick Corp. 5,060 256,289Callaway Golf Co. 5,740 82,828Nautilus Group, Inc.(a) 2,140 27,820Polaris Industries, Inc. 3,470 410,952Sturm Ruger & Company, Inc. 1,180 58,469Vista Outdoor, Inc.(a) 3,620 75,694
912,052
LIFE SCIENCES TOOLS & SERVICES (0.7%)Bio-Rad Laboratories, Inc., Class A(a) 1,280 281,331Bio-Techne Corp. 3,370 441,537Cambrex Corp.(a) 1,870 80,878Charles River Laboratories
International, Inc.(a) 2,880 334,915INC Research Holdings, Inc., Class A(a) 6,870 392,621Luminex Corp. 7,260 155,001
1,686,283
MACHINERY (4.4%)Actuant Corp., Class A 2,940 74,970AGCO Corp. 6,500 445,705Alamo Group, Inc. 680 71,740Albany International Corp., Class A 1,820 109,837Astec Industries, Inc. 2,980 154,811Barnes Group, Inc. 2,700 175,743Briggs & Stratton Corp. 8,710 219,492Chart Industries, Inc.(a) 1,770 76,995CIRCOR International, Inc. 1,100 48,345Crane Co. 3,880 322,506Donaldson Company, Inc. 6,350 299,783
STEWARD FUNDSSCHEDULE OF PORTFOLIO INVESTMENTS — October 31, 2017 (Unaudited)
STEWARD SMALL-MID CAP ENHANCED INDEX FUND
See notes to financial statements.22
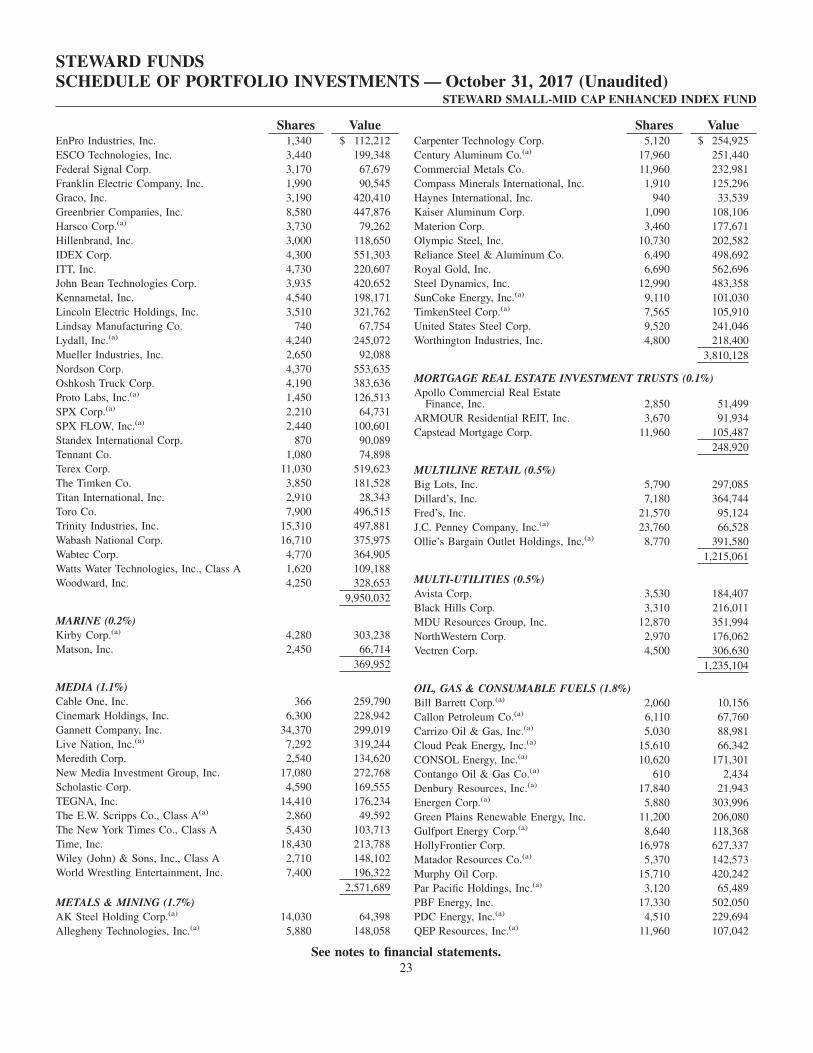
Shares ValueEnPro Industries, Inc. 1,340 $ 112,212ESCO Technologies, Inc. 3,440 199,348Federal Signal Corp. 3,170 67,679Franklin Electric Company, Inc. 1,990 90,545Graco, Inc. 3,190 420,410Greenbrier Companies, Inc. 8,580 447,876Harsco Corp.(a) 3,730 79,262Hillenbrand, Inc. 3,000 118,650IDEX Corp. 4,300 551,303ITT, Inc. 4,730 220,607John Bean Technologies Corp. 3,935 420,652Kennametal, Inc. 4,540 198,171Lincoln Electric Holdings, Inc. 3,510 321,762Lindsay Manufacturing Co. 740 67,754Lydall, Inc.(a) 4,240 245,072Mueller Industries, Inc. 2,650 92,088Nordson Corp. 4,370 553,635Oshkosh Truck Corp. 4,190 383,636Proto Labs, Inc.(a) 1,450 126,513SPX Corp.(a) 2,210 64,731SPX FLOW, Inc.(a) 2,440 100,601Standex International Corp. 870 90,089Tennant Co. 1,080 74,898Terex Corp. 11,030 519,623The Timken Co. 3,850 181,528Titan International, Inc. 2,910 28,343Toro Co. 7,900 496,515Trinity Industries, Inc. 15,310 497,881Wabash National Corp. 16,710 375,975Wabtec Corp. 4,770 364,905Watts Water Technologies, Inc., Class A 1,620 109,188Woodward, Inc. 4,250 328,653
9,950,032
MARINE (0.2%)Kirby Corp.(a) 4,280 303,238Matson, Inc. 2,450 66,714
369,952
MEDIA (1.1%)Cable One, Inc. 366 259,790Cinemark Holdings, Inc. 6,300 228,942Gannett Company, Inc. 34,370 299,019Live Nation, Inc.(a) 7,292 319,244Meredith Corp. 2,540 134,620New Media Investment Group, Inc. 17,080 272,768Scholastic Corp. 4,590 169,555TEGNA, Inc. 14,410 176,234The E.W. Scripps Co., Class A(a) 2,860 49,592The New York Times Co., Class A 5,430 103,713Time, Inc. 18,430 213,788Wiley (John) & Sons, Inc., Class A 2,710 148,102World Wrestling Entertainment, Inc. 7,400 196,322
2,571,689METALS & MINING (1.7%)AK Steel Holding Corp.(a) 14,030 64,398Allegheny Technologies, Inc.(a) 5,880 148,058
Shares ValueCarpenter Technology Corp. 5,120 $ 254,925Century Aluminum Co.(a) 17,960 251,440Commercial Metals Co. 11,960 232,981Compass Minerals International, Inc. 1,910 125,296Haynes International, Inc. 940 33,539Kaiser Aluminum Corp. 1,090 108,106Materion Corp. 3,460 177,671Olympic Steel, Inc. 10,730 202,582Reliance Steel & Aluminum Co. 6,490 498,692Royal Gold, Inc. 6,690 562,696Steel Dynamics, Inc. 12,990 483,358SunCoke Energy, Inc.(a) 9,110 101,030TimkenSteel Corp.(a) 7,565 105,910United States Steel Corp. 9,520 241,046Worthington Industries, Inc. 4,800 218,400
3,810,128
MORTGAGE REAL ESTATE INVESTMENT TRUSTS (0.1%)Apollo Commercial Real Estate
Finance, Inc. 2,850 51,499ARMOUR Residential REIT, Inc. 3,670 91,934Capstead Mortgage Corp. 11,960 105,487
248,920
MULTILINE RETAIL (0.5%)Big Lots, Inc. 5,790 297,085Dillard’s, Inc. 7,180 364,744Fred’s, Inc. 21,570 95,124J.C. Penney Company, Inc.(a) 23,760 66,528Ollie’s Bargain Outlet Holdings, Inc.(a) 8,770 391,580
1,215,061
MULTI-UTILITIES (0.5%)Avista Corp. 3,530 184,407Black Hills Corp. 3,310 216,011MDU Resources Group, Inc. 12,870 351,994NorthWestern Corp. 2,970 176,062Vectren Corp. 4,500 306,630
1,235,104
OIL, GAS & CONSUMABLE FUELS (1.8%)Bill Barrett Corp.(a) 2,060 10,156Callon Petroleum Co.(a) 6,110 67,760Carrizo Oil & Gas, Inc.(a) 5,030 88,981Cloud Peak Energy, Inc.(a) 15,610 66,342CONSOL Energy, Inc.(a) 10,620 171,301Contango Oil & Gas Co.(a) 610 2,434Denbury Resources, Inc.(a) 17,840 21,943Energen Corp.(a) 5,880 303,996Green Plains Renewable Energy, Inc. 11,200 206,080Gulfport Energy Corp.(a) 8,640 118,368HollyFrontier Corp. 16,978 627,337Matador Resources Co.(a) 5,370 142,573Murphy Oil Corp. 15,710 420,242Par Pacific Holdings, Inc.(a) 3,120 65,489PBF Energy, Inc. 17,330 502,050PDC Energy, Inc.(a) 4,510 229,694QEP Resources, Inc.(a) 11,960 107,042
STEWARD FUNDSSCHEDULE OF PORTFOLIO INVESTMENTS — October 31, 2017 (Unaudited)
STEWARD SMALL-MID CAP ENHANCED INDEX FUND
See notes to financial statements.23

Shares ValueREX American Resources Corp.(a) 600 $ 52,908SM Energy Co. 5,960 127,127Southwestern Energy Co.(a) 23,870 132,479SRC Energy, Inc.(a) 11,210 106,943World Fuel Services Corp. 9,770 271,606WPX Energy, Inc.(a) 19,770 223,006
4,065,857
PAPER & FOREST PRODUCTS (0.8%)Boise Cascade Co.(a) 11,840 419,728Clearwater Paper Corp.(a) 2,780 128,297Deltic Timber Corp. 930 86,127Domtar Corp. 12,240 579,197KapStone Paper & Packaging Corp. 8,290 186,193Louisiana-Pacific Corp.(a) 6,960 189,173Neenah Paper, Inc. 1,050 91,140P. H. Glatfelter & Co. 9,200 192,832
1,872,687
PERSONAL PRODUCTS (0.2%)Avon Products, Inc.(a) 29,260 66,713Edgewell Personal Care Co.(a) 3,490 226,605Inter Parfums, Inc. 910 42,133Medifast, Inc. 640 39,936Nu Skin Enterprises, Inc. 2,790 177,472
552,859
PHARMACEUTICALS (1.5%)Akorn, Inc.(a) 9,240 300,947Amphastar Pharmaceuticals, Inc.(a) 2,530 45,717ANI Pharmaceuticals, Inc.(a) 3,910 227,093Catalent, Inc.(a) 6,890 293,445DepoMed, Inc.(a) 3,550 17,182ENDO International PLC(a) 30,850 196,823Heska Corp.(a) 2,850 277,875Impax Laboratories, Inc.(a) 5,410 98,191Innoviva, Inc.(a) 27,250 333,540Lannett Company, Inc.(a) 1,900 37,810Mallinckrodt PLC(a) 9,490 300,548Nektar Therapeutics(a) 8,450 203,561Phibro Animal Health Corp., Class A 1,250 47,063Prestige Brands Holdings, Inc.(a) 3,260 152,894Sucampo Pharmaceuticals, Inc.(a) 8,900 89,000Supernus Pharmaceuticals, Inc.(a) 14,400 599,040The Medicines Co.(a) 4,160 119,558
3,340,287
PROFESSIONAL SERVICES (1.6%)Exponent, Inc. 1,530 112,990FTI Consulting, Inc.(a) 5,340 228,285Heidrick & Struggles International, Inc. 6,560 163,016Insperity, Inc. 4,170 395,733Kelly Services, Inc., Class A 17,190 452,269Korn/Ferry International, Inc. 6,160 257,673Manpower, Inc. 6,340 781,595Navigant Consulting, Inc.(a) 6,700 115,977On Assignment, Inc.(a) 2,900 177,538
Shares ValueResources Connection, Inc. 3,920 $ 61,740The Dun & Bradstreet Corp. 2,420 282,729TrueBlue, Inc.(a) 10,520 285,092WageWorks, Inc.(a) 5,260 335,325
3,649,962
REAL ESTATE MANAGEMENT & DEVELOPMENT (0.4%)Alexander & Baldwin, Inc. 2,530 114,457HFF, Inc., Class A 2,000 87,720Jones Lang LaSalle, Inc. 4,294 556,030RE/MAX Holdings, Inc. 1,200 79,800
838,007
ROAD & RAIL (1.5%)ArcBest Corp. 9,060 295,356Avis Budget Group, Inc.(a) 9,010 371,663Genesee & Wyoming, Inc., Class A(a) 3,630 260,561Heartland Express, Inc. 2,973 63,414Knight-Swift Transportion Holdings, Inc. 8,880 368,076Landstar System, Inc. 3,660 361,425Marten Transport Ltd. 3,216 63,194Old Dominion Freight Line, Inc. 5,350 648,046Roadrunner Transportation System, Inc.(a) 28,810 253,528Ryder System, Inc. 5,930 480,804Saia, Inc.(a) 1,410 91,368Werner Enterprises, Inc. 4,580 163,277
3,420,712
SEMICONDUCTORS & SEMICONDUCTOR EQUIPMENT (3.7%)Advanced Energy Industries, Inc.(a) 6,770 573,554Brooks Automation, Inc. 4,680 160,945Cabot Microelectronics Corp. 1,670 161,439CEVA, Inc.(a) 6,380 308,154Cirrus Logic, Inc.(a) 7,380 413,280Cohu, Inc. 5,340 137,772Cree, Inc.(a) 8,850 315,945Cypress Semiconductor Corp. 15,550 246,623Diodes, Inc.(a) 1,740 59,752DSP Group, Inc.(a) 1,120 15,008First Solar, Inc.(a) 12,730 697,859Integrated Device Technology, Inc.(a) 10,590 329,031Kopin Corp.(a) 17,940 62,969Kulicke & Soffa Industries, Inc.(a) 4,860 110,079MaxLinear, Inc., Class A(a) 11,860 290,214Microsemi Corp.(a) 9,590 511,818MKS Instruments, Inc. 8,940 971,331Monolithic Power Systems, Inc. 4,300 523,181Nanometrics, Inc.(a) 12,090 341,784Power Integrations, Inc. 1,820 146,237Rambus, Inc.(a) 11,480 168,871Rudolph Technologies, Inc.(a) 7,210 200,078Semtech Corp.(a) 3,380 138,749Silicon Laboratories, Inc.(a) 2,650 251,485SolarEdge Technologies, Inc.(a) 5,530 181,661Synaptics, Inc.(a) 2,060 76,467Teradyne, Inc. 10,420 446,914Veeco Instruments, Inc.(a) 2,669 48,175
STEWARD FUNDSSCHEDULE OF PORTFOLIO INVESTMENTS — October 31, 2017 (Unaudited)
STEWARD SMALL-MID CAP ENHANCED INDEX FUND
See notes to financial statements.24

Shares ValueVersum Materials, Inc. 5,750 $ 241,960Xperi Corp. 8,310 191,130
8,322,465
SOFTWARE (2.6%)8x8, Inc.(a) 10,840 144,714ACI Worldwide, Inc.(a) 7,770 187,102Barracuda Networks, Inc.(a) 1,810 42,191Blackbaud, Inc. 3,080 312,004Bottomline Technologies, Inc.(a) 1,880 61,213CDK Global, Inc. 8,080 513,565CommVault Systems, Inc.(a) 3,860 200,913Ebix, Inc. 5,340 362,853Fair Isaac Corp. 2,790 404,996Fortinet, Inc.(a) 8,310 327,497Gigamon, Inc.(a) 9,700 373,450Manhattan Associates, Inc.(a) 3,920 164,091Microstrategy, Inc., Class A(a) 859 113,611Monotype Imaging Holdings, Inc. 2,030 46,791Progress Software Corp. 5,360 226,889PTC, Inc.(a) 6,750 448,537Qualys, Inc.(a) 7,370 389,873Synchronoss Technologies, Inc.(a) 6,620 75,005TiVo Corp. 23,733 430,754Tyler Technologies, Inc.(a) 2,320 411,313Ultimate Software Group, Inc.(a) 2,598 526,329Vasco Data Security International, Inc.(a) 1,490 20,264
5,783,955
SPECIALTY RETAIL (3.8%)Aaron’s, Inc. 9,540 351,072Abercrombie & Fitch Co., Class A 24,180 324,737American Eagle Outfitters, Inc. 12,070 157,151Asbury Automotive Group(a) 3,990 244,986Ascena Retail Group, Inc.(a) 43,603 84,590AutoNation, Inc.(a) 10,430 494,382Barnes & Noble Education, Inc.(a) 28,420 154,889Barnes & Noble, Inc. 16,070 112,490Bed Bath & Beyond, Inc. 14,490 288,351Big 5 Sporting Goods Corp. 10,420 66,167Caleres, Inc. 6,575 179,695Cato Corp., Class A 4,630 59,542Chico’s FAS, Inc. 6,890 55,051Children’s Place Retail Stores, Inc. 2,520 274,176Dick’s Sporting Goods, Inc. 8,160 199,675DSW, Inc. 3,800 72,770Express, Inc.(a) 18,280 123,756Finish Line, Inc., Class A 8,797 81,548Five Below, Inc.(a) 9,430 521,007Francesca’s Holdings Corp.(a) 6,930 44,837GameStop Corp., Class A 17,870 333,990Genesco, Inc.(a) 6,010 147,245Group 1 Automotive, Inc. 4,550 357,494Guess?, Inc. 16,530 267,951Haverty Furniture Companies, Inc. 8,510 202,964Hibbett Sports, Inc.(a) 1,700 21,760Kirkland’s, Inc.(a) 12,460 145,782
Shares ValueLithia Motors, Inc., Class A 3,560 $ 402,921Lumber Liquidators Holdings, Inc.(a) 1,730 53,249MarineMax, Inc.(a) 10,820 200,711Michaels Companies, Inc. The(a) 5,770 112,053Monro Muffler Brake, Inc. 2,465 121,648Office Depot, Inc. 76,616 237,510Rent-A-Center, Inc. 4,170 41,450Restoration Hardware, Inc.(a) 4,950 445,104Sally Beauty Holdings, Inc.(a) 7,800 135,018Select Comfort Corp.(a) 2,420 78,650Shoe Carnival, Inc. 8,160 153,163Sonic Automotive, Inc., Class A 13,380 265,593Tailored Brands, Inc. 2,790 43,106The Buckle, Inc. 2,025 33,311The Tile Shop Holdings, Inc. 7,350 62,843Urban Outfitters, Inc.(a) 13,500 331,020Vitamin Shoppe, Inc.(a) 10,230 47,058Williams-Sonoma, Inc. 4,780 246,648Zumiez, Inc.(a) 7,600 134,140
8,513,254
TECHNOLOGY HARDWARE, STORAGE & PERIPHERALS (0.3%)3D Systems Corp.(a) 5,820 72,052Cray, Inc.(a) 2,510 51,831Diebold, Inc. 7,850 151,505Electronics for Imaging, Inc.(a) 2,690 83,013NCR Corp.(a) 10,000 320,900Super Micro Computer, Inc.(a) 1,790 35,621
714,922
TEXTILES, APPAREL & LUXURY GOODS (1.0%)Carter’s, Inc. 3,170 306,634Crocs, Inc.(a) 10,120 103,224Deckers Outdoor Corp.(a) 2,060 140,575Fossil Group, Inc.(a) 8,330 65,640G-III Apparel Group Ltd.(a) 9,680 245,291Iconix Brand Group, Inc.(a) 4,950 8,118Movado Group, Inc. 4,210 116,617Oxford Industries, Inc. 1,280 82,688Perry Ellis International, Inc.(a) 8,660 201,691Skechers U.S.A., Inc., Class A(a) 13,910 444,007Steven Madden Ltd.(a) 3,247 126,633Unifi, Inc.(a) 3,890 148,015Vera Bradley, Inc.(a) 2,510 18,072Wolverine World Wide, Inc. 6,250 170,625
2,177,830
THRIFTS & MORTGAGE FINANCE (1.3%)Bank Mutual Corp. 8,700 92,002BofI Holding, Inc.(a) 10,980 295,362Dime Community Bancshares, Inc. 1,490 32,854Homestreet, Inc.(a) 5,170 150,189LendingTree, Inc.(a) 3,384 907,080Meta Financial Group, Inc. 3,170 276,583New York Community Bancorp, Inc. 22,120 277,827Northfield Bancorp, Inc. 8,480 144,669Northwest Bancshares, Inc. 3,450 58,202
STEWARD FUNDSSCHEDULE OF PORTFOLIO INVESTMENTS — October 31, 2017 (Unaudited)
STEWARD SMALL-MID CAP ENHANCED INDEX FUND
See notes to financial statements.25

Shares ValueOritani Financial Corp. 2,820 $ 47,799Provident Financial Services, Inc. 3,730 101,456TrustCo Bank Corp. 3,990 36,608Walker & Dunlop, Inc.(a) 6,580 361,176Washington Federal, Inc. 6,960 242,208
3,024,015
TRADING COMPANIES & DISTRIBUTORS (0.7%)Applied Industrial Technologies, Inc. 2,230 141,939DXP Enterprises, Inc.(a) 4,120 132,128GATX Corp. 2,550 151,495Kaman Corp., Class A 2,920 163,345MSC Industrial Direct Co., Inc., Class A 4,090 339,061Now, Inc.(a) 5,560 69,611Veritiv Corp.(a) 5,910 190,007Watsco, Inc. 1,950 324,812
1,512,398
WATER UTILITIES (0.3%)American States Water Co. 2,020 108,575Aqua America, Inc. 8,172 289,943California Water Service Group 4,780 200,760
599,278
Shares ValueWIRELESS TELECOMMUNICATION SERVICES (0.2%)Spok Holdings, Inc. 5,780 $ 97,971Telephone & Data Systems, Inc. 14,720 429,088
527,059TOTAL COMMON STOCKS
(COST $180,175,163) 223,685,377
MONEY MARKET FUND (1.1%)Federated Government Obligations Fund,
Institutional Shares, 0.91%(b) 2,385,556 2,385,556
TOTAL MONEY MARKET FUND(COST $2,385,556) 2,385,556
TOTAL INVESTMENTS(COST $182,560,719) 100.1% 226,070,933
LIABILITIES IN EXCESS OFOTHER ASSETS -0.1% (13,642)
NET ASSETS 100.0% $226,057,291
(a) Represents non-income producing security.(b) Variable rate money market investment. The rate shown
represents the rate as of October 31, 2017.
ADR − American Depositary Receipt
PLC − Public Limited Company
REIT − Real Estate Investment Trust
STEWARD FUNDSSCHEDULE OF PORTFOLIO INVESTMENTS — October 31, 2017 (Unaudited)
STEWARD SMALL-MID CAP ENHANCED INDEX FUND
See notes to financial statements.26

The table below sets forth the diversification of the Steward International Enhanced Index Fund investments by Country.
Country Diversification Percent*
United Kingdom . . . . . . . . . . . . . . . . . . . . . . . . . . . . . . . . . . . . . . . . . . . . . . . . . . . . . . . . . . . . . . . . . . . 19.4%Canada . . . . . . . . . . . . . . . . . . . . . . . . . . . . . . . . . . . . . . . . . . . . . . . . . . . . . . . . . . . . . . . . . . . . . . . . . . 18.3Japan . . . . . . . . . . . . . . . . . . . . . . . . . . . . . . . . . . . . . . . . . . . . . . . . . . . . . . . . . . . . . . . . . . . . . . . . . . . 8.5China . . . . . . . . . . . . . . . . . . . . . . . . . . . . . . . . . . . . . . . . . . . . . . . . . . . . . . . . . . . . . . . . . . . . . . . . . . . 7.8Taiwan, Province of China . . . . . . . . . . . . . . . . . . . . . . . . . . . . . . . . . . . . . . . . . . . . . . . . . . . . . . . . . . . . 6.7Brazil . . . . . . . . . . . . . . . . . . . . . . . . . . . . . . . . . . . . . . . . . . . . . . . . . . . . . . . . . . . . . . . . . . . . . . . . . . 5.5Netherlands . . . . . . . . . . . . . . . . . . . . . . . . . . . . . . . . . . . . . . . . . . . . . . . . . . . . . . . . . . . . . . . . . . . . . . 5.5Germany . . . . . . . . . . . . . . . . . . . . . . . . . . . . . . . . . . . . . . . . . . . . . . . . . . . . . . . . . . . . . . . . . . . . . . . . 2.8Hong Kong . . . . . . . . . . . . . . . . . . . . . . . . . . . . . . . . . . . . . . . . . . . . . . . . . . . . . . . . . . . . . . . . . . . . . . . 2.7Spain . . . . . . . . . . . . . . . . . . . . . . . . . . . . . . . . . . . . . . . . . . . . . . . . . . . . . . . . . . . . . . . . . . . . . . . . . . . 2.7France . . . . . . . . . . . . . . . . . . . . . . . . . . . . . . . . . . . . . . . . . . . . . . . . . . . . . . . . . . . . . . . . . . . . . . . . . . 2.6Republic of Korea (South) . . . . . . . . . . . . . . . . . . . . . . . . . . . . . . . . . . . . . . . . . . . . . . . . . . . . . . . . . . . . 2.6Mexico . . . . . . . . . . . . . . . . . . . . . . . . . . . . . . . . . . . . . . . . . . . . . . . . . . . . . . . . . . . . . . . . . . . . . . . . . 2.3Switzerland . . . . . . . . . . . . . . . . . . . . . . . . . . . . . . . . . . . . . . . . . . . . . . . . . . . . . . . . . . . . . . . . . . . . . . . 2.2Australia . . . . . . . . . . . . . . . . . . . . . . . . . . . . . . . . . . . . . . . . . . . . . . . . . . . . . . . . . . . . . . . . . . . . . . . . 2.1India . . . . . . . . . . . . . . . . . . . . . . . . . . . . . . . . . . . . . . . . . . . . . . . . . . . . . . . . . . . . . . . . . . . . . . . . . . . 2.0Ireland (Republic of) . . . . . . . . . . . . . . . . . . . . . . . . . . . . . . . . . . . . . . . . . . . . . . . . . . . . . . . . . . . . . . . . 1.3Chile . . . . . . . . . . . . . . . . . . . . . . . . . . . . . . . . . . . . . . . . . . . . . . . . . . . . . . . . . . . . . . . . . . . . . . . . . . . 1.1Italy . . . . . . . . . . . . . . . . . . . . . . . . . . . . . . . . . . . . . . . . . . . . . . . . . . . . . . . . . . . . . . . . . . . . . . . . . . . 0.7United States . . . . . . . . . . . . . . . . . . . . . . . . . . . . . . . . . . . . . . . . . . . . . . . . . . . . . . . . . . . . . . . . . . . . . 0.6Finland . . . . . . . . . . . . . . . . . . . . . . . . . . . . . . . . . . . . . . . . . . . . . . . . . . . . . . . . . . . . . . . . . . . . . . . . . 0.4Norway . . . . . . . . . . . . . . . . . . . . . . . . . . . . . . . . . . . . . . . . . . . . . . . . . . . . . . . . . . . . . . . . . . . . . . . . . 0.3Indonesia . . . . . . . . . . . . . . . . . . . . . . . . . . . . . . . . . . . . . . . . . . . . . . . . . . . . . . . . . . . . . . . . . . . . . . . . 0.3South Africa . . . . . . . . . . . . . . . . . . . . . . . . . . . . . . . . . . . . . . . . . . . . . . . . . . . . . . . . . . . . . . . . . . . . . . 0.3Bermuda . . . . . . . . . . . . . . . . . . . . . . . . . . . . . . . . . . . . . . . . . . . . . . . . . . . . . . . . . . . . . . . . . . . . . . . . 0.3Luxembourg . . . . . . . . . . . . . . . . . . . . . . . . . . . . . . . . . . . . . . . . . . . . . . . . . . . . . . . . . . . . . . . . . . . . . . 0.3Sweden . . . . . . . . . . . . . . . . . . . . . . . . . . . . . . . . . . . . . . . . . . . . . . . . . . . . . . . . . . . . . . . . . . . . . . . . . 0.3Jersey . . . . . . . . . . . . . . . . . . . . . . . . . . . . . . . . . . . . . . . . . . . . . . . . . . . . . . . . . . . . . . . . . . . . . . . . . . 0.2Colombia . . . . . . . . . . . . . . . . . . . . . . . . . . . . . . . . . . . . . . . . . . . . . . . . . . . . . . . . . . . . . . . . . . . . . . . . 0.1Russian Federation . . . . . . . . . . . . . . . . . . . . . . . . . . . . . . . . . . . . . . . . . . . . . . . . . . . . . . . . . . . . . . . . . . 0.1
Total Investments . . . . . . . . . . . . . . . . . . . . . . . . . . . . . . . . . . . . . . . . . . . . . . . . . . . . . . . . . . . . . . . . . 100.0%
* Percentages indicated are based on net assets as of October 31, 2017.
STEWARD FUNDSSCHEDULE OF PORTFOLIO INVESTMENTS — October 31, 2017 (Unaudited)
STEWARD INTERNATIONAL ENHANCED INDEX FUND
See notes to financial statements.27

Shares ValueCOMMON STOCKS (99.5%)
AEROSPACE & DEFENSE (0.1%)Embraer SA, Sponsored ADR 5,060 $ 96,848
AIRLINES (0.4%)LATAM Airlines Group SA,
Sponsored ADR 16,310 221,490Ryanair Holdings PLC, Sponsored ADR(a) 3,428 384,313
605,803
AUTO COMPONENTS (0.3%)Magna International, Inc., Class A, ADR 8,570 467,494
AUTOMOBILES (3.4%)Honda Motor Co., Ltd., Sponsored ADR 36,890 1,146,910Tata Motors Ltd., Sponsored ADR(a) 6,240 204,422Toyota Motor Corp., Sponsored ADR 28,610 3,547,640
4,898,972
BANKS (22.0%)Banco Bilbao Vizcaya Argentaria SA,
Sponsored ADR 124,690 1,089,791Banco Bradesco SA, Sponsored ADR 138,349 1,462,349Banco de Chile, Sponsored ADR 2,364 217,772Banco Santander Central Hispano SA,
Sponsored ADR 280,385 1,889,795Banco Santander Chile SA,
Sponsored ADR 7,004 219,085Bancolombia SA, Sponsored ADR 5,590 211,022Bank of Montreal 14,570 1,116,208Bank of Nova Scotia 25,040 1,615,581Barclays PLC, Sponsored ADR 70,709 695,776Canadian Imperial Bank of Commerce 10,110 890,185Credicorp Ltd. 1,739 364,216HDFC Bank Ltd., Sponsored ADR 11,230 1,036,529HSBC Holdings PLC, Sponsored ADR 81,201 3,960,173ICICI Bank Ltd., Sponsored ADR 42,680 390,522ING Groep N.V., Sponsored ADR 75,310 1,394,741Itau Unibanco Banco Multiplo SA,
Sponsored ADR 148,048 1,896,495KB Financial Group, Inc., Sponsored ADR 17,000 892,670Lloyds Banking Group PLC,
Sponsored ADR 305,785 1,128,347Mitsubishi UFJ Financial Group, Inc.,
Sponsored ADR 258,040 1,752,092Mizuho Financial Group, Inc.,
Sponsored ADR 225,180 826,411Royal Bank of Canada 31,700 2,477,355Royal Bank of Scotland Group PLC,
Sponsored ADR(a) 21,118 160,286Shinhan Financial Group Co., Ltd.,
Sponsored ADR 20,300 918,981Sumitomo Mitsui Financial Group, Inc.,
Sponsored ADR 131,420 1,059,245The Toronto-Dominion Bank 38,450 2,185,882Westpac Banking Corp., Sponsored ADR 66,945 1,699,064
31,550,573
BEVERAGES (0.8%)Fomento Economico, Sponsored ADR 13,800 1,210,950
Shares ValueBIOTECHNOLOGY (1.0%)Shire PLC, Sponsored ADR 9,319 $1,375,764
CAPITAL MARKETS (3.3%)Brookfield Asset Management, Inc.,
Class A 22,568 946,502Credit Suisse Group, Sponsored ADR 43,639 686,005Deutsche Bank AG 40,290 655,518Nomura Holdings, Inc., Sponsored ADR 71,390 402,640Thomson Reuters Corp. 15,298 716,558UBS Group AG 75,670 1,287,147
4,694,370
CHEMICALS (1.0%)Agrium, Inc. 4,450 484,694Potash Corporation of Saskatchewan, Inc. 17,335 337,513Sasol Ltd., Sponsored ADR 14,920 434,321Sociedad Quimica y Minera de Chile SA,
Sponsored ADR 3,180 189,9731,446,501
COMMERCIAL SERVICES & SUPPLIES (0.5%)Waste Connections, Inc. 10,550 745,569
COMMUNICATIONS EQUIPMENT (0.7%)Nokia Oyj, Sponsored ADR 113,670 555,846Telefonektiebolaget LM Ericsson,
Sponsored ADR 67,640 422,750978,596
CONSTRUCTION MATERIALS (1.0%)CEMEX SA de CV, Sponsored ADR(a) 64,255 521,108CRH PLC, Sponsored ADR 19,500 731,640James Hardie Industries PLC,
Sponsored ADR 12,330 189,7591,442,507
DIVERSIFIED CONSUMER SERVICES (0.2%)TAL Education Group, Sponsored ADR 10,340 284,350
DIVERSIFIED FINANCIAL SERVICES (0.4%)ORIX Corp., Sponsored ADR 6,340 544,099
DIVERSIFIED TELECOMMUNICATION SERVICES (3.9%)BCE, Inc. 11,195 516,761BT Group PLC, Sponsored ADR 37,690 659,952China Telecom Corp., Ltd.,
Sponsored ADR 5,020 252,857China Unicom Ltd., Sponsored ADR(a) 20,675 292,138Chunghwa Telecom Co., Ltd.,
Sponsored ADR 23,565 801,681Orange SA, Sponsored ADR 50,670 830,988PT Telekomunikasi Indonesia,
Sponsored ADR 16,150 485,146Telecom Italia S.p.A., Sponsored ADR(a) 22,020 189,592Telecom Italia S.p.A., Sponsored ADR 8,730 62,070Telefonica Brasil SA, Sponsored ADR 13,870 213,598Telefonica SA, Sponsored ADR 86,463 900,080TELUS Corp. 9,430 341,555
5,546,418
STEWARD FUNDSSCHEDULE OF PORTFOLIO INVESTMENTS — October 31, 2017 (Unaudited)
STEWARD INTERNATIONAL ENHANCED INDEX FUND
See notes to financial statements.28

Shares ValueELECTRIC UTILITIES (0.9%)Companhia Energetica de Minas Gerais,
Sponsored ADR 21,315 $ 50,517CPFL Energia SA, Sponsored ADR 21,211 355,284Enersis SA, Sponsored ADR 40,290 427,074Korea Electric Power Corp.,
Sponsored ADR 29,310 516,4421,349,317
ELECTRICAL EQUIPMENT (0.8%)ABB Ltd., Sponsored ADR 45,040 1,176,895
ELECTRONIC EQUIPMENT, INSTRUMENTS &COMPONENTS (0.6%)
Kyocera Corp., Sponsored ADR 10,310 688,708LG Display Co., Ltd., Sponsored ADR 14,860 193,031
881,739
ENERGY EQUIPMENT & SERVICES (0.1%)Tenaris SA, Sponsored ADR 5,810 158,323
FOOD PRODUCTS (0.3%)BRF-Brasil Foods SA, Sponsored ADR(a) 31,720 427,268
HEALTH CARE EQUIPMENT & SUPPLIES (0.6%)Smith & Nephew PLC, Sponsored ADR 21,010 803,843
HEALTH CARE PROVIDERS & SERVICES (0.6%)Fresenius Medical Care AG & Co.,
Sponsored ADR 17,060 825,363
HOTELS, RESTAURANTS & LEISURE (1.0%)Carnival PLC, Sponsored ADR 7,180 479,193Intercontinental Hotels Group PLC,
Sponsored ADR 8,931 496,474Restaurant Brands International, Inc. 7,265 469,247
1,444,914
INDEPENDENT POWER & RENEWABLE ELECTRICITYPRODUCERS (0.2%)
Empresa Nacional de Electricidad SA,Sponsored ADR 9,140 236,726
INDUSTRIAL CONGLOMERATES (0.7%)Koninklijke Royal Philips Electronics N.V.,
Sponsored NY Shares 25,574 1,043,163
INSURANCE (3.0%)Aegon N.V., Sponsored NY Shares 30,138 176,910China Life Insurance Co., Ltd.,
Sponsored ADR 72,120 1,202,241Manulife Financial Corp. 44,350 891,435Prudential PLC, Sponsored ADR 28,080 1,376,762Sun Life Financial, Inc. 18,240 710,083
4,357,431
INTERNET & DIRECT MARKETING RETAIL (1.0%)Ctrip.com International Ltd.,
Sponsored ADR(a) 12,710 608,682JD.com, Inc., Sponsored ADR(a) 22,240 834,445
1,443,127
Shares ValueINTERNET SOFTWARE & SERVICES (5.3%)58.com, Inc., Sponsored ADR(a) 3,010 $ 202,181Alibaba Group Holding Ltd.,
Sponsored ADR(a) 29,120 5,383,997Baidu, Inc., Sponsored ADR(a) 7,384 1,801,253Weibo Corp., Sponsored ADR(a) 1,880 174,182
7,561,613
IT SERVICES (1.2%)CGI Group, Inc., Class A(a) 9,580 509,081Infosys Technologies Ltd., Sponsored ADR 61,940 919,809Wipro Ltd., Sponsored ADR 62,360 334,250
1,763,140
LIFE SCIENCES TOOLS & SERVICES (0.5%)QIAGEN N.V.(a) 21,644 732,866
MEDIA (1.2%)Grupo Televisa SA, Sponsored ADR 25,360 555,130Pearson PLC, Sponsored ADR 21,180 196,550Shaw Communications, Inc., Class B 19,140 437,158WPP PLC, Sponsored ADR 6,690 590,660
1,779,498
METALS & MINING (5.6%)Agnico-Eagle Mines Ltd. 6,420 286,525Arcelor Mittal, Class A, Sponsored
NY Shares(a) 10,393 297,240Barrick Gold Corp., ADR 25,590 369,775BHP Billiton Ltd., Sponsored ADR 31,030 1,271,609BHP Billiton PLC, Sponsored ADR 19,840 720,589Franco Nevada Corp. 5,310 421,826Gerdau SA, Sponsored ADR 7,250 23,998Goldcorp, Inc. 17,957 234,518Kinross Gold Corp.(a) 19,510 77,065POSCO, Sponsored ADR 13,460 982,311Randgold Resources Ltd., Sponsored ADR 2,740 269,260Rio Tinto PLC, Sponsored ADR 22,992 1,102,007Southern Copper Corp. 2,493 107,074Teck Resources Ltd. 8,403 171,757Vale SA, Sponsored ADR 126,470 1,238,141Vedanta, Ltd., Sponsored ADR 8,520 175,512Wheaton Precious Metals Corp. 10,880 225,651
7,974,858
MULTI-UTILITIES (0.9%)National Grid PLC, Sponsored ADR 21,429 1,308,240
OIL, GAS & CONSUMABLE FUELS (15.7%)BP PLC, Sponsored ADR 68,682 2,793,297Cameco Corp. 7,730 62,922Canadian Natural Resources Ltd. 20,260 707,074Cenovus Energy, Inc. 15,050 146,286China Petroleum & Chemical Corp.,
Sponsored ADR 12,066 888,540CNOOC Ltd., Sponsored ADR 7,040 962,368Crescent Point Energy Corp. 6,910 56,869Ecopetrol SA, Sponsored ADR 3,830 42,475
STEWARD FUNDSSCHEDULE OF PORTFOLIO INVESTMENTS — October 31, 2017 (Unaudited)
STEWARD INTERNATIONAL ENHANCED INDEX FUND
See notes to financial statements.29
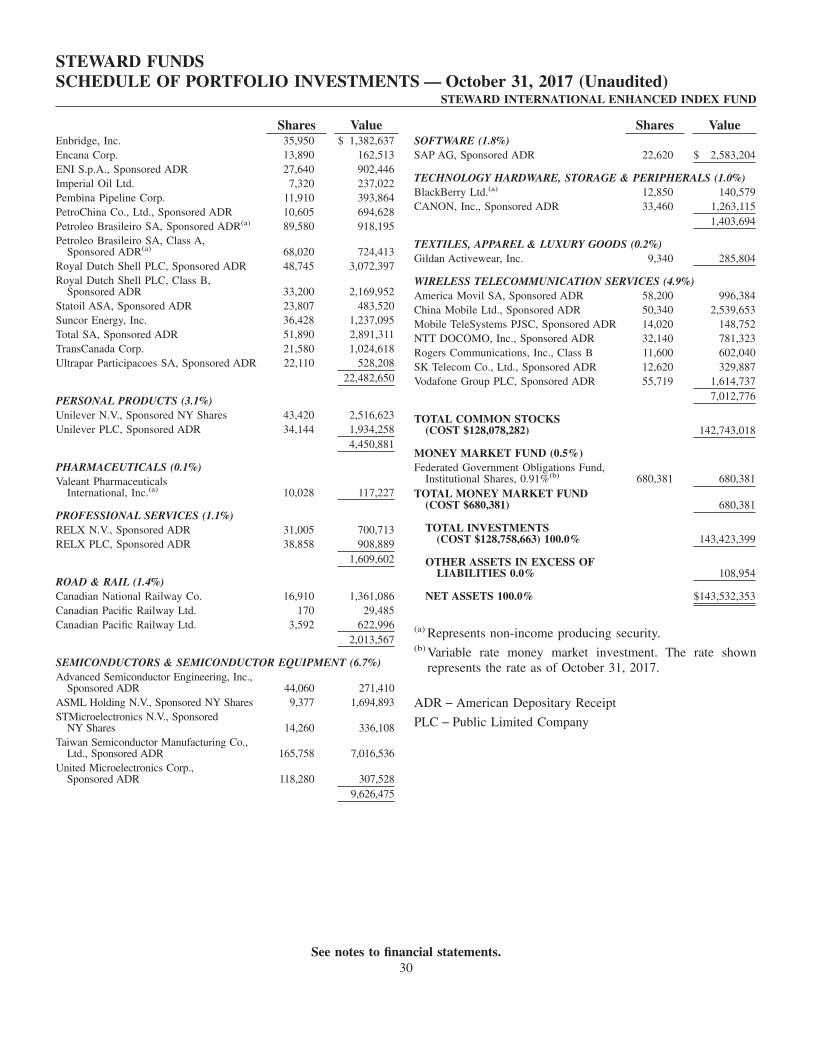
Shares ValueEnbridge, Inc. 35,950 $ 1,382,637Encana Corp. 13,890 162,513ENI S.p.A., Sponsored ADR 27,640 902,446Imperial Oil Ltd. 7,320 237,022Pembina Pipeline Corp. 11,910 393,864PetroChina Co., Ltd., Sponsored ADR 10,605 694,628Petroleo Brasileiro SA, Sponsored ADR(a) 89,580 918,195Petroleo Brasileiro SA, Class A,
Sponsored ADR(a) 68,020 724,413Royal Dutch Shell PLC, Sponsored ADR 48,745 3,072,397Royal Dutch Shell PLC, Class B,
Sponsored ADR 33,200 2,169,952Statoil ASA, Sponsored ADR 23,807 483,520Suncor Energy, Inc. 36,428 1,237,095Total SA, Sponsored ADR 51,890 2,891,311TransCanada Corp. 21,580 1,024,618Ultrapar Participacoes SA, Sponsored ADR 22,110 528,208
22,482,650
PERSONAL PRODUCTS (3.1%)Unilever N.V., Sponsored NY Shares 43,420 2,516,623Unilever PLC, Sponsored ADR 34,144 1,934,258
4,450,881
PHARMACEUTICALS (0.1%)Valeant Pharmaceuticals
International, Inc.(a) 10,028 117,227
PROFESSIONAL SERVICES (1.1%)RELX N.V., Sponsored ADR 31,005 700,713RELX PLC, Sponsored ADR 38,858 908,889
1,609,602
ROAD & RAIL (1.4%)Canadian National Railway Co. 16,910 1,361,086Canadian Pacific Railway Ltd. 170 29,485Canadian Pacific Railway Ltd. 3,592 622,996
2,013,567
SEMICONDUCTORS & SEMICONDUCTOR EQUIPMENT (6.7%)Advanced Semiconductor Engineering, Inc.,
Sponsored ADR 44,060 271,410ASML Holding N.V., Sponsored NY Shares 9,377 1,694,893STMicroelectronics N.V., Sponsored
NY Shares 14,260 336,108Taiwan Semiconductor Manufacturing Co.,
Ltd., Sponsored ADR 165,758 7,016,536United Microelectronics Corp.,
Sponsored ADR 118,280 307,5289,626,475
Shares ValueSOFTWARE (1.8%)SAP AG, Sponsored ADR 22,620 $ 2,583,204
TECHNOLOGY HARDWARE, STORAGE & PERIPHERALS (1.0%)BlackBerry Ltd.(a) 12,850 140,579CANON, Inc., Sponsored ADR 33,460 1,263,115
1,403,694
TEXTILES, APPAREL & LUXURY GOODS (0.2%)Gildan Activewear, Inc. 9,340 285,804
WIRELESS TELECOMMUNICATION SERVICES (4.9%)America Movil SA, Sponsored ADR 58,200 996,384China Mobile Ltd., Sponsored ADR 50,340 2,539,653Mobile TeleSystems PJSC, Sponsored ADR 14,020 148,752NTT DOCOMO, Inc., Sponsored ADR 32,140 781,323Rogers Communications, Inc., Class B 11,600 602,040SK Telecom Co., Ltd., Sponsored ADR 12,620 329,887Vodafone Group PLC, Sponsored ADR 55,719 1,614,737
7,012,776
TOTAL COMMON STOCKS(COST $128,078,282) 142,743,018
MONEY MARKET FUND (0.5%)Federated Government Obligations Fund,
Institutional Shares, 0.91%(b) 680,381 680,381TOTAL MONEY MARKET FUND
(COST $680,381) 680,381
TOTAL INVESTMENTS(COST $128,758,663) 100.0% 143,423,399
OTHER ASSETS IN EXCESS OFLIABILITIES 0.0% 108,954
NET ASSETS 100.0% $143,532,353
(a) Represents non-income producing security.(b) Variable rate money market investment. The rate shown
represents the rate as of October 31, 2017.
ADR − American Depositary Receipt
PLC − Public Limited Company
STEWARD FUNDSSCHEDULE OF PORTFOLIO INVESTMENTS — October 31, 2017 (Unaudited)
STEWARD INTERNATIONAL ENHANCED INDEX FUND
See notes to financial statements.30

The table below sets forth the diversification of the Steward Select Bond Fund investments by Industry.
Industry Diversification Percent*
U.S. Treasury Obligations . . . . . . . . . . . . . . . . . . . . . . . . . . . . . . . . . . . . . . . . . . . . . . . . . . . . . . . . . . . 17.1%U.S. Government Agencies . . . . . . . . . . . . . . . . . . . . . . . . . . . . . . . . . . . . . . . . . . . . . . . . . . . . . . . . . . 10.0U.S. Government Agency Mortgage-Backed Obligations . . . . . . . . . . . . . . . . . . . . . . . . . . . . . . . . . . . . . . 3.0Municipal Bonds . . . . . . . . . . . . . . . . . . . . . . . . . . . . . . . . . . . . . . . . . . . . . . . . . . . . . . . . . . . . . . . . . 1.1Banks . . . . . . . . . . . . . . . . . . . . . . . . . . . . . . . . . . . . . . . . . . . . . . . . . . . . . . . . . . . . . . . . . . . . . . . . 6.6Biotechnology . . . . . . . . . . . . . . . . . . . . . . . . . . . . . . . . . . . . . . . . . . . . . . . . . . . . . . . . . . . . . . . . . . . 4.8Food Products . . . . . . . . . . . . . . . . . . . . . . . . . . . . . . . . . . . . . . . . . . . . . . . . . . . . . . . . . . . . . . . . . . . 4.5Consumer Finance . . . . . . . . . . . . . . . . . . . . . . . . . . . . . . . . . . . . . . . . . . . . . . . . . . . . . . . . . . . . . . . . 4.4Chemicals . . . . . . . . . . . . . . . . . . . . . . . . . . . . . . . . . . . . . . . . . . . . . . . . . . . . . . . . . . . . . . . . . . . . . 3.8Money Market Funds . . . . . . . . . . . . . . . . . . . . . . . . . . . . . . . . . . . . . . . . . . . . . . . . . . . . . . . . . . . . . . 3.5Capital Markets . . . . . . . . . . . . . . . . . . . . . . . . . . . . . . . . . . . . . . . . . . . . . . . . . . . . . . . . . . . . . . . . . . 2.9Insurance . . . . . . . . . . . . . . . . . . . . . . . . . . . . . . . . . . . . . . . . . . . . . . . . . . . . . . . . . . . . . . . . . . . . . . 2.9Electric Utilities . . . . . . . . . . . . . . . . . . . . . . . . . . . . . . . . . . . . . . . . . . . . . . . . . . . . . . . . . . . . . . . . . 2.8Semiconductors & Semiconductor Equipment . . . . . . . . . . . . . . . . . . . . . . . . . . . . . . . . . . . . . . . . . . . . . 2.6Specialty Retail . . . . . . . . . . . . . . . . . . . . . . . . . . . . . . . . . . . . . . . . . . . . . . . . . . . . . . . . . . . . . . . . . . 2.6Diversified Telecommunication Services . . . . . . . . . . . . . . . . . . . . . . . . . . . . . . . . . . . . . . . . . . . . . . . . . 2.3Beverages . . . . . . . . . . . . . . . . . . . . . . . . . . . . . . . . . . . . . . . . . . . . . . . . . . . . . . . . . . . . . . . . . . . . . . 2.2Software . . . . . . . . . . . . . . . . . . . . . . . . . . . . . . . . . . . . . . . . . . . . . . . . . . . . . . . . . . . . . . . . . . . . . . . 2.2Oil, Gas & Consumable Fuels . . . . . . . . . . . . . . . . . . . . . . . . . . . . . . . . . . . . . . . . . . . . . . . . . . . . . . . . 2.0Aerospace & Defense . . . . . . . . . . . . . . . . . . . . . . . . . . . . . . . . . . . . . . . . . . . . . . . . . . . . . . . . . . . . . . 1.9Industrial Conglomerates . . . . . . . . . . . . . . . . . . . . . . . . . . . . . . . . . . . . . . . . . . . . . . . . . . . . . . . . . . . 1.9Air Freight & Logistics . . . . . . . . . . . . . . . . . . . . . . . . . . . . . . . . . . . . . . . . . . . . . . . . . . . . . . . . . . . . 1.6Multiline Retail . . . . . . . . . . . . . . . . . . . . . . . . . . . . . . . . . . . . . . . . . . . . . . . . . . . . . . . . . . . . . . . . . . 1.6Food & Staples Retailing . . . . . . . . . . . . . . . . . . . . . . . . . . . . . . . . . . . . . . . . . . . . . . . . . . . . . . . . . . . 1.5Road & Rail . . . . . . . . . . . . . . . . . . . . . . . . . . . . . . . . . . . . . . . . . . . . . . . . . . . . . . . . . . . . . . . . . . . . 1.3Electronic Equipment, Instruments & Components . . . . . . . . . . . . . . . . . . . . . . . . . . . . . . . . . . . . . . . . . . 1.1Technology Hardware, Storage & Peripherals . . . . . . . . . . . . . . . . . . . . . . . . . . . . . . . . . . . . . . . . . . . . . . 1.0Machinery . . . . . . . . . . . . . . . . . . . . . . . . . . . . . . . . . . . . . . . . . . . . . . . . . . . . . . . . . . . . . . . . . . . . . 0.9Household Durables . . . . . . . . . . . . . . . . . . . . . . . . . . . . . . . . . . . . . . . . . . . . . . . . . . . . . . . . . . . . . . . 0.6Hotels, Restaurants & Leisure . . . . . . . . . . . . . . . . . . . . . . . . . . . . . . . . . . . . . . . . . . . . . . . . . . . . . . . . 0.6Health Care Equipment & Supplies . . . . . . . . . . . . . . . . . . . . . . . . . . . . . . . . . . . . . . . . . . . . . . . . . . . . 0.6Health Care Providers & Services . . . . . . . . . . . . . . . . . . . . . . . . . . . . . . . . . . . . . . . . . . . . . . . . . . . . . 0.6IT Services . . . . . . . . . . . . . . . . . . . . . . . . . . . . . . . . . . . . . . . . . . . . . . . . . . . . . . . . . . . . . . . . . . . . . 0.6Pharmaceuticals . . . . . . . . . . . . . . . . . . . . . . . . . . . . . . . . . . . . . . . . . . . . . . . . . . . . . . . . . . . . . . . . . . 0.5Diversified Consumer Services . . . . . . . . . . . . . . . . . . . . . . . . . . . . . . . . . . . . . . . . . . . . . . . . . . . . . . . . 0.3Communications Equipment . . . . . . . . . . . . . . . . . . . . . . . . . . . . . . . . . . . . . . . . . . . . . . . . . . . . . . . . . 0.3Mortgage-Backed Securities − Financial Services . . . . . . . . . . . . . . . . . . . . . . . . . . . . . . . . . . . . . . . . . . . 0.3Equity Real Estate Investment Trusts . . . . . . . . . . . . . . . . . . . . . . . . . . . . . . . . . . . . . . . . . . . . . . . . . . . 0.2Commercial Services & Supplies . . . . . . . . . . . . . . . . . . . . . . . . . . . . . . . . . . . . . . . . . . . . . . . . . . . . . . 0.2Internet Software & Services . . . . . . . . . . . . . . . . . . . . . . . . . . . . . . . . . . . . . . . . . . . . . . . . . . . . . . . . . 0.2
Total Investments . . . . . . . . . . . . . . . . . . . . . . . . . . . . . . . . . . . . . . . . . . . . . . . . . . . . . . . . . . . . . . . 99.1%
* Percentages indicated are based on net assets as of October 31, 2017.
STEWARD FUNDSSCHEDULE OF PORTFOLIO INVESTMENTS — October 31, 2017 (Unaudited)
STEWARD SELECT BOND FUND
See notes to financial statements.31
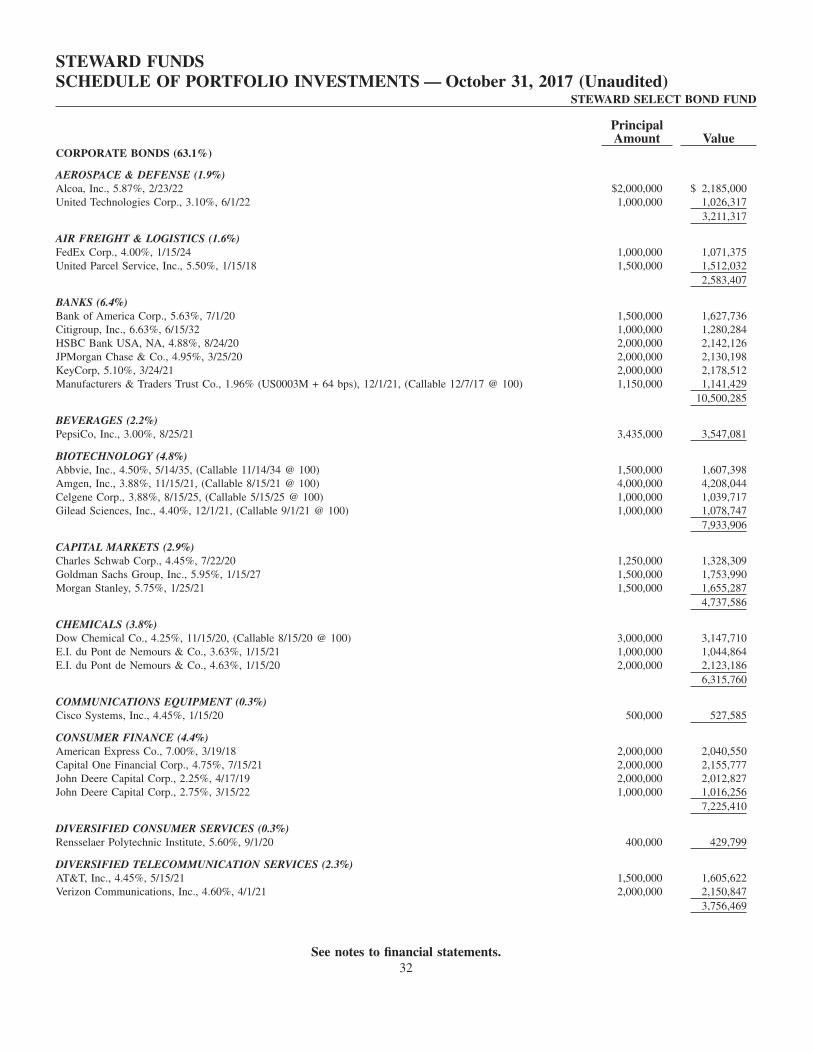
PrincipalAmount Value
CORPORATE BONDS (63.1%)
AEROSPACE & DEFENSE (1.9%)Alcoa, Inc., 5.87%, 2/23/22 $2,000,000 $ 2,185,000United Technologies Corp., 3.10%, 6/1/22 1,000,000 1,026,317
3,211,317
AIR FREIGHT & LOGISTICS (1.6%)FedEx Corp., 4.00%, 1/15/24 1,000,000 1,071,375United Parcel Service, Inc., 5.50%, 1/15/18 1,500,000 1,512,032
2,583,407
BANKS (6.4%)Bank of America Corp., 5.63%, 7/1/20 1,500,000 1,627,736Citigroup, Inc., 6.63%, 6/15/32 1,000,000 1,280,284HSBC Bank USA, NA, 4.88%, 8/24/20 2,000,000 2,142,126JPMorgan Chase & Co., 4.95%, 3/25/20 2,000,000 2,130,198KeyCorp, 5.10%, 3/24/21 2,000,000 2,178,512Manufacturers & Traders Trust Co., 1.96% (US0003M + 64 bps), 12/1/21, (Callable 12/7/17 @ 100) 1,150,000 1,141,429
10,500,285
BEVERAGES (2.2%)PepsiCo, Inc., 3.00%, 8/25/21 3,435,000 3,547,081
BIOTECHNOLOGY (4.8%)Abbvie, Inc., 4.50%, 5/14/35, (Callable 11/14/34 @ 100) 1,500,000 1,607,398Amgen, Inc., 3.88%, 11/15/21, (Callable 8/15/21 @ 100) 4,000,000 4,208,044Celgene Corp., 3.88%, 8/15/25, (Callable 5/15/25 @ 100) 1,000,000 1,039,717Gilead Sciences, Inc., 4.40%, 12/1/21, (Callable 9/1/21 @ 100) 1,000,000 1,078,747
7,933,906
CAPITAL MARKETS (2.9%)Charles Schwab Corp., 4.45%, 7/22/20 1,250,000 1,328,309Goldman Sachs Group, Inc., 5.95%, 1/15/27 1,500,000 1,753,990Morgan Stanley, 5.75%, 1/25/21 1,500,000 1,655,287
4,737,586
CHEMICALS (3.8%)Dow Chemical Co., 4.25%, 11/15/20, (Callable 8/15/20 @ 100) 3,000,000 3,147,710E.I. du Pont de Nemours & Co., 3.63%, 1/15/21 1,000,000 1,044,864E.I. du Pont de Nemours & Co., 4.63%, 1/15/20 2,000,000 2,123,186
6,315,760
COMMUNICATIONS EQUIPMENT (0.3%)Cisco Systems, Inc., 4.45%, 1/15/20 500,000 527,585
CONSUMER FINANCE (4.4%)American Express Co., 7.00%, 3/19/18 2,000,000 2,040,550Capital One Financial Corp., 4.75%, 7/15/21 2,000,000 2,155,777John Deere Capital Corp., 2.25%, 4/17/19 2,000,000 2,012,827John Deere Capital Corp., 2.75%, 3/15/22 1,000,000 1,016,256
7,225,410
DIVERSIFIED CONSUMER SERVICES (0.3%)Rensselaer Polytechnic Institute, 5.60%, 9/1/20 400,000 429,799
DIVERSIFIED TELECOMMUNICATION SERVICES (2.3%)AT&T, Inc., 4.45%, 5/15/21 1,500,000 1,605,622Verizon Communications, Inc., 4.60%, 4/1/21 2,000,000 2,150,847
3,756,469
STEWARD FUNDSSCHEDULE OF PORTFOLIO INVESTMENTS — October 31, 2017 (Unaudited)
STEWARD SELECT BOND FUND
See notes to financial statements.32
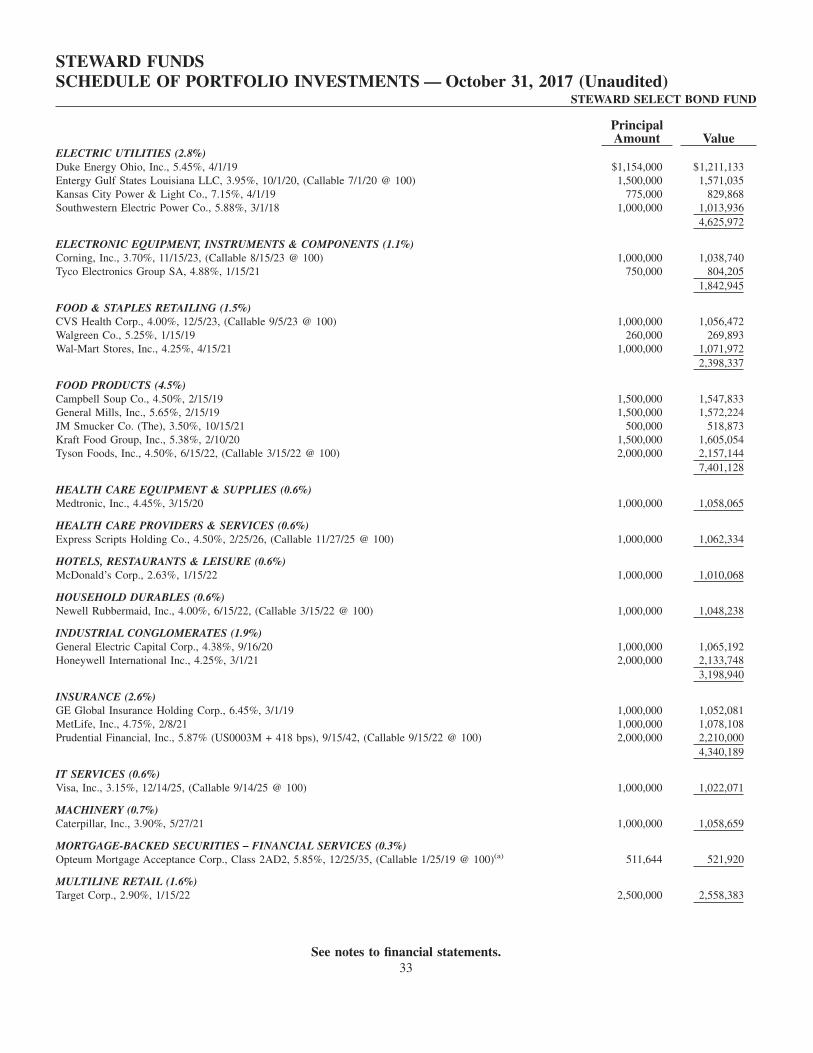
PrincipalAmount Value
ELECTRIC UTILITIES (2.8%)Duke Energy Ohio, Inc., 5.45%, 4/1/19 $1,154,000 $1,211,133Entergy Gulf States Louisiana LLC, 3.95%, 10/1/20, (Callable 7/1/20 @ 100) 1,500,000 1,571,035Kansas City Power & Light Co., 7.15%, 4/1/19 775,000 829,868Southwestern Electric Power Co., 5.88%, 3/1/18 1,000,000 1,013,936
4,625,972
ELECTRONIC EQUIPMENT, INSTRUMENTS & COMPONENTS (1.1%)Corning, Inc., 3.70%, 11/15/23, (Callable 8/15/23 @ 100) 1,000,000 1,038,740Tyco Electronics Group SA, 4.88%, 1/15/21 750,000 804,205
1,842,945
FOOD & STAPLES RETAILING (1.5%)CVS Health Corp., 4.00%, 12/5/23, (Callable 9/5/23 @ 100) 1,000,000 1,056,472Walgreen Co., 5.25%, 1/15/19 260,000 269,893Wal-Mart Stores, Inc., 4.25%, 4/15/21 1,000,000 1,071,972
2,398,337
FOOD PRODUCTS (4.5%)Campbell Soup Co., 4.50%, 2/15/19 1,500,000 1,547,833General Mills, Inc., 5.65%, 2/15/19 1,500,000 1,572,224JM Smucker Co. (The), 3.50%, 10/15/21 500,000 518,873Kraft Food Group, Inc., 5.38%, 2/10/20 1,500,000 1,605,054Tyson Foods, Inc., 4.50%, 6/15/22, (Callable 3/15/22 @ 100) 2,000,000 2,157,144
7,401,128
HEALTH CARE EQUIPMENT & SUPPLIES (0.6%)Medtronic, Inc., 4.45%, 3/15/20 1,000,000 1,058,065
HEALTH CARE PROVIDERS & SERVICES (0.6%)Express Scripts Holding Co., 4.50%, 2/25/26, (Callable 11/27/25 @ 100) 1,000,000 1,062,334
HOTELS, RESTAURANTS & LEISURE (0.6%)McDonald’s Corp., 2.63%, 1/15/22 1,000,000 1,010,068
HOUSEHOLD DURABLES (0.6%)Newell Rubbermaid, Inc., 4.00%, 6/15/22, (Callable 3/15/22 @ 100) 1,000,000 1,048,238
INDUSTRIAL CONGLOMERATES (1.9%)General Electric Capital Corp., 4.38%, 9/16/20 1,000,000 1,065,192Honeywell International Inc., 4.25%, 3/1/21 2,000,000 2,133,748
3,198,940
INSURANCE (2.6%)GE Global Insurance Holding Corp., 6.45%, 3/1/19 1,000,000 1,052,081MetLife, Inc., 4.75%, 2/8/21 1,000,000 1,078,108Prudential Financial, Inc., 5.87% (US0003M + 418 bps), 9/15/42, (Callable 9/15/22 @ 100) 2,000,000 2,210,000
4,340,189
IT SERVICES (0.6%)Visa, Inc., 3.15%, 12/14/25, (Callable 9/14/25 @ 100) 1,000,000 1,022,071
MACHINERY (0.7%)Caterpillar, Inc., 3.90%, 5/27/21 1,000,000 1,058,659
MORTGAGE-BACKED SECURITIES − FINANCIAL SERVICES (0.3%)Opteum Mortgage Acceptance Corp., Class 2AD2, 5.85%, 12/25/35, (Callable 1/25/19 @ 100)(a) 511,644 521,920
MULTILINE RETAIL (1.6%)Target Corp., 2.90%, 1/15/22 2,500,000 2,558,383
STEWARD FUNDSSCHEDULE OF PORTFOLIO INVESTMENTS — October 31, 2017 (Unaudited)
STEWARD SELECT BOND FUND
See notes to financial statements.33

PrincipalAmount Value
OIL, GAS & CONSUMABLE FUELS (2.0%)Apache Corp., 3.25%, 4/15/22, (Callable 1/15/22 @ 100) $ 724,000 $ 735,301Gulf South Pipeline Company LP, 4.00%, 6/15/22, (Callable 3/15/22 @ 100) 1,500,000 1,555,468Occidental Petroleum Corp., 3.13%, 2/15/22, (Callable 11/15/21 @ 100) 1,000,000 1,031,157
3,321,926
PHARMACEUTICALS (0.5%)Teva Pharmaceutical Finance, 3.65%, 11/10/21 901,000 892,188
ROAD & RAIL (1.3%)Union Pacific Corp., 4.16%, 7/15/22, (Callable 4/15/22 @ 100) 2,000,000 2,157,595
SEMICONDUCTORS & SEMICONDUCTOR EQUIPMENT (2.6%)Qualcomm, Inc., 4.65%, 5/20/35, (Callable 11/20/34 @ 100) 4,000,000 4,364,544
SOFTWARE (2.2%)Microsoft Corp., 3.45%, 8/8/36, (Callable 2/8/36 @ 100) 2,000,000 2,020,702Oracle Corp., 5.00%, 7/8/19 1,500,000 1,580,841
3,601,543
SPECIALTY RETAIL (2.6%)Lowe’s Companies, Inc., 3.80%, 11/15/21, (Callable 8/15/21 @ 100) 1,000,000 1,051,629The Home Depot, Inc., 3.75%, 2/15/24, (Callable 11/15/23 @ 100) 2,000,000 2,122,658The Home Depot, Inc., 4.40%, 4/1/21, (Callable 1/1/21 @ 100) 1,000,000 1,074,838
4,249,125
TECHNOLOGY HARDWARE, STORAGE & PERIPHERALS (1.0%)Xerox Corp., 4.50%, 5/15/21 1,000,000 1,049,965Xerox Corp., 6.35%, 5/15/18 532,000 544,269
1,594,234TOTAL CORPORATE BONDS (COST $103,140,145) 104,097,009
MUNICIPAL BONDS (1.1%)North Carolina State Turnpike Authority Triangle Expressway Systems Revenue, 5.13%, 1/1/20 450,000 478,080Oklahoma Development Finance Authority Lease Revenue, 5.65%, 6/1/41, (Callable 6/1/21 @ 100) 150,000 158,586The City of New York, GO, 5.68%, 10/1/34, (Callable 10/1/19 @ 100) 1,000,000 1,067,240TOTAL MUNICIPAL BONDS (COST $1,712,229) 1,703,906
U.S. GOVERNMENT AGENCIES (10.0%)Federal Farm Credit Bank
1.08%, 8/15/19 1,000,000 989,236
Federal Home Loan Bank1.25%, 6/8/18 2,000,000 1,998,8701.50%, 5/23/22(a)(b) 1,000,000 998,6331.62%, 6/29/22(a) 1,000,000 993,5261.75%, 12/14/18 1,000,000 1,002,5153.50%, 7/29/21 2,000,000 2,113,2374.75%, 6/8/18 2,000,000 2,039,386
9,146,167
Federal Home Loan Mortgage Corp.1.37%, 3/29/22(a)(b) 1,000,000 998,7792.00%, 8/17/21(a)(b) 1,000,000 997,1292.25%, 2/28/22 1,000,000 997,9453.75%, 3/27/19 1,500,000 1,545,545
4,539,398
STEWARD FUNDSSCHEDULE OF PORTFOLIO INVESTMENTS — October 31, 2017 (Unaudited)
STEWARD SELECT BOND FUND
See notes to financial statements.34

PrincipalAmount Value
Federal National Mortgage Association1.51%, 9/30/21 $1,000,000 $ 975,6371.53%, 4/12/22 1,000,000 964,662
1,940,299TOTAL U.S. GOVERNMENT AGENCIES (COST $16,649,458) 16,615,100
U.S. GOVERNMENT AGENCY MORTGAGE-BACKED OBLIGATIONS (3.0%)Federal Home Loan Mortgage Corp.
3.01% (H15T1Y + 225 bps), 5/1/36 73,316 77,4273.30% (US0012M + 179 bps), 10/1/37 79,657 83,8274.00%, 12/15/25 2,500,000 2,669,7325.00%, 7/15/19 5,230 5,2465.00%, 11/1/37 20,393 21,8316.00%, 3/1/38 46,051 51,819
2,909,882Federal National Mortgage Association
1.66% (LIBOR01M + 42 bps), 11/25/36 131,084 131,3703.13% (H15T1Y + 213 bps), 7/1/36 33,619 33,6263.70% (US0012M + 182 bps), 5/1/36 172,054 181,7893.78% (US0012M + 204 bps), 10/1/36 18,829 18,8595.00%, 1/1/35 36,423 39,0715.50%, 9/1/36 10,869 11,1586.00%, 6/1/36 228,926 242,8646.00%, 9/1/36 87,288 95,7326.00%, 5/1/37 34,019 37,344
791,813Government National Mortgage Association
2.38% (H15T1Y + 150 bps), 1/20/39 71,101 72,0234.25%, 10/20/38 202,021 207,6684.50%, 8/20/38 125,528 131,2834.50%, 5/20/39 364,366 373,3664.50%, 6/15/40 238,050 254,2125.00%, 5/20/40 112,618 119,3815.50%, 12/20/38 18,392 19,2566.00%, 6/15/37 48,404 54,4206.00%, 10/15/37 50,870 57,1936.50%, 10/20/38 14,448 15,259
1,304,061TOTAL U.S. GOVERNMENT AGENCY MORTGAGE-BACKED OBLIGATIONS (COST $4,727,883) 5,005,756
U.S. TREASURY OBLIGATIONS (17.1%)U.S. Treasury Notes
0.38%, 1/15/27 1,016,390 1,002,6731.38%, 2/28/19 3,000,000 2,994,4921.50%, 12/31/18 2,500,000 2,499,6091.63%, 11/15/22 4,150,000 4,072,0252.00%, 11/30/20 2,500,000 2,518,1642.00%, 11/15/21 5,000,000 5,022,6562.00%, 2/15/22 7,000,000 7,021,3293.13%, 5/15/19 3,000,000 3,071,836
TOTAL U.S. TREASURY OBLIGATIONS (COST $28,084,302) 28,202,784
STEWARD FUNDSSCHEDULE OF PORTFOLIO INVESTMENTS — October 31, 2017 (Unaudited)
STEWARD SELECT BOND FUND
See notes to financial statements.35

Shares ValuePREFERRED STOCKS (1.3%)
BANKS (0.2%)JPMorgan Chase & Co. − Preferred 15,000 $ 403,200
COMMERCIAL SERVICES & SUPPLIES (0.2%)Pitney Bowes, Inc. − Preferred 15,000 385,650
EQUITY REAL ESTATE INVESTMENT TRUSTS (0.2%)Public Storage − Preferred 15,000 378,300
INSURANCE (0.3%)Torchmark Corp. − Preferred 15,000 407,850
INTERNET SOFTWARE & SERVICES (0.2%)eBay, Inc. − Preferred 15,000 406,200
MACHINERY (0.2%)Stanley Black & Decker, Inc. − Preferred 15,000 380,700TOTAL PREFERRED STOCKS (COST $2,362,372) 2,361,900
MONEY MARKET FUND (3.5%)Federated Government Obligations Fund, Institutional Shares, 0.91%(c) 5,750,507 5,750,507TOTAL MONEY MARKET FUND (COST $5,750,507) 5,750,507
TOTAL INVESTMENTS (COST $162,426,896) 99.1% 163,736,962
OTHER ASSETS IN EXCESS OF LIABILITIES 0.9% 1,451,000
NET ASSETS 100.0% $165,187,962
(a) The rate for certain asset-backed and mortgage backed securities may vary based on factors relating to the pool of assetsunderlying the security. The rate shown represents the rate as of October 31, 2017.
(b) Step bond. Coupon rate is set for an initial period and then adjusted at a specified date. The rate shown represents the rate asof October 31, 2017.
(c) Variable rate money market investment. The rate shown represents the rate as of October 31, 2017.
GO − General Obligation
H15T1Y − 1 Year Treasury Constant Maturity Rate
LIBOR01M − 1 Month US Dollar LIBOR
LLC − Limited Liability Company
LP − Limited Partnership
US0003M − 3 Month US Dollar LIBOR
US0012M − 12 Month US Dollar LIBOR
STEWARD FUNDSSCHEDULE OF PORTFOLIO INVESTMENTS — October 31, 2017 (Unaudited)
STEWARD SELECT BOND FUND
See notes to financial statements.36

The table below sets forth the diversification of the Steward Global Equity Income Fund investments by Country.
Country Diversification Percent*
United States . . . . . . . . . . . . . . . . . . . . . . . . . . . . . . . . . . . . . . . . . . . . . . . . . . . . . . . . . . . . . . . . . . . . . . 59.4%Canada . . . . . . . . . . . . . . . . . . . . . . . . . . . . . . . . . . . . . . . . . . . . . . . . . . . . . . . . . . . . . . . . . . . . . . . . . . 13.9United Kingdom . . . . . . . . . . . . . . . . . . . . . . . . . . . . . . . . . . . . . . . . . . . . . . . . . . . . . . . . . . . . . . . . . . . . 6.6Japan . . . . . . . . . . . . . . . . . . . . . . . . . . . . . . . . . . . . . . . . . . . . . . . . . . . . . . . . . . . . . . . . . . . . . . . . . . . 5.0Taiwan, Province of China . . . . . . . . . . . . . . . . . . . . . . . . . . . . . . . . . . . . . . . . . . . . . . . . . . . . . . . . . . . . . 4.0Netherlands . . . . . . . . . . . . . . . . . . . . . . . . . . . . . . . . . . . . . . . . . . . . . . . . . . . . . . . . . . . . . . . . . . . . . . . 2.6Switzerland . . . . . . . . . . . . . . . . . . . . . . . . . . . . . . . . . . . . . . . . . . . . . . . . . . . . . . . . . . . . . . . . . . . . . . . 2.5Chile . . . . . . . . . . . . . . . . . . . . . . . . . . . . . . . . . . . . . . . . . . . . . . . . . . . . . . . . . . . . . . . . . . . . . . . . . . . 2.3Luxembourg . . . . . . . . . . . . . . . . . . . . . . . . . . . . . . . . . . . . . . . . . . . . . . . . . . . . . . . . . . . . . . . . . . . . . . 1.5Republic of Korea (South) . . . . . . . . . . . . . . . . . . . . . . . . . . . . . . . . . . . . . . . . . . . . . . . . . . . . . . . . . . . . . 1.2Ireland (Republic of) . . . . . . . . . . . . . . . . . . . . . . . . . . . . . . . . . . . . . . . . . . . . . . . . . . . . . . . . . . . . . . . . . 1.0
Total Investments . . . . . . . . . . . . . . . . . . . . . . . . . . . . . . . . . . . . . . . . . . . . . . . . . . . . . . . . . . . . . . . . . 100.0%
* Percentages indicated are based on net assets as of October 31, 2017.
STEWARD FUNDSSCHEDULE OF PORTFOLIO INVESTMENTS — October 31, 2017 (Unaudited)
STEWARD GLOBAL EQUITY INCOME FUND
See notes to financial statements.37

Shares ValueCOMMON STOCKS (99.7%)
AEROSPACE & DEFENSE (4.1%)Lockheed Martin Corp. 16,130 $ 4,970,621Raytheon Co. 35,316 6,363,943
11,334,564
AUTO COMPONENTS (1.7%)Magna International, Inc., Class A, ADR 84,106 4,587,982
AUTOMOBILES (1.7%)Toyota Motor Corp., Sponsored ADR 36,975 4,584,900
BANKS (11.8%)Banco Santander Chile SA, Sponsored ADR 200,591 6,274,487Bank of Nova Scotia 67,864 4,378,585Canadian Imperial Bank of Commerce 53,642 4,723,178Mizuho Financial Group, Inc.,
Sponsored ADR 838,082 3,075,761People’s United Financial, Inc. 178,337 3,327,768Royal Bank of Canada 57,701 4,509,333Sumitomo Mitsui Financial Group, Inc.,
Sponsored ADR 742,699 5,986,15432,275,266
BEVERAGES (2.2%)PepsiCo, Inc. 53,577 5,905,793
BIOTECHNOLOGY (3.1%)AbbVie, Inc. 41,545 3,749,436Amgen, Inc. 26,798 4,695,546
8,444,982
CAPITAL MARKETS (3.9%)Thomson Reuters Corp. 80,707 3,780,316UBS Group AG 407,123 6,925,162
10,705,478
CHEMICALS (2.1%)DowDuPont, Inc.(a) 52,057 3,764,242RPM International, Inc. 37,282 1,988,249
5,752,491
COMMUNICATIONS EQUIPMENT (1.6%)Cisco Systems, Inc. 131,030 4,474,674
DISTRIBUTORS (1.2%)Genuine Parts Co. 37,951 3,348,417
DIVERSIFIED TELECOMMUNICATION SERVICES (2.8%)BCE, Inc. 76,301 3,522,054TELUS Corp. 112,795 4,085,435
7,607,489
ELECTRIC UTILITIES (1.2%)Korea Electric Power Corp.,
Sponsored ADR 192,057 3,384,044
Shares ValueEQUITY REAL ESTATE INVESTMENT TRUSTS (2.9%)Camden Property Trust 23,320 $ 2,127,717EPR Properties 42,497 2,939,943LTC Properties, Inc. 60,630 2,819,901
7,887,561
FOOD & STAPLES RETAILING (0.9%)Wal-Mart Stores, Inc. 28,470 2,485,716
FOOD PRODUCTS (1.2%)General Mills, Inc. 61,781 3,207,669
HEALTH CARE EQUIPMENT & SUPPLIES (5.9%)Medtronic PLC 63,904 5,145,550ResMed, Inc. 52,400 4,411,032Smith & Nephew PLC, Sponsored ADR 168,901 6,462,152
16,018,734
HEALTH CARE PROVIDERS & SERVICES (3.5%)HealthSouth Corp. 77,228 3,563,300Quest Diagnostics, Inc. 63,781 5,981,382
9,544,682
HOTELS, RESTAURANTS & LEISURE (4.9%)Carnival PLC, Sponsored ADR 41,235 2,752,024Dunkin’ Brands Group, Inc. 56,460 3,335,092McDonald’s Corp. 44,547 7,435,340
13,522,456
HOUSEHOLD DURABLES (0.8%)Tupperware Corp. 38,914 2,286,197
HOUSEHOLD PRODUCTS (1.7%)Clorox Co. 15,281 1,933,505Procter & Gamble Co. 31,068 2,682,411
4,615,916
INDUSTRIAL CONGLOMERATES (2.3%)3M Co. 26,822 6,174,156
IT SERVICES (3.9%)Automatic Data Processing, Inc. 52,907 6,150,968International Business Machines Corp. 28,876 4,448,636
10,599,604
MEDIA (1.0%)WPP PLC, Sponsored ADR 31,439 2,775,749
METALS & MINING (1.5%)Ternium SA, Sponsored ADR 132,676 4,114,283
MULTI-UTILITIES (2.1%)National Grid PLC, Sponsored ADR 50,227 3,066,359WEC Energy Group 41,198 2,776,333
5,842,692
OIL, GAS & CONSUMABLE FUELS (4.5%)Pembina Pipeline Corp. 136,161 4,502,845Valero Energy Corp. 99,625 7,859,416
12,362,261
STEWARD FUNDSSCHEDULE OF PORTFOLIO INVESTMENTS — October 31, 2017 (Unaudited)
STEWARD GLOBAL EQUITY INCOME FUND
See notes to financial statements.38

Shares ValuePERSONAL PRODUCTS (2.6%)Unilever N.V., Sponsored NY Shares 122,851 $ 7,120,444
PROFESSIONAL SERVICES (2.1%)RELX PLC, Sponsored ADR 250,295 5,854,400
ROAD & RAIL (1.4%)Canadian National Railway Co. 47,797 3,847,181
SEMICONDUCTORS & SEMICONDUCTOR EQUIPMENT (10.2%)Advanced Semiconductor Engineering, Inc.,
Sponsored ADR 689,368 4,246,507Analog Devices, Inc. 51,963 4,744,222Intel Corp. 129,645 5,897,551KLA-Tencor Corp. 43,512 4,738,022QUALCOMM, Inc. 31,653 1,614,619Taiwan Semiconductor Manufacturing Co.,
Ltd., Sponsored ADR 160,999 6,815,08828,056,009
SOFTWARE (3.1%)Microsoft Corp. 101,493 8,442,188
SPECIALTY RETAIL (2.6%)Home Depot, Inc. 43,549 7,219,553
Shares ValueTECHNOLOGY HARDWARE, STORAGE
& PERIPHERALS (3.2%)Apple Computer, Inc. 51,669 $ 8,734,128
TOTAL COMMON STOCKS(COST $222,583,223) 273,117,659
MONEY MARKET FUND (0.3%)Federated Government Obligations Fund,
Institutional Shares, 0.91%(b) 698,130 698,130TOTAL MONEY MARKET FUND
(COST $698,130) 698,130
TOTAL INVESTMENTS(COST $223,281,353) 100.0% 273,815,789
OTHER ASSETS IN EXCESS OFLIABILITIES 0.0% 207,871
NET ASSETS 100.0% $274,023,660
(a) Represents non-income producing security.(b) Variable rate money market investment. The rate shown
represents the rate as of October 31, 2017.
ADR − American Depositary Receipt
PLC − Public Limited Company
STEWARD FUNDSSCHEDULE OF PORTFOLIO INVESTMENTS — October 31, 2017 (Unaudited)
STEWARD GLOBAL EQUITY INCOME FUND
See notes to financial statements.39
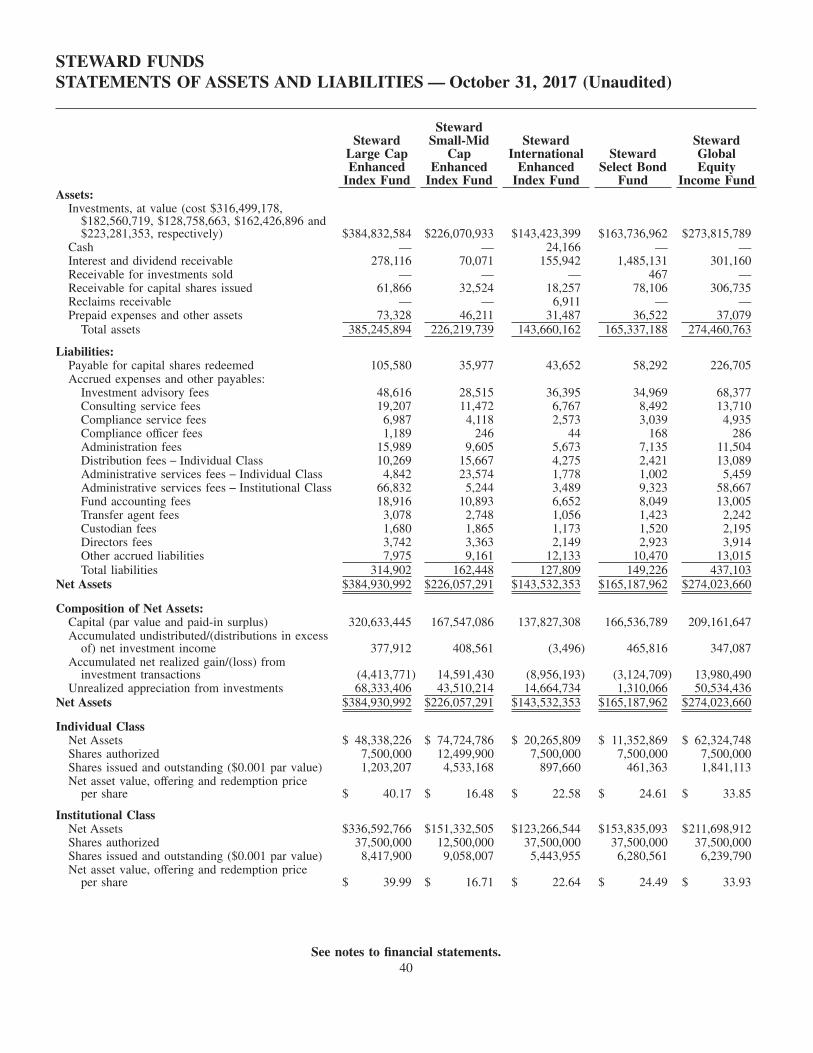
STEWARD FUNDSSTATEMENTS OF ASSETS AND LIABILITIES — October 31, 2017 (Unaudited)
StewardLarge CapEnhanced
Index Fund
StewardSmall-Mid
CapEnhanced
Index Fund
StewardInternational
EnhancedIndex Fund
StewardSelect Bond
Fund
StewardGlobalEquity
Income FundAssets:
Investments, at value (cost $316,499,178,$182,560,719, $128,758,663, $162,426,896 and$223,281,353, respectively) $384,832,584 $226,070,933 $143,423,399 $163,736,962 $273,815,789
Cash — — 24,166 — —Interest and dividend receivable 278,116 70,071 155,942 1,485,131 301,160Receivable for investments sold — — — 467 —Receivable for capital shares issued 61,866 32,524 18,257 78,106 306,735Reclaims receivable — — 6,911 — —Prepaid expenses and other assets 73,328 46,211 31,487 36,522 37,079
Total assets 385,245,894 226,219,739 143,660,162 165,337,188 274,460,763
Liabilities:Payable for capital shares redeemed 105,580 35,977 43,652 58,292 226,705Accrued expenses and other payables:
Investment advisory fees 48,616 28,515 36,395 34,969 68,377Consulting service fees 19,207 11,472 6,767 8,492 13,710Compliance service fees 6,987 4,118 2,573 3,039 4,935Compliance officer fees 1,189 246 44 168 286Administration fees 15,989 9,605 5,673 7,135 11,504Distribution fees − Individual Class 10,269 15,667 4,275 2,421 13,089Administrative services fees − Individual Class 4,842 23,574 1,778 1,002 5,459Administrative services fees − Institutional Class 66,832 5,244 3,489 9,323 58,667Fund accounting fees 18,916 10,893 6,652 8,049 13,005Transfer agent fees 3,078 2,748 1,056 1,423 2,242Custodian fees 1,680 1,865 1,173 1,520 2,195Directors fees 3,742 3,363 2,149 2,923 3,914Other accrued liabilities 7,975 9,161 12,133 10,470 13,015Total liabilities 314,902 162,448 127,809 149,226 437,103
Net Assets $384,930,992 $226,057,291 $143,532,353 $165,187,962 $274,023,660
Composition of Net Assets:Capital (par value and paid-in surplus) 320,633,445 167,547,086 137,827,308 166,536,789 209,161,647Accumulated undistributed/(distributions in excess
of) net investment income 377,912 408,561 (3,496) 465,816 347,087Accumulated net realized gain/(loss) from
investment transactions (4,413,771) 14,591,430 (8,956,193) (3,124,709) 13,980,490Unrealized appreciation from investments 68,333,406 43,510,214 14,664,734 1,310,066 50,534,436
Net Assets $384,930,992 $226,057,291 $143,532,353 $165,187,962 $274,023,660
Individual ClassNet Assets $ 48,338,226 $ 74,724,786 $ 20,265,809 $ 11,352,869 $ 62,324,748Shares authorized 7,500,000 12,499,900 7,500,000 7,500,000 7,500,000Shares issued and outstanding ($0.001 par value) 1,203,207 4,533,168 897,660 461,363 1,841,113Net asset value, offering and redemption price
per share $ 40.17 $ 16.48 $ 22.58 $ 24.61 $ 33.85
Institutional ClassNet Assets $336,592,766 $151,332,505 $123,266,544 $153,835,093 $211,698,912Shares authorized 37,500,000 12,500,000 37,500,000 37,500,000 37,500,000Shares issued and outstanding ($0.001 par value) 8,417,900 9,058,007 5,443,955 6,280,561 6,239,790Net asset value, offering and redemption price
per share $ 39.99 $ 16.71 $ 22.64 $ 24.49 $ 33.93
See notes to financial statements.40

STEWARD FUNDSSTATEMENTS OF OPERATIONS — For the Six Months Ended October 31, 2017 (Unaudited)
StewardLarge CapEnhanced
Index Fund
StewardSmall-Mid
CapEnhanced
Index Fund
StewardInternational
EnhancedIndex Fund
StewardSelect Bond
Fund
StewardGlobalEquity
Income FundInvestment Income:
Interest $ — $ — $ — $2,048,339 $ —Dividend (net of foreign withholding tax of
$50, $578, $106,586, $0 and $111,650,respectively) 3,625,626 1,649,936 2,434,810 26,337 4,058,256Total investment income 3,625,626 1,649,936 2,434,810 2,074,676 4,058,256
Expenses:Investment advisory fees 283,424 157,472 210,523 203,220 389,232Consulting service fees 112,670 62,588 41,840 48,473 77,368Compliance service fees 40,815 22,675 15,158 17,559 28,027Compliance officer fees 8,246 5,366 3,278 3,866 6,064Administration fees 94,124 52,290 34,955 40,494 64,633Distribution fees − Individual Class 59,409 87,385 24,282 13,863 76,113Administrative services fees − Individual Class 23,763 34,953 9,713 5,545 30,445Administrative services fees − Institutional Class 110,673 25,210 18,743 32,570 92,346Fund accounting fees 113,970 74,155 43,040 56,272 75,494Transfer agent fees 33,288 37,234 12,036 14,362 25,139Custodian fees 20,043 13,009 8,060 9,235 14,528Directors fees 43,108 27,690 17,049 20,426 31,088Professional fees 43,104 28,751 17,731 20,272 30,305Printing fees 21,561 17,651 7,967 9,056 9,847Class action settlement fees 25,358 6,475 409 — —Miscellaneous fees 38,036 41,919 36,168 37,119 47,715
Total expenses 1,071,592 694,823 500,952 532,332 998,344Net investment income 2,554,034 955,113 1,933,858 1,542,344 3,059,912
Realized and unrealized gain/(loss) frominvestment transactions:Net realized gains from investment transactions
and foreign currency translations 3,787,629 2,761,933 1,490,517 22,929 12,846,560Change in unrealized appreciation on
investment transactions and foreign currencytranslations 27,677,233 10,957,582 12,576,222 170,903 10,183,333
Net realized and unrealized gains frominvestment transactions and foreign currencytranslations 31,464,862 13,719,515 14,066,739 193,832 23,029,893
Change in net assets resulting from operations $34,018,896 $14,674,628 $16,000,597 $1,736,176 $26,089,805
See notes to financial statements.41

STEWARD FUNDSSTATEMENTS OF CHANGES IN NET ASSETS
STEWARD LARGE CAP ENHANCED INDEX FUND
For theSix Months
EndedOctober 31,
2017
For theYear Ended
April 30,2017
(Unaudited)Change in net assets from operations:
Net investment income $ 2,554,034 $ 4,499,853Net realized gains from investment transactions 3,787,629 3,639,881Net change in unrealized appreciation on investments 27,677,233 41,868,689
Change in net assets resulting from operations 34,018,896 50,008,423
Distributions to shareholders from:Net investment income:
Individual Class (222,702) (577,869)Institutional Class (1,982,908) (3,780,550)
Change in net assets from shareholder distributions (2,205,610) (4,358,419)
Capital Transactions:Individual Class
Proceeds from shares issued $ 4,761,070 $ 18,316,505Dividends reinvested 212,816 558,836Cost of shares redeemed (7,726,917) (31,241,562)
Change in Individual Class from capital transactions (2,753,031) (12,366,221)
Institutional ClassProceeds from shares issued 25,228,629 69,192,513Dividends reinvested 1,939,032 3,703,760Cost of shares redeemed (37,579,242) (45,350,877)
Change in Institutional Class from capital transactions (10,411,581) 27,545,396Change in net assets from capital transactions $ (13,164,612) $ 15,179,175
Change in net assets 18,648,674 60,829,179
Net Assets:Beginning of period 366,282,318 305,453,139End of period $384,930,992 $366,282,318
Accumulated undistributed net investment income $ 377,912 $ 29,488
Share Transactions:Individual Class
Issued 125,021 540,347Reinvested 5,542 15,967Redeemed (202,766) (898,149)
Change in Individual Class (72,203) (341,835)
Institutional ClassIssued 663,948 2,007,412Reinvested 50,815 106,585Redeemed (991,048) (1,318,934)
Change in Institutional Class (276,285) 795,063
See notes to financial statements.42

STEWARD FUNDSSTATEMENTS OF CHANGES IN NET ASSETS
STEWARD SMALL-MID CAP ENHANCED INDEX FUND
For theSix Months
EndedOctober 31,
2017
For theYear Ended
April 30,2017
(Unaudited)Change in net assets from operations:
Net investment income $ 955,113 $ 1,099,488Net realized gains from investment transactions 2,761,933 13,717,563Net change in unrealized appreciation on investments 10,957,582 18,757,152
Change in net assets resulting from operations 14,674,628 33,574,203
Distributions to shareholders from:Net investment income:
Individual Class (112,483) (308,528)Institutional Class (434,069) (847,768)
Net realized gains:Individual Class — (1,943,712)Institutional Class — (3,396,019)
Change in net assets from shareholder distributions (546,552) (6,496,027)
Capital Transactions:Individual Class
Proceeds from shares issued $ 9,764,737 $ 14,007,189Dividends reinvested 107,844 2,135,172Cost of shares redeemed (8,787,330) (12,082,225)
Change in Individual Class from capital transactions 1,085,251 4,060,136
Institutional ClassProceeds from shares issued 18,834,998 27,875,689Dividends reinvested 409,372 4,028,033Cost of shares redeemed (8,117,887) (20,366,387)
Change in Institutional Class from capital transactions 11,126,483 11,537,335Change in net assets from capital transactions $ 12,211,734 $ 15,597,471
Change in net assets 26,339,810 42,675,647
Net Assets:Beginning of period 199,717,481 157,041,834End of period $226,057,291 $199,717,481
Accumulated undistributed net investment income $ 408,561 $ —
Share Transactions:Individual Class
Issued 628,139 966,187Reinvested 6,910 141,811Redeemed (570,583) (820,623)
Change in Individual Class 64,466 287,375
Institutional ClassIssued 1,192,281 1,886,665Reinvested 25,914 264,942Redeemed (513,317) (1,363,827)
Change in Institutional Class 704,878 787,780
See notes to financial statements.43

STEWARD FUNDSSTATEMENTS OF CHANGES IN NET ASSETS
STEWARD INTERNATIONAL ENHANCED INDEX FUND
For theSix Months
EndedOctober 31,
2017
For theYear Ended
April 30,2017
(Unaudited)Change in net assets from operations:
Net investment income $ 1,933,858 $ 2,650,694Net realized gains/(losses) from investment transactions 1,490,517 (422,661)Net change in unrealized appreciation on investments 12,576,222 11,766,193
Change in net assets resulting from operations 16,000,597 13,994,226
Distributions to shareholders from:Net investment income:
Individual Class (278,721) (320,253)Institutional Class (1,918,707) (2,341,926)
Change in net assets from shareholder distributions (2,197,428) (2,662,179)
Capital Transactions:Individual Class
Proceeds from shares issued $ 2,252,991 $ 3,546,543Dividends reinvested 270,746 314,856Cost of shares redeemed (2,076,567) (3,760,949)
Change in Individual Class from capital transactions 447,170 100,450
Institutional ClassProceeds from shares issued 7,513,333 17,478,991Dividends reinvested 1,865,461 2,307,212Cost of shares redeemed (12,598,991) (19,174,931)
Change in Institutional Class from capital transactions (3,220,197) 611,272Change in net assets from capital transactions $ (2,773,027) $ 711,722
Change in net assets 11,030,142 12,043,769
Net Assets:Beginning of period 132,502,211 120,458,442End of period $143,532,353 $132,502,211
Accumulated undistributed/(distributions in excess of) net investment income $ (3,496) $ 260,074
Share Transactions:Individual Class
Issued 104,497 183,011Reinvested 12,669 17,109Redeemed (95,950) (195,809)
Change in Individual Class 21,216 4,311
Institutional ClassIssued 349,585 896,296Reinvested 86,995 124,658Redeemed (579,945) (1,004,074)
Change in Institutional Class (143,365) 16,880
See notes to financial statements.44

STEWARD FUNDSSTATEMENTS OF CHANGES IN NET ASSETS
STEWARD SELECT BOND FUND
For theSix Months
EndedOctober 31,
2017
For theYear Ended
April 30,2017
(Unaudited)Change in net assets from operations:
Net investment income $ 1,542,344 $ 3,099,891Net realized gains/(losses) from investment transactions 22,929 (592,204)Net change in unrealized appreciation/(depreciation) on investments 170,903 (1,769,554)
Change in net assets resulting from operations 1,736,176 738,133
Distributions to shareholders from:Net investment income:
Individual Class (93,358) (202,334)Institutional Class (1,492,137) (2,963,399)
Change in net assets from shareholder distributions (1,585,495) (3,165,733)
Capital Transactions:Individual Class
Proceeds from shares issued $ 1,133,482 $ 1,166,006Dividends reinvested 92,805 201,988Cost of shares redeemed (544,898) (2,236,810)
Change in Individual Class from capital transactions 681,389 (868,816)
Institutional ClassProceeds from shares issued 9,824,568 20,189,593Dividends reinvested 1,491,949 2,963,204Cost of shares redeemed (5,577,386) (11,461,977)
Change in Institutional Class from capital transactions 5,739,131 11,690,820Change in net assets from capital transactions $ 6,420,520 $ 10,822,004
Change in net assets 6,571,201 8,394,404
Net Assets:Beginning of period 158,616,761 150,222,357End of period $165,187,962 $158,616,761
Accumulated undistributed net investment income $ 465,816 $ 508,967
Share Transactions:Individual Class
Issued 45,934 47,145Reinvested 3,766 8,198Redeemed (22,097) (90,596)
Change in Individual Class 27,603 (35,253)
Institutional ClassIssued 400,645 823,320Reinvested 60,857 120,919Redeemed (227,189) (466,506)
Change in Institutional Class 234,313 477,733
See notes to financial statements.45

STEWARD FUNDSSTATEMENTS OF CHANGES IN NET ASSETS
STEWARD GLOBAL EQUITY INCOME FUND
For theSix Months
EndedOctober 31,
2017
For theYear Ended
April 30,2017
(Unaudited)Change in net assets from operations:
Net investment income $ 3,059,912 $ 4,202,849Net realized gains from investment transactions 12,846,560 4,280,186Net change in unrealized appreciation on investments 10,183,333 22,253,083
Change in net assets resulting from operations 26,089,805 30,736,118
Distributions to shareholders from:Net investment income:
Individual Class (697,539) (964,271)Institutional Class (2,492,227) (3,279,800)
Net realized gains:Individual Class — (2,423,090)Institutional Class — (7,006,702)
Change in net assets from shareholder distributions (3,189,766) (13,673,863)
Capital Transactions:Individual Class
Proceeds from shares issued $ 10,504,132 $ 39,201,645Dividends reinvested 687,024 3,369,654Cost of shares redeemed (15,079,015) (26,128,008)
Change in Individual Class from capital transactions (3,887,859) 16,443,291
Institutional ClassProceeds from shares issued 37,318,306 58,061,813Dividends reinvested 2,484,034 10,281,420Cost of shares redeemed (27,371,958) (33,601,751)
Change in Institutional Class from capital transactions 12,430,382 34,741,482Change in net assets from capital transactions $ 8,542,523 $ 51,184,773
Change in net assets 31,442,562 68,247,028
Net Assets:Beginning of period 242,581,098 174,334,070End of period $274,023,660 $242,581,098
Accumulated undistributed net investment income $ 347,087 $ 476,941
Share Transactions:Individual Class
Issued 326,380 1,319,810Reinvested 21,327 114,947Redeemed (470,273) (872,833)
Change in Individual Class (122,566) 561,924
Institutional ClassIssued 1,162,549 1,945,891Reinvested 76,911 349,991Redeemed (849,629) (1,106,347)
Change in Institutional Class 389,831 1,189,535
See notes to financial statements.46

(This page intentionally left blank.)

STEWARD FUNDSFINANCIAL HIGHLIGHTSThe following table sets forth the per share operating performance data for a share of capital stock outstanding, total return, ratios to averagenet assets and other supplemental data for the period indicated.
Investment Operations:
Net AssetValue,
Beginningof Period
NetInvestment
Income
Net Realizedand UnrealizedGains/(Losses)
from Investments
Total fromInvestmentOperations
Steward Large Cap Enhanced Index FundIndividual Class
Six Months ended October 31, 2017 (Unaudited) $36.89 $0.21 $ 3.25 $ 3.46Year ended April 30, 2017 32.25 0.39 4.63 5.02Year ended April 30, 2016 38.89 0.46 (1.31) (0.85)Year ended April 30, 2015 37.46 0.36 3.86 4.22Year ended April 30, 2014 32.87 0.34 7.29 7.63Year ended April 30, 2013 28.71 0.32 4.57 4.89
Institutional ClassSix Months ended October 31, 2017 (Unaudited) 36.72 0.27 3.23 3.50Year ended April 30, 2017 32.07 0.48 4.63 5.11Year ended April 30, 2016 38.70 0.62 (1.34) (0.72)Year ended April 30, 2015 37.30 0.47 3.86 4.33Year ended April 30, 2014 32.73 0.48 7.24 7.72Year ended April 30, 2013 28.58 0.42 4.56 4.98
Steward Small-Mid Cap Enhanced Index FundIndividual Class
Six Months ended October 31, 2017 (Unaudited) 15.44 0.06 1.01 1.07Year ended April 30, 2017 13.26 0.06 2.64 2.70Year ended April 30, 2016 15.33 0.08 (0.51) (0.43)Year ended April 30, 2015 16.04 0.08 1.41 1.49Year ended April 30, 2014 14.18 0.07 3.03 3.10Year ended April 30, 2013 13.15 0.08 1.94 2.02
Institutional ClassSix Months ended October 31, 2017 (Unaudited) 15.65 0.08 1.03 1.11Year ended April 30, 2017 13.43 0.11 2.67 2.78Year ended April 30, 2016 15.51 0.12 (0.52) (0.40)Year ended April 30, 2015 16.20 0.12 1.43 1.55Year ended April 30, 2014 14.30 0.11 3.07 3.18Year ended April 30, 2013 13.25 0.11 1.95 2.06
Steward International Enhanced Index FundIndividual Class
Six Months ended October 31, 2017 (Unaudited) 20.45 0.27 2.18 2.45Year ended April 30, 2017 18.65 0.36 1.81 2.17Year ended April 30, 2016 22.22 0.40(d) (3.27) (2.87)Year ended April 30, 2015 23.06 0.41 (0.71) (0.30)Year ended April 30, 2014 21.96 0.67 0.96 1.63Year ended April 30, 2013 20.85 0.46 1.09 1.55
Institutional ClassSix Months ended October 31, 2017 (Unaudited) 20.51 0.31 2.17 2.48Year ended April 30, 2017 18.70 0.43 1.81 2.24Year ended April 30, 2016 22.28 0.57(d) (3.38) (2.81)Year ended April 30, 2015 23.11 0.44 (0.65) (0.21)Year ended April 30, 2014 22.01 0.74 0.97 1.71Year ended April 30, 2013 20.89 0.53 1.10 1.63
Steward Select Bond FundIndividual Class
Six Months ended October 31, 2017 (Unaudited) 24.58 0.20 0.04 0.24Year ended April 30, 2017 24.99 0.43 (0.40) 0.03Year ended April 30, 2016 24.97 0.46 — 0.46Year ended April 30, 2015 24.72 0.46 0.25 0.71Year ended April 30, 2014 25.62 0.43 (0.85) (0.42)Year ended April 30, 2013 25.47 0.50 0.26 0.76
Institutional ClassSix Months ended October 31, 2017 (Unaudited) 24.47 0.24 0.03 0.27Year ended April 30, 2017 24.87 0.51 (0.39) 0.12Year ended April 30, 2016 24.85 0.53 0.01 0.54Year ended April 30, 2015 24.61 0.54 0.25 0.79Year ended April 30, 2014 25.49 0.53 (0.85) (0.32)Year ended April 30, 2013 25.34 0.59 0.26 0.85
Steward Global Equity Income FundIndividual Class
Six Months ended October 31, 2017 (Unaudited) 31.00 0.35 2.87 3.22Year ended April 30, 2017 28.72 0.51 3.72 4.23Year ended April 30, 2016 30.11 0.60 0.18 0.78Year ended April 30, 2015 29.82 0.63 1.32 1.95Year ended April 30, 2014 27.24 0.65 2.60 3.25Year ended April 30, 2013 25.07 0.61 2.17 2.78
Institutional ClassSix Months ended October 31, 2017 (Unaudited) 31.06 0.39 2.89 3.28Year ended April 30, 2017 28.77 0.63 3.70 4.33Year ended April 30, 2016 30.16 0.71 0.16 0.87Year ended April 30, 2015 29.86 0.75 1.32 2.07Year ended April 30, 2014 27.27 0.77 2.58 3.35Year ended April 30, 2013 25.09 0.69 2.18 2.87
(a) Not annualized for periods less than one year.(b) Annualized for periods less than one year.(c) Portfolio turnover is calculated on the basis of the Fund, as a whole, without distinguishing between the classes of shares issued.(d) Calculated based on average shares outstanding.(e) Excludes the value of portfolio securities delivered as a result of a redemption in-kind.Amounts designated as ‘‘—’’ are $0 or have been rounded to $0.
See notes to financial statements.48
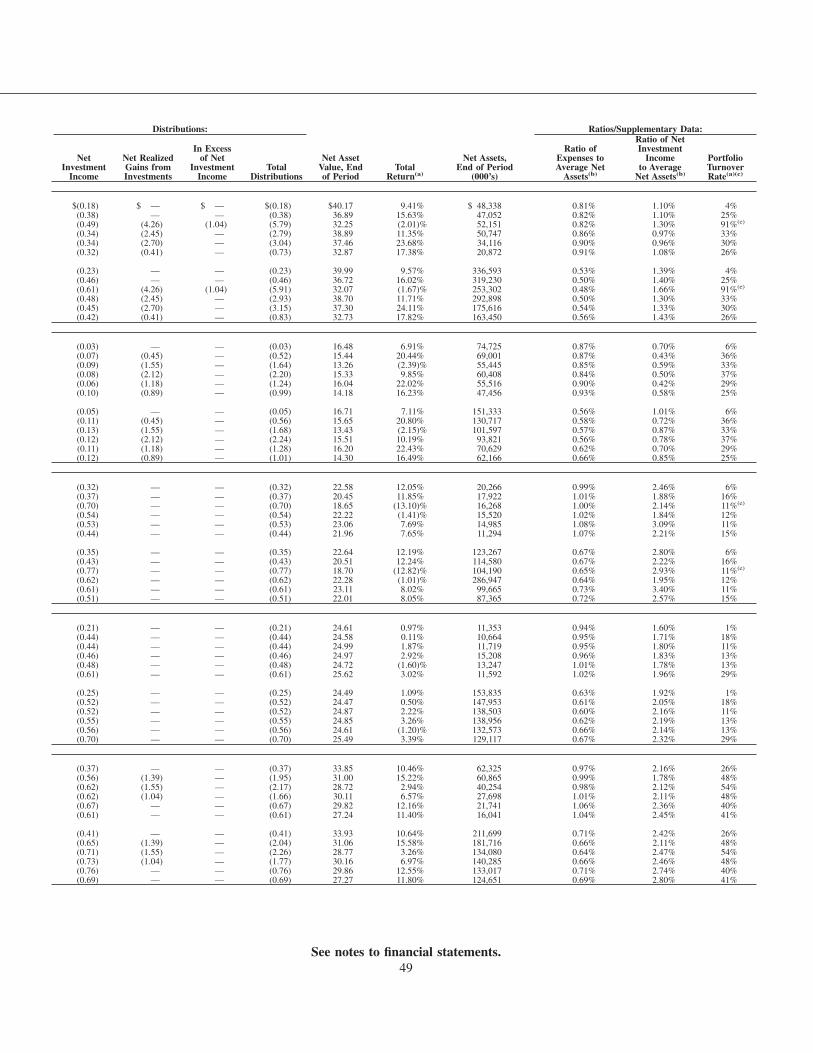
Distributions: Ratios/Supplementary Data:
NetInvestment
Income
Net RealizedGains fromInvestments
In Excessof Net
InvestmentIncome
TotalDistributions
Net AssetValue, Endof Period
TotalReturn(a)
Net Assets,End of Period
(000’s)
Ratio ofExpenses toAverage Net
Assets(b)
Ratio of NetInvestment
Incometo Average
Net Assets(b)
PortfolioTurnoverRate(a)(c)
$(0.18) $ — $ — $(0.18) $40.17 9.41% $ 48,338 0.81% 1.10% 4%(0.38) — — (0.38) 36.89 15.63% 47,052 0.82% 1.10% 25%(0.49) (4.26) (1.04) (5.79) 32.25 (2.01)% 52,151 0.82% 1.30% 91%(e)
(0.34) (2.45) — (2.79) 38.89 11.35% 50,747 0.86% 0.97% 33%(0.34) (2.70) — (3.04) 37.46 23.68% 34,116 0.90% 0.96% 30%(0.32) (0.41) — (0.73) 32.87 17.38% 20,872 0.91% 1.08% 26%
(0.23) — — (0.23) 39.99 9.57% 336,593 0.53% 1.39% 4%(0.46) — — (0.46) 36.72 16.02% 319,230 0.50% 1.40% 25%(0.61) (4.26) (1.04) (5.91) 32.07 (1.67)% 253,302 0.48% 1.66% 91%(e)
(0.48) (2.45) — (2.93) 38.70 11.71% 292,898 0.50% 1.30% 33%(0.45) (2.70) — (3.15) 37.30 24.11% 175,616 0.54% 1.33% 30%(0.42) (0.41) — (0.83) 32.73 17.82% 163,450 0.56% 1.43% 26%
(0.03) — — (0.03) 16.48 6.91% 74,725 0.87% 0.70% 6%(0.07) (0.45) — (0.52) 15.44 20.44% 69,001 0.87% 0.43% 36%(0.09) (1.55) — (1.64) 13.26 (2.39)% 55,445 0.85% 0.59% 33%(0.08) (2.12) — (2.20) 15.33 9.85% 60,408 0.84% 0.50% 37%(0.06) (1.18) — (1.24) 16.04 22.02% 55,516 0.90% 0.42% 29%(0.10) (0.89) — (0.99) 14.18 16.23% 47,456 0.93% 0.58% 25%
(0.05) — — (0.05) 16.71 7.11% 151,333 0.56% 1.01% 6%(0.11) (0.45) — (0.56) 15.65 20.80% 130,717 0.58% 0.72% 36%(0.13) (1.55) — (1.68) 13.43 (2.15)% 101,597 0.57% 0.87% 33%(0.12) (2.12) — (2.24) 15.51 10.19% 93,821 0.56% 0.78% 37%(0.11) (1.18) — (1.28) 16.20 22.43% 70,629 0.62% 0.70% 29%(0.12) (0.89) — (1.01) 14.30 16.49% 62,166 0.66% 0.85% 25%
(0.32) — — (0.32) 22.58 12.05% 20,266 0.99% 2.46% 6%(0.37) — — (0.37) 20.45 11.85% 17,922 1.01% 1.88% 16%(0.70) — — (0.70) 18.65 (13.10)% 16,268 1.00% 2.14% 11%(e)
(0.54) — — (0.54) 22.22 (1.41)% 15,520 1.02% 1.84% 12%(0.53) — — (0.53) 23.06 7.69% 14,985 1.08% 3.09% 11%(0.44) — — (0.44) 21.96 7.65% 11,294 1.07% 2.21% 15%
(0.35) — — (0.35) 22.64 12.19% 123,267 0.67% 2.80% 6%(0.43) — — (0.43) 20.51 12.24% 114,580 0.67% 2.22% 16%(0.77) — — (0.77) 18.70 (12.82)% 104,190 0.65% 2.93% 11%(e)
(0.62) — — (0.62) 22.28 (1.01)% 286,947 0.64% 1.95% 12%(0.61) — — (0.61) 23.11 8.02% 99,665 0.73% 3.40% 11%(0.51) — — (0.51) 22.01 8.05% 87,365 0.72% 2.57% 15%
(0.21) — — (0.21) 24.61 0.97% 11,353 0.94% 1.60% 1%(0.44) — — (0.44) 24.58 0.11% 10,664 0.95% 1.71% 18%(0.44) — — (0.44) 24.99 1.87% 11,719 0.95% 1.80% 11%(0.46) — — (0.46) 24.97 2.92% 15,208 0.96% 1.83% 13%(0.48) — — (0.48) 24.72 (1.60)% 13,247 1.01% 1.78% 13%(0.61) — — (0.61) 25.62 3.02% 11,592 1.02% 1.96% 29%
(0.25) — — (0.25) 24.49 1.09% 153,835 0.63% 1.92% 1%(0.52) — — (0.52) 24.47 0.50% 147,953 0.61% 2.05% 18%(0.52) — — (0.52) 24.87 2.22% 138,503 0.60% 2.16% 11%(0.55) — — (0.55) 24.85 3.26% 138,956 0.62% 2.19% 13%(0.56) — — (0.56) 24.61 (1.20)% 132,573 0.66% 2.14% 13%(0.70) — — (0.70) 25.49 3.39% 129,117 0.67% 2.32% 29%
(0.37) — — (0.37) 33.85 10.46% 62,325 0.97% 2.16% 26%(0.56) (1.39) — (1.95) 31.00 15.22% 60,865 0.99% 1.78% 48%(0.62) (1.55) — (2.17) 28.72 2.94% 40,254 0.98% 2.12% 54%(0.62) (1.04) — (1.66) 30.11 6.57% 27,698 1.01% 2.11% 48%(0.67) — — (0.67) 29.82 12.16% 21,741 1.06% 2.36% 40%(0.61) — — (0.61) 27.24 11.40% 16,041 1.04% 2.45% 41%
(0.41) — — (0.41) 33.93 10.64% 211,699 0.71% 2.42% 26%(0.65) (1.39) — (2.04) 31.06 15.58% 181,716 0.66% 2.11% 48%(0.71) (1.55) — (2.26) 28.77 3.26% 134,080 0.64% 2.47% 54%(0.73) (1.04) — (1.77) 30.16 6.97% 140,285 0.66% 2.46% 48%(0.76) — — (0.76) 29.86 12.55% 133,017 0.71% 2.74% 40%(0.69) — — (0.69) 27.27 11.80% 124,651 0.69% 2.80% 41%
See notes to financial statements.49

STEWARD FUNDSNOTES TO FINANCIAL STATEMENTS — October 31, 2017 (Unaudited)
Note 1 — Organization:
The Steward Funds, Inc. (the ‘‘Funds’’), a Maryland corporation, is registered under the Investment Company Act of 1940, asamended, (the ‘‘Act’’), as a diversified open-end management investment company and follows the investment companyaccounting and reporting guidance under Financial Accounting Standards Board (‘‘FASB’’) Accounting Standards Codification(‘‘ASC’’) Topic 946 ‘‘Financial Services — Investment Companies.’’ As of October 31, 2017, the Funds are composed of fiveseparate operational funds, each a series of the Funds. The accompanying financial statements are presented for the followingfive funds (individually a ‘‘Fund’’, collectively the ‘‘Funds’’) of the Funds:
Steward Large Cap Enhanced Index FundSteward Small-Mid Cap Enhanced Index FundSteward International Enhanced Index FundSteward Select Bond FundSteward Global Equity Income Fund
Each Fund currently offers two Classes of shares (‘‘Individual Class’’ and ‘‘Institutional Class’’). Each Class of shares has equalrights as to earnings, assets and voting privileges, except that the Individual Class bears expenses under a Service andDistribution Plan. Each Class of shares has exclusive voting rights with respect to matters that affect just that Class or on whichthe interests of the Class differ from the interests of the other Class. Income and realized and unrealized gains and losses oninvestments are allocated to each Class of shares based on its relative net assets.
Note 2 — Investment Objectives:
Steward Large Cap Enhanced Index Fund seeks to provide long-term capital appreciation. The Fund invests primarily incommon stocks of large capitalization companies that represent a broad spectrum of the United States economy and allocatesselectively between growth and value-type securities. As of October 31, 2017, stocks with market capitalizations between$3.6 billion and $753.7 billion are considered to be large capitalization stocks.
Steward Small-Mid Cap Enhanced Index Fund seeks to provide long-term capital appreciation. The Fund invests primarily incommon stocks of small and medium capitalization companies that represent a broad spectrum of the United States economyand allocates selectively between growth and value-type securities. As of October 31, 2017, stocks with market capitalizationsbetween $41 million and $14.3 billion are considered to be small to medium capitalization stocks.
Steward International Enhanced Index Fund seeks to provide long-term capital appreciation. The Fund invests primarily inAmerican Depository Receipts (‘‘ADRs’’) representing securities of companies located or domiciled outside of the United States,with selective allocation between equity securities of developed market companies and emerging market companies.
Steward Select Bond Fund seeks to provide high current income with capital appreciation. The Fund invests primarily in fixedincome investments such as corporate bonds, mortgage-backed securities and government and agency bonds and notes.
Steward Global Equity Income Fund seeks to provide current income along with growth of capital. The Fund invests primarilyin dividend-paying common stocks of large, medium and small capitalization companies that represent a broad spectrum of theglobal economy. The Fund’s non-U.S. investments will be primarily in the form of ADRs.
In pursuing their investment objectives, the Funds apply a comprehensive set of values based screens to all of their portfolioinvestments.
Note 3 — Significant Accounting Policies:
The preparation of financial statements in conformity with accounting principles generally accepted in the United States ofAmerica (‘‘GAAP’’) requires management to make estimates and assumptions that affect the reported amounts of assets andliabilities and disclosure of contingent assets and liabilities at the date of the financial statements and the reported amounts ofincome and expenses during the reporting period. Actual results could differ from those estimates. The following summarizes thesignificant accounting policies of the Funds.
Portfolio Valuation: Fund investments are recorded at fair value. In determining fair value, the Funds use various valuationapproaches. Portfolio securities listed on a domestic or foreign exchange are valued at the last sale price on the day of valuationor, if there was no sale that day, at the mean between the last reported bid and asked prices as of the close of trading. Equitysecurities traded on NASDAQ Stock Market, Inc. (‘‘NASDAQ’’) use the official closing price, if available, and otherwise, use
50
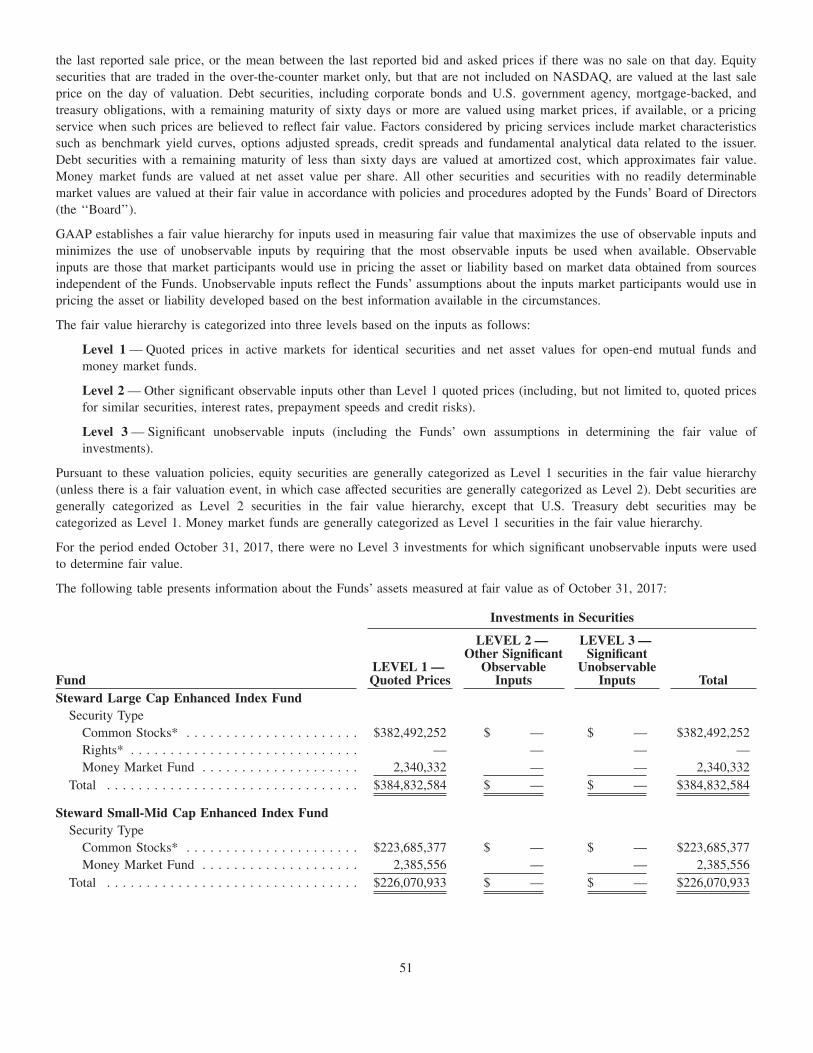
the last reported sale price, or the mean between the last reported bid and asked prices if there was no sale on that day. Equitysecurities that are traded in the over-the-counter market only, but that are not included on NASDAQ, are valued at the last saleprice on the day of valuation. Debt securities, including corporate bonds and U.S. government agency, mortgage-backed, andtreasury obligations, with a remaining maturity of sixty days or more are valued using market prices, if available, or a pricingservice when such prices are believed to reflect fair value. Factors considered by pricing services include market characteristicssuch as benchmark yield curves, options adjusted spreads, credit spreads and fundamental analytical data related to the issuer.Debt securities with a remaining maturity of less than sixty days are valued at amortized cost, which approximates fair value.Money market funds are valued at net asset value per share. All other securities and securities with no readily determinablemarket values are valued at their fair value in accordance with policies and procedures adopted by the Funds’ Board of Directors(the ‘‘Board’’).
GAAP establishes a fair value hierarchy for inputs used in measuring fair value that maximizes the use of observable inputs andminimizes the use of unobservable inputs by requiring that the most observable inputs be used when available. Observableinputs are those that market participants would use in pricing the asset or liability based on market data obtained from sourcesindependent of the Funds. Unobservable inputs reflect the Funds’ assumptions about the inputs market participants would use inpricing the asset or liability developed based on the best information available in the circumstances.
The fair value hierarchy is categorized into three levels based on the inputs as follows:
Level 1 — Quoted prices in active markets for identical securities and net asset values for open-end mutual funds andmoney market funds.
Level 2 — Other significant observable inputs other than Level 1 quoted prices (including, but not limited to, quoted pricesfor similar securities, interest rates, prepayment speeds and credit risks).
Level 3 — Significant unobservable inputs (including the Funds’ own assumptions in determining the fair value ofinvestments).
Pursuant to these valuation policies, equity securities are generally categorized as Level 1 securities in the fair value hierarchy(unless there is a fair valuation event, in which case affected securities are generally categorized as Level 2). Debt securities aregenerally categorized as Level 2 securities in the fair value hierarchy, except that U.S. Treasury debt securities may becategorized as Level 1. Money market funds are generally categorized as Level 1 securities in the fair value hierarchy.
For the period ended October 31, 2017, there were no Level 3 investments for which significant unobservable inputs were usedto determine fair value.
The following table presents information about the Funds’ assets measured at fair value as of October 31, 2017:
Investments in Securities
FundLEVEL 1 —Quoted Prices
LEVEL 2 —Other Significant
ObservableInputs
LEVEL 3 —Significant
UnobservableInputs Total
Steward Large Cap Enhanced Index FundSecurity Type
Common Stocks* . . . . . . . . . . . . . . . . . . . . . . $382,492,252 $ — $ — $382,492,252Rights* . . . . . . . . . . . . . . . . . . . . . . . . . . . . . — — — —Money Market Fund . . . . . . . . . . . . . . . . . . . . 2,340,332 — — 2,340,332
Total . . . . . . . . . . . . . . . . . . . . . . . . . . . . . . . . $384,832,584 $ — $ — $384,832,584
Steward Small-Mid Cap Enhanced Index FundSecurity Type
Common Stocks* . . . . . . . . . . . . . . . . . . . . . . $223,685,377 $ — $ — $223,685,377Money Market Fund . . . . . . . . . . . . . . . . . . . . 2,385,556 — — 2,385,556
Total . . . . . . . . . . . . . . . . . . . . . . . . . . . . . . . . $226,070,933 $ — $ — $226,070,933
51

Investments in Securities
FundLEVEL 1 —Quoted Prices
LEVEL 2 —Other Significant
ObservableInputs
LEVEL 3 —Significant
UnobservableInputs Total
Steward International Enhanced Index FundSecurity Type
Common Stocks* . . . . . . . . . . . . . . . . . . . . . . $142,743,018 $ — $ — $142,743,018Money Market Fund . . . . . . . . . . . . . . . . . . . . 680,381 — — 680,381
Total . . . . . . . . . . . . . . . . . . . . . . . . . . . . . . . . $143,423,399 $ — $ — $143,423,399
Steward Select Bond FundSecurity Type
Corporate Bonds* . . . . . . . . . . . . . . . . . . . . . . $ — $104,097,009 $ — $104,097,009Municipal Bonds . . . . . . . . . . . . . . . . . . . . . . — 1,703,906 — 1,703,906U.S. Government Agencies . . . . . . . . . . . . . . . . — 16,615,100 — 16,615,100U.S. Government Agency Mortgage-Backed
Obligations . . . . . . . . . . . . . . . . . . . . . . . . . — 5,005,756 — 5,005,756U.S. Treasury Obligations . . . . . . . . . . . . . . . . 27,200,111 1,002,673 — 28,202,784Preferred Stocks* . . . . . . . . . . . . . . . . . . . . . . 2,361,900 — — 2,361,900Money Market Fund . . . . . . . . . . . . . . . . . . . . 5,750,507 — — 5,750,507
Total . . . . . . . . . . . . . . . . . . . . . . . . . . . . . . . . $ 35,312,518 $128,424,444 $ — $163,736,962
Steward Global Equity Income FundSecurity Type
Common Stocks* . . . . . . . . . . . . . . . . . . . . . . $273,117,659 $ — $ — $273,117,659Money Market Fund . . . . . . . . . . . . . . . . . . . . 698,130 — — 698,130
Total . . . . . . . . . . . . . . . . . . . . . . . . . . . . . . . . $273,815,789 $ — $ — $273,815,789
* Please refer to the Schedule of Portfolio Investments to view common stocks, corporate bonds, preferred stocks, and rights segregated by industry type.
The Funds recognize transfers between fair value hierarchy levels at the reporting period end. There were no transfers betweenlevels as of October 31, 2017, from those used on April 30, 2017.
Securities Transactions and Investment Income: Portfolio security transactions are recorded on trade date. Net realized gainsor losses on sales of securities are determined by the identified cost method. Interest income, adjusted for accretion of discountsand amortization of premiums, is recorded on the accrual basis. Debt obligations may be placed in non-accrual status and relatedinterest income may be reduced by ceasing current accruals and writing off interest receivables when the collection of all or aportion of interest has become doubtful as identified by the Adviser as part of the valuation process. The treatment of suchinterest income may be different for federal income tax purposes. Dividend income is recorded on the ex-dividend date, or assoon as practical after a Fund determines the existence of a dividend declaration after exercising reasonable due diligence.Income and capital gains on some foreign securities may be subject to foreign withholdings taxes, which are accrued asapplicable, and have been provided for in accordance with the Funds’ understanding of the applicable country’s tax rules andregulations.
Dividends and Distributions to Shareholders: Dividends from net investment income, if any, of all Funds are declared andpaid quarterly. For all Funds, all net realized long-term or short-term capital gains, if any, will be declared and distributed atleast annually.
Income dividends and capital gains distributions are recorded on the ex-dividend date and are determined in accordance withincome tax regulations, which may differ from GAAP. These differences are primarily due to differing treatments of income,gains and losses on various investment securities held by the Funds, timing differences in the recognition of income, gains andlosses and differing characterizations of distributions made by the Funds. Distributions which exceed net investment income andnet realized capital gains for financial reporting purposes but not for tax purposes are reported as distributions in excess of net
52

investment income or net realized gains. To the extent they exceed net investment income and net realized capital gains for taxpurposes, they are reported as distribution of capital.
Federal Income Taxes: The Funds intend to qualify as regulated investment companies under Sub-Chapter M of the InternalRevenue Code and accordingly, will generally not be subject to federal and state income taxes or federal excise taxes to theextent that they intend to make sufficient distributions of net investment income and net realized capital gains.
As of and during the period ended October 31, 2017, the Funds did not have a liability for any unrecognized tax benefits. TheFunds recognize interest and penalties, if any, related to unrecognized tax benefits as income tax expense in the Statements ofOperations. During the period, the Funds did not incur any interest or penalties. For all open tax-years, management of theFunds has concluded that there are no significant uncertain tax positions that would require recognition in the financialstatements. Further, management of the Funds is not aware of any tax positions for which it is reasonably possible that the totalamounts of any unrecognized tax benefits will significantly change over the next fiscal year.
Allocation of Expenses: Expenses directly attributable to a Fund or Class are charged directly to that Fund or Class, whileexpenses that are attributable to more than one Fund or Class are allocated among the respective Funds and their Classes basedupon relative net assets or some other reasonable method as determined by the Board.
Foreign Securities: Investments in securities of issuers in foreign countries involves risks not associated with domesticinvestments. These risks include, but are not limited to: (1) political and financial instability; (2) currency exchange ratefluctuations; (3) greater price volatility and less liquidity in particular securities and in certain foreign markets; (4) lack ofuniform accounting, auditing and financial reporting standards; (5) less government regulation and supervision of some foreignstock exchanges, brokers and listed companies; (6) delays in transaction settlement in certain foreign markets; and (7) lessavailability of information. Securities of issuers in emerging and developing countries raise additional risks relative toinvestments in developed country issuers, including exposure to less mature and diversified economies and to less stable marketand political systems, as well as to possible currency transfer restrictions, delays and disruptions in settlement of transactions,and higher volatility than found in developed countries.
Affiliated Securities Transactions: Pursuant to Rule 17a-7 under the 1940 Act, the Funds may engage in securitiestransactions with affiliated investment companies and advisory accounts managed by Crossmark Global Investments, Inc.(formerly, Capstone Asset Management Company) (‘‘CGI’’ or the ‘‘Adviser’’). Any such purchase or sale transaction must beeffected without a brokerage commission or other remuneration, except for customary transfer fees. The transaction must beeffected at the current market price, which is either the security’s last sale price on an exchange or, if there are no transactions inthe security that day, at the average of the highest bid and lowest asked price. During the period ended October 31, 2017, theFunds did not engage in any Rule 17a-7 transactions under the 1940 Act.
Recent Accounting Pronouncements: In March 2017, FASB issued Accounting Standards Update No. 2017-08 ‘‘PremiumAmortization on Purchased Callable Debt Securities’’ (‘‘ASU 2017-08’’), which shortens the premium amortization period forpurchased non-contingently callable debt securities. ASU 2017-08 specifies that the premium amortization period ends at theearliest call date, for purchased non-contingently callable debt securities. ASU 2017-08 is effective for fiscal years, and interimperiods within those fiscal years, beginning after December 15, 2018. Management is currently evaluating the implications ofASU 2017-08 and its impact on the financial statements and related disclosures has not yet been determined.
Note 4 — Investment Advisory and Other Agreements:
CGI, a wholly-owned subsidiary of Crossmark Global Holdings, Inc. (formerly, Capstone Financial Services, Inc.) (‘‘CGH’’),serves as investment adviser to the Funds. CGI provides investment advisory services to one other investment company, pensionand profit sharing accounts, corporations and individuals. Subject to the authority of the Board, the Adviser provides the Fundswith continuous investment advisory services in accordance with an investment advisory agreement (the ‘‘Advisory Agreement’’)between the Adviser and the Funds. CGI receives compensation for its services as investment adviser. The fee is accrued dailyand paid monthly based on each Fund’s average daily net assets. Pursuant to the terms of the investment advisory agreement,CGI has full discretion to manage the assets of the Funds in accordance with its investment objectives.
As compensation for its services as investment adviser, the Funds pay CGI, on a monthly basis, an investment advisory feecalculated daily, based on the average daily net assets of the Funds, at the following annual rates:
Steward Large Cap Enhanced Index Fund
— 0.15% on the first $500 million;
— 0.125% on the next $500 million; and
— 0.10% in excess of $1 billion
53

Steward Small-Mid Cap Enhanced Index Fund
— 0.15% on the first $500 million;
— 0.125% on the next $500 million; and
— 0.10% in excess of $1 billion
Steward International Enhanced Index Fund
— 0.30% on the first $500 million;
— 0.25% on the next $500 million; and
— 0.20% in excess of $1 billion
Steward Select Bond Fund
— 0.25% on the first $500 million;
— 0.20% on the next $500 million; and
— 0.175% in excess of $1 billion
Steward Global Equity Income Fund
— 0.30% on the first $500 million;
— 0.25% on the next $500 million; and
— 0.20% in excess of $1 billion
CCS, an affiliate of CGI and a wholly-owned subsidiary of CGH, serves as administrator for the Funds. For its services asadministrator, CCS receives a monthly fee from the Funds calculated at the annual rate of 0.075% on the first $500 million ofthe Funds’ aggregate average daily net assets. The rate declines to 0.03% of the Funds’ aggregate average daily net assets inexcess of $500 million.
CCS also serves as a consultant to the Funds with respect to socially responsible investment policies. CCS receives itsconsulting fee monthly, based on the annual average aggregate daily net assets of the Funds as follows:
First . . . . . . . . . . . . . . . . . . . . . . . . . . . . . . . . . . . . . . . . . . . . . . . . . . . . . . . $ 500,000,000 0.08%Next . . . . . . . . . . . . . . . . . . . . . . . . . . . . . . . . . . . . . . . . . . . . . . . . . . . . . . . $ 500,000,000 0.05%Over . . . . . . . . . . . . . . . . . . . . . . . . . . . . . . . . . . . . . . . . . . . . . . . . . . . . . . . $1,000,000,000 0.02%
CCS, pursuant to a Compliance Services Agreement, provides certain compliance services for the Funds and the Board. TheFunds pay CCS a monthly fee based on the annual average daily net assets of the Funds as follows for compliance services:
First . . . . . . . . . . . . . . . . . . . . . . . . . . . . . . . . . . . . . . . . . . . . . . . . . . . . . . . $ 500,000,000 0.025%Next . . . . . . . . . . . . . . . . . . . . . . . . . . . . . . . . . . . . . . . . . . . . . . . . . . . . . . . $ 500,000,000 0.020%Over . . . . . . . . . . . . . . . . . . . . . . . . . . . . . . . . . . . . . . . . . . . . . . . . . . . . . . . $1,000,000,000 0.015%
Pursuant to the Class Action and Fair Fund Services Agreement, effective January 12, 2012, CCS receives a fee of 3% of netamounts received by the Funds from a Class Action settlement and 6% of amounts received by the Funds from a Fair Fundsettlement, as defined in the agreement.
Cipperman Compliance Services, LLC (‘‘Cipperman’’) provides regulatory compliance supervisory services for the Fundspursuant to a Compliance Services Agreement. In accordance with this agreement, Cipperman also designates a member of itsstaff, who has been approved by the Board, to serve as the Chief Compliance Officer (‘‘CCO’’) for the Funds in accordance withapplicable law. Cipperman’s fee for ‘‘Base Services’’ described in the agreement is $5,000 per month. The expense will beallocated among the Funds based on their relative net asset values at the end of each calendar month, as determined andcomputed in accordance with the description of the method of determination of net asset value contained in the currentprospectus and statement of additional information for each Fund as in effect from time to time under the Securities Act of 1933.Additional fees may be charged for ‘‘additional services’’ or in the event any of the Funds were to engage an adviser orsub-adviser other than CGI. Such fees, if incurred, will be allocated to or among the Funds in a manner deemed fair andreasonable by the Board.
Crossmark Distributors, Inc. (formerly, Capstone Asset Planning Company) (‘‘CD’’) serves as the Distributor of the Funds’shares. CD is an affiliate of CGI, and both are wholly-owned subsidiaries of CGH.
54

Each of the Funds has adopted a Service and Distribution Plan (the ‘‘Plan’’) pursuant to Rule 12b-1 under the 1940 Act wherebythe assets of each Fund’s Individual Class shares are used to compensate CD for costs and expenses incurred in connection withthe distribution, marketing and servicing of each Fund’s Individual Class shareholders. Distribution and marketing expensesinclude, among other things, printing of prospectuses for prospective investors, advertising literature, and costs of personnelinvolved with the promotion and distribution of shares. Under the Plan, the Funds pay CD an amount computed monthly at anannual rate of 0.25% of each Fund’s Individual Class average daily net assets (including reinvested dividends paid with respectto those assets). Of this amount, CD may allocate to securities dealers, (which may include CD itself) and other financialinstitutions and organizations (collectively ‘‘Service Organizations’’) amounts based on the particular Fund’s average net assetsowned by stockholders for whom the Service Organizations have a servicing relationship.
The Administrative Services Plan provides that each Fund, out of assets attributable to its Individual Class and InstitutionalClass shares, shall compensate CD to cover the costs of payments to certain third-party shareholder service providers related tothe administration of group accounts in which the Fund’s shareholders participate. The amount of such payments may notexceed, on an annual basis, 0.10% of the average daily net assets of the Individual Class shares or Institutional Class shares,respectively, of each Fund. For Individual Class shares, this fee is in addition to fees payable under the Service and DistributionPlan. Institutional Class shares are not subject to the Service and Distribution Plan.
Certain officers and directors of the Funds are also officers and/or directors of CGI, CD and CCS.
Citi Fund Services Ohio, Inc. (‘‘Citi Ohio’’) serves as the Funds’ fund accountant. Under the terms of the Master ServiceAgreement, Citi Ohio will be paid annual class fees which shall apply to each additional class of shares of each Fund that hasmore than a single share class, and is entitled to receive a monthly fee from each Fund calculated at the annual rate of 0.07% onthe first $500 million of the Funds’ aggregate average daily net assets. The rate then declines to 0.06% on the next $150 millionof aggregate average daily net assets, and to 0.05% on the next $100 million of aggregate average daily assets, and to 0.04% onaggregate average daily net assets thereafter. Under a transfer agency agreement assigned from Citi Ohio, FIS Investor ServicesLLC serves as the Funds’ transfer agent and is paid annual class and per account fees. These fees are allocated among the Fundsbased on their relative daily net assets.
Note 5 — Purchases and Sales of Securities:
Purchases and sales of portfolio securities (excluding short-term securities and U.S. government securities) for the period endedOctober 31, 2017, were as follows:
Fund Purchases Sales
Steward Large Cap Enhanced Index Fund . . . . . . . . . . . . . . . . . . . . . . . . . . . . . . . . . . . $15,510,293 $26,451,618Steward Small-Mid Cap Enhanced Index Fund . . . . . . . . . . . . . . . . . . . . . . . . . . . . . . . . 25,073,485 11,929,397Steward International Enhanced Index Fund . . . . . . . . . . . . . . . . . . . . . . . . . . . . . . . . . . 8,182,980 10,607,748Steward Select Bond Fund . . . . . . . . . . . . . . . . . . . . . . . . . . . . . . . . . . . . . . . . . . . . . . 6,663,353 1,644,648Steward Global Equity Income Fund . . . . . . . . . . . . . . . . . . . . . . . . . . . . . . . . . . . . . . . 77,664,750 66,688,185
Purchases and sales of U.S. government securities for the period ended October 31, 2017, were as follows:
Fund Purchases Sales
Steward Select Bond Fund . . . . . . . . . . . . . . . . . . . . . . . . . . . . . . . . . . . . . . . . . . . . . . $1,990,681 $491,847
Note 6 — Federal Income Tax Information:
As of October 31, 2017, the cost, gross unrealized appreciation, gross unrealized depreciation and net unrealizedappreciation/(depreciation) on investments, for federal income tax purposes, were as follows:
FundTax Cost ofSecurities
UnrealizedAppreciation
UnrealizedDepreciation
NetUnrealized
Appreciation/Depreciation
Steward Large Cap Enhanced Index Fund . . . . . . . . . . . . . $322,066,342 $79,994,794 $(17,228,552) $62,766,242Steward Small-Mid Cap Enhanced Index Fund . . . . . . . . . . 182,967,437 56,473,598 (13,370,102) 43,103,496Steward International Enhanced Index Fund . . . . . . . . . . . . 130,094,854 23,107,563 (9,779,018) 13,328,545Steward Select Bond Fund. . . . . . . . . . . . . . . . . . . . . . . . 162,426,896 1,999,993 (689,927) 1,310,066Steward Global Equity Bond Fund . . . . . . . . . . . . . . . . . . 223,749,175 53,704,034 (3,637,420) 50,066,614
55

The differences between book-basis and tax-basis unrealized appreciation/(depreciation) are primarily attributable to tax deferralof losses on wash sales, adjustments to income on certain securities and other temporary differences.
The tax character of distributions paid during the fiscal year ended April 30, 2017, were as follows:
Distributions paid from
FundOrdinaryIncome
NetLong-Term
CapitalGains
TotalTaxable
Distributions
In Excessof Net
InvestmentIncome
TotalDistributions
PaidSteward Large Cap Enhanced Index Fund . . . . $4,358,419 $ — $ 4,358,419 $ — $ 4,358,419Steward Small-Mid Cap Enhanced Index Fund. . 1,156,296 5,339,731 6,496,027 — 6,496,027Steward International Enhanced Index Fund . . . 2,662,179 — 2,662,179 — 2,662,179Steward Select Bond Fund . . . . . . . . . . . . . . . 3,165,733 — 3,165,733 — 3,165,733Steward Global Equity Income Fund . . . . . . . . 4,244,071 9,429,792 13,673,863 — 13,673,863
As of April 30, 2017, the components of accumulated earnings/(deficit) on a tax basis were as follows:
Fund
UndistributedOrdinaryIncome
UndistributedLong-Term
Capital GainsAccumulated
Earnings
AccumulatedCapital and
Other Losses
UnrealizedAppreciation
(Depreciation)
TotalAccumulated
Earnings(Deficit)
Steward Large Cap EnhancedIndex Fund . . . . . . . . . . . $ 29,488 $ — $ 29,488 $(1,726,816) $34,181,589 $32,484,261
Steward Small-Mid CapEnhanced Index Fund . . . 2,444,888 9,808,059 12,252,947 — 32,129,182 44,382,129
Steward InternationalEnhanced Index Fund . . . 404,519 — 404,519 (9,286,548) 783,905 (8,098,124)
Steward Select Bond Fund . . 508,967 — 508,967 (3,147,638) 1,139,163 (1,499,508)Steward Global Equity
Income Fund . . . . . . . . . 687,765 1,336,891 2,024,656 — 39,937,318 41,961,974
As of the end of their tax year ended April 30, 2017, the following Funds have capital loss carry forwards (‘‘CLCFs’’) assummarized in the tables below. CLCFs subject to expiration are applied as short-term capital loss regardless of whether theoriginating capital loss was short term or long term. CLCFs that are not subject to expiration must be utilized before those thatare subject to expiration. The Board does not intend to authorize a distribution of any realized gain for the Funds until anyapplicable CLCF has been offset or expires.
CLCFs subject to expiration:
FundExpires
2017Expires
2018Expires
2019 Total
Steward Large Cap Enhanced Index Fund . . . . . . . . . . . . . . . . $ — $ — $ — $ —Steward Small-Mid Cap Enhanced Index Fund . . . . . . . . . . . . . — — — —Steward International Enhanced Index Fund . . . . . . . . . . . . . . . — 1,340,263 7,312,628 8,652,891Steward Select Bond Fund . . . . . . . . . . . . . . . . . . . . . . . . . . — 468,259 760,671 1,228,930Steward Global Equity Income Fund . . . . . . . . . . . . . . . . . . . — — — —
CLCFs not subject to expiration:
FundShort-Term
AmountLong-Term
Amount Total
Steward Large Cap Enhanced Index Fund . . . . . . . . . . . . . . . . . . . . . . . . . . $1,517,209 $209,607 $1,726,816Steward Small-Mid Cap Enhanced Index Fund . . . . . . . . . . . . . . . . . . . . . . . — — —Steward International Enhanced Index Fund . . . . . . . . . . . . . . . . . . . . . . . . . 490,580 133,487 624,067Steward Select Bond Fund . . . . . . . . . . . . . . . . . . . . . . . . . . . . . . . . . . . . . — 698,668 698,668Steward Global Equity Income Fund . . . . . . . . . . . . . . . . . . . . . . . . . . . . . . — — —
56
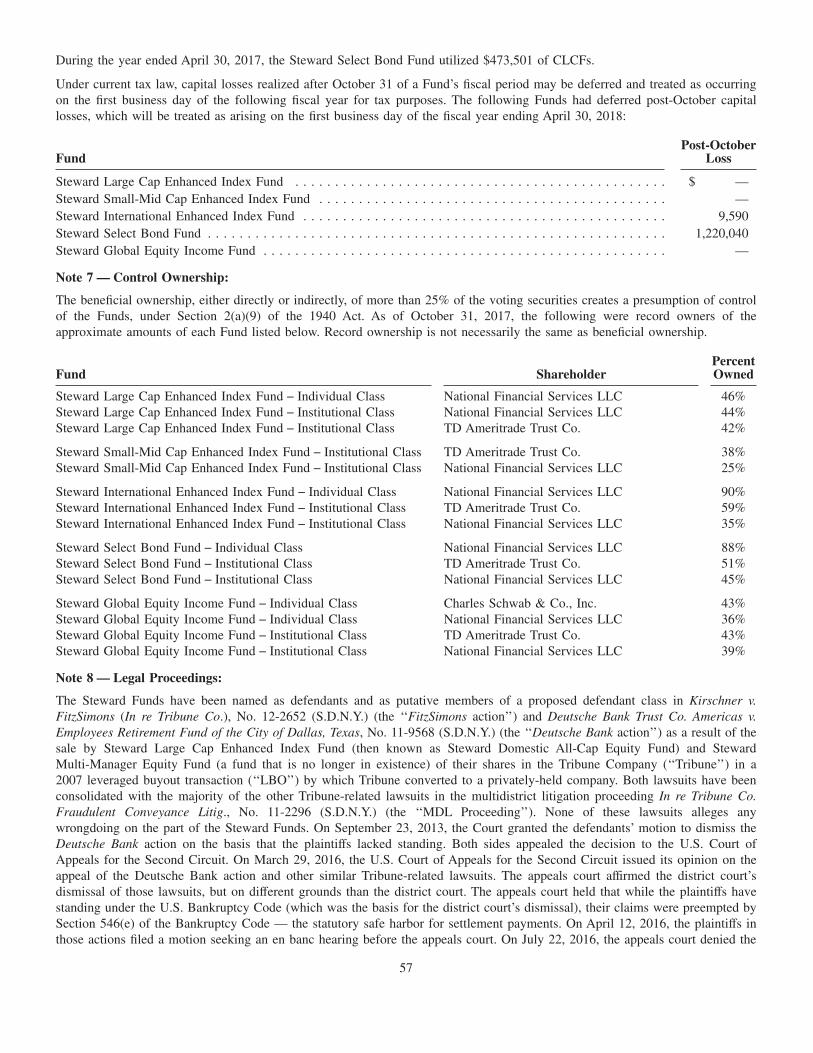
During the year ended April 30, 2017, the Steward Select Bond Fund utilized $473,501 of CLCFs.
Under current tax law, capital losses realized after October 31 of a Fund’s fiscal period may be deferred and treated as occurringon the first business day of the following fiscal year for tax purposes. The following Funds had deferred post-October capitallosses, which will be treated as arising on the first business day of the fiscal year ending April 30, 2018:
FundPost-October
Loss
Steward Large Cap Enhanced Index Fund . . . . . . . . . . . . . . . . . . . . . . . . . . . . . . . . . . . . . . . . . . . . . . . $ —Steward Small-Mid Cap Enhanced Index Fund . . . . . . . . . . . . . . . . . . . . . . . . . . . . . . . . . . . . . . . . . . . . —Steward International Enhanced Index Fund . . . . . . . . . . . . . . . . . . . . . . . . . . . . . . . . . . . . . . . . . . . . . . 9,590Steward Select Bond Fund . . . . . . . . . . . . . . . . . . . . . . . . . . . . . . . . . . . . . . . . . . . . . . . . . . . . . . . . . . 1,220,040Steward Global Equity Income Fund . . . . . . . . . . . . . . . . . . . . . . . . . . . . . . . . . . . . . . . . . . . . . . . . . . . —
Note 7 — Control Ownership:
The beneficial ownership, either directly or indirectly, of more than 25% of the voting securities creates a presumption of controlof the Funds, under Section 2(a)(9) of the 1940 Act. As of October 31, 2017, the following were record owners of theapproximate amounts of each Fund listed below. Record ownership is not necessarily the same as beneficial ownership.
Fund ShareholderPercentOwned
Steward Large Cap Enhanced Index Fund − Individual Class National Financial Services LLC 46%Steward Large Cap Enhanced Index Fund − Institutional Class National Financial Services LLC 44%Steward Large Cap Enhanced Index Fund − Institutional Class TD Ameritrade Trust Co. 42%
Steward Small-Mid Cap Enhanced Index Fund − Institutional Class TD Ameritrade Trust Co. 38%Steward Small-Mid Cap Enhanced Index Fund − Institutional Class National Financial Services LLC 25%
Steward International Enhanced Index Fund − Individual Class National Financial Services LLC 90%Steward International Enhanced Index Fund − Institutional Class TD Ameritrade Trust Co. 59%Steward International Enhanced Index Fund − Institutional Class National Financial Services LLC 35%
Steward Select Bond Fund − Individual Class National Financial Services LLC 88%Steward Select Bond Fund − Institutional Class TD Ameritrade Trust Co. 51%Steward Select Bond Fund − Institutional Class National Financial Services LLC 45%
Steward Global Equity Income Fund − Individual Class Charles Schwab & Co., Inc. 43%Steward Global Equity Income Fund − Individual Class National Financial Services LLC 36%Steward Global Equity Income Fund − Institutional Class TD Ameritrade Trust Co. 43%Steward Global Equity Income Fund − Institutional Class National Financial Services LLC 39%
Note 8 — Legal Proceedings:
The Steward Funds have been named as defendants and as putative members of a proposed defendant class in Kirschner v.FitzSimons (In re Tribune Co.), No. 12-2652 (S.D.N.Y.) (the ‘‘FitzSimons action’’) and Deutsche Bank Trust Co. Americas v.Employees Retirement Fund of the City of Dallas, Texas, No. 11-9568 (S.D.N.Y.) (the ‘‘Deutsche Bank action’’) as a result of thesale by Steward Large Cap Enhanced Index Fund (then known as Steward Domestic All-Cap Equity Fund) and StewardMulti-Manager Equity Fund (a fund that is no longer in existence) of their shares in the Tribune Company (‘‘Tribune’’) in a2007 leveraged buyout transaction (‘‘LBO’’) by which Tribune converted to a privately-held company. Both lawsuits have beenconsolidated with the majority of the other Tribune-related lawsuits in the multidistrict litigation proceeding In re Tribune Co.Fraudulent Conveyance Litig., No. 11-2296 (S.D.N.Y.) (the ‘‘MDL Proceeding’’). None of these lawsuits alleges anywrongdoing on the part of the Steward Funds. On September 23, 2013, the Court granted the defendants’ motion to dismiss theDeutsche Bank action on the basis that the plaintiffs lacked standing. Both sides appealed the decision to the U.S. Court ofAppeals for the Second Circuit. On March 29, 2016, the U.S. Court of Appeals for the Second Circuit issued its opinion on theappeal of the Deutsche Bank action and other similar Tribune-related lawsuits. The appeals court affirmed the district court’sdismissal of those lawsuits, but on different grounds than the district court. The appeals court held that while the plaintiffs havestanding under the U.S. Bankruptcy Code (which was the basis for the district court’s dismissal), their claims were preempted bySection 546(e) of the Bankruptcy Code — the statutory safe harbor for settlement payments. On April 12, 2016, the plaintiffs inthose actions filed a motion seeking an en banc hearing before the appeals court. On July 22, 2016, the appeals court denied the
57

petition. On September 9, 2016, the plaintiffs filed a petition for writ of certiorari in the U.S. Supreme Court challenging theSecond Circuit’s decision that the safe harbor of Section 546(e) applied to their claims. The shareholder defendants, includingthe Steward Funds, filed a joint brief in opposition to the petition for certiorari on October 24, 2016. The plaintiffs filed a replyin support of the petition on November 4, 2016. The Supreme Court has not yet granted or denied the petition for certiorari.
On May 23, 2014, the defendants filed motions to dismiss the Fifth Amended Complaint in the FitzSimons action, including aglobal motion to dismiss Count I, which is the claim brought against former Tribune shareholders for intentional fraudulentconveyance under U.S. federal law. On January 6, 2017, the United States District Court for the Southern District of New Yorkgranted the shareholder defendants’ motion to dismiss the intentional fraudulent conveyance claim in the FitzSimons action. Thecourt also denied plaintiff’s request to amend the complaint. The court concluded that the plaintiff failed to plead facts showingthat the Independent Directors of Tribune possessed actual intent to hinder, delay, or defraud Tribune’s creditors through theLBO. It also declined to impute the alleged fraudulent intent of certain officers to the corporation. While the District Court’sorder granting the motion to dismiss is not immediately appealable, the plaintiff has asked the Court to direct entry of a finaljudgment in order to make the order immediately appealable. On February 23, 2017, the Court issued an order stating that itintends to permit an interlocutory appeal of the dismissal order, but will wait to do so until it has resolved outstanding motionsto dismiss filed by other defendants.
On October 30, 2017, the Steward Funds entered into a Settlement Agreement related to these matters. A payment of $24,949.20was made to dismiss all claims against the Steward Funds associated with these matters. The Plaintiff’s Notice of VoluntaryDismissal was executed on November 6, 2017.
Note 9 — Investment Company Reporting Modernization:
In October 2016, the Securities and Exchange Commission (‘‘SEC’’) released its Final Rules on Investment Company ReportingModernization (the ‘‘Rules’’). The Rules introduce two new regulatory reporting forms for investment companies —Form N-PORT and Form N-CEN — and also contain amendments to Regulations S-X which require standardized, enhanceddisclosures about derivatives in investment company financial statements, as well as other amendments. The amendments toRegulation S-X became effective for filings made with the SEC after August 1, 2017. The Funds’ adoption of these amendments,effective with the financial statements prepared as of October 31, 2017, required additional disclosures reflected herein, but hadno effect on the Funds’ net assets or results of operations.
Note 10 — Subsequent Events:
Management has evaluated subsequent events through the date these financial statements were issued.
There were no other such events that require adjustment or disclosure for the period subsequent to October 31, 2017 through thedate of issuance of these financial statements.
58

General Information (Unaudited)
Proxy Voting Policy and Voting Records
A description of the policies and procedures that the Steward Funds use to determine how to vote proxies and informationregarding how each Fund voted proxies during the most recent 12 month-period ended June 30, is available without charge,(i) by calling 1-800-262-6631, or (ii) on the SEC’s website at http://www.sec.gov.
Availability of Quarterly Portfolio Schedule
The Steward Funds file a complete Schedule of Portfolio Investments with the SEC for the first and third quarters of each fiscalyear on Form N-Q no later than 60 days following the close of the quarter. Form N-Q is available without charge on the SEC’swebsite at http://www.sec.gov. The Steward Funds’ Form N-Q may be reviewed, or, for a fee, may be copied at the SEC’s PublicReference Room in Washington, D.C. Information about the operations of the Public Reference Room may be obtained bycalling 1-800-SEC-0330.
59
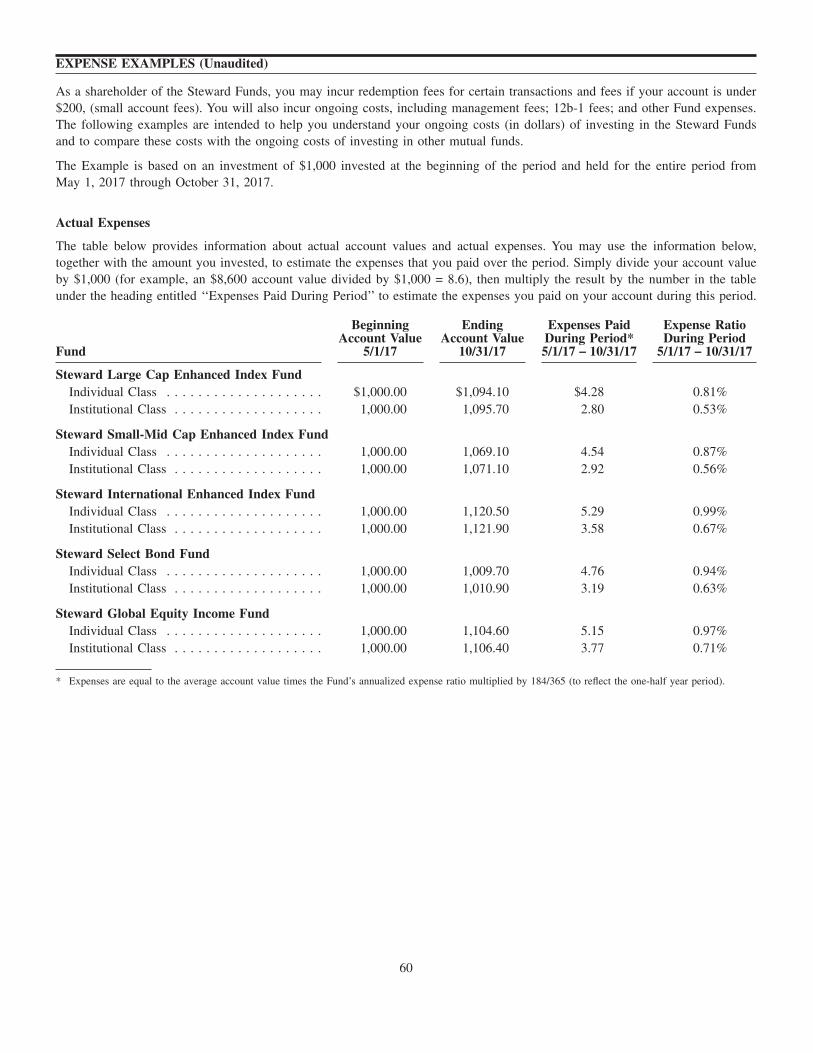
EXPENSE EXAMPLES (Unaudited)
As a shareholder of the Steward Funds, you may incur redemption fees for certain transactions and fees if your account is under$200, (small account fees). You will also incur ongoing costs, including management fees; 12b-1 fees; and other Fund expenses.The following examples are intended to help you understand your ongoing costs (in dollars) of investing in the Steward Fundsand to compare these costs with the ongoing costs of investing in other mutual funds.
The Example is based on an investment of $1,000 invested at the beginning of the period and held for the entire period fromMay 1, 2017 through October 31, 2017.
Actual Expenses
The table below provides information about actual account values and actual expenses. You may use the information below,together with the amount you invested, to estimate the expenses that you paid over the period. Simply divide your account valueby $1,000 (for example, an $8,600 account value divided by $1,000 = 8.6), then multiply the result by the number in the tableunder the heading entitled ‘‘Expenses Paid During Period’’ to estimate the expenses you paid on your account during this period.
Fund
BeginningAccount Value
5/1/17
EndingAccount Value
10/31/17
Expenses PaidDuring Period*5/1/17 − 10/31/17
Expense RatioDuring Period
5/1/17 − 10/31/17
Steward Large Cap Enhanced Index FundIndividual Class . . . . . . . . . . . . . . . . . . . . $1,000.00 $1,094.10 $4.28 0.81%Institutional Class . . . . . . . . . . . . . . . . . . . 1,000.00 1,095.70 2.80 0.53%
Steward Small-Mid Cap Enhanced Index FundIndividual Class . . . . . . . . . . . . . . . . . . . . 1,000.00 1,069.10 4.54 0.87%Institutional Class . . . . . . . . . . . . . . . . . . . 1,000.00 1,071.10 2.92 0.56%
Steward International Enhanced Index FundIndividual Class . . . . . . . . . . . . . . . . . . . . 1,000.00 1,120.50 5.29 0.99%Institutional Class . . . . . . . . . . . . . . . . . . . 1,000.00 1,121.90 3.58 0.67%
Steward Select Bond FundIndividual Class . . . . . . . . . . . . . . . . . . . . 1,000.00 1,009.70 4.76 0.94%Institutional Class . . . . . . . . . . . . . . . . . . . 1,000.00 1,010.90 3.19 0.63%
Steward Global Equity Income FundIndividual Class . . . . . . . . . . . . . . . . . . . . 1,000.00 1,104.60 5.15 0.97%Institutional Class . . . . . . . . . . . . . . . . . . . 1,000.00 1,106.40 3.77 0.71%
* Expenses are equal to the average account value times the Fund’s annualized expense ratio multiplied by 184/365 (to reflect the one-half year period).
60
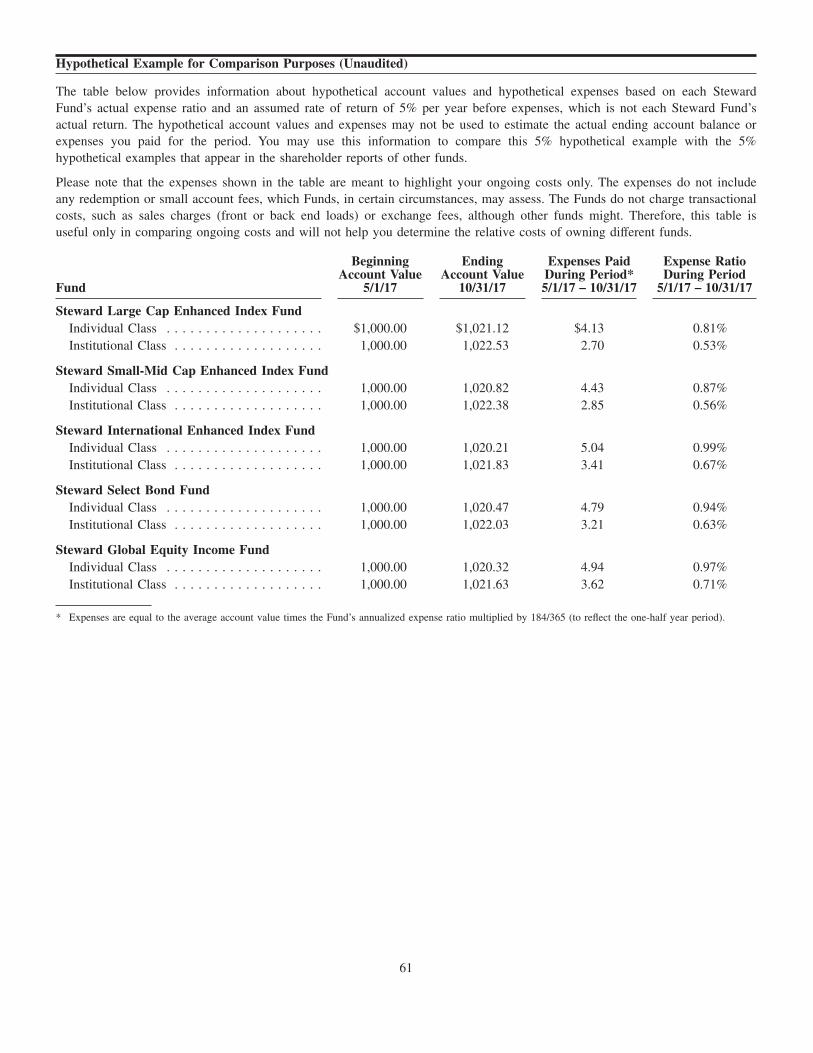
Hypothetical Example for Comparison Purposes (Unaudited)
The table below provides information about hypothetical account values and hypothetical expenses based on each StewardFund’s actual expense ratio and an assumed rate of return of 5% per year before expenses, which is not each Steward Fund’sactual return. The hypothetical account values and expenses may not be used to estimate the actual ending account balance orexpenses you paid for the period. You may use this information to compare this 5% hypothetical example with the 5%hypothetical examples that appear in the shareholder reports of other funds.
Please note that the expenses shown in the table are meant to highlight your ongoing costs only. The expenses do not includeany redemption or small account fees, which Funds, in certain circumstances, may assess. The Funds do not charge transactionalcosts, such as sales charges (front or back end loads) or exchange fees, although other funds might. Therefore, this table isuseful only in comparing ongoing costs and will not help you determine the relative costs of owning different funds.
Fund
BeginningAccount Value
5/1/17
EndingAccount Value
10/31/17
Expenses PaidDuring Period*5/1/17 − 10/31/17
Expense RatioDuring Period
5/1/17 − 10/31/17
Steward Large Cap Enhanced Index FundIndividual Class . . . . . . . . . . . . . . . . . . . . $1,000.00 $1,021.12 $4.13 0.81%Institutional Class . . . . . . . . . . . . . . . . . . . 1,000.00 1,022.53 2.70 0.53%
Steward Small-Mid Cap Enhanced Index FundIndividual Class . . . . . . . . . . . . . . . . . . . . 1,000.00 1,020.82 4.43 0.87%Institutional Class . . . . . . . . . . . . . . . . . . . 1,000.00 1,022.38 2.85 0.56%
Steward International Enhanced Index FundIndividual Class . . . . . . . . . . . . . . . . . . . . 1,000.00 1,020.21 5.04 0.99%Institutional Class . . . . . . . . . . . . . . . . . . . 1,000.00 1,021.83 3.41 0.67%
Steward Select Bond FundIndividual Class . . . . . . . . . . . . . . . . . . . . 1,000.00 1,020.47 4.79 0.94%Institutional Class . . . . . . . . . . . . . . . . . . . 1,000.00 1,022.03 3.21 0.63%
Steward Global Equity Income FundIndividual Class . . . . . . . . . . . . . . . . . . . . 1,000.00 1,020.32 4.94 0.97%Institutional Class . . . . . . . . . . . . . . . . . . . 1,000.00 1,021.63 3.62 0.71%
* Expenses are equal to the average account value times the Fund’s annualized expense ratio multiplied by 184/365 (to reflect the one-half year period).
61

Visit us online at:
crossmarkglobal.com
STEWARD FUNDS
SEMI-ANNUAL REPORT(UNAUDITED)
Steward Large Cap Enhanced Index Fund
Steward Small-Mid Cap Enhanced Index Fund
Steward International Enhanced Index Fund
Steward Select Bond Fund
Steward Global Equity Income Fund
Distributed by:
Crossmark Distributors, Inc.3700 W. Sam Houston Parkway S., Suite 250Houston, TX [email protected]
For more complete information about the Steward Funds, including charges and expenses, contactthe Distributor to receive a prospectus. Please read it carefully before you invest or send money.