sterling bank of asia, inc. (a savings bank) · sterling bank of asia, inc. (a savings bank)...
TRANSCRIPT
Sterling Bank of Asia, Inc. (A Savings Bank)
Financial Statements December 31, 2011 and 2010 and Independent Auditors’ Report SyCip Gorres Velayo & Co.

*SGVMC117102*
INDEPENDENT AUDITORS’ REPORT The Stockholders and the Board of Directors Sterling Bank of Asia, Inc. (A Savings Bank) Report on the Financial Statements We have audited the accompanying financial statements of Sterling Bank of Asia, Inc. (A Savings Bank), which comprise the statements of financial position as at December 31, 2011 and 2010, and the statements of income, statements of comprehensive income, statements of changes in equity and statements of cash flows for the years then ended, and a summary of significant accounting policies and other explanatory information. Management’s Responsibility for the Financial Statements Management is responsible for the preparation and fair presentation of these financial statements in accordance with Philippine Financial Reporting Standards, and for such internal control as management determines is necessary to enable the preparation of financial statements that are free from material misstatement, whether due to fraud or error. Auditors’ Responsibility Our responsibility is to express an opinion on these financial statements based on our audits. We conducted our audits in accordance with Philippine Standards on Auditing. Those standards require that we comply with ethical requirements and plan and perform the audit to obtain reasonable assurance about whether the financial statements are free from material misstatement. An audit involves performing procedures to obtain audit evidence about the amounts and disclosures in the financial statements. The procedures selected depend on the auditor’s judgment, including the assessment of the risks of material misstatement of the financial statements, whether due to fraud or error. In making those risk assessments, the auditor considers internal control relevant to the entity’s preparation and fair presentation of the financial statements in order to design audit procedures that are appropriate in the circumstances, but not for the purpose of expressing an opinion on the effectiveness of the entity’s internal control. An audit also includes evaluating the appropriateness of accounting policies used and the reasonableness of accounting estimates made by management, as well as evaluating the overall presentation of the financial statements. We believe that the audit evidence we have obtained is sufficient and appropriate to provide a basis for our audit opinion.
SyCip Gorres Velayo & Co. 6760 Ayala Avenue 1226 Makati City Philippines
Phone: (632) 891 0307 Fax: (632) 819 0872 www.sgv.com.ph BOA/PRC Reg. No. 0001 SEC Accreditat ion No. 0012-FR-2
A member firm of Ernst & Young Global Limited
*SGVMC117102*
- 2 -
Opinion In our opinion, the financial statements present fairly, in all material respects, the financial position of Sterling Bank of Asia, Inc. (A Savings Bank) as at December 31, 2011 and 2010, and its financial performance and its cash flows for the years then ended in accordance with Philippine Financial Reporting Standards. Report on the Supplementary Information Required under Revenue Regulations 19-2011 and 15-2010 Our audits were conducted for the purpose of forming an opinion on the basic financial statements taken as a whole. The supplementary information required under Revenue Regulations 19-2011 and 15-2010 in Notes 30 and 31 to the financial statements, respectively, is presented for purposes of filing with the Bureau of Internal Revenue and is not a required part of the basic financial statements. Such information is the responsibility of the management of Sterling Bank Asia, Inc. (A Savings Bank). The information has been subjected to the auditing procedures applied in our audit of the basic financial statements. In our opinion, the information is fairly stated in all material respects in relation to the basic financial statements taken as a whole. SYCIP GORRES VELAYO & CO. Josephine Adrienne A. Abarca Partner CPA Certificate No. 92126 SEC Accreditation No. 0466-AR-1 (Group A), February 11, 2010, valid until February 10, 2013 Tax Identification No. 163-257-145 BIR Accreditation No. 08-001998-61-2009, June 1, 2009, valid until May 31, 2012 PTR No. 3174577, January 2, 2012, Makati City March 20, 2012
*SGVMC117102*
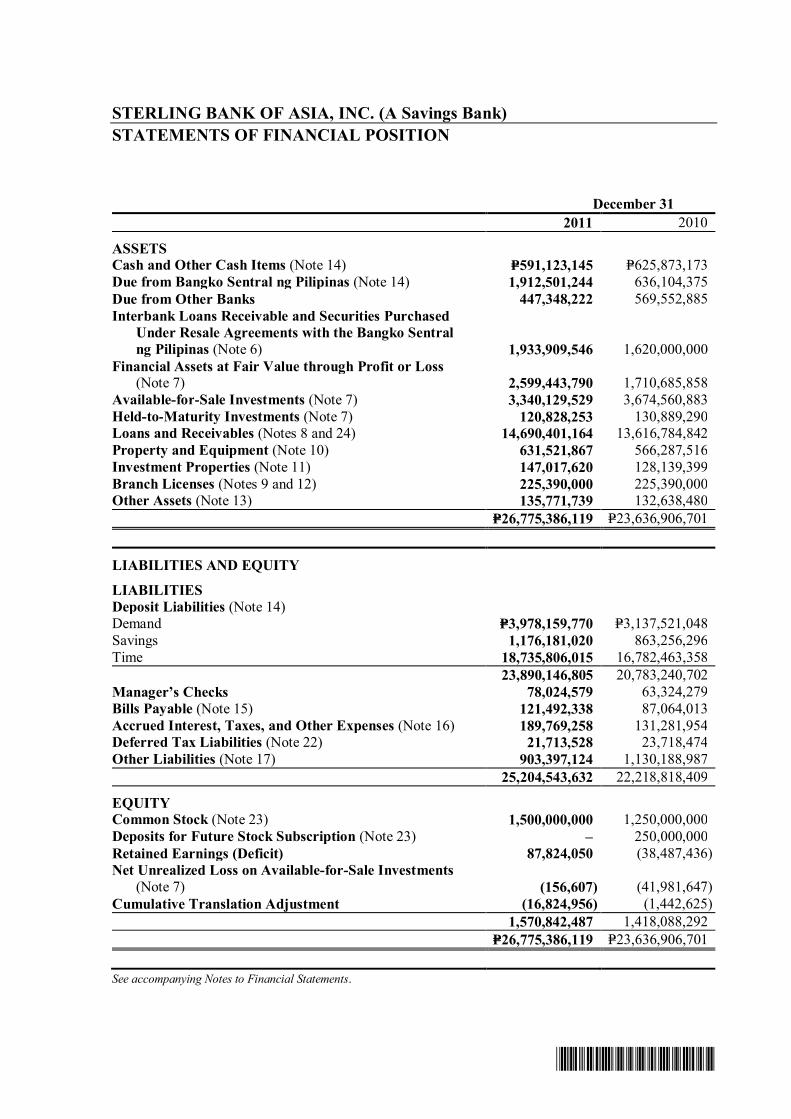
STERLING BANK OF ASIA, INC. (A Savings Bank) STATEMENTS OF FINANCIAL POSITION December 31 2011 2010
ASSETS Cash and Other Cash Items (Note 14) P=591,123,145 P=625,873,173 Due from Bangko Sentral ng Pilipinas (Note 14) 1,912,501,244 636,104,375 Due from Other Banks 447,348,222 569,552,885 Interbank Loans Receivable and Securities Purchased
Under Resale Agreements with the Bangko Sentral ng Pilipinas (Note 6) 1,933,909,546 1,620,000,000
Financial Assets at Fair Value through Profit or Loss (Note 7) 2,599,443,790 1,710,685,858
Available-for-Sale Investments (Note 7) 3,340,129,529 3,674,560,883 Held-to-Maturity Investments (Note 7) 120,828,253 130,889,290 Loans and Receivables (Notes 8 and 24) 14,690,401,164 13,616,784,842 Property and Equipment (Note 10) 631,521,867 566,287,516 Investment Properties (Note 11) 147,017,620 128,139,399 Branch Licenses (Notes 9 and 12) 225,390,000 225,390,000 Other Assets (Note 13) 135,771,739 132,638,480 P=26,775,386,119 P=23,636,906,701
LIABILITIES AND EQUITY
LIABILITIES Deposit Liabilities (Note 14) Demand P=3,978,159,770 P=3,137,521,048 Savings 1,176,181,020 863,256,296 Time 18,735,806,015 16,782,463,358 23,890,146,805 20,783,240,702 Manager’s Checks 78,024,579 63,324,279 Bills Payable (Note 15) 121,492,338 87,064,013 Accrued Interest, Taxes, and Other Expenses (Note 16) 189,769,258 131,281,954 Deferred Tax Liabilities (Note 22) 21,713,528 23,718,474 Other Liabilities (Note 17) 903,397,124 1,130,188,987 25,204,543,632 22,218,818,409
EQUITY Common Stock (Note 23) 1,500,000,000 1,250,000,000 Deposits for Future Stock Subscription (Note 23) – 250,000,000 Retained Earnings (Deficit) 87,824,050 (38,487,436) Net Unrealized Loss on Available-for-Sale Investments
(Note 7) (156,607) (41,981,647) Cumulative Translation Adjustment (16,824,956) (1,442,625) 1,570,842,487 1,418,088,292 P=26,775,386,119 P=23,636,906,701 See accompanying Notes to Financial Statements.
*SGVMC117102*
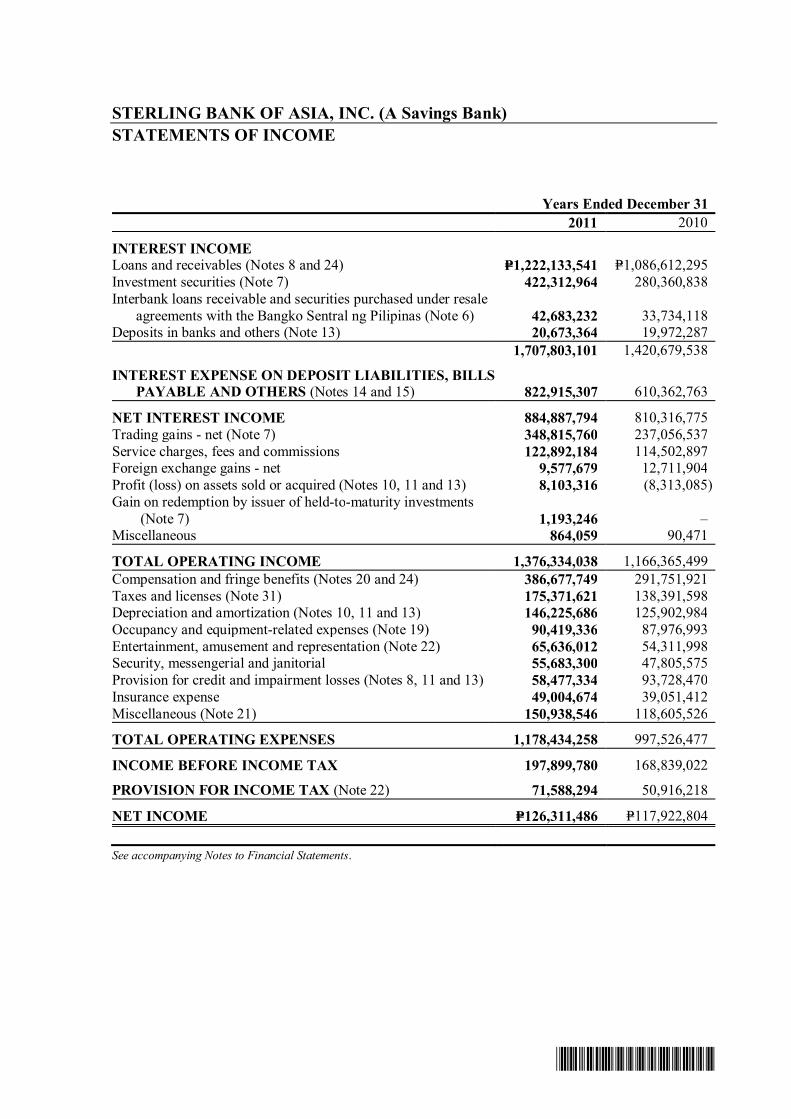
STERLING BANK OF ASIA, INC. (A Savings Bank) STATEMENTS OF INCOME Years Ended December 31 2011 2010
INTEREST INCOME Loans and receivables (Notes 8 and 24) P=1,222,133,541 P=1,086,612,295 Investment securities (Note 7) 422,312,964 280,360,838 Interbank loans receivable and securities purchased under resale
agreements with the Bangko Sentral ng Pilipinas (Note 6) 42,683,232 33,734,118 Deposits in banks and others (Note 13) 20,673,364 19,972,287 1,707,803,101 1,420,679,538
INTEREST EXPENSE ON DEPOSIT LIABILITIES, BILLS PAYABLE AND OTHERS (Notes 14 and 15) 822,915,307 610,362,763
NET INTEREST INCOME 884,887,794 810,316,775 Trading gains - net (Note 7) 348,815,760 237,056,537 Service charges, fees and commissions 122,892,184 114,502,897 Foreign exchange gains - net 9,577,679 12,711,904 Profit (loss) on assets sold or acquired (Notes 10, 11 and 13) 8,103,316 (8,313,085) Gain on redemption by issuer of held-to-maturity investments
(Note 7) 1,193,246 – Miscellaneous 864,059 90,471
TOTAL OPERATING INCOME 1,376,334,038 1,166,365,499 Compensation and fringe benefits (Notes 20 and 24) 386,677,749 291,751,921 Taxes and licenses (Note 31) 175,371,621 138,391,598 Depreciation and amortization (Notes 10, 11 and 13) 146,225,686 125,902,984 Occupancy and equipment-related expenses (Note 19) 90,419,336 87,976,993 Entertainment, amusement and representation (Note 22) 65,636,012 54,311,998 Security, messengerial and janitorial 55,683,300 47,805,575 Provision for credit and impairment losses (Notes 8, 11 and 13) 58,477,334 93,728,470 Insurance expense 49,004,674 39,051,412 Miscellaneous (Note 21) 150,938,546 118,605,526
TOTAL OPERATING EXPENSES 1,178,434,258 997,526,477
INCOME BEFORE INCOME TAX 197,899,780 168,839,022
PROVISION FOR INCOME TAX (Note 22) 71,588,294 50,916,218
NET INCOME P=126,311,486 P=117,922,804 See accompanying Notes to Financial Statements.

*SGVMC117102*
STERLING BANK OF ASIA, INC. (A Savings Bank) STATEMENTS OF COMPREHENSIVE INCOME Years Ended December 31 2011 2010
NET INCOME P=126,311,486 P=117,922,804
OTHER COMPREHENSIVE INCOME (LOSS) Changes in fair value of available-for-sale investments (Note 7) 41,825,040 (31,018,081) Cumulative translation adjustment (15,382,331) 1,064,618
OTHER COMPREHENSIVE INCOME (LOSS) FOR THE YEAR 26,442,709 (29,953,463)
TOTAL COMPREHENSIVE INCOME P=152,754,195 P=87,969,341 See accompanying Notes to Financial Statements.
*SGVMC117102*
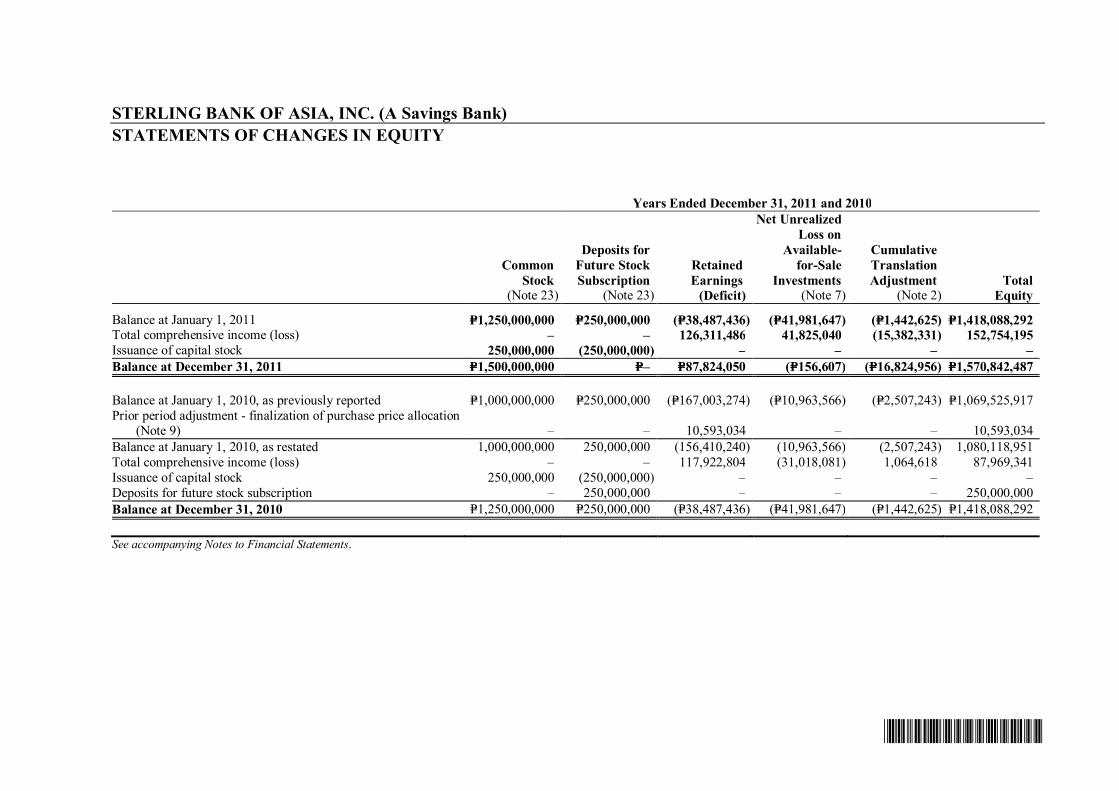
STERLING BANK OF ASIA, INC. (A Savings Bank) STATEMENTS OF CHANGES IN EQUITY Years Ended December 31, 2011 and 2010
Common Stock
(Note 23)
Deposits for Future Stock Subscription
(Note 23)
Retained Earnings
(Deficit)
Net Unrealized Loss on
Available- for-Sale
Investments (Note 7)
Cumulative Translation Adjustment
(Note 2) Total
Equity
Balance at January 1, 2011 P=1,250,000,000 P=250,000,000 (P=38,487,436) (P=41,981,647) (P=1,442,625) P=1,418,088,292 Total comprehensive income (loss) – – 126,311,486 41,825,040 (15,382,331) 152,754,195 Issuance of capital stock 250,000,000 (250,000,000) – – – – Balance at December 31, 2011 P=1,500,000,000 P=– P=87,824,050 (P=156,607) (P=16,824,956) P=1,570,842,487 Balance at January 1, 2010, as previously reported P=1,000,000,000 P=250,000,000 (P=167,003,274) (P=10,963,566) (P=2,507,243) P=1,069,525,917 Prior period adjustment - finalization of purchase price allocation
(Note 9) – – 10,593,034 – – 10,593,034 Balance at January 1, 2010, as restated 1,000,000,000 250,000,000 (156,410,240) (10,963,566) (2,507,243) 1,080,118,951 Total comprehensive income (loss) – – 117,922,804 (31,018,081) 1,064,618 87,969,341 Issuance of capital stock 250,000,000 (250,000,000) – – – – Deposits for future stock subscription – 250,000,000 – – – 250,000,000 Balance at December 31, 2010 P=1,250,000,000 P=250,000,000 (P=38,487,436) (P=41,981,647) (P=1,442,625) P=1,418,088,292 See accompanying Notes to Financial Statements.
*SGVMC117102*
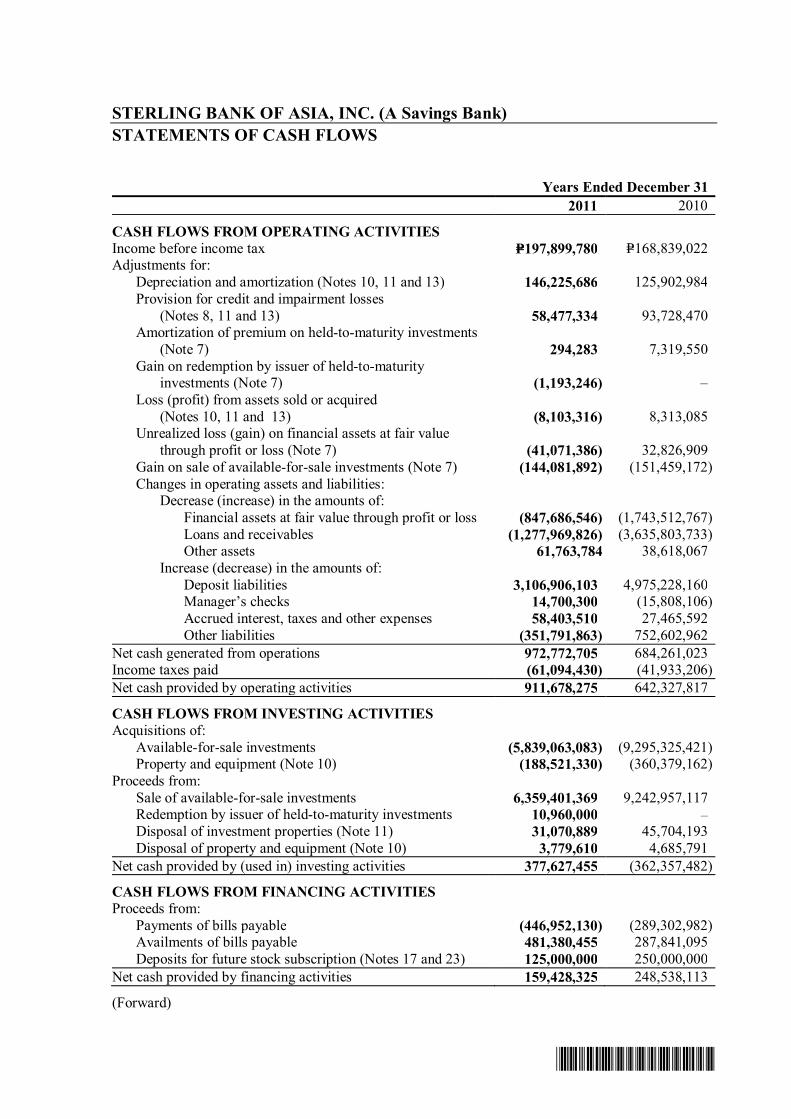
STERLING BANK OF ASIA, INC. (A Savings Bank) STATEMENTS OF CASH FLOWS Years Ended December 31 2011 2010
CASH FLOWS FROM OPERATING ACTIVITIES Income before income tax P=197,899,780 P=168,839,022 Adjustments for: Depreciation and amortization (Notes 10, 11 and 13) 146,225,686 125,902,984 Provision for credit and impairment losses (Notes 8, 11 and 13) 58,477,334 93,728,470 Amortization of premium on held-to-maturity investments (Note 7) 294,283 7,319,550 Gain on redemption by issuer of held-to-maturity investments (Note 7) (1,193,246) – Loss (profit) from assets sold or acquired (Notes 10, 11 and 13) (8,103,316) 8,313,085 Unrealized loss (gain) on financial assets at fair value through profit or loss (Note 7) (41,071,386) 32,826,909 Gain on sale of available-for-sale investments (Note 7) (144,081,892) (151,459,172) Changes in operating assets and liabilities: Decrease (increase) in the amounts of: Financial assets at fair value through profit or loss (847,686,546) (1,743,512,767) Loans and receivables (1,277,969,826) (3,635,803,733) Other assets 61,763,784 38,618,067 Increase (decrease) in the amounts of: Deposit liabilities 3,106,906,103 4,975,228,160 Manager’s checks 14,700,300 (15,808,106) Accrued interest, taxes and other expenses 58,403,510 27,465,592 Other liabilities (351,791,863) 752,602,962 Net cash generated from operations 972,772,705 684,261,023 Income taxes paid (61,094,430) (41,933,206) Net cash provided by operating activities 911,678,275 642,327,817
CASH FLOWS FROM INVESTING ACTIVITIES Acquisitions of: Available-for-sale investments (5,839,063,083) (9,295,325,421) Property and equipment (Note 10) (188,521,330) (360,379,162) Proceeds from: Sale of available-for-sale investments 6,359,401,369 9,242,957,117 Redemption by issuer of held-to-maturity investments 10,960,000 – Disposal of investment properties (Note 11) 31,070,889 45,704,193 Disposal of property and equipment (Note 10) 3,779,610 4,685,791 Net cash provided by (used in) investing activities 377,627,455 (362,357,482)
CASH FLOWS FROM FINANCING ACTIVITIES Proceeds from: Payments of bills payable (446,952,130) (289,302,982) Availments of bills payable 481,380,455 287,841,095 Deposits for future stock subscription (Notes 17 and 23) 125,000,000 250,000,000 Net cash provided by financing activities 159,428,325 248,538,113
(Forward)

*SGVMC117102*
- 2 - Years Ended December 31 2011 2010
EFFECT OF EXCHANGE RATE CHANGES IN CASH AND CASH EQUIVALENTS (P=15,382,331) P=1,064,618
NET INCREASE IN CASH AND CASH EQUIVALENTS 1,433,351,724 529,573,066
CASH AND CASH EQUIVALENTS AT BEGINNING OF YEAR
Cash and other cash items 625,873,173 249,011,034 Due from Bangko Sentral ng Pilipinas 636,104,375 644,268,650 Due from other banks 569,552,885 1,118,677,683 Interbank loans receivable and securities purchased under resale
agreements with the Bangko Sentral ng Pilipinas 1,620,000,000 910,000,000 3,451,530,433 2,921,957,367
CASH AND CASH EQUIVALENTS AT END OF YEAR Cash and other cash items 591,123,145 625,873,173 Due from Bangko Sentral ng Pilipinas 1,912,501,244 636,104,375 Due from other banks 447,348,222 569,552,885 Interbank loans receivable and securities purchased under resale
agreements with the Bangko Sentral ng Pilipinas 1,933,909,546 1,620,000,000 P=4,884,882,157 P=3,451,530,433 OPERATING CASH FLOWS FROM INTEREST Years Ended December 31 2011 2010 Interest received P=1,679,137,787 P=1,387,292,018 Interest paid 801,517,382 608,371,233 See accompanying Notes to Financial Statements.

*SGVMC117102*
STERLING BANK OF ASIA INC. (A Savings Bank) NOTES TO FINANCIAL STATEMENTS 1. Corporate Information
Sterling Bank of Asia, Inc. (A Savings Bank) (the ‘Bank’), formerly Far East Savings Bank, Inc. (FESB), was incorporated in the Philippines on January 20, 1998 to engage primarily in the general business of savings and mortgage banking. FESB was authorized by the Bangko Sentral ng Pilipinas (BSP) to operate as a savings bank on February 26, 1998 and started commercial operations on March 16, 1998.
On July 12, 2006, JTKC Equities, Inc., Surewell Equities, Inc., and Star Equities, Inc. (the Buyers) entered into a Memorandum of Agreement with the Bank of the Philippine Islands (BPI) to purchase the entire capital stock of FESB. BPI is the record or beneficial owner of the entire issued and outstanding capital stock of FESB. On October 20, 2006, the Buyers and BPI entered into an Agreement to Purchase Shares to confirm the Buyers’ intention to purchase FESB, subject only to the formal approval of the BSP. The BSP approved the agreement on December 27, 2006.
On December 28, 2006, the board of directors (BOD) and shareholders, in a separate meeting, approved the change in name of FESB to Sterling Bank of Asia, Inc. (A Savings Bank). On February 15, 2007 and February 27, 2007, the BSP and the Securities and Exchange Commission (SEC), respectively, approved such change in corporate name.
On March 16, 2007, the BSP confirmed the Bank’s authority to operate as a thrift bank. On March 30, 2007, the Bank started accepting deposits from and granting loans to clients.
On January 16, 2009, the BSP approved the Bank’s change of principal place of business from Ground Floor, SSS Building, Ayala Avenue, corner R. V. Rufino Street, Makati City to Sterling Bank Corporate Center, Ortigas Avenue, Greenhills, San Juan City. The SEC subsequently approved such change on February 6, 2009.
On March 9, 2009, the Bank entered into a Share Purchase Agreement (the Agreement) with the Armed Forces and Police Savings and Loan Association, Inc. (AFPSLAI) and the Armed Forces and Police Mutual Benefit Association, Inc. (AFPMBAI) to buy all of the shares of stock (including licenses and tangible/intangible assets) of Centennial Savings Bank, Inc. (‘CSB’), a banking corporation based in the Philippines. AFPSLAI and AFPMBAI are the registered and beneficial owners of CSB.
On August 4, 2009, the BSP approved the Bank’s application to acquire 100.0% of the shares of stock of CSB with the objective of merging it with the Bank. Although the acquisition is a temporary stage in the merger process, BSP noted that it will result in a technical violation of Section 12 of Republic Act (RA) No. 7906 (Thrift Banks Act of 1995), as implemented by Section X378 of the Manual of Regulations for Banks (MORB) for exceeding the 49.0% limit on investment in the equity of CSB, a financial allied undertaking. As a condition for the approval of the acquisition of 100.0% shares of stock of CSB, BSP required the Bank to submit a merger application with CSB within 30 days from receipt of notice of the BSP approval.
The Bank obtained control of CSB on August 18, 2009, the date when the Bank acquired the assets and assumed the liabilities of CSB.
- 2 -
*SGVMC117102*
The Bank and CSB executed the Plan of Merger on August 28, 2009 and submitted to the BSP an Application for Merger and the Plan of Merger documents on September 3, 2009. The Bank resubmitted the documents on December 9, 2009 to reflect the changes prescribed by the General Counsel of the BSP. The Plan of Merger indicates that the effective merger date will be the date of approval by the SEC and the SEC’s issuance of the Certificate of Filing of the Articles of Merger.
The Bank obtained from the BSP the final approval of the merger on March 29, 2010 and the Certificate of Authority for the Approved Merger on June 2, 2010.
The SEC approved the merger and issued the Certificate of Filing of Articles of Merger on June 28, 2010.
On that date, the Bank and CSB merged, with the Bank as the surviving entity. As a result of the merger, the Bank no longer prepares separate parent company financial statements and consolidated financial statements. The financial statements of the Bank have been prepared as a continuation of the consolidated group.
The merger was accounted for in accordance with the pooling of interest method where the identifiable assets acquired and liabilities assumed from CSB were recognized at their carrying values.
2. Summary of Significant Accounting Policies
Basis of Preparation The accompanying financial statements have been prepared on a historical cost basis except for financial assets at fair value through profit or loss (FVPL) and available-for-sale (AFS) investments which have been measured at fair value, with exception to AFS unquoted equity securities which are measured at cost. The financial statements are presented in Philippine peso and all values are rounded to the nearest peso except when otherwise indicated.
The financial statements of the Bank include the accounts maintained in the Regular Banking Unit (RBU) and Foreign Currency Deposit Unit (FCDU). The functional currency of the RBU and the FCDU is the Philippine peso and United States dollar (USD), respectively. For financial reporting purposes, FCDU accounts and foreign currency-denominated accounts in the RBU are translated into their equivalents in Philippine peso, which is the Bank’s presentation currency (see accounting policy on ‘Foreign currency transactions and translation’). The financial statements of these units are combined after eliminating inter-unit accounts. Statement of Compliance The financial statements of the Bank have been prepared in compliance with Philippine Financial Reporting Standards (PFRS).

- 3 -
*SGVMC117102*
Changes in Accounting Policies The accounting policies adopted are consistent with those of the previous financial year except for the adoption of the following new and amended standards and interpretations which became effective on January 1, 2011. The adoption of these new standards, amendments and interpretations did not have any impact on the financial statements of the Bank:
• Philippine Accounting Standards (PAS) 24 Amendment, Related Party Disclosures The amendments clarify the definition of a related party. The new definitions emphasize a
symmetrical view of related party relationships and clarify the circumstances in which persons and key management personnel affect related party relationships of an entity. In addition, the new amendment introduces an exemption from the general related disclosure requirements for transactions with government and entities that are controlled, jointly controlled or significantly influenced by the same government as the reporting entity.
• PAS 32 Amendment, Financial Instruments: Presentation - Classification of Rights Issues The amendment to PAS 32 amended the definition of a financial liability to enable entities to
classify rights issues and certain options or warrants as equity instruments. The amendment is applicable if the rights are given pro rata to all of the existing owners of the same class of an entity’s non-derivative equity instruments, to acquire a fixed number of the entity’s own equity instruments for a fixed amount in any currency.
• Philippine Interpretation International Financial Reporting Interpretations Committee (IFRIC) 14 Amendment, Prepayments of a Minimum Funding Requirement
The amendment of the interpretation removes an unintended consequence when an entity is subject to minimum funding requirements and makes an early payment of contributions to cover such requirements. The amendment permits a prepayment of future service cost by the entity to be recognized as a pension asset.
Improvements to PFRS 2010 The omnibus amendments to PFRSs were issued in 2010 primarily with a view to remove inconsistencies and clarify wordings. There are separate transitional provisions for each standard. The adoption of the amendments did not have any impact on the accounting policies, financial position or performance of the Bank. • PFRS 3, Business Combinations • PFRS 7, Financial Instruments: Disclosures • PAS 1, Presentation of Financial Statements • PAS 27, Consolidated and Separate Financial Statements • PAS 34, Interim Financial Reporting • Philippine Interpretation IFRIC 13, Customer Loyalty Programmes • Philippine Interpretation IFRIC19, Extinguishing Financial Liabilities with Equity Instruments
Foreign Currency Transactions and Translation
Transactions and balances The books of accounts of the RBU are maintained in Philippine peso, while those of the FCDU are maintained in USD. For financial reporting purposes, monetary assets and liabilities of the FCDU and foreign currency-denominated monetary assets and liabilities in the RBU are translated in Philippine peso based on the Philippine Dealing System (PDS) closing rate prevailing at the statement of financial position date and foreign currency-denominated income and expenses, at the prevailing rate as at the dates of transactions. Foreign exchange differences arising from revaluation and translation of foreign currency denominated assets and liabilities of the RBU
- 4 -
*SGVMC117102*
credited to or charged against operations in the year in which the rates change. Exchange differences arising from translation of the accounts of the FCDU to Philippine peso as the presentation currency are taken to the statement of comprehensive income under ‘Cumulative translation adjustment’.
Non-monetary items that are measured in terms of historical cost in a foreign currency are translated using the exchange rates as at the dates of the initial transactions. Non-monetary items measured at fair value in a foreign currency are translated using the exchange rates at the date when the fair value was determined. Upon disposal of the FCDU or upon actual remittance of FCDU profits to RBU, the deferred cumulative amount recognized in the statement of comprehensive income is recognized in the statement of income.
Cash and Cash Equivalents
For purposes of reporting cash flows, cash and cash equivalents consist of cash and other cash items (COCI), due from BSP and other banks, and interbank loans receivable and securities purchased under resale agreements (SPURA) with the BSP that are convertible to known amounts of cash, with original maturities of three months or less from dates of placements and that are subject to insignificant risk of changes in value.
Financial Instruments - Initial Recognition and Subsequent Measurement Date of recognition Regular way purchases or sales of financial assets that require delivery of assets within the time frame established by regulation or convention in the marketplace are recognized on the settlement date. Settlement date is the date on which the transaction is settled by delivery of the assets that are the subject of the agreement. Settlement date accounting refers to (a) the recognition of an asset on the day it is received by the Bank, and (b) the derecognition of an asset and recognition of any gain or loss on disposal on the day that it is delivered by the Bank. Any change in the fair value of the financial asset to be received is recognized in the statement of income for financial assets at FVPL and in other comprehensive income for AFS investments. Deposits, amounts due from banks and loans and receivables are recognized when cash is received by the Bank or advanced to the borrowers.
Initial measurement of financial instruments All financial instruments are initially recognized at fair value plus transaction costs, except for financial assets and financial liabilities at FVPL, that are directly attributable to the acquisition or issue of the financial asset or financial liability. The Bank classifies its financial assets in the following categories: financial assets at FVPL, AFS investments, held-to-maturity (HTM) investments and loans and receivables. Financial liabilities are classified into financial liabilities at FVPL and other financial liabilities at amortized cost. The classification depends on the purpose for which the investments were acquired and whether they are quoted in an active market. Management determines the classification of its investments at initial recognition and, where allowed and appropriate, re-evaluates such designation at every statement of financial position date.
Determination of fair value The fair value for financial instruments traded in active markets at the statement of financial position date is based on their quoted market price or dealer price quotations (bid price for long positions and ask price for short positions), without any deduction for transaction costs. When current bid and ask prices are not available, the price of the most recent transaction provides evidence of the current fair value as long as there has not been a significant change in economic circumstances since the time of the transaction.
- 5 -
*SGVMC117102*
For all other financial instruments not listed in an active market, the fair value is determined by using appropriate valuation techniques. Valuation techniques include net present value techniques, comparison to similar instruments for which market observable prices exist and other relevant valuation models. ‘Day 1’ difference Where the transaction price in a non-active market is different to the fair value from other observable current market transactions in the same instrument or based on a valuation technique whose variables include only data from observable market, the Bank recognizes the difference between the transaction price and fair value (a ‘Day 1’ difference) in the statement of income, unless it qualifies for recognition as some other type of asset. In cases where use is made of data which is not observable, the difference between the transaction price and model value is only recognized in the statement of income when the inputs become observable or when the instrument is derecognized. For each transaction, the Bank determines the appropriate method of recognizing the ‘Day 1’ difference amount.
Held-for-trading (HFT) securities Financial assets are classified as held for trading if they are acquired for the purpose of selling in the near term. HFT securities are recorded in the statement of financial position at fair value. These include government and private debt securities. Changes in fair value relating to the held-for-trading positions are recognized in ‘Trading gains - net’ in the statement of income. Interest earned is recorded in ‘Interest income’ in the statement of income.
Derivative instruments Embedded derivatives are bifurcated from their host contracts and carried at fair value with fair value changes being reported in the statement of income, when the entire hybrid contracts (composed of both the host contract and the embedded derivative) are not accounted for as financial assets designated at FVPL, when their economic risks and characteristics are not closely related to those of their respective host contracts, and when a separate instrument with the same terms as the embedded derivative would meet the definition of a derivative. The Bank assesses the existence of an embedded derivative on the date it first becomes a party to the contract, and performs re-assessment only where there is a change to the contract that significantly modifies the contractual cash flows.
Financial assets or financial liabilities designated at FVPL Financial assets or financial liabilities may be designated by management on initial recognition when any of the following criteria are met:
• The designation eliminates or significantly reduces the inconsistent treatment that would
otherwise arise from measuring the assets or liabilities or recognizing gains or losses on them on a different basis; or
• The assets and liabilities are part of a group of financial assets, financial liabilities or both which are managed and their performance are evaluated on a fair value basis, in accordance with a documented risk management or investment strategy; or
• The financial instruments contain an embedded derivative, unless the embedded derivative does not significantly modify the cash flows or it is clear with little or no analysis, that it would not be separately recorded.
- 6 -
*SGVMC117102*
AFS investments AFS investments include equity and debt securities. Equity investments classified as AFS investments are those which are neither classified as held-for-trading nor designated as at FVPL. Debt securities in this category are those which are intended to be held for an indefinite period of time and which may be sold in response to liquidity needs or in response to changes in market conditions. After initial measurement, AFS investments are subsequently measured at fair value. Unrealized gains and losses are recognized in other comprehensive income, except for impairment losses and foreign exchange gains and losses, until the financial asset is derecognized. When the security is disposed of, the cumulative gain or loss previously recognized in other comprehensive income is recognized in the statement of income as a reclassification adjustment. Where the Bank holds more than one investment in the same security they are deemed to be disposed of on a first-come-first-out basis.
Investments in equity instruments that do not have a quoted market price in an active market and whose fair value cannot be reliably measured shall be measured at cost less impairment.
Interest earned on holding AFS debt securities are reported as ‘Interest income’ using the EIR. Dividends earned on holding AFS equity securities are recognized in the statement of income as ‘Dividend income’ when the right to the payment has been established. The losses arising from impairment of such investments are recognized as ‘Provision for credit and impairment losses’ in the statement of income.
HTM investments HTM investments are quoted non-derivative financial assets with fixed or determinable payments and fixed maturities for which the Bank’s management has the positive intention and ability to hold to maturity. After initial measurement, HTM investments are carried at amortized cost using the effective interest method, less any impairment in value. Amortized cost is calculated by taking into account any discount or premium on acquisition and fees that are an integral part of the EIR. The amortization is included in ‘Interest income’ in the statement of income. The losses arising from impairment of such investments are recognized in the statement of income. The effects of restatement on foreign currency-denominated HTM investments are recognized in the statement of income.
If the Bank were to sell more than an insignificant amount of HTM investments before maturity (other than in certain specific circumstances), the entire category would be tainted and would have to be reclassified as AFS investments. Furthermore, the Bank would be prohibited to classify any financial assets as HTM investments for the following two years. In 2011, a portion of the Bank’s HTM investments were called on by the issuer who has the option to call or prepay at par value. The prepayment does not taint the HTM portfolio as the redemption was initiated by the issuer and is beyond the control of the Bank (see Note 7).
Loans and receivables Loans and receivables include receivables from customers, amounts due from BSP and other banks and interbank loans receivable and SPURA with the BSP. These are financial assets with fixed or determinable payments and fixed maturities that are not quoted in an active market. They are not entered into with the intention of immediate or short-term resale and are not categorized as financial assets at FVPL or AFS investments.

- 7 -
*SGVMC117102*
After initial measurement, loans and receivables are subsequently measured at amortized cost using effective interest method, less any allowance for credit losses. Amortized cost is calculated by taking into account any discount or premium on acquisition and fees and costs that are an integral part of the EIR. The amortization is included in ‘Interest income’ in the statement of income. The losses arising from impairment are recognized in ‘Provision for credit and impairment losses’ in the statement of income.
Other financial liabilities Issued financial instruments or their components, which are not designated at FVPL, are classified as liabilities carried at amortized cost, where the substance of the contractual arrangement results in the Bank having an obligation either to deliver cash or another financial asset to the holder, or to satisfy the obligation other than by the exchange of a fixed amount of cash or another financial asset for a fixed number of its own equity shares. Other financial liabilities include deposit liabilities, bills payable, manager’s checks, accounts payable, payment orders payable, due to Philippine Deposit Insurance Corporation (PDIC) or BSP and bills purchased-contra. After initial measurement, financial liabilities not qualified as and not designated at FVPL, are subsequently measured at amortized cost using the effective interest method. Amortized cost is calculated by taking into account any discount or premium on the issue and fees that are an integral part of the EIR.
Reclassification of Financial Assets
A financial asset is reclassified out of the FVPL category when the following conditions are met:
• The financial asset is no longer held for the purpose of selling or repurchasing it in the near term; and
• There is a rare circumstance Any gain or loss already recognized in the statement of income is not reversed. The fair value of the financial asset on the date of reclassification becomes its new amortized cost, as applicable. A financial asset reclassified out of the AFS category is reclassified at its fair value on the date of reclassification. Any previous gain or loss on that asset that has been recognized in other comprehensive income is amortized to profit or loss over the remaining life of the investment using the effective interest method. Any difference between the new amortized cost and the expected cash flows is also amortized over the remaining life of the asset using the effective interest method. If the asset is subsequently determined to be impaired then the amount recorded in other comprehensive income is recycled to the statement of income.
Reclassification is at the election of management, and is determined on an instrument-by-instrument basis. The Bank does not reclassify any financial instrument into the FVPL category after initial recognition.

- 8 -
*SGVMC117102*
Derecognition of Financial Assets and Liabilities Financial assets A financial asset (or, where applicable a part of a financial asset or part of a group of financial assets) is derecognized when:
• the rights to receive cash flows from the asset have expired; or • the Bank retains the right to receive cash flows from the asset, but has assumed an obligation
to pay them in full without material delay to a third party under a “pass-through” arrangement; or
• the Bank has transferred its rights to receive cash flows from the asset and either (a) has transferred substantially all the risks and rewards of the asset, or (b) has neither transferred nor retained the risks and rewards of the asset but has transferred the control over the asset.
Where the Bank has transferred its rights to receive cash flows from an asset or has entered into a pass-through arrangement, and has neither transferred nor retained substantially all the risks and rewards of the asset nor transferred control over the asset, the asset is recognized to the extent of the Bank’s continuing involvement in the asset. Continuing involvement that takes the form of a guarantee over the transferred asset is measured at the lower of original carrying amount of the asset and the maximum amount of consideration that the Bank could be required to repay. Financial liabilities A financial liability is derecognized when the obligation under the liability is discharged, cancelled or has expired. Where an existing financial liability is replaced by another from the same lender on substantially different terms, or the terms of an existing liability are substantially modified, such an exchange or modification is treated as a derecognition of the original liability and the recognition of a new liability, and the difference in the respective carrying amounts is recognized in the statement of income. Repurchase and Reverse Repurchase Agreements Securities sold under agreements to repurchase at a specified future date (‘repos’) are not derecognized from the statement of financial position. The corresponding cash received, including accrued interest, is recognized in the statement of financial position.
Conversely, securities purchased under agreements to resell at a specified future date (‘reverse repos’) are not recognized in the statement of financial position. The corresponding cash paid, including accrued interest, is recognized in the statement of financial position as SPURA, and is considered a loan to the counterparty. The difference between the purchase price and resale price is treated as interest income and is accrued over the life of the agreement using the effective interest method.
Offsetting Financial Instruments Financial assets and liabilities are offset and the net amount is reported in the statement of financial position, if and only if, there is a legally enforceable right to offset the recognized amounts and there is an intention to either settle on a net basis, or to realize the asset and settle the liability simultaneously. This is not generally the case with master netting agreements, therefore, the related assets and liabilities are presented gross in the statement of financial position.
- 9 -
*SGVMC117102*
Financial Guarantees In the ordinary course of business, the Bank provides financial guarantees. Financial guarantees are initially recognized in the financial statements at fair value, and the initial fair value is amortized over the life of the financial guarantee. The guarantee liability is subsequently carried at the higher of the amortized amount and the present value of any expected payment (when a payment under the guaranty has become probable).
Impairment of Financial Assets The Bank assesses at each statement of financial position date whether there is any objective evidence that a financial asset or a group of financial assets is deemed to be impaired, if and only if, there is objective evidence as a result of one or more events that had occurred after the initial recognition of the asset and that loss event has an impact on the estimated future cash flows of the financial asset or the group of financial assets that can be reliably estimated.
Financial assets carried at amortized cost The Bank first assesses whether objective evidence of impairment exists individually for financial assets that are individually significant, and individually or collectively for financial assets that are not individually significant. If it is determined that no objective evidence of impairment exist for an individually assessed financial asset, whether significant or not, the asset is included in a group of financial assets with similar credit risk characteristics and that group of financial assets is collectively assessed for impairment. Assets that are individually assessed for impairment and for which an impairment loss is or continues to be recognized are not included in a collective assessment of impairment.
If there is objective evidence that an impairment loss on financial assets carried at amortized cost has been incurred, the amount of the loss is measured as the difference between the assets’ carrying amount and the present value of estimated future cash flows (excluding future credit losses that have not been incurred). The carrying amount of the asset is reduced through the use of an allowance account and the amount of loss is recognized in ‘Provision for credit and impairment losses’ in the statement of income. Interest income continues to be recognized based on the original EIR of the asset. Loans and receivables, together with the associated allowance accounts, are written off when there is no realistic prospect of future recovery and all collateral has been realized. If, in a subsequent year, the amount of the impairment loss increases or decreases because of an event occurring after the impairment was recognized, the previously recognized impairment loss is increased or reduced by adjusting the allowance account. If a future write off is later recovered, the recovery is credited to ‘Provision for credit and impairment losses’ in the statement of income.
The present value of the estimated future cash flows is discounted at the financial asset’s original EIR. If a loan has a variable interest rate, the discount rate for measuring any impairment loss is the current EIR. The calculation of the present value of the estimated future cash flows of a collateralized financial asset reflects the cash flow that may result from foreclosure less costs for obtaining and selling the collateral, whether or not foreclosure is probable.
For the purpose of a collective evaluation of impairment, financial assets are grouped on the basis of the industry of the borrower. Future cash flows on a group of financial assets that are collectively evaluated for impairment are estimated on the basis of historical loss experience for the assets with credit risk characteristics similar to those in the group. Historical loss experience is adjusted on the basis of current observable data to reflect the effects of current conditions on which the historical loss experience is based and to remove the effects of conditions in the
- 10 -
*SGVMC117102*
historical period that do not exist currently. Estimates of changes in future cash flows reflect, and are directionally consistent with, changes in related observable data from year to year. The methodology and assumptions used for estimating future cash flows are reviewed regularly to reduce any differences between loss estimates and actual loss experience. In the case of AFS unquoted equity securities, impairment is assessed based on the same criteria as financial assets carried at amortized costs. Restructured loans Where possible, the Bank seeks to restructure loans rather than to take possession of collateral. This may involve extending the payment arrangements and the agreement of new loan conditions. Once the terms have been renegotiated, the loan is no longer considered as past due. Management continuously reviews restructured loans to ensure that all criteria are met and that future payments are likely to occur. The loan continues to be subject to an individual (calculated using the loan’s original EIR) or collective impairment. The difference between the recorded value of the original loan and the present value of the restructured cash flows, discounted at the original EIR is recognized in provision for credit and impairment losses in the statement of income.
AFS investments For AFS investments, the Bank assesses at each statement of financial position date whether there is objective evidence that an investment is impaired.
In the case of AFS debt investments, the Bank assesses individually whether there is objective evidence of impairment based on the same criteria as financial assets carried at amortized cost. However, the amount recorded for impairment is the cumulative loss measured as the difference between the amortized cost and the current fair value. Future interest income is based on the reduced carrying amount and is accrued based on the rate of interest used to discount future cash flows for the purpose of measuring impairment loss. Such accrual is recorded as part of ‘Interest income’ in the statement of income. If, in a subsequent year, the fair value of a debt investment increases and the increase can be objectively related to a credit event occurring after the impairment loss was recognized in the statement of income, the impairment loss is reversed through the statement of income.
In case of equity investments classified as AFS, this would include a significant or prolonged decline in the fair value of the investments below its cost. Where there is evidence of impairment, the cumulative loss - measured as the difference between the acquisition cost and the current fair value, less any impairment loss on that financial asset previously recognized in the statement of income - is removed from other comprehensive income and recognized in the statement of income. Impairment losses on equity investments are not reversed through the statement of income. Increases in fair value after impairment are recognized directly in other comprehensive income.
Business Combinations Business combinations from January 1, 2010 Business combinations are accounted for using the acquisition method. The cost of an acquisition is measured as the aggregate of the consideration transferred, measured at acquisition date fair value and the amount of any non-controlling interest in the acquiree. For each business combination, the acquirer measures the non-controlling interest in the acquiree either at fair value or at the proportionate share of the acquiree’s identifiable net assets. Acquisition costs incurred are expensed and included in administrative expenses.

- 11 -
*SGVMC117102*
When the Bank acquires a business, it assesses the financial assets and liabilities assumed for appropriate classification and designation in accordance with the contractual terms, economic circumstances and pertinent conditions as at the acquisition date. This includes the separation of embedded derivatives in host contracts by the acquiree.
If the business combination is achieved in stages, the acquisition date fair value of the acquirer’s previously held equity interest in the acquiree is remeasured to fair value at the acquisition date through the statement of income.
Any contingent consideration to be transferred by the acquirer will be recognized at fair value at the acquisition date. Subsequent changes to the fair value of the contingent consideration which is deemed to be an asset or liability will be recognized in accordance with PAS 39 either in the statement of income or as a change to other comprehensive income. If the contingent consideration is classified as equity, it should not be remeasured until it is finally settled within equity.
Business combinations prior to January 1, 2010 In comparison to the above-mentioned requirements, the following differences applied:
Business combinations were accounted for using the purchase method. Transaction costs directly attributable to the acquisition formed part of the acquisition costs. The non-controlling interest (formerly known as minority interest) was measured at the proportionate share of the acquiree’s identifiable net assets.
Business combinations achieved in stages were accounted for as separate steps. Any additional acquired share of interest did not affect previously recognized goodwill.
When the Bank acquired a business, embedded derivatives separated from the host contract by the acquiree were not reassessed on acquisition unless the business combination resulted in a change in the terms of the contract that significantly modified the cash flows that otherwise would have been required under the contract. Contingent consideration was recognized if, and only if, the Bank had a present obligation, the economic outflow was more likely than not and a reliable estimate was determinable. Subsequent adjustments to the contingent consideration were recognized as part of goodwill.
Property and Equipment Land is stated at cost less any impairment in value and depreciable properties including building and condominium units, furniture, fixtures and equipment, transportation equipment and leasehold improvements are stated at cost less accumulated depreciation and amortization and any impairment in value.
The initial cost of property and equipment consists of its purchase price, including import duties, taxes and any directly attributable costs of bringing the asset to its working condition and location for its intended use. Expenditures incurred after the furniture, fixtures and equipment have been put into operation, such as repairs and maintenance are normally charged against operations in the period in which the costs are incurred. In situations where it can be clearly demonstrated that the expenditures have resulted in an increase in the future economic benefits expected to be obtained from the use of an item of property and equipment beyond its originally assessed standard of performance, the expenditures are capitalized as an additional cost of furniture, fixtures and

- 12 -
*SGVMC117102*
equipment. When assets are retired or otherwise disposed of, the cost and the related accumulated depreciation and amortization are removed from the accounts, any resulting gain or loss is reflected as income or loss in the statement of income.
Depreciation and amortization is computed on a straight-line basis over the estimated useful lives (EUL) of the related assets. The EUL of the depreciable assets follow:
Building and Condominium unit 20 years Furniture, fixtures and equipment 3 - 5 years Leasehold rights and improvements 5 years or related lease term,
whichever is shorter
The useful life and depreciation and amortization methods are reviewed periodically to ensure that the period and method of depreciation and amortization are consistent with the expected pattern of economic benefits from items of property and equipment. An item of property and equipment is derecognized upon disposal or when no future economic benefits are expected from its use or disposal. Any gain or loss arising on derecognition of the asset (calculated as the difference between the net disposal proceeds and carrying amount of the asset) is included in the statement of income in the year the asset is derecognized.
Investment Properties Investment properties are measured initially at cost, including transaction costs. An investment property acquired through an exchange transaction is measured at fair value of the asset acquired unless the fair value of such an asset cannot be measured in which case the investment property acquired is measured at the carrying amount of asset given up. Any gain or loss on exchange in recognized in the statement of income. Foreclosed properties are classified under ‘Investment properties’ upon:
a. entry of judgment in case of judicial foreclosure; b. execution of the Sheriff’s Certificate of Sale in case of extra-judicial foreclosure; or c. notarization of the Deed of Dacion in case of payment in kind (dacion en pago).
Real properties acquired
Subsequent to initial recognition, depreciable real properties acquired are initially recorded at cost, which is the fair value at acquisition date, less accumulated depreciation and any impairment in value. Land is carried at cost less any impairment in value. Transaction costs, which include nonrefundable capital gains tax and documentary stamp tax, incurred in connection with foreclosure are capitalized as part of the cost of the real properties acquired.
The Bank applies the cost model in accounting for investment properties. Depreciation is computed on a straight-line basis over the EUL of ten (10) years. The EUL and the depreciation method are reviewed periodically to ensure that the period and the method of depreciation are consistent with the expected pattern of economic benefits from items of real properties acquired.
The carrying values of the real properties acquired are reviewed for impairment when events or changes in circumstances indicate that the carrying value may not be recoverable. If any such indication exists and where the carrying value exceeds the estimated recoverable amount, the assets or cash-generating units (CGU) are written down to their recoverable amounts (see accounting policy on ‘Impairment of Nonfinancial Assets’).

- 13 -
*SGVMC117102*
Other Properties Acquired Other properties acquired include chattel mortgage properties acquired in settlement of loan receivables. These are initially recorded at cost, which is the fair value at acquisition date, less accumulated depreciation and any impairment in value.
The Bank applies the cost model in accounting for other properties acquired. Depreciation is computed on a straight-line basis over the EUL of three (3) years. The estimated useful life and the depreciation method are reviewed periodically to ensure that the period and the method of depreciation are consistent with the expected pattern of economic benefits from items of other properties acquired.
The carrying values of the other properties acquired are reviewed for impairment when events or changes in circumstances indicate that the carrying value may not be recoverable. If any such indication exists and where the carrying values exceed the estimated recoverable amount, the assets are written down to their recoverable amounts (see accounting policy on ‘Impairment of Nonfinancial Assets’).
Branch Licenses Branch licenses are initially measured at fair value as of the date of acquisition and are deemed to have an indefinite useful life as there is no foreseeable limit to the period over which they are expected to generate net cash inflows for the Bank.
Intangible assets with indefinite useful life are tested for impairment annually either individually or at the CGU level. Impairment is determined by assessing the recoverable amount of each CGU (or group of CGUs) to which the intangible asset relates. Recoverable amount is the higher of the CGU’s fair value less costs to sell and its value in use. Where the recoverable amount of the CGU is less than its carrying amount, an impairment loss is recognized.
Such intangibles are not amortized. Gains and losses arising from derecognition of an intangible asset are measured as the difference between the net disposal proceeds and the carrying amount of the asset and are recognized in earnings when the asset is derecognized.
Impairment of Nonfinancial Assets Property and equipment, investment properties and chattel mortgage properties An assessment is made at each statement of financial position date as to whether there is any indication of impairment of an asset, or whether there is any indication that an impairment loss previously recognized for an asset in prior years may no longer exist or may have decreased. If any such indication exists, the asset’s recoverable amount is estimated. An asset’s recoverable amount is calculated as the higher of the asset’s value in use or its fair value less costs to sell.
An impairment loss is recognized only if the carrying amount of an asset exceeds its recoverable amount. An impairment loss is charged against income in the year in which it arises, unless the asset is carried at a revalued amount in which case the impairment loss is charged against revaluation increment of the said asset.
A previously recognized impairment loss is reversed by a credit to current operations, unless the asset is carried at a revalued amount in which case the reversal of the impairment loss is credited to the revaluation increment of the same asset, to the extent that it does not restate the asset to a carrying amount in excess of what would have been determined (net of any accumulated depreciation and amortization) had no impairment loss been recognized for the asset in prior years.

- 14 -
*SGVMC117102*
Branch licenses Branch licenses are tested for impairment annually at the statement of financial position date either individually or at the CGU level, as appropriate.
Revenue Recognition Revenue is recognized to the extent that it is probable that the economic benefits will flow to the Bank and the revenue can be reliably measured. The following specific recognition criteria must also be met before revenue is recognized:
Interest income For all financial instruments measured at amortized cost and interest-bearing financial instruments classified as AFS investments, interest income is recorded at the EIR, which is the rate that exactly discounts estimated future cash payments or receipts through the expected life of the financial instrument or a shorter period, where appropriate, to the net carrying amount of the financial asset or financial liability. When calculating the EIR, the Bank estimates cash flows from the financial instrument (for example, prepayment options), but does not consider future credit losses. The calculation includes any fees or incremental costs that are directly attributable to the instrument and are an integral part of the EIR and all others premiums and discounts.
Once the recorded value of a financial asset or group of similar financial assets has been reduced due to an impairment loss, interest income continues to be recognized using the original EIR applied to the new carrying amount.
Trading gains - net Trading gains - net represents results arising from trading activities including all gains and losses from changes in fair value of financial assets and financial liabilities held for trading, and gains and losses from disposal of AFS investments.
Fee and commission income Fees and commissions arising from providing transaction services are recognized on completion of the transaction. Fees or components of fees that are linked to a certain performance are recognized after fulfilling the criteria.
Service charges and penalties Service charges and penalties under ‘Service charges, fees and commissions’ in the statement of income are recognized only upon collection or accrued when there is reasonable degree of certainty as to its collectability.
Profit (loss) from assets sold or acquired Income from sale of properties acquired is recognized upon completion of the earning process and the collectability of the sales price is reasonably assured. Gain or loss on foreclosure is determined as the difference between the fair value at foreclosure and the carrying amount of the loan. Gain on foreclosure is recognized when the risks and rewards of the property has been transferred to the Bank. Expense Recognition Expenses are recognized when decrease in future economic benefits related to a decrease in an asset or an increase of a liability has arisen that can be measured reliably. Expenses are recognized when incurred.

- 15 -
*SGVMC117102*
Operating expenses Operating expenses constitute costs which arise in the normal business operation and are recognized when incurred.
Taxes and licenses This includes all other taxes, local and national, including gross receipts taxes (GRT) documentary stamp taxes, real estate taxes, licenses and permit fees and are recognized when incurred. Leases The determination of whether an arrangement is, or contains a lease is based on the substance of the arrangement and requires an assessment of whether the fulfillment of the arrangement is dependent on the use of a specific asset or assets and the arrangement conveys a right to use the asset. A reassessment is made after inception of the lease only if one of the following applies:
a) there is a change in contractual terms, other than a renewal or extension of the arrangement; b) a renewal option is exercised or extension granted, unless that term of the renewal or extension
was initially included in the lease term; c) there is a change in the determination of whether fulfillment is dependent on a specified asset;
or d) there is a substantial change to the asset.
Where a reassessment is made, lease accounting shall commence or cease from the date when the change in circumstances gave rise to the reassessment for scenarios (a), (c) or (d) above, and at the date of renewal or extension period for scenario (b).
Bank as lessee Operating lease payments are recognized as expense in the statement of income on a straight-line basis over the lease term.
Retirement Cost The Bank has a noncontributory defined benefit retirement plan. The retirement cost of the Bank is determined using the projected unit credit method. Under this method, the current service cost is the present value of retirement obligation in the future with respect to services rendered in the current year.
The liability recognized in the statement of financial position in respect of the defined benefit pension plan is the present value of the retirement obligation at the statement of financial position date less the fair value of plan assets, together with adjustments for unrecognized actuarial gains or losses and past service costs. The retirement obligation is calculated annually by an independent actuary using the projected unit credit method. The present value of the retirement obligation is determined by discounting the estimated future cash outflows using interest rate on government bonds that have terms to maturity approximating the terms of the related retirement liability. Actuarial gains and losses arising from experience adjustments and changes in actuarial assumptions are credited to or charged against income when the net cumulative unrecognized actuarial gains and losses at the end of the previous period exceeded 10.0% of the higher of the retirement obligation and the fair value of plan assets at that date. These gains or losses are recognized over the expected average remaining working lives of the employees participating in the plan.
- 16 -
*SGVMC117102*
Past service costs, if any, are recognized immediately in statement of income, unless the changes to the pension plan are conditional on the employees remaining in service for a specified period of time (the vesting period). In this case, the past-service costs are amortized on a straight-line basis over the vesting period.
The defined benefit asset or liability comprises the present value of the defined benefit obligation less past service costs not yet recognized and less the fair value of plan assets out of which the obligations are to be settled directly. The value of any asset is restricted to the sum of any past service cost not yet recognized and the present value of any economic benefits available in the form of refunds from the plan or reductions in the future contributions to the plan.
Fiduciary Activities Assets and income arising from fiduciary activities together with related undertakings to return such assets to customers are excluded from the financial statements of the Bank when the Bank acts in a fiduciary capacity such as a nominee, trustee or agent.
Provisions Provisions are recognized when the Bank has a present obligation (legal or constructive) as a result of a past event and it is probable that an outflow of resources embodying economic benefits will be required to settle the obligation and a reliable estimate can be made of the amount of the obligation.
Related Party Relationships and Transactions Related party relationship exists when one party has the ability to control, directly, or indirectly through one or more intermediaries, the other party or exercises significant influence over the other party in making financial and operating decisions. Such relationship also exists between and/or among entities which are under common control with the reporting enterprise, or between, and/or among the reporting enterprise and its key management personnel, directors, or its shareholders. In considering each possible related party relationship, attention is directed to the substance of the relationship, and not merely the legal form.
Contingent Liabilities and Contingent Assets Contingent liabilities are not recognized in the financial statements but are disclosed unless the possibility of an outflow of resources embodying economic benefits is remote. Contingent assets are not recognized but are disclosed in the financial statements when an inflow of economic benefits is probable. Where the Bank expects some or all of the provision to be reimbursed, for example an insurance contract, the reimbursement is recognized as a separate asset but only when the reimbursement is virtually certain. The expense relating to any provision is presented in the statement of income at gross of any reimbursement and the reimbursement is recognized as income.
Income Taxes Current taxes Current tax assets and liabilities for the current and prior periods are measured at the amount expected to be recovered from or paid to the taxation authorities. The tax rates and tax laws used to compute the amount are those that are enacted or substantially enacted as of the statement of financial position date.

- 17 -
*SGVMC117102*
Deferred tax Deferred tax is provided on all temporary differences at the statement of financial position date between the tax bases of assets and liabilities and their carrying amounts for financial reporting purposes. Deferred tax liabilities are recognized for all taxable temporary differences, except:
• Where the deferred tax liability arises from the initial recognition of goodwill or of an asset or
liability in a transaction that is not a business combination and, at the time of the transaction, affects neither the accounting income nor taxable income; and
• In respect of taxable temporary differences associated with investment in a subsidiary, where the timing of the reversal of the temporary differences can be controlled and it is probable that the temporary differences will not reverse in the foreseeable future.
Deferred tax assets are recognized for all deductible temporary differences, carryforward of unused tax credits from excess minimum corporate income tax (MCIT) over regular corporate income tax (RCIT) and unused net operating loss carryover (NOLCO), to the extent that it is probable that taxable income will be available against which the deductible temporary differences and carryforward of unused excess MCIT or RCIT and unused NOLCO can be utilized except:
• Where the deferred tax asset relating to the deductible temporary difference arises from the
initial recognition of an asset or liability in a transaction that is not a business combination and, at the time of the transaction, affects neither the accounting income nor taxable income; and
• In respect of deductible temporary differences associated with investment in a subsidiary, deferred tax assets are recognized only to the extent that it is probable that the temporary differences will reverse in the foreseeable future and taxable income will be available against which the temporary differences can be utilized.
The carrying amount of deferred tax assets is reviewed at each statement of financial position date and reduced to the extent that it is no longer probable that sufficient taxable income will be available to allow all or part of the deferred tax assets to be utilized. Unrecognized deferred tax assets are reassessed at each statement of financial position date and are recognized to the extent that it has become probable that future taxable income will allow the deferred tax asset to be recovered.
Deferred tax assets and liabilities are measured at the tax rates that are applicable to the period when the asset is realized or the liability is settled, based on tax rates (and tax laws) that have been enacted or substantively enacted at the statement of financial position date.
Deferred tax assets and liabilities are offset if a legally enforceable right exists to set off current tax assets against current tax liabilities and the deferred taxes relate to the same taxable entity and the same taxation authority.
Events after the Reporting Date Post year-end events that provide additional information about the Bank’s position at the statement of financial position date (adjusting event) are reflected in the financial statements. Post year-end events that are not adjusting events, if any, are disclosed when material to the financial statements.
- 18 -
*SGVMC117102*
Future Changes in Accounting Policies The Bank will adopt the following standards, interpretations and amendments to standards enumerated below when these become effective. Except as otherwise indicated, the Bank does not expect the adoption of these new and amended PFRS and Philippine Interpretations to have significant impact on the financial statements.
Effective in 2012
PFRS 7, Financial Instruments: Disclosures -Enhanced Derecognition Disclosure Requirements The amendment to PFRS 7 is effective for annual periods beginning on or after July 1, 2011. This amendment requires additional disclosures about financial assets that have been transferred but not derecognized to enable the user of the Bank’s financial statements to understand the relationship with those assets that have not been derecognized and their associated liabilities. In addition, the amendment requires disclosures about continuing involvement in derecognized assets to enable the user to evaluate the nature of and the risk associated with the entity’s continuing involvement in those derecognized assets. The amendment affects disclosures only and has no impact on the Bank’s financial position and performance.
PAS 12, Income Taxes - Recovery of Underlying Assets The amendment is effective for annual periods beginning on or after January 1, 2012. The amendment clarified the determination of deferred tax on investment property measured at fair value. The amendment introduces a rebuttable presumption that deferred tax on investment properties measured using fair value model under PAS 40 should be determined on the basis that its carrying amount will be recovered through sale. Furthermore, it introduces the requirement that deferred tax on non-depreciable assets measured using the revaluation model in PAS 16 should always be measured on a sale basis of the asset. Effective in 2013 PAS 1, Financial Statement Presentation - Presentation of Items of Other Comprehensive Income (OCI) The amended standard is effective for annual periods beginning on or after July 1, 2012. The amendments to PAS 1 change the grouping of items presented in OCI. Items that could be reclassified (or “recycled”) to profit or loss at a future point in time (for example, upon derecognition or settlement) would be presented separately from items that will never be reclassified.
PFRS 7, Financial instruments: Disclosures - Offsetting Financial Assets and Financial Liabilities The amendments to PFRS 7 are to be retrospectively applied for annual periods beginning on or after January 1, 2013. These amendments require an entity to disclose information about rights of set-off and related arrangements (such as collateral agreements). The new disclosures are required for all recognized financial instruments that are set off in accordance with PAS 32. These disclosures also apply to recognized financial instruments that are subject to an enforceable master netting arrangement or ‘similar agreement’, irrespective of whether they are set-off in accordance with PAS 32. The amendments require entities to disclose, in a tabular format unless another format is more appropriate, the following minimum quantitative information. This is presented separately for financial assets and financial liabilities recognized at the end of the reporting period: a) The gross amounts of those recognized financial assets and recognized financial liabilities; b) The amounts that are set off in accordance with the criteria in PAS 32 when determining the
net amounts presented in the statement of financial position; c) The net amounts presented in the statement of financial position;

- 19 -
*SGVMC117102*
d) The amounts subject to an enforceable master netting arrangement or similar agreement that
are not otherwise included in (b) above, including: i. Amounts related to recognized financial instruments that do not meet some or all of the
offsetting criteria in PAS 32; and ii. Amounts related to financial collateral (including cash collateral); and
e) The net amount after deducting the amounts in (d) from the amounts in (c) above. The amendment affects disclosures only and has no impact on the Bank’s financial position and performance. PFRS 11, Joint Arrangements This standard is effective for annual periods beginning on or after January 1, 2013. PFRS11 replaces PAS 31, Interest on Joint Ventures and SIC-13 Jointly-controlled Entities - Non-monetary Contributions by Venturers. The standard removes the option to account for a jointly controlled entities (JCEs) using proportionate consolidation. Instead, JCEs that meet the definition of a joint control must be accounted for using the equity method. PFRS 12, Disclosure of Interests in Other Entities This standard is effective for annual periods beginning on or after January 1, 2013. PFRS 12 includes all disclosures that were previously in PAS 27 related to the consolidated financial statements, as well as all the disclosures that were previously included in PAS 31 and PAS 28. These disclosures relate to an entity’s interests in subsidiaries, joint arrangements, associates and structured entities. A number of new disclosures are also required. PFRS 13, Fair Value Measurement This standard is effective for annual periods beginning on or after January 1, 2013. This standard establishes a single source of guidance under PFRS for all fair value measurements. The standard does not change when an entity is required to use fair value, but rather provides guidance on how to measure fair value under PFRS when fair value is required or permitted.
PAS 19, Employee Benefits (Amendment) The amendment is effective for annual periods beginning on or after January 1, 2013. The amendments focus on the following key areas: the elimination of the option to defer the recognition of gains and losses resulting from defined benefit plans (the corridor approach); the elimination of options for the presentation of gains and losses relating to those plans; and the improvement of disclosure requirements that will better show the characteristics of defined benefit plans and the risks arising from those plans. The amendments to the recognition, presentation and disclosure requirements will ensure that the financial statements provide investors and other users with a clear picture of an entity’s commitments resulting from defined benefit plans. PAS 27, Separate Financial Statements (as revised in 2011) The amendment is effective for annual periods beginning on or before January 1, 2013. As a consequence of the new PFRS 10 and PFRS 12, what remains of PAS 27 is limited to accounting for subsidiaries, jointly controlled entities and associates in separate financial statements. PAS 28, Investments in Associates and Joint Ventures (as revised in 2011) The amendment is effective for annual periods beginning on or after January 1, 2013. As a consequence of the new PFRS 11 and PFRS 12, PAS 28 has been renamed PAS 28, Investment in Associates and Joint Ventures. The standard describes the application of the equity method to investments in joint ventures in addition to associates.
- 20 -
*SGVMC117102*
Effective in 2014
PAS 32, Financial Instruments: Presentation - Offsetting Financial Assets and Financial liabilities The amendments to PAS 32 are to be retrospectively applied for annual periods beginning on or after January 1, 2014. These amendments to PAS 32 clarify the meaning of “currently has a legally enforceable right to set-off” and also clarify the application of the PAS 32 offsetting criteria to settlement systems (such as central clearing house systems) which apply gross settlement mechanisms that are not simultaneous. Effective in 2015 PFRS 9, Financial Instruments: Classification and Measurement PFRS 9 as issued reflects the first phase of the IASBs work on the replacement of PAS 39 and applies to classification and measurement of financial assets and financial liabilities as defined in PAS 39. In subsequent phases, the IASB will address hedge accounting and impairment of financial assets. The completion of this project is expected over the course of 2011 or the first half of 2012. Philippine Interpretation IFRIC 15, Agreement for Construction of Real Estate This Interpretation, effective for annual periods beginning on or after January 1, 2015, covers accounting for revenue and associated expenses by entities that undertake the construction of real estate directly or through subcontractors. The Interpretation requires that revenue on construction of real estate be recognized only upon completion, except when such contract qualifies as construction contract to be accounted for under PAS 11, Construction Contracts, or involves rendering of services in which case revenue is recognized based on stage of completion. Contracts involving provision of services with the construction materials and where the risks and reward of ownership are transferred to the buyer on a continuous basis will also be accounted for based on stage of completion.
3. Significant Accounting Judgments and Estimates
The preparation of the financial statements in accordance with PFRS requires the Bank to make estimates and assumptions that affect the reported amounts of assets, liabilities, income and expenses and disclosure of contingent assets and contingent liabilities, if any. Future events may occur which will cause the assumptions used in arriving at the estimates to change. The effects of any change in estimates are reflected in the financial statements as they become reasonably determinable.
Judgments and estimates are continually evaluated and are based on historical experience and other factors, including expectations of future events that are believed to be reasonable under the circumstances.
The following are the critical judgments and key assumptions that have a significant risk of
material adjustment to the carrying amounts of assets and liabilities within the next financial year:
- 21 -
*SGVMC117102*
Judgments In the process of applying the Bank’s accounting policies, management has made the following
judgments, apart from those involving estimations, which have the most significant effect on the amounts recognized in the financial statements:
a. Fair value of financial instruments
Where the fair values of financial assets and financial liabilities recognized or disclosed in the financial statements cannot be derived from active markets, they are determined using an internal valuation techniques that include the use of mathematical models. The input to these models is taken from observable markets where possible, but where this is not feasible, a degree of judgment is required in establishing fair values. Refer to Note 5 for the fair values and the measurement basis of the financial instruments.
b. HTM investments
The classification to HTM investment requires significant judgment. In making this judgment, the Bank evaluates its intention and ability to hold such investments to maturity. Ability to hold the debt securities to maturity is demonstrated by the availability of financial resources to continue to finance the investment until maturity. If the Bank fails to keep these investments to maturity other than in certain specific circumstances, it will be required to reclassify the entire portfolio as AFS investments. The investments would therefore be measured at fair value and not at amortized cost.
c. Financial assets not quoted in an active market
The Bank classifies financial assets by evaluating, among others, whether the asset is quoted or not in an active market. Included in the evaluation on whether a financial asset is quoted in an active market is the determination on whether quoted prices are readily and regularly available, and whether those prices represent actual and regularly occurring market transactions on an arm’s length basis.
d. Operating leases
Bank as lessee The Bank has entered into leases on premises it uses for its operations. The Bank has determined, based on the evaluation of the terms of the lease agreements, that all significant risks and rewards of ownership of the properties are retained by the respective lessors.
e. Contingencies
The Bank is currently involved in various legal proceedings. The estimate of the probable costs for the resolution of these claims has been developed in consultation with outside counsels handling the Bank’s defense in these matters and is based on an analysis of potential results. The Bank currently does not believe that these proceedings will have a material adverse effect on the financial statements. It is possible, however, that future results of operations could be materially affected by changes in the estimates or in the effectiveness of the strategies relating to these proceedings (see Note 26).
f. Functional currency
PAS 21 requires management to use its judgment to determine the entity’s functional currency such that it most faithfully represents the economic effects of the underlying transactions, events and conditions that are relevant to the entity. In making this judgment, the Bank considers the following: • the currency that mainly influences sales prices for financial instruments and services (this
will often be the currency in which sales prices for its financial instruments and services are denominated and settled);

- 22 -
*SGVMC117102*
• the currency in which funds from financing activities are generated; and • the currency in which receipts from operating activities are usually retained.
g. Going concern
The Bank’s management has made an assessment of the Bank’s ability to continue as a going concern and is satisfied that the Bank has the resources to continue in business for the foreseeable future. Furthermore, management is not aware of any material uncertainties that may cast significant doubt upon the Bank’s ability to continue as a going concern. Therefore, the financial statements continue to be prepared on the going concern basis.
Estimates a. Credit losses on loans and receivables
The Bank reviews its individually significant loans and receivables at each statement of financial position date to assess whether an impairment loss should be recorded in the statement of income. In particular, judgment by management is required in the estimation of the amount and timing of future cash flows when determining the impairment loss. In estimating these cash flows, the Bank makes judgments about the borrower’s financial situation and the net realizable value of collateral. These estimates are based on assumptions about a number of factors and actual results may differ, resulting in future changes to the allowance.
Loans and receivables that have been assessed individually and found not to be impaired and all individually insignificant loans and advances are then assessed collectively, in groups of assets with similar characteristics, to determine whether provision should be made due to incurred loss events for which there is objective evidence but whose effects are not yet evident. The collective assessment takes account of data from the loan portfolio, concentrations of risks and economic data.
Provision for credit losses of the Bank amounted to P=58.5 million and P=85.1 million in 2011 and 2010, respectively (see Note 8).
As of December 31, 2011 and 2010, loans and receivables of the Bank, net of allowance for credit losses and unearned discounts and deferred credits, amounted to P=14.7 billion and P=13.6 billion, respectively (see Note 8).
b. Impairment of branch licenses and other nonfinancial assets
Branch license is considered an intangible asset with an indefinite useful life and it is required to be tested for impairment annually by comparing its carrying amount with its recoverable amount, irrespective of whether there is any indication that it may be impaired.
The Bank’s impairment test for branch licenses with indefinite useful lives is based on value in use calculations that use a discounted cash flow model. The cash flows are derived from the budget for the next five years and do not include restructuring activities that the Bank is not yet committed to or significant future investments that will enhance the asset base of the CGU being tested. The recoverable amount is most sensitive to the discount rate used for the discounted cash flow model as well as the expected future cash-inflows and the growth rate used for extrapolation purposes.
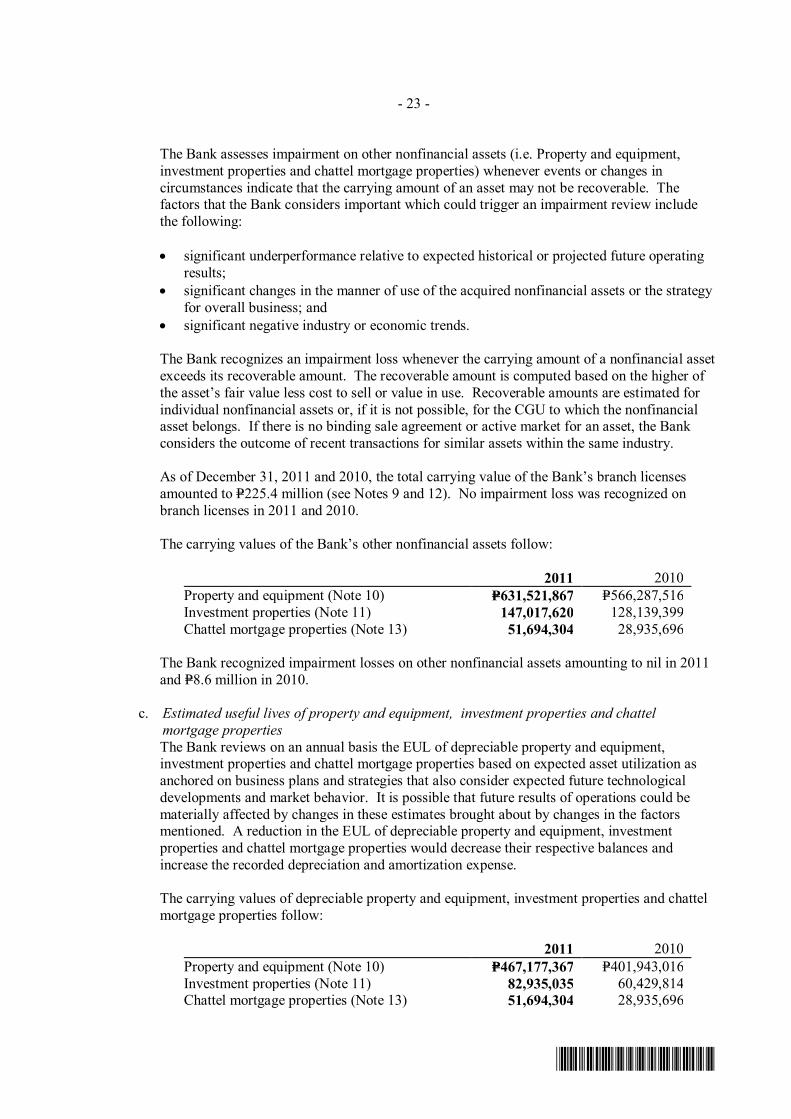
- 23 -
*SGVMC117102*
The Bank assesses impairment on other nonfinancial assets (i.e. Property and equipment, investment properties and chattel mortgage properties) whenever events or changes in circumstances indicate that the carrying amount of an asset may not be recoverable. The factors that the Bank considers important which could trigger an impairment review include the following:
• significant underperformance relative to expected historical or projected future operating
results; • significant changes in the manner of use of the acquired nonfinancial assets or the strategy
for overall business; and • significant negative industry or economic trends.
The Bank recognizes an impairment loss whenever the carrying amount of a nonfinancial asset exceeds its recoverable amount. The recoverable amount is computed based on the higher of the asset’s fair value less cost to sell or value in use. Recoverable amounts are estimated for individual nonfinancial assets or, if it is not possible, for the CGU to which the nonfinancial asset belongs. If there is no binding sale agreement or active market for an asset, the Bank considers the outcome of recent transactions for similar assets within the same industry.
As of December 31, 2011 and 2010, the total carrying value of the Bank’s branch licenses amounted to P=225.4 million (see Notes 9 and 12). No impairment loss was recognized on branch licenses in 2011 and 2010.
The carrying values of the Bank’s other nonfinancial assets follow:
2011 2010 Property and equipment (Note 10) P=631,521,867 P=566,287,516 Investment properties (Note 11) 147,017,620 128,139,399 Chattel mortgage properties (Note 13) 51,694,304 28,935,696
The Bank recognized impairment losses on other nonfinancial assets amounting to nil in 2011 and P=8.6 million in 2010.
c. Estimated useful lives of property and equipment, investment properties and chattel
mortgage properties The Bank reviews on an annual basis the EUL of depreciable property and equipment, investment properties and chattel mortgage properties based on expected asset utilization as anchored on business plans and strategies that also consider expected future technological developments and market behavior. It is possible that future results of operations could be materially affected by changes in these estimates brought about by changes in the factors mentioned. A reduction in the EUL of depreciable property and equipment, investment properties and chattel mortgage properties would decrease their respective balances and increase the recorded depreciation and amortization expense.
The carrying values of depreciable property and equipment, investment properties and chattel mortgage properties follow:
2011 2010 Property and equipment (Note 10) P=467,177,367 P=401,943,016 Investment properties (Note 11) 82,935,035 60,429,814 Chattel mortgage properties (Note 13) 51,694,304 28,935,696
- 24 -
*SGVMC117102*
d. Recognition of deferred tax assets
The Bank reviews the carrying amounts of deferred tax assets at each financial statement of financial position date and reduces to the extent that it is no longer probable that sufficient taxable income will be available to allow all or part of the deferred tax assets utilized. Significant management judgment is required to determine the amount of deferred tax assets that can be recognized, based upon the likely timing and level of future taxable profits together with future tax planning strategies.
The Bank has been in a tax loss position over the past three years. However, estimates of future taxable income indicate that certain temporary differences will be realized in the future. As of December 31, 2011 and 2010, the Bank’s recognized deferred tax assets amounted to P=21.5 million (see Note 22).
As of December 31, 2011 and 2010, the Bank did not recognize deferred tax assets on temporary differences totaling P=353.6 million and P=413.0 million, respectively (see Note 22).
e. Present value of retirement obligation
The cost of defined retirement plan and other post employment benefits is determined using actuarial valuations. The actuarial valuation involves making assumptions about discount rates, expected rates of return on assets, future salary increases, mortality rates and future pension increases. Due to the long-term nature of these plans, such estimates are subject to significant uncertainty. The assumed discount rates were determined using the market yields on Philippine government bonds with terms consistent with the expected employee benefit payouts as of the statement of financial position date.
As of December 31, 2011 and 2010, the accrued retirement obligation (included under ‘Accrued interest, taxes and other expenses’ in the statements of financial position) amounted to P=26.9 million and P=13.3 million, respectively (see Notes 16 and 20).
4. Financial Risk Management Objectives and Policies
Introduction The Bank has exposure to the following risks from its use of financial instruments:
• Credit risk • Liquidity risk • Market risk
Risk management framework The Bank’s BOD has overall responsibility for the oversight of the Bank’s risk management process. The BOD committees, which are responsible for developing, managing and monitoring risk management policies in their specified areas, include the following:
1. Bank Risk Management Committee (RMC) 2. Bank Audit Committee (AC) 3. Bank Asset-Liability Committee (ALCO)
- 25 -
*SGVMC117102*
The RMC, through the Risk Management Group (RMG), is responsible for monitoring the compliance with the Bank’s risk management policies and procedures and, for reviewing the soundness of risk management practices in relation to the risks faced by the Bank.
The RMG serves under the RMC and performs daily market risk analyses to ensure compliance with the Bank’s policies and procedures and makes recommendations based on such analyses. The RMG likewise monitors, supervises and controls the credit acceptance policies, the borrowing account ratings and portfolio development.
AC is responsible for monitoring compliance with the Bank’s risk management policies and procedures, and for reviewing the adequacy of risk management framework in relation to the risks faced by the Bank. The AC is assisted in these functions by Internal Audit (IA). IA undertakes both regular and ad-hoc reviews of risk management controls and procedures, the results of which are reported to the AC.
ALCO is responsible for ensuring that the Bank and all its legal vehicles maintain adequate liquidity, sufficient capital and the appropriate funding to meet all business requirements and comply with all regulatory requirements. It is also responsible to build a stable funding structure by managing the long-term profiles of the Bank’s asset and liability maturities. Moreover, it manages the statement of financial position and ensures that strategies are in accordance with adequate liquidity, capital and diversified funding and establishes asset-liability pricing policies consistent with the strategies for the statement of financial position.
Credit Risk Credit risk is the risk of financial loss to the Bank if a counterparty to a financial instrument fails to meet its contractual obligations. The Bank manages and controls credit risk by setting limits on the amount of risk it is willing to accept for individual counterparties and for geographical and industry concentrations, and by monitoring exposures in relation to such limits. For risk management purposes, credit risk emanating from treasury activities is managed independently, but reported as a component of market risk exposure.
Each business unit is responsible for the quality and performance of its credit portfolio and for monitoring and controlling all credit risks in its portfolio. They are supported by the Credit Risk Control Unit of RMG, whose main task is to evaluate and control credit risks via reviews of loan proposals, credit processes, and accounts administration. Furthermore, regular audits of business units and credit processes are undertaken by IA.
The Bank extends various types of loans, some on clean basis, but mostly against hard collaterals and other form of securities. Personal and salary loans are generally granted on a clean basis. auto loans are secured versus chattel mortgage on the vehicles at 70.0% loan value; real estate loans are secured versus first real estate mortgage at 70.0% to 80.0% loan value. The Bank’s commercial/small-medium enterprise loans cover a mix of clean (unsecured, which include those under personal guarantees) as well as secured credit facilities; i.e. those supported by real estate and chattel mortgages, guarantees and other registered securities at 50.0% to 60.0% loan valuations. Estimates of fair value are based on the value of collateral assessed at the time of the borrowing.
- 26 -
*SGVMC117102*
All loan applications, covering the different types of loans, undergo strict credit evaluation in accordance with established approval criteria, to ensure that there are very strong expectations of repayment. The essential elements that the Bank looks for/at in all its credit dealings and account relationships are: favorable credit checkings; good credit standing and track record with other counterparties, banks and trade partners alike; financial strength and cash generating capabilities (fund sourcing) which translate into adequacy of paying capacity; and acceptable collateral/security, if applicable. Furthermore, loans are subject to approval at different levels of credit authorities, depending on facility risks and magnitudes of potential loan exposures. Management of credit risk The BOD has delegated the responsibility for the managing of credit risk to its Credit Risk Control- Risk Management Group (CRC-RMG), which continuously implements its risk control programs, in line with its oversight function over the Bank’s lending activities. The CRC-RMG is principally tasked with identifying, monitoring, reporting and controlling the Bank’s credit risk. • It takes charge of administering the Bank’s lending policies, ensuring compliance by those
concerned with continuous issuance of updates on policies and process guidelines for bankwide implementation and compliance.
• It spearheads the activities of the Credit Committee, whose main objective is to evaluate and screen commercial loan proposals requiring approvals beyond line management levels.
• It classifies commercial borrowing accounts according to several levels of risk, based on the internal credit risk rating system and regularly determines loan impairments for the purpose of determining the appropriate loan loss reserves.
• It conducts credit stress testing and regularly evaluates and monitors the quality of the Bank’s loan portfolio via the Portfolio Profile Report, as part of the scheme of controlling large concentration and group exposures.
Maximum exposure to credit risk after collateral held or other credit enhancements The Bank’s maximum exposure to on-balance sheet credit risk is equal to the carrying value of its financial assets except for loans and receivables shown below:
2011
Carrying
amountFair value of
collateral
Maximumexposure
to credit risk
Financial Effect of
CollateralCredit risk exposure relating to on-balance sheet items are as follows: Loans and receivables: Receivables from customers: Corporate loans P=8,457,650,238 P=3,315,465,930 P=6,060,438,026 P=2,397,212,212 Consumer loans 4,356,187,112 6,168,808,833 925,729,633 3,430,457,479 Sub-total P=12,813,837,350 9,484,274,763 6,986,167,659 5,827,669,691
Unquoted debt securities 1,442,861,465 – 1,442,861,465 – Accrued interest receivable 215,261,678 – 215,261,678 – Accounts receivable 29,708,125 – 29,708,125 – Sales contracts receivable 188,732,546 176,525,618 21,538,429 167,194,117 P=14,690,401,164 P=9,660,800,381 P=8,695,537,356 P=5,994,863,808

- 27 -
*SGVMC117102*
2010
Carrying
amount Fair value of
collateral
Maximumexposure
to credit risk
Financial Effect of
CollateralCredit risk exposure relating to on-balance sheet items are as follows: Loans and receivables: Receivables from customers:
Corporate loans P=7,849,809,750 P=4,809,274,570 P=5,444,380,889 P=2,405,428,861 Consumer loans 4,150,023,220 5,563,996,354 1,091,346,755 3,058,676,465 Sub-total 11,999,832,970 10,373,270,924 6,535,727,644 5,464,105,326 Unquoted debt securities 1,203,101,409 – 1,203,101,409 – Accrued interest receivable 187,539,417 – 187,539,417 – Accounts receivable 33,880,674 – 33,880,674 – Sales contracts receivable 192,430,372 123,835,187 68,595,185 123,835,187 P=13,616,784,842 P=10,497,106,111 P=8,028,844,329 P=5,587,940,513
Concentration of risks of financial assets with credit risk exposure
The Bank monitors concentration of credit risk of counterparty by industry. The distribution of financial assets and off-balance sheet items by industry sector of the Bank, before taking into account collateral held or other credit enhancements (maximum exposure) follows:
2011
Loans and
Receivables
Loans and Advances to
Banks* Investment
Securities** Others*** Total Financial intermediaries P=579,655,395 P=4,293,759,012 P=2,316,860,754 P=22,594,900 P=7,212,870,061 Philippine government 1,442,861,465 – 3,743,540,818 – 5,186,402,283 Other community, social and
personal activities 4,736,723,503
–
– 1,446,600 4,738,170,103 Real Estate, renting and business
activities 2,803,735,361
–
– 15,241,345 2,818,976,706 Manufacturing 2,287,741,126 – – – 2,287,741,126 Wholesale and retail trade 1,604,636,928 – – – 1,604,636,928 Transportation, storage and
communication 509,347,310
–
–
– 509,347,310 Construction 439,741,516 – – – 439,741,516 Agricultural, hunting and forestry 438,349,900 – – – 438,349,900 Mining and quarrying 48,960,802 – – – 48,960,802 Hotel and restaurants 21,630,043 – – – 21,630,043 14,913,383,349 4,293,759,012 6,060,401,572 39,282,845 25,306,826,778 Less allowance for credit losses 222,982,185 – – – 222,982,185 Total P=14,690,401,164 P=4,293,759,012 P=6,060,401,572 P=39,282,845 P=25,083,844,593 * Comprised of due from BSP, due from other banks and interbank loans receivables and SPURA with the BSP ** Comprised of HFT securities, AFS investments and HTM investments *** Comprised of RCOCI, refundable deposits and contingencies relating to outstanding guarantees
and domestic letters of credit
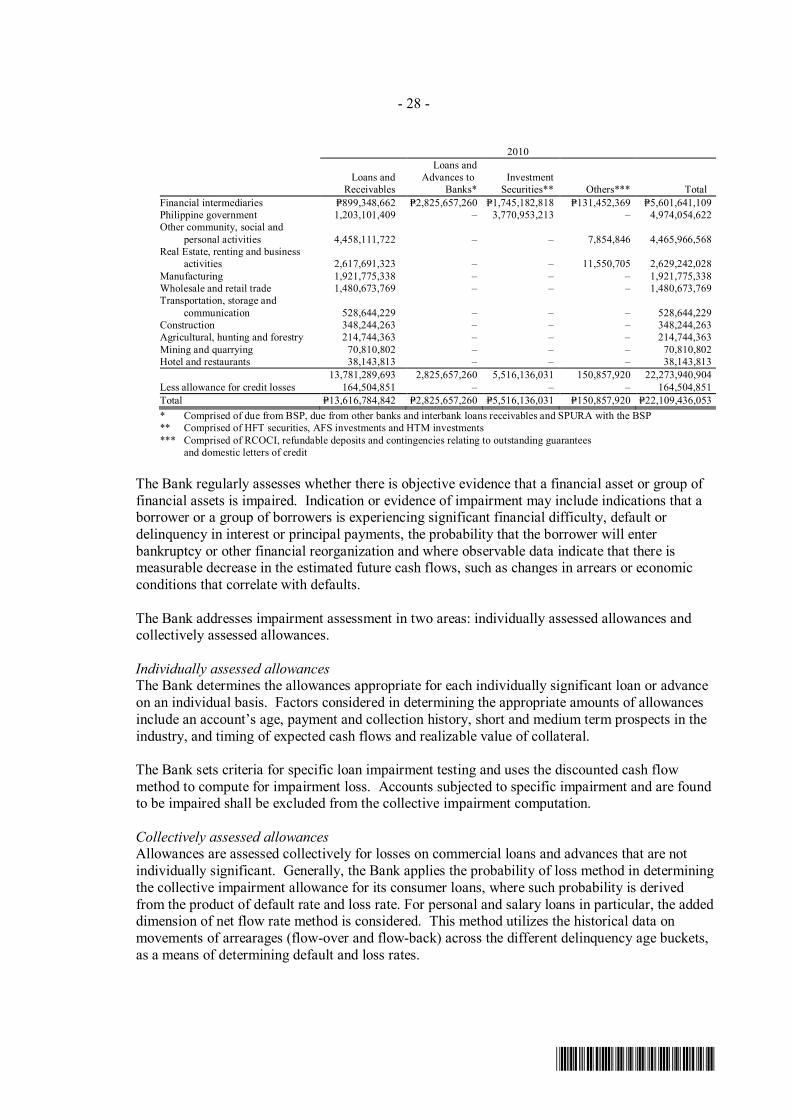
- 28 -
*SGVMC117102*
2010
Loans and
Receivables
Loans and Advances to
Banks* Investment
Securities** Others*** Total Financial intermediaries P=899,348,662 P=2,825,657,260 P=1,745,182,818 P=131,452,369 P=5,601,641,109 Philippine government 1,203,101,409 – 3,770,953,213 – 4,974,054,622 Other community, social and
personal activities 4,458,111,722 – – 7,854,846 4,465,966,568 Real Estate, renting and business
activities 2,617,691,323 – – 11,550,705 2,629,242,028 Manufacturing 1,921,775,338 – – – 1,921,775,338 Wholesale and retail trade 1,480,673,769 – – – 1,480,673,769 Transportation, storage and
communication 528,644,229 – – – 528,644,229 Construction 348,244,263 – – – 348,244,263 Agricultural, hunting and forestry 214,744,363 – – – 214,744,363 Mining and quarrying 70,810,802 – – – 70,810,802 Hotel and restaurants 38,143,813 – – – 38,143,813 13,781,289,693 2,825,657,260 5,516,136,031 150,857,920 22,273,940,904 Less allowance for credit losses 164,504,851 – – – 164,504,851 Total P=13,616,784,842 P=2,825,657,260 P=5,516,136,031 P=150,857,920 P=22,109,436,053 * Comprised of due from BSP, due from other banks and interbank loans receivables and SPURA with the BSP ** Comprised of HFT securities, AFS investments and HTM investments *** Comprised of RCOCI, refundable deposits and contingencies relating to outstanding guarantees
and domestic letters of credit
The Bank regularly assesses whether there is objective evidence that a financial asset or group of financial assets is impaired. Indication or evidence of impairment may include indications that a borrower or a group of borrowers is experiencing significant financial difficulty, default or delinquency in interest or principal payments, the probability that the borrower will enter bankruptcy or other financial reorganization and where observable data indicate that there is measurable decrease in the estimated future cash flows, such as changes in arrears or economic conditions that correlate with defaults.
The Bank addresses impairment assessment in two areas: individually assessed allowances and collectively assessed allowances.
Individually assessed allowances The Bank determines the allowances appropriate for each individually significant loan or advance on an individual basis. Factors considered in determining the appropriate amounts of allowances include an account’s age, payment and collection history, short and medium term prospects in the industry, and timing of expected cash flows and realizable value of collateral.
The Bank sets criteria for specific loan impairment testing and uses the discounted cash flow method to compute for impairment loss. Accounts subjected to specific impairment and are found to be impaired shall be excluded from the collective impairment computation.
Collectively assessed allowances Allowances are assessed collectively for losses on commercial loans and advances that are not individually significant. Generally, the Bank applies the probability of loss method in determining the collective impairment allowance for its consumer loans, where such probability is derived from the product of default rate and loss rate. For personal and salary loans in particular, the added dimension of net flow rate method is considered. This method utilizes the historical data on movements of arrearages (flow-over and flow-back) across the different delinquency age buckets, as a means of determining default and loss rates.

- 29 -
*SGVMC117102*
Credit quality per class of financial assets
In compliance with BSP Circular No. 439, the Bank has developed and continually reviews and calibrates its internal risk rating system for large exposures aimed at uniformly assessing its credit portfolio in terms of risk profile. Where appropriate, it obtains security, enters into master-netting agreements, and limits the duration of exposures to maintain and even further enhance the quality of the Bank’s credit exposures.
The credit quality of trading and financial investment securities is generally monitored through the external ratings of eligible external credit assessment rating institutions. Presented below is the mapping of the credit risk rating from external rating agencies to the Bank’s internal risk rating for investment securities:
A. Moody Rating:
Credit Quality Rating
High Grade Aaa Aa A Baa Standard Grade Ba B Substandard Grade Caa Ca C Impaired D
B. S&P Rating:
Credit Quality Rating
High Grade AAA AA A Standard Grade BBB BB B Substandard Grade CCC CC C Impaired RD D
C. Fitch Rating:
Credit Quality Rating
High Grade AAA AA A Standard Grade BBB BB B Substandard Grade CCC CC C Impaired RD D
D. Philratings:
Credit Quality Rating
High Grade Aaa Aa A Standard Grade Baa Ba Substandard Grade B Caa Ca Impaired C
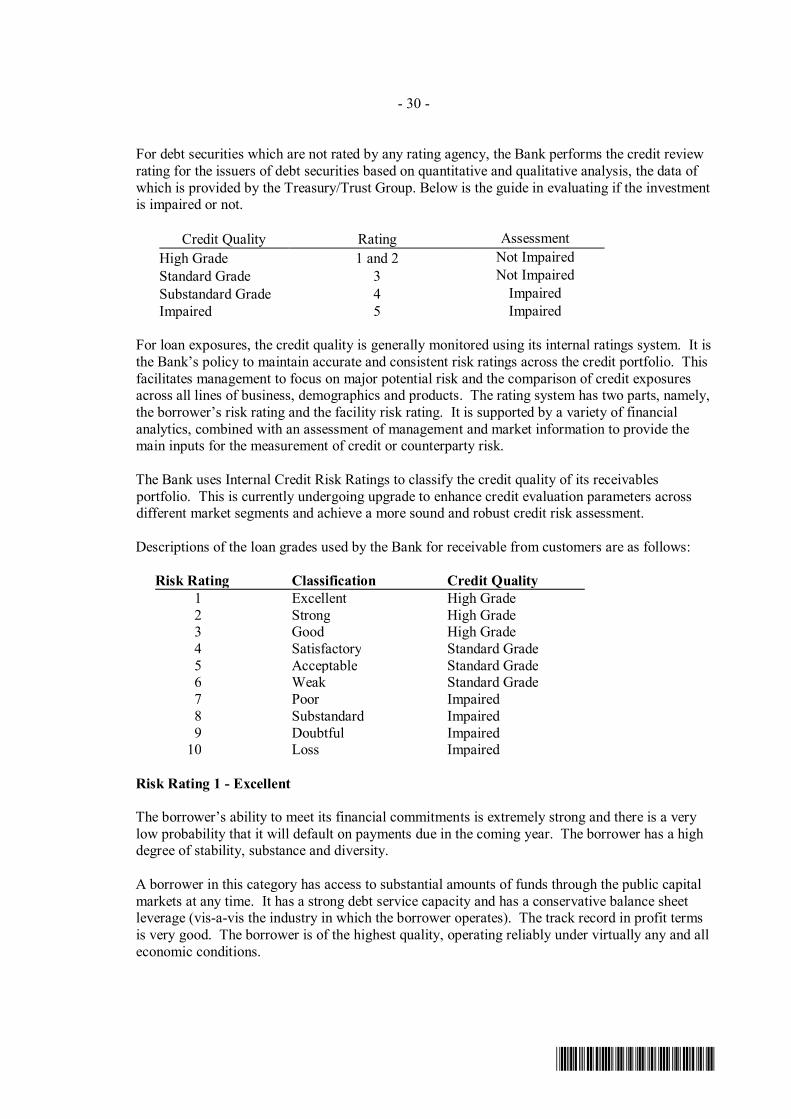
- 30 -
*SGVMC117102*
For debt securities which are not rated by any rating agency, the Bank performs the credit review rating for the issuers of debt securities based on quantitative and qualitative analysis, the data of which is provided by the Treasury/Trust Group. Below is the guide in evaluating if the investment is impaired or not.
Credit Quality Rating Assessment High Grade 1 and 2 Not Impaired Standard Grade 3 Not Impaired Substandard Grade 4 Impaired Impaired 5 Impaired
For loan exposures, the credit quality is generally monitored using its internal ratings system. It is the Bank’s policy to maintain accurate and consistent risk ratings across the credit portfolio. This facilitates management to focus on major potential risk and the comparison of credit exposures across all lines of business, demographics and products. The rating system has two parts, namely, the borrower’s risk rating and the facility risk rating. It is supported by a variety of financial analytics, combined with an assessment of management and market information to provide the main inputs for the measurement of credit or counterparty risk.
The Bank uses Internal Credit Risk Ratings to classify the credit quality of its receivables portfolio. This is currently undergoing upgrade to enhance credit evaluation parameters across different market segments and achieve a more sound and robust credit risk assessment.
Descriptions of the loan grades used by the Bank for receivable from customers are as follows:
Risk Rating Classification Credit Quality
1 Excellent High Grade 2 Strong High Grade 3 Good High Grade 4 Satisfactory Standard Grade 5 Acceptable Standard Grade 6 Weak Standard Grade 7 Poor Impaired 8 Substandard Impaired 9 Doubtful Impaired
10 Loss Impaired
Risk Rating 1 - Excellent
The borrower’s ability to meet its financial commitments is extremely strong and there is a very low probability that it will default on payments due in the coming year. The borrower has a high degree of stability, substance and diversity.
A borrower in this category has access to substantial amounts of funds through the public capital markets at any time. It has a strong debt service capacity and has a conservative balance sheet leverage (vis-a-vis the industry in which the borrower operates). The track record in profit terms is very good. The borrower is of the highest quality, operating reliably under virtually any and all economic conditions.

- 31 -
*SGVMC117102*
Risk Rating 2 - Strong
The borrower’s ability to meet its financial commitments is very strong and there is a low probability that it will default on payments due in the coming year. The borrower normally has a comfortable degree of stability, substance and diversity. Under normal market conditions, borrowers in this category have good access to public markets to raise funds.
Borrower has a strong market and financial position with a history of successful performance. The overall debt service capacity as measured by cash flow to total debt service is very strong; the critical balance sheet ratios (vis-à-vis applicable industry) are conservative.
These borrowers herein categorized are described as quality multinational or local corporations which are adequately capitalized and operating profitably.
Risk Rating 3 - Good
The borrower’s ability to meet its financial commitments is strong. It may be described as big or small corporation whose access to public capital markets or to alternative financial markets is easy, may be limited to periods of favorable economic and/or market conditions.
A borrower in this category usually exhibits characteristics of some degree of stability and substance and the probability of default is still quite low. However, it may still be susceptible to the negative effects of cyclical business changes.
Typical traits include a combination of comfortable asset protection and an acceptable balance sheet structure (vis-à-vis that industry). The debt service capacity as measured by cash flow analysis is strong.
Risk Rating 4 - Satisfactory
The borrower has adequate capacity to meet its financial commitments.
Borrower operates in an environment where clear risk elements exist and the probability of default is somewhat greater. This probability is reflected in volatility of earnings and overall performance. A borrower in this category normally has limited access to public financial markets. It should be able to withstand normal business cycles, but any prolonged unfavorable economic climate may create gradual deterioration in its financial health.
Typical for this kind of borrower is the combination of reasonably sound asset and cash flow protection. The debt service capacity as measured by cash flow is deemed adequate. The borrower has reported profits for the past fiscal year and is expected to report a profit in the current year.
Risk Rating 5 - Acceptable
The borrower is less vulnerable but faces major ongoing uncertainties and exposure to adverse business, financial, or economic conditions that could lead to its inadequate capacity to meet its financial commitments.

- 32 -
*SGVMC117102*
This category represents borrowers who may still be able to withstand normal business cycles; however any prolonged unfavorable economic and/or market condition would create an immediate deterioration beyond acceptable levels.
This category will apply where the risk is still acceptable for the following reasons:
There is sufficient cash flow either historically or expected for the future, in spite of an economic downturn combined with asset protection; or
There is a new business or project finance transaction.
Risk Rating 6 - Weak
The borrower is more vulnerable but currently has the capacity to meet its financial commitments. Adverse business, financial, or economic conditions will likely impair the borrower’s capacity or willingness to meet its financial requirements.
This category represents the type of borrower for which unfavorable industry or company-specific risk factors represent a concern. Operating performance and financial strength may be marginal and it is uncertain whether the borrower can attract alternative sources of financing. Typically, the borrower will find it very hard to cope with any significant economic downturn and a default in such a case is more than a possibility.
Generally, a borrower in this category incurs net losses for one or more years. Normally there is an expectation that conditions will improve and the rating may be upgraded. Any deterioration, however, will almost certainly result in an automatic downgrade.
In summary, this category includes those borrowers where the credit exposure is not at risk of loss at the moment, but wherein performance has weakened, and unless present trends are reversed, could lead to losses.
Risk Rating 7 - Poor
The borrower is currently vulnerable and is dependent on favorable business, financial and economic conditions to meet its financial obligations.
A borrower in this category is characterized by some probability of default, manifested by some or all of the following:
• Evidence of weakness in the borrower’s financial condition or creditworthiness; • Unacceptable risk generated by potential or emerging weaknesses as far as asset protection
and/or cash flow is concerned. Concerns center on the potential for a continuation of unfavorable economic, market, or borrower specific conditions or trends, which may affect future debt service capacity.
• Indications that the borrower’s ability or willingness to service debt are in doubt. • Necessity or strong likelihood for rescheduling of the loan. • Decline in values of, or adverse developments on, collaterals securing the loan.
- 33 -
*SGVMC117102*
Risk Rating 8 - Substandard
The borrower is currently highly vulnerable and is in a state of default.
Substandard loans are loans or portions thereof which appear to involve a substantial and unreasonable degree of risk to the Bank because of unfavorable or unsatisfactory characteristics. These well-defined adverse elements exist in such loans where there is a possibility of future loss to the institution unless given closer supervision. Such may include adverse trends or development of a financial, managerial, economic or political nature or significant weakness in collateral. Basic characteristics are:
• Past due and circumstances are such that there is an imminent possibility of foreclosure or
acquisition of the collateral because of failure of all collection efforts; • Past due loans to borrowers whose properties securing the loan have declined in value
materially or have been found with defects as to ownership or other adverse information; • Current loans to borrowers whose financial statements audited by SEC-accredited external
auditors show impaired/negative net worth except for startup firms which should be elevated on a case-to-case basis;
• Renewed loans of borrowers with declining trend in operations, illiquidity, or increasing leverage trend in the borrower’s financial statements without at least 20.0% repayment of the principal before renewal or extension;
• Current loans of borrowers with unfavorable results of operations for two consecutive years or with impaired/negative net worth except for startup firms which should be evaluated on a case-to-case basis;
• Loans under litigation; • Loans past due for more than 90 days.
Risk Rating 9 - Doubtful
Borrower is in a state of default, where any of the following factors are present:
• Account is already in “non-performing loan” (NPL) status; • Any portion of any interest and/or principal repayment is in arrears for more than 90 days; • The borrower is unable or unwilling to service debt over an extended period of time and near
future prospects of orderly debt service is doubtful. • Overdue loans wherein the prospects of fully applying the collaterals is impaired due to
material declines in market values, or subject of adverse claim.
The extent of probability of loss cannot be exactly quantified at this time. Although the possibility of loss is significant, there may be certain important and reasonably specific pending factors that can work to the advantage of the creditor Bank and result in a strengthening of assets of the borrower. Pending factors include merger, acquisition, capital injection and additional cover.
Risk Rating 10 - Loss
Borrower is in a state of default and the prospect for re-establishment of creditworthiness and debt service is remote.
This category also applies where the Bank will take or has taken title to the assets of the borrower and is preparing a foreclosure and/or liquidation of the company.
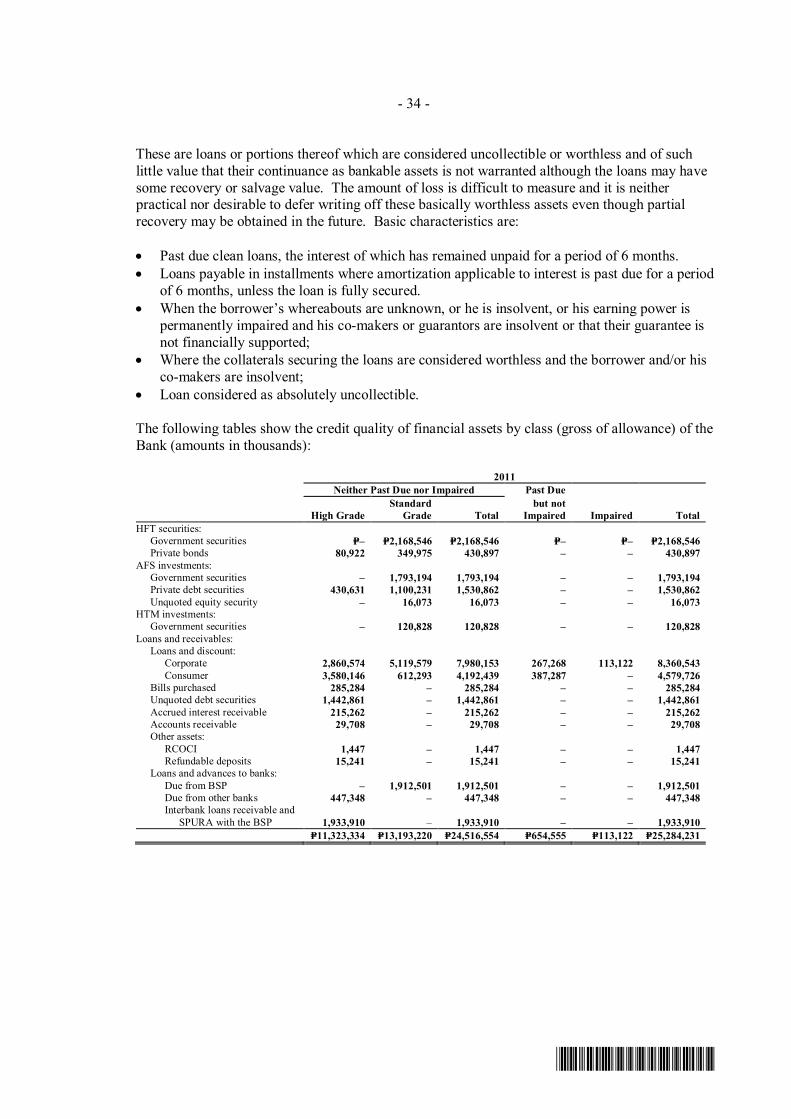
- 34 -
*SGVMC117102*
These are loans or portions thereof which are considered uncollectible or worthless and of such little value that their continuance as bankable assets is not warranted although the loans may have some recovery or salvage value. The amount of loss is difficult to measure and it is neither practical nor desirable to defer writing off these basically worthless assets even though partial recovery may be obtained in the future. Basic characteristics are:
• Past due clean loans, the interest of which has remained unpaid for a period of 6 months. • Loans payable in installments where amortization applicable to interest is past due for a period
of 6 months, unless the loan is fully secured. • When the borrower’s whereabouts are unknown, or he is insolvent, or his earning power is
permanently impaired and his co-makers or guarantors are insolvent or that their guarantee is not financially supported;
• Where the collaterals securing the loans are considered worthless and the borrower and/or his co-makers are insolvent;
• Loan considered as absolutely uncollectible.
The following tables show the credit quality of financial assets by class (gross of allowance) of the Bank (amounts in thousands):
2011 Neither Past Due nor Impaired Past Due
High Grade Standard
Grade Total but not
Impaired Impaired Total HFT securities: Government securities P=– P=2,168,546 P=2,168,546 P=– P=– P=2,168,546 Private bonds 80,922 349,975 430,897 – – 430,897 AFS investments: Government securities – 1,793,194 1,793,194 – – 1,793,194 Private debt securities 430,631 1,100,231 1,530,862 – – 1,530,862 Unquoted equity security – 16,073 16,073 – – 16,073 HTM investments: Government securities – 120,828 120,828 – – 120,828 Loans and receivables: Loans and discount: Corporate 2,860,574 5,119,579 7,980,153 267,268 113,122 8,360,543 Consumer 3,580,146 612,293 4,192,439 387,287 – 4,579,726 Bills purchased 285,284 – 285,284 – – 285,284 Unquoted debt securities 1,442,861 – 1,442,861 – – 1,442,861 Accrued interest receivable 215,262 – 215,262 – – 215,262 Accounts receivable 29,708 – 29,708 – – 29,708 Other assets: RCOCI 1,447 – 1,447 – – 1,447 Refundable deposits 15,241 – 15,241 – – 15,241 Loans and advances to banks: Due from BSP – 1,912,501 1,912,501 – – 1,912,501 Due from other banks 447,348 – 447,348 – – 447,348 Interbank loans receivable and
SPURA with the BSP 1,933,910
– 1,933,910
–
– 1,933,910 P=11,323,334 P=13,193,220 P=24,516,554 P=654,555 P=113,122 P=25,284,231

- 35 -
*SGVMC117102*
2010 Neither Past Due nor Impaired Past Due
High Grade Standard
Grade Total but not
Impaired Impaired Total HFT securities: Government securities P=– P=1,233,142 P=1,233,142 P=– P=– P=1,233,142 Private bonds 79,983 397,561 477,544 – – 477,544 AFS investments: Government securities – 2,406,922 2,406,922 – – 2,406,922 Private debt securities 646,787 620,852 1,267,639 – – 1,267,639 HTM investments: Government securities – 130,889 130,889 – – 130,889 Loans and receivables: Loans and discount: Corporate 2,718,620 4,412,618 7,131,238 – 271,683 7,402,921 Consumer 3,269,335 726,666 3,996,001 311,686 4,307,687 Bills purchased – 646,161 646,161 – – 646,161 Unquoted debt securities 1,203,101 – 1,203,101 – – 1,203,101 Accrued interest receivable 187,539 – 187,539 – – 187,539 Accounts receivable 33,881 – 33,881 – – 33,881 Other assets: RCOCI 7,855 – 7,855 – – 7,855 Refundable deposits 11,551 – 11,551 – – 11,551 Loans and advances to banks: Due from BSP – 636,104 636,104 – – 636,104 Due from other banks 569,553 – 569,553 – – 569,553 Interbank loans receivable and
SPURA with the BSP 1,620,000 – 1,620,000 – – 1,620,000 P=10,348,205 P=11,210,915 P=21,559,120 P=311,686 P=271,683 P=22,142,489
The table below shows the aging analysis of past due but not specifically impaired loans and
receivables by class (in thousands).
2011
Less than
30 days 31 to
60 days 61 to
90 days 91 to
180 days Over
180 days Total Loans and discount: Corporate P=– P=34,689 P=2,081 P=– P=230,498 P=267,268 Consumer 2,105 7,809 41,610 51,845 283,918 387,287 Total P=2,105 P=42,498 P=43,691 P=51,845 P=514,416 P=654,555
2010
Less than
30 days 31 to
60 days 61 to
90 days 91 to
180 days Over
180 days Total Loans and discount: Consumer P=27,095 P=22,910 P=27,068 P=63,232 P=171,381 P=311,686
The above aging analysis already excludes accounts that have been assessed to be specifically impaired. Further, the definition of past due follows that of PFRS 7, which states that a financial asset is past due when the counterparty has failed to make a principal or interest payment when due.
See Note 8 for the detailed information with respect to the Bank’s allowance for credit losses on loans and receivables.
Collateral and other credit risk mitigation The amount and type of collateral required depends on an assessment of the credit risk of the obligor. The Bank implements certain requirements regarding the acceptability of types of collateral and valuation.

- 36 -
*SGVMC117102*
Collateral comes in the form of financial or non-financial assets. The main types of collateral obtained include cash or securities, charges over real estate or chattel properties, inventory and trade receivables and mortgages over residential properties. The Bank also obtains guarantees from parent companies for loans of borrowing entities belonging to a group of companies. The Bank monitors the market value of collateral, and request for additional collateral in accordance with the underlying agreement, and monitors the market value of collateral obtained during its review of the adequacy of the allowances for credit losses. The following tables show the fair value of collateral held against neither past due nor impaired loans and receivables of the Bank:
2011 2010 Properties P=7,687,227,460 P=7,124,719,101 Deposits 1,433,399,003 1,285,956,025
P=9,120,626,463 P=8,410,675,126 It is the Bank’s policy to dispose assets acquired in an orderly fashion. Such assets for disposal
are offered for sale through public bidding (only after they are appraised anew to determine current market values; and duly bidded for, based on the approved minimum bid price/s). The proceeds of the sale of the foreclosed assets classified as ‘Investment properties’ are used to reduce or repay the outstanding claim.
Liquidity Risk Liquidity risk is generally defined as the current and prospective risk to earnings or capital arising from the Bank’s inability to meet its obligations when they come due without incurring unacceptable losses or costs. Specifically, this pertains to events that may necessitate the Bank to enter into transactions that would realize significant losses or costs in order to meet its obligations when they fall due.
ALCO is responsible for formulating the Bank’s liquidity risk management policies, whereas the RMG is responsible for monitoring such risks. Liquidity management is among the most important activities conducted within the Bank. The Bank manages its liquidity risk through analyzing net funding requirements under alternative scenarios, diversification of funding sources and contingency planning. The Bank utilizes a diverse range of sources of funds, although short-term deposits made with the Bank’s network of domestic branches comprise the majority of such funding.
The Bank’s liquidity risk is managed by holding sufficient liquid assets of appropriate quality to ensure short-term funding requirements are met with minimum sacrifice to market price and by maintaining a balanced loan portfolio which is repriced on a regular basis. Deposits with banks are made on a short-term basis with almost all being available on demand or within three months.
The Treasury Bank uses liquidity forecast models that estimate the Bank’s cash flow needs based on the Bank’s actual contractual obligations and under normal circumstances and extraordinary circumstances. The RMG prepares a monthly maximum cumulative outflow report, which is an analysis of maturity gaps of the Bank’s assets and liabilities.

- 37 -
*SGVMC117102*
Aging of financial liabilities by remaining contractual maturities
The tables below summarize the maturity profile of the Bank’s financial liabilities and financial assets used for liquidity management based on contractual undiscounted payments as of December 31, 2011 and 2010: 2011 On demand Within 30 days 31 to 60 days 61 to 180 days 181 to 360 days Over 360 days Total Financial Assets HFT securities P=– P=31,974,303 P=– P=49,288,153 P=81,262,456 P=4,709,002,508 P=4,871,527,420 AFS investments – 33,238,286 5,762,200 89,232,392 128,232,878 6,024,110,326 6,280,576,082 HTM investments – 4,789,520 – – 4,789,520 266,203,482 275,782,522 Loans and receivables: COCI 591,123,145 – – – – – 591,123,145 Due from BSP – 1,912,501,244 – – – – 1,912,501,244 Due from other banks – 447,348,222 – – – – 447,348,222 Interbank loans receivable
and SPURA with the BSP – 1,933,909,546 – – – – 1,933,909,546
Loans and receivables: Loans and discounts – 2,119,230,026 1,384,951,794 2,409,710,115 2,364,209,116 5,021,959,901 13,300,060,952 Unquoted debt
securities – – 18,258,750 – 18,258,750 1,469,152,407 1,505,669,907 Accrued interest
receivable – 136,176,509 51,082,022 28,003,147 – – 215,261,678 Accounts receivable – 5,186,335 1,576,036 2,364,053 4,728,107 15,853,594 29,708,125 591,123,145 6,624,353,991 1,461,630,802 2,578,597,860 2,601,480,827 17,506,282,218 31,363,468,843 Financial Liabilities Deposit liabilities: Demand 3,978,159,770 – – – – – 3,978,159,770 Savings – 46,854,617 93,709,234 140,563,851 281,127,703 562,255,406 1,124,510,811 Time – 1,733,905,376 3,287,310,541 3,286,554,071 364,643 10,490,951,354 18,799,085,985 3,978,159,770 1,780,759,993 3,381,019,775 3,427,117,922 281,492,346 11,053,206,760 23,901,756,566 Manager’s checks – 78,024,579 – – – – 78,024,579 Bills payable – 121,492,338 – – – – 121,492,338 Accrued interest and other
expenses – 78,413,628 8,007,891 10,530,065 15,133,040 29,183,813 141,268,437 Other liabilities* – 722,327,995 258,258 722,586,253 3,978,159,770 2,781,018,533 3,389,285,924 3,437,647,987 296,625,386 11,082,390,573 24,965,128,173 Net financial assets (liabilities) (P=3,387,036,625) P=3,843,335,458 (P=1,927,655,122) (P=859,050,127) P=2,304,855,441 P=6,423,891,645 P=6,398,340,670
* Comprised of accounts payable, due to PDIC, payment orders payable and bills purchased-contra
2010 On demand Within 30 days 31 to 60 days 61 to 180 days 181 to 360 days Over 360 days Total Financial Assets HFT securities P=– P=6,914,550 P=9,026,925 P=41,697,331 P=53,369,886 P=3,184,514,498 P=3,295,523,190 AFS investments 19,528,925 8,081,600 116,386,028 148,745,192 6,603,044,466 6,895,786,211 HTM investments – – 4,789,520 397,300 5,186,820 292,977,240 303,350,880 Loans and receivables: COCI 625,873,173 – – – – – 625,873,173 Due from BSP – 461,852,118 175,452,257 – – – 637,304,375 Due from other banks – 569,552,885 – – – – 569,552,885 Interbank loans
receivable and SPURA with the BSP – 1,620,360,000 – – – – 1,620,360,000
Loans and receivables: Loans and discounts – 1,364,431,867 946,468,359 2,552,289,635 2,102,563,195 5,226,510,286 12,192,263,342 Unquoted debt
securities – – 18,258,750 – 18,258,750 1,271,518,278 1,308,035,778 Accrued interest
receivable – 117,586,105 25,310,801 44,642,511 – – 187,539,417 Accounts receivable – 6,140,391 951,546 3,806,182 5,709,273 17,273,282 33,880,674 625,873,173 4,166,366,841 1,188,339,758 2,759,218,987 2,333,833,116 16,595,838,050 27,669,469,925 Financial Liabilities Deposit liabilities: Demand 3,137,521,048 – – – – – 3,137,521,048 Savings – 38,595,181 38,595,181 150,495,333 208,258,734 435,944,430 871,888,859 Time – 1,580,872,849 1,526,454,883 4,524,044,985 – 11,252,613,199 18,883,985,916 3,137,521,048 1,619,468,030 1,565,050,064 4,674,540,318 208,258,734 11,688,557,629 22,893,395,823 Manager’s checks – 63,324,279 – – – – 63,324,279 Bills payable – 1,372,123 15,931,704 71,047,954 – – 88,351,781 Accrued interest and other
expenses – 32,677,766 3,594,095 11,194,539 13,291,782 48,134,621 108,892,803 Other liabilities* – 1,090,104,883 196,086 – – – 1,090,300,969 3,137,521,048 2,806,947,081 1,584,771,949 4,756,782,811 221,550,516 11,736,692,250 24,244,265,655 Net financial assets
(liabilities) (P=2,511,647,875) P=1,359,419,760 (P=396,432,191) (P=1,997,563,824) P=2,112,282,600 P=4,859,145,800 P=3,425,204,270 * Comprised of accounts payable, due to PDIC, payment orders payable and bills purchased-contra

- 38 -
*SGVMC117102*
Market Risk Market risk is the risk of loss to future earnings, fair values or future cash flows as a result of changes in interest rates, foreign currency exchange rates, commodity prices, equity prices and other market changes. The Bank’s market risk originates from its holdings in its debt securities.
ALCO, chaired by the Head of Treasury, is the senior review and decision-making body for the management of all related market risks. In managing market risk, the Bank uses a framework of policies and procedures, measurement tools, controls and limits. The Treasury Group manages asset/liability risks arising from both normal banking operations and from trading operations in financial markets. Daily monitoring of compliance to the policies, procedures and limits is performed by the Market Risk Unit under RMG. The limits are annually reviewed by the ALCO and RMG and approved by the BOD. The RMG regularly reports to ALCO and to the RMC, which is a sub-committee of the BOD.
The Treasury Group manages asset/liability risks arising from both normal banking operations and from trading operations in financial markets.
Interest rate risk The Bank follows a prudent policy on managing its assets and liabilities so as to ensure that exposure to fluctuations in interest rates are kept within acceptable limits.
The Bank measures the sensitivity of its assets and liabilities to interest rate fluctuations by way of Earnings-at-Risk (EaR).
EaR is a measure of likely earnings volatility for accrual portfolios. It is calculated as the change in income over the next 12 months, given current exposures that will result from one-year standard deviation change in interest rates, updated quarterly. EaR is calculated based on 99.0% confidence level. It is accomplished monthly, with quarterly stress test. The following tables demonstrate the sensitivity to a reasonable possible change in interest rates of the Bank’s net interest income and equity with all other variables held constant (amounts in millions).
2011 Increase (Decrease) in Basis Points 50 100 (50) (100) Change in net interest income Loans and receivables P=39.60 P=79.20 (P=39.60) (P=79.20) Deposit liabilities (119.48) (238.96) 119.48 238.96As a percentage of the Bank’s net
interest income for the year 10% 20% (10%) (20%)Change in trading gains from HFT
securities (P=110.05) (P=214.02) P=119.59 P=246.59Change in equity* AFS investments (114.39) (186.70) 43.39 129.56
* The impact on the Bank’s equity already excludes the impact on transactions affecting the statement of income.
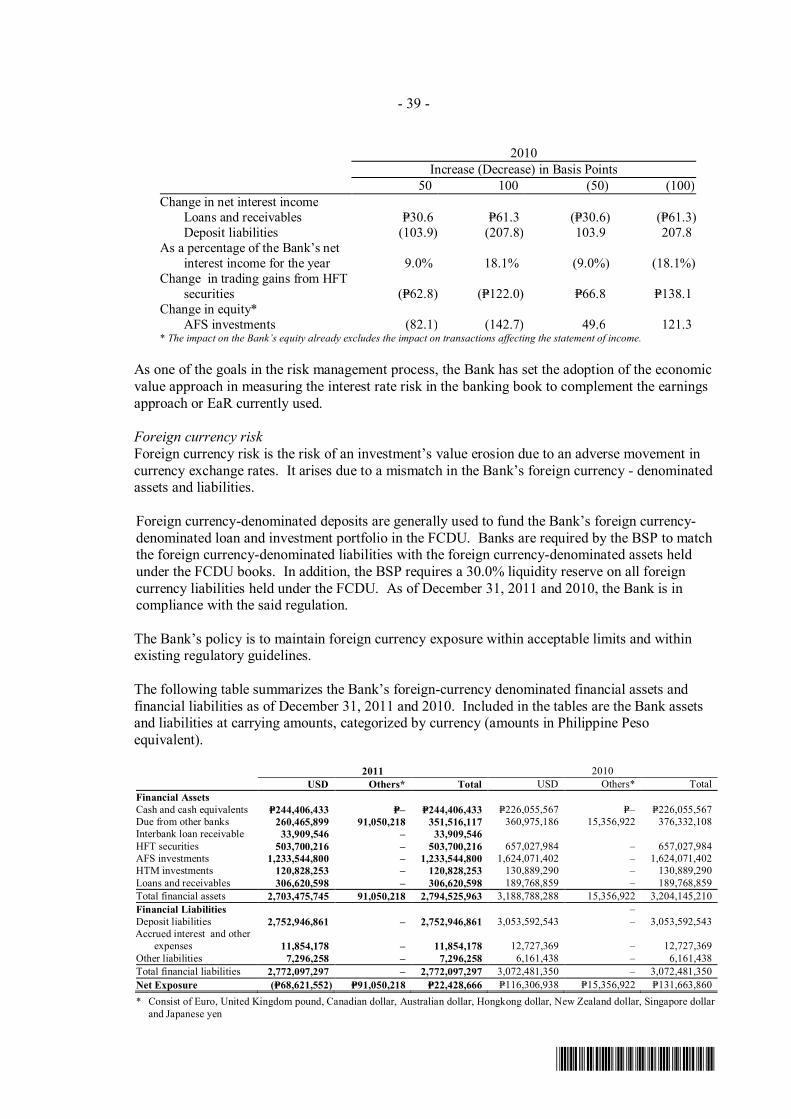
- 39 -
*SGVMC117102*
2010 Increase (Decrease) in Basis Points 50 100 (50) (100) Change in net interest income Loans and receivables P=30.6 P=61.3 (P=30.6) (P=61.3) Deposit liabilities (103.9) (207.8) 103.9 207.8 As a percentage of the Bank’s net
interest income for the year 9.0% 18.1% (9.0%) (18.1%) Change in trading gains from HFT
securities (P=62.8) (P=122.0) P=66.8 P=138.1 Change in equity* AFS investments (82.1) (142.7) 49.6 121.3
* The impact on the Bank’s equity already excludes the impact on transactions affecting the statement of income.
As one of the goals in the risk management process, the Bank has set the adoption of the economic value approach in measuring the interest rate risk in the banking book to complement the earnings approach or EaR currently used.
Foreign currency risk Foreign currency risk is the risk of an investment’s value erosion due to an adverse movement in currency exchange rates. It arises due to a mismatch in the Bank’s foreign currency - denominated assets and liabilities.
Foreign currency-denominated deposits are generally used to fund the Bank’s foreign currency-denominated loan and investment portfolio in the FCDU. Banks are required by the BSP to match the foreign currency-denominated liabilities with the foreign currency-denominated assets held under the FCDU books. In addition, the BSP requires a 30.0% liquidity reserve on all foreign currency liabilities held under the FCDU. As of December 31, 2011 and 2010, the Bank is in compliance with the said regulation.
The Bank’s policy is to maintain foreign currency exposure within acceptable limits and within existing regulatory guidelines. The following table summarizes the Bank’s foreign-currency denominated financial assets and financial liabilities as of December 31, 2011 and 2010. Included in the tables are the Bank assets and liabilities at carrying amounts, categorized by currency (amounts in Philippine Peso equivalent).
2011 2010 USD Others* Total USD Others* Total Financial Assets Cash and cash equivalents P=244,406,433 P=– P=244,406,433 P=226,055,567 P=– P=226,055,567 Due from other banks 260,465,899 91,050,218 351,516,117 360,975,186 15,356,922 376,332,108 Interbank loan receivable 33,909,546 – 33,909,546 HFT securities 503,700,216 – 503,700,216 657,027,984 – 657,027,984 AFS investments 1,233,544,800 – 1,233,544,800 1,624,071,402 – 1,624,071,402 HTM investments 120,828,253 – 120,828,253 130,889,290 – 130,889,290 Loans and receivables 306,620,598 – 306,620,598 189,768,859 – 189,768,859 Total financial assets 2,703,475,745 91,050,218 2,794,525,963 3,188,788,288 15,356,922 3,204,145,210 Financial Liabilities – Deposit liabilities 2,752,946,861 – 2,752,946,861 3,053,592,543 – 3,053,592,543 Accrued interest and other
expenses 11,854,178 – 11,854,178 12,727,369 – 12,727,369 Other liabilities 7,296,258 – 7,296,258 6,161,438 – 6,161,438 Total financial liabilities 2,772,097,297 – 2,772,097,297 3,072,481,350 – 3,072,481,350 Net Exposure (P=68,621,552) P=91,050,218 P=22,428,666 P=116,306,938 P=15,356,922 P=131,663,860 * Consist of Euro, United Kingdom pound, Canadian dollar, Australian dollar, Hongkong dollar, New Zealand dollar, Singapore dollar
and Japanese yen

- 40 -
*SGVMC117102*
The following table sets forth the impact of reasonably possible changes in the USD exchange rate on the Bank’s net income (amounts in millions):
2011 Increase (Decrease) in Currency Rates 5.0% 10.0% (5.0%) (10.0%)USD P=1.50 P=3.01 (P=1.50) (P=3.01)
2010 Increase (Decrease) in Currency Rates 5.0% 10.0% (5.0%) (10.0%) USD P=5.8 P=11.6 (P=5.8) (P=11.6)
The increase in USD exchange rate represents depreciation of Philippine peso while the decrease in USD exchange rate represents appreciation of Philippine peso.
There is no other impact in the Bank’s equity other than those already affecting the statements of income.
Market Risk in the Trading Book The Bank is exposed to the potential loss in its trading portfolio because the value of its trading positions is sensitive to changes in market prices and rates. Similarly, it is also exposed to market risk in its non-trading portfolio. Market risk is dimensioned and controlled in both the trading book and in the non-trading book. In the trading book, market risk is controlled by a daily analysis of the VaR of financial instruments under normal market conditions.
Objectives and limitations of the VaR methodology The Bank uses the VaR approach in assessing the possible changes in the market value of the trading portfolio based on historical data for a rolling one year period. The VaR models are designed to measure market risk in a normal market environment. The models assume that any changes occurring in the risk factors affecting the normal market environment will follow a normal distribution. The use of VaR has limitations because it is based on historical correlations and volatilities in market prices and assumes that future price movements will follow a statistical distribution. Due to the fact that VaR relies heavily on historical data to provide information and may not clearly predict the future changes and modifications of the risk factors, the probability of large market movements may be underestimated if changes in risk factors fail to align with the normal distribution assumption. VaR may also be under- or over- estimated due to the assumptions placed on risk factors and the relationship between such factors for specific instruments. Even though positions may change throughout the day, the VaR only represents the risk of the portfolios at the close of each business day, and it does not account for any losses that may occur beyond the 99.0% confidence level. The VaR figures are back tested to validate the robustness of the VaR model. Likewise, to complement VaR measure, the Bank performs stress tests wherein the trading portfolios are valued under extreme market scenarios not covered by the confidence interval of the Bank’s VaR model.
VaR assumptions/parameters The VaR that the Bank measures is an estimate, using a confidence level of 99.0% of the potential loss that is not expected to be exceeded if the current market risk positions were to be held unchanged for one day. The use of a 99.0% confidence level means that, within a 1 day horizon, losses exceeding the VaR figure should occur, on average, not more than once every 100 days.
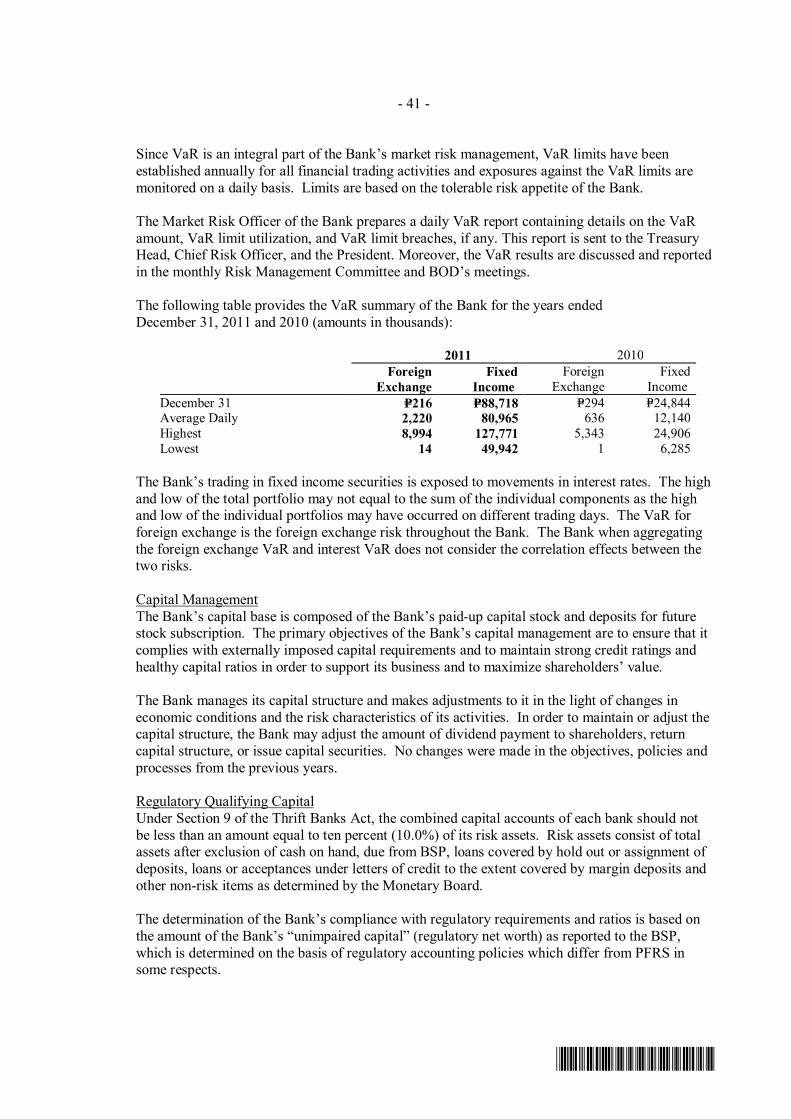
- 41 -
*SGVMC117102*
Since VaR is an integral part of the Bank’s market risk management, VaR limits have been established annually for all financial trading activities and exposures against the VaR limits are monitored on a daily basis. Limits are based on the tolerable risk appetite of the Bank.
The Market Risk Officer of the Bank prepares a daily VaR report containing details on the VaR amount, VaR limit utilization, and VaR limit breaches, if any. This report is sent to the Treasury Head, Chief Risk Officer, and the President. Moreover, the VaR results are discussed and reported in the monthly Risk Management Committee and BOD’s meetings.
The following table provides the VaR summary of the Bank for the years ended December 31, 2011 and 2010 (amounts in thousands):
2011 2010
Foreign
Exchange Fixed
Income Foreign
Exchange Fixed
Income December 31 P=216 P=88,718 P=294 P=24,844 Average Daily 2,220 80,965 636 12,140 Highest 8,994 127,771 5,343 24,906 Lowest 14 49,942 1 6,285
The Bank’s trading in fixed income securities is exposed to movements in interest rates. The high and low of the total portfolio may not equal to the sum of the individual components as the high and low of the individual portfolios may have occurred on different trading days. The VaR for foreign exchange is the foreign exchange risk throughout the Bank. The Bank when aggregating the foreign exchange VaR and interest VaR does not consider the correlation effects between the two risks. Capital Management The Bank’s capital base is composed of the Bank’s paid-up capital stock and deposits for future stock subscription. The primary objectives of the Bank’s capital management are to ensure that it complies with externally imposed capital requirements and to maintain strong credit ratings and healthy capital ratios in order to support its business and to maximize shareholders’ value. The Bank manages its capital structure and makes adjustments to it in the light of changes in economic conditions and the risk characteristics of its activities. In order to maintain or adjust the capital structure, the Bank may adjust the amount of dividend payment to shareholders, return capital structure, or issue capital securities. No changes were made in the objectives, policies and processes from the previous years.
Regulatory Qualifying Capital Under Section 9 of the Thrift Banks Act, the combined capital accounts of each bank should not be less than an amount equal to ten percent (10.0%) of its risk assets. Risk assets consist of total assets after exclusion of cash on hand, due from BSP, loans covered by hold out or assignment of deposits, loans or acceptances under letters of credit to the extent covered by margin deposits and other non-risk items as determined by the Monetary Board.
The determination of the Bank’s compliance with regulatory requirements and ratios is based on the amount of the Bank’s “unimpaired capital” (regulatory net worth) as reported to the BSP, which is determined on the basis of regulatory accounting policies which differ from PFRS in some respects.

- 42 -
*SGVMC117102*
As of December 31, 2011 and 2010, the Bank was in compliance with the capital adequacy ratio (CAR) prescribed by BSP. The table below shows the Bank’s CAR, as reported to the BSP (amounts in thousands):
2011 2010 Gross qualifying capital P=1,777,327 P=1,505,469 Less: Required deductions – – Total qualifying capital P=1,777,327 P=1,505,469 Risk weighted assets 13,602,650 12,978,432 CAR 13.07% 11.6%
Regulatory capital comprises share capital, surplus including current year profit and deferred income tax. Certain adjustments are made in PFRS-based results and reserves, as prescribed by the BSP.
The Bank has complied with all externally imposed capital requirements in 2011 and 2010.
5. Fair Value Measurement
The methods and assumptions used by the Bank in estimating the fair value of the financial instruments are:
COCI, due from BSP and other banks, interbank loans and SPURA with the BSP - Carrying amounts approximate fair values due to the relatively short-term maturity of these investments.
Loans and receivables - Fair values of loans are estimated using the discounted cash flow methodology, using the Bank’s current incremental lending rates for similar types of loans.
Debt securities - Fair values are generally based on quoted market prices. Where the debt securities are not quoted or the market prices are not readily available, the Bank obtained valuations from independent parties offering pricing services, used adjusted quoted market prices of comparable investments, or applied discounted cash flow methodologies.
Unquoted equity securities - The investments are carried at cost less allowance for impairment losses due to the unpredictable nature of future cash flows and the lack of suitable methods of arriving at a reliable fair value.
Time deposits and bills payable - Fair values of time deposits and bills payable are estimated using the discounted cash flow methodology using the Bank’s current incremental borrowing rates for similar borrowings with maturities consistent with their remaining liabilities being valued. Other liabilities - For financial liabilities other than time deposits and bills payable, the carrying amounts approximate fair values considering that these are due and demandable.

- 43 -
*SGVMC117102*
The table below presents a comparison by category of carrying amounts and estimated fair values of all of the Bank’s financial instruments as of December 31, 2011 and 2010:
2011 2010 Carrying Value Fair Value Carrying Value Fair Value Financial Assets HFT securities: Government debt securities P=2,168,546,293 P=2,168,546,293 P=1,233,142,025 P=1,233,142,025 Private bonds 430,897,497 430,897,497 477,543,833 477,543,833 2,599,443,790 2,599,443,790 1,710,685,858 1,710,685,858 AFS investments: Government securities 1,793,194,254 1,793,194,254 2,406,921,898 2,406,921,898 Private bonds 1,530,861,812 1,530,861,812 1,267,638,985 1,267,638,985 Unquoted equity security 16,073,463 16,073,463 – – 3,340,129,529 3,340,129,529 3,674,560,883 3,674,560,883 HTM investments: Government securities 120,828,253 154,917,276 130,889,290 156,960,900 Loans and receivables: COCI 591,123,145 591,123,145 625,873,173 625,873,173 Due from BSP 1,912,501,244 1,912,501,244 636,104,375 636,104,375 Due from other banks 447,348,222 447,348,222 569,552,885 569,552,885 Interbank loans receivable 1,933,909,546 1,933,909,546 1,620,000,000 1,620,000,000 Loans and receivables: Loans and discounts: Corporate 8,302,483,312 8,319,659,198 7,322,151,626 7,327,163,651 Consumer 4,414,802,438 4,715,536,935 4,223,950,648 4,418,936,864 Bills purchased 285,284,146 285,284,146 646,161,068 646,161,068 Unquoted debt securities 1,442,861,465 1,239,613,729 1,203,101,409 1,164,646,797 Accrued interest receivable 215,261,678 215,261,678 187,539,417 187,539,417 Accounts receivable 29,708,125 29,708,125 33,880,674 33,880,674 14,690,401,164 14,805,063,811 13,616,784,842 13,778,328,471 Other assets: RCOCI 1,446,600 1,446,600 7,854,846 7,854,846 Refundable deposits 15,241,345 15,241,345 11,550,705 11,550,705 16,687,945 16,687,945 19,405,551 19,405,551 Total loans and receivables 19,591,971,266 19,706,633,913 17,087,720,826 17,249,264,455 P=25,652,372,838 P=25,801,124,508 P=22,603,856,857 P=22,791,472,096 Financial Liabilities Other financial liabilities: Deposit liabilities: Demand P=3,978,159,770 P=3,978,159,770 P=3,137,521,048 P=3,137,521,048 Savings 1,176,181,020 1,176,181,020 863,256,296 863,256,296 Time 18,735,806,015 18,763,498,716 16,782,463,358 16,784,136,037 23,890,146,805 23,917,839,506 20,783,240,702 20,784,913,381 Manager’s checks 78,024,579 78,024,579 63,324,279 63,324,279 Bills Payable 121,492,338 121,492,338 87,064,013 87,064,013 Accrued interest and other expenses 141,268,437 141,268,437 108,892,803 108,892,803 Accounts payable 411,536,743 411,536,743 422,767,390 422,767,390 Due to PDIC 23,634,266 23,634,266 19,132,784 19,132,784 Bills purchased – contra 285,284,146 285,284,146 646,161,068 646,161,068 Payment order payable 2,131,098 2,131,098 2,239,727 2,239,727 1,063,371,607 1,063,371,607 1,349,582,064 1,349,582,064 P=24,953,518,412 P=24,981,211,113 P=22,132,822,766 P=22,134,495,445
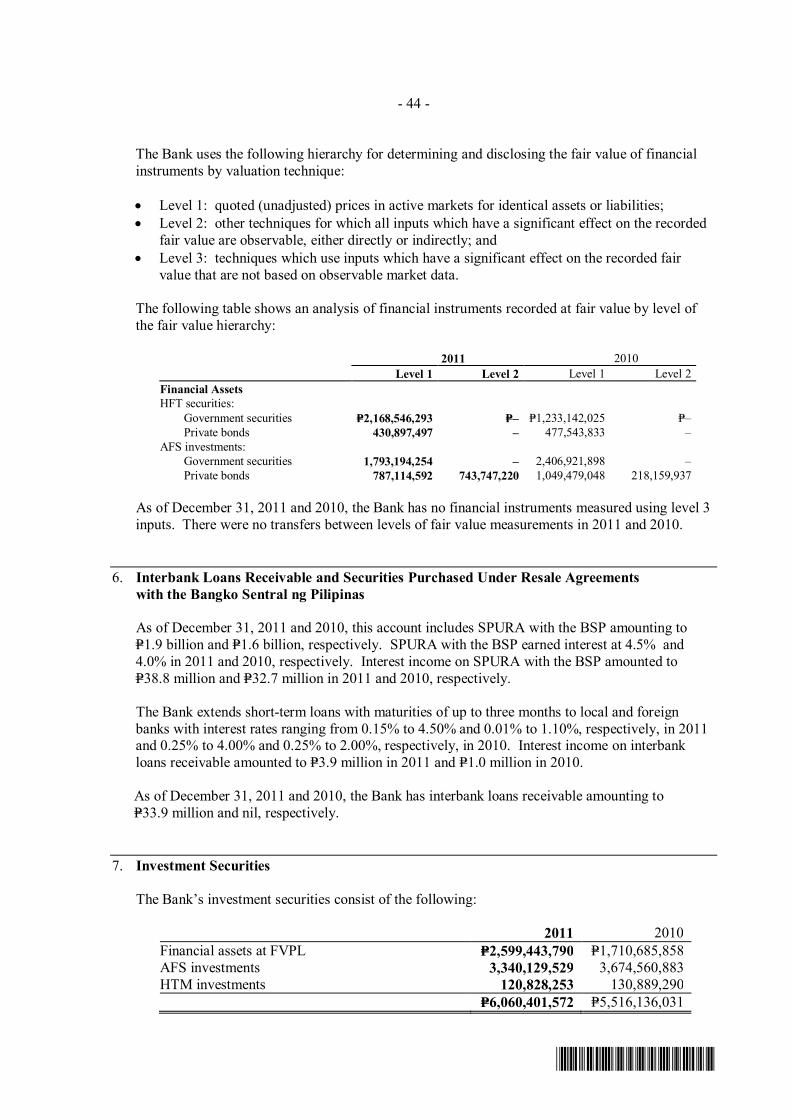
- 44 -
*SGVMC117102*
The Bank uses the following hierarchy for determining and disclosing the fair value of financial instruments by valuation technique:
• Level 1: quoted (unadjusted) prices in active markets for identical assets or liabilities; • Level 2: other techniques for which all inputs which have a significant effect on the recorded
fair value are observable, either directly or indirectly; and • Level 3: techniques which use inputs which have a significant effect on the recorded fair
value that are not based on observable market data.
The following table shows an analysis of financial instruments recorded at fair value by level of the fair value hierarchy:
2011 2010 Level 1 Level 2 Level 1 Level 2 Financial Assets HFT securities: Government securities P=2,168,546,293 P=– P=1,233,142,025 P=– Private bonds 430,897,497 – 477,543,833 – AFS investments: Government securities 1,793,194,254 – 2,406,921,898 – Private bonds 787,114,592 743,747,220 1,049,479,048 218,159,937
As of December 31, 2011 and 2010, the Bank has no financial instruments measured using level 3 inputs. There were no transfers between levels of fair value measurements in 2011 and 2010.
6. Interbank Loans Receivable and Securities Purchased Under Resale Agreements
with the Bangko Sentral ng Pilipinas
As of December 31, 2011 and 2010, this account includes SPURA with the BSP amounting to P=1.9 billion and P=1.6 billion, respectively. SPURA with the BSP earned interest at 4.5% and 4.0% in 2011 and 2010, respectively. Interest income on SPURA with the BSP amounted to P=38.8 million and P=32.7 million in 2011 and 2010, respectively.
The Bank extends short-term loans with maturities of up to three months to local and foreign banks with interest rates ranging from 0.15% to 4.50% and 0.01% to 1.10%, respectively, in 2011 and 0.25% to 4.00% and 0.25% to 2.00%, respectively, in 2010. Interest income on interbank loans receivable amounted to P=3.9 million in 2011 and P=1.0 million in 2010.
As of December 31, 2011 and 2010, the Bank has interbank loans receivable amounting to P=33.9 million and nil, respectively.
7. Investment Securities
The Bank’s investment securities consist of the following:
2011 2010 Financial assets at FVPL P=2,599,443,790 P=1,710,685,858 AFS investments 3,340,129,529 3,674,560,883 HTM investments 120,828,253 130,889,290 P=6,060,401,572 P=5,516,136,031
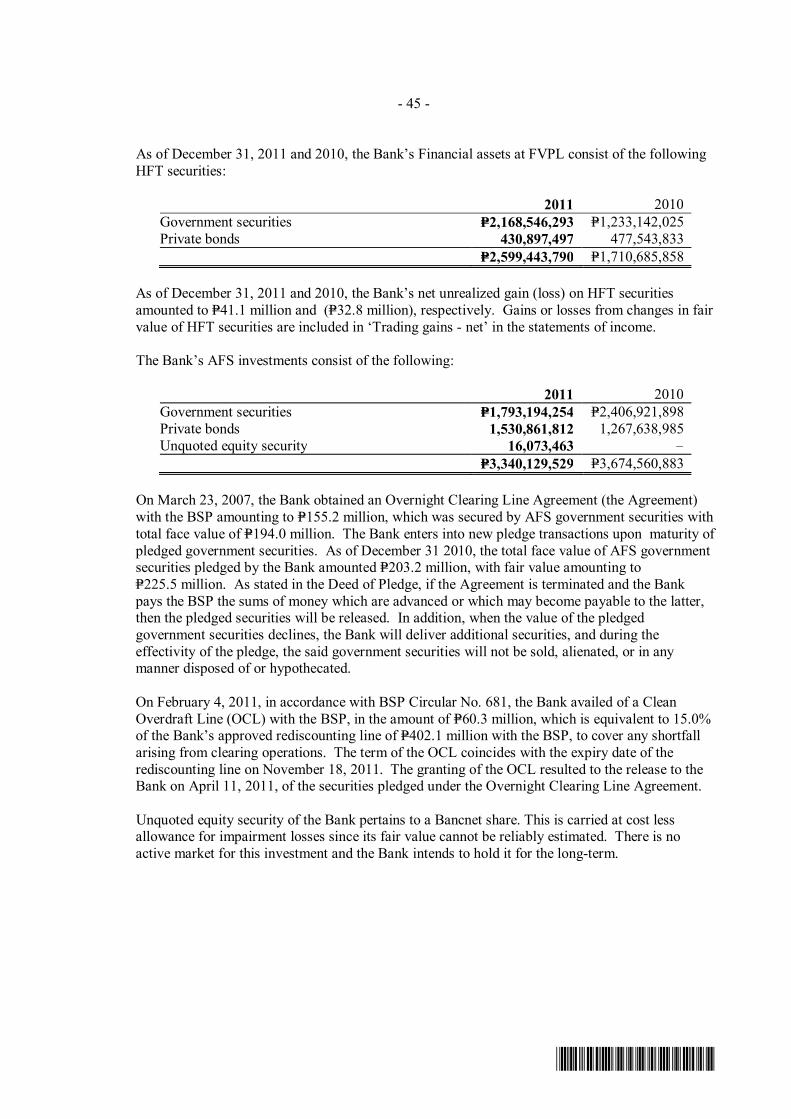
- 45 -
*SGVMC117102*
As of December 31, 2011 and 2010, the Bank’s Financial assets at FVPL consist of the following HFT securities:
2011 2010 Government securities P=2,168,546,293 P=1,233,142,025 Private bonds 430,897,497 477,543,833 P=2,599,443,790 P=1,710,685,858
As of December 31, 2011 and 2010, the Bank’s net unrealized gain (loss) on HFT securities amounted to P=41.1 million and (P=32.8 million), respectively. Gains or losses from changes in fair value of HFT securities are included in ‘Trading gains - net’ in the statements of income.
The Bank’s AFS investments consist of the following:
2011 2010 Government securities P=1,793,194,254 P=2,406,921,898 Private bonds 1,530,861,812 1,267,638,985 Unquoted equity security 16,073,463 – P=3,340,129,529 P=3,674,560,883
On March 23, 2007, the Bank obtained an Overnight Clearing Line Agreement (the Agreement) with the BSP amounting to P=155.2 million, which was secured by AFS government securities with total face value of P=194.0 million. The Bank enters into new pledge transactions upon maturity of pledged government securities. As of December 31 2010, the total face value of AFS government securities pledged by the Bank amounted P=203.2 million, with fair value amounting to P=225.5 million. As stated in the Deed of Pledge, if the Agreement is terminated and the Bank pays the BSP the sums of money which are advanced or which may become payable to the latter, then the pledged securities will be released. In addition, when the value of the pledged government securities declines, the Bank will deliver additional securities, and during the effectivity of the pledge, the said government securities will not be sold, alienated, or in any manner disposed of or hypothecated.
On February 4, 2011, in accordance with BSP Circular No. 681, the Bank availed of a Clean Overdraft Line (OCL) with the BSP, in the amount of P=60.3 million, which is equivalent to 15.0% of the Bank’s approved rediscounting line of P=402.1 million with the BSP, to cover any shortfall arising from clearing operations. The term of the OCL coincides with the expiry date of the rediscounting line on November 18, 2011. The granting of the OCL resulted to the release to the Bank on April 11, 2011, of the securities pledged under the Overnight Clearing Line Agreement.
Unquoted equity security of the Bank pertains to a Bancnet share. This is carried at cost less allowance for impairment losses since its fair value cannot be reliably estimated. There is no active market for this investment and the Bank intends to hold it for the long-term.

- 46 -
*SGVMC117102*
The details of net unrealized loss on AFS investments of the Bank follow:
2011 2010 Balance at beginning of year (P=41,981,647) (P=10,963,566) Changes in fair value during the year 184,757,388 119,806,670 Unrealized gains taken to profit and loss (144,081,892) (151,459,172) Amortization of unrealized losses on reclassified
AFS investments 1,149,544 634,421 Subtotal 41,825,040 (31,018,081) Balance at end of year (P=156,607) (P=41,981,647)
As of December 31, 2011 and 2010, net unrealized loss on AFS investments amounted to
P=0.2 million and P=42.0 million, respectively. As of December 31, 2011 and 2010, the Bank’s net unrealized loss on AFS investments includes unrealized losses on reclassified AFS investments amounting to P=8.2 million and P=8.5 million, respectively.
Reclassification of AFS investments As allowed under PAS 39, the Bank identified certain eligible AFS investments for which it had a clear change of intent to hold these financial assets until maturity in order to adequately manage its net interest earning streams by matching these securities against its core funding, as defined under its existing risk management measurements and parameters.
On July 1, 2008, the Bank reclassified USD-denominated investment securities with face amount totaling USD2.3 million and effective interest of 6.8% from AFS investments to HTM investments.
The reclassification is also compliant with the criteria and rules set forth in BSP Circular Nos. 626 and 628 as well as those provided in SEC Memorandum Circular No. 10, Series of 2008, on Amendments to PAS 39 and PFRS 7.
As of December 31, 2011, the carrying amount and fair value of financial assets reclassified out of AFS investments to HTM investments amounted to P=120.8 million and P=154.9 million, respectively. As of December 31, 2010, the carrying amount and fair value of financial assets reclassified out of the AFS investments to HTM investments amounted to P=121.3 million and P=145.6 million, respectively.
Prior to reclassification, the fair value loss on the reclassified AFS investments recognized in ‘Net unrealized loss on AFS investments’ reported under the equity section of the statement of financial position amounted to P=9.7 million. Had the reclassification not been made, the fair value loss recognized in ‘Net unrealized loss on AFS investments’ would have decreased by P=25.9 million in 2011 and P=15.8 million in 2010. As of December 31, 2011 and 2010, the Bank expects to recover the entire cash flows of these reclassified financial assets.
The Bank’s HTM investments consist of the following:
2011 2010 Government securities: Face value P=100,832,000 P=111,792,000 Unamortized premium 19,996,253 19,097,290 P=120,828,253 P=130,889,290

- 47 -
*SGVMC117102*
In 2010, HTM investments include Republic of the Philippines bonds and Landbank corporate bonds with maturities of February 2, 2030 and October 19, 2016, respectively. The Landbank bonds provide an option to the issuer to call or prepay the bonds at par value. Consequently, the bonds were called on by the issuer on October 19, 2011. This resulted to a gain on early redemption of P=1.2 million, which pertains to the unamortized discount on the bonds. The prepayment does not taint the HTM portfolio as the redemption was initiated by the issuer and is beyond the control of the Bank.
Trading Gains and Interest Income on Investment Securities ‘Trading gains - net’ consists of:
2011 2010 HFT securities P=204,733,868 P=85,597,365 AFS investments 144,081,892 151,459,172 P=348,815,760 P=237,056,537
Interest income on investment securities consists of:
2011 2010 AFS investments P=251,645,658 P=221,296,272 HFT securities 160,905,982 48,897,164 HTM investments 9,761,324 10,167,402 P=422,312,964 P=280,360,838
Peso-denominated AFS investments bear effective interest rates ranging from 3.5% to 8.54% in 2011 and 3.9% to 9.3% in 2010, while foreign currency-denominated AFS investments bear effective interest rates ranging from 2.7% to 15.4% in 2011 and 3.5% to 17.9% in 2010.
Peso-denominated HFT securities bear effective interest rates ranging from 4.5% to 8.1% in 2011 and 2010, while foreign currency-denominated HFT securities bear effective interest rates ranging from 3.5% to 15.1% in 2011 and 2.0% to 14.1% in 2010. Foreign currency-denominated HTM investments bear effective interest rates ranging from 7.5% to 10.3% in 2011 and 2010.
8. Loans and Receivables
This account consists of:
2011 2010 Loans and discounts Corporate P=8,364,184,935 P=7,408,884,602 Consumer 4,579,725,447 4,307,685,807 Less unearned discounts and capitalized
interest 3,642,447 5,963,284 12,940,267,935 11,710,607,125 Bills purchased 285,284,146 646,161,068 13,225,552,081 12,356,768,193
(Forward)

- 48 -
*SGVMC117102*
2011 2010 Unquoted debt securities P=1,442,861,465 P=1,203,101,409 Accrued interest receivable 215,261,678 187,539,417 Accounts receivable 29,708,125 33,880,674 14,913,383,349 13,781,289,693 Less allowance for credit losses 222,982,185 164,504,851 P=14,690,401,164 P=13,616,784,842
Receivables from customers consist of:
2011 2010 Loans and discounts P=12,589,590,967 P=11,221,288,178 Customers’ liabilities under letters of credit and
trust receipts 136,279,838 264,011,211 Receivables purchased 218,039,577 231,271,020 Bills purchased 285,284,146 646,161,068 13,229,194,528 12,362,731,477 Less unearned discounts and capitalized interest 3,642,447 5,963,284 P=13,225,552,081 P=12,356,768,193
Unquoted debt securities consist of the following:
2011 2010 Private bonds: Face value P=1,498,656,095 P=1,271,518,279 Unamortized discount (55,794,630) (68,416,870) P=1,442,861,465 P=1,203,101,409
Unquoted debt securities bear effective interest rates ranging from 4.1% to 9.7% in 2011 and 2010.
As of December 31, 2011 and 2010, Accounts receivable includes amounts due from officers of P=19.4 million and P=21.6 million, respectively, relating to the Bank’s car plan.
The movements in the allowance for credit losses on loans and receivables of the Bank follow:
2011
Corporate
Lending Consumer
Lending Total Balance at beginning of year P=80,769,692 P=83,735,159 P=164,504,851 Provision for (recovery of) credit losses
during the year (22,710,516) 81,187,850 58,477,334 Balance at end of year P=58,059,176 P=164,923,009 P=222,982,185 Individual impairment P=55,812,236 P=– P=55,812,236 Collective impairment 2,246,940 164,923,009 167,169,949 P=58,059,176 P=164,923,009 P=222,982,185 Gross amount of loans individually
determined to be impaired P=113,122,304 P=– P=113,122,304
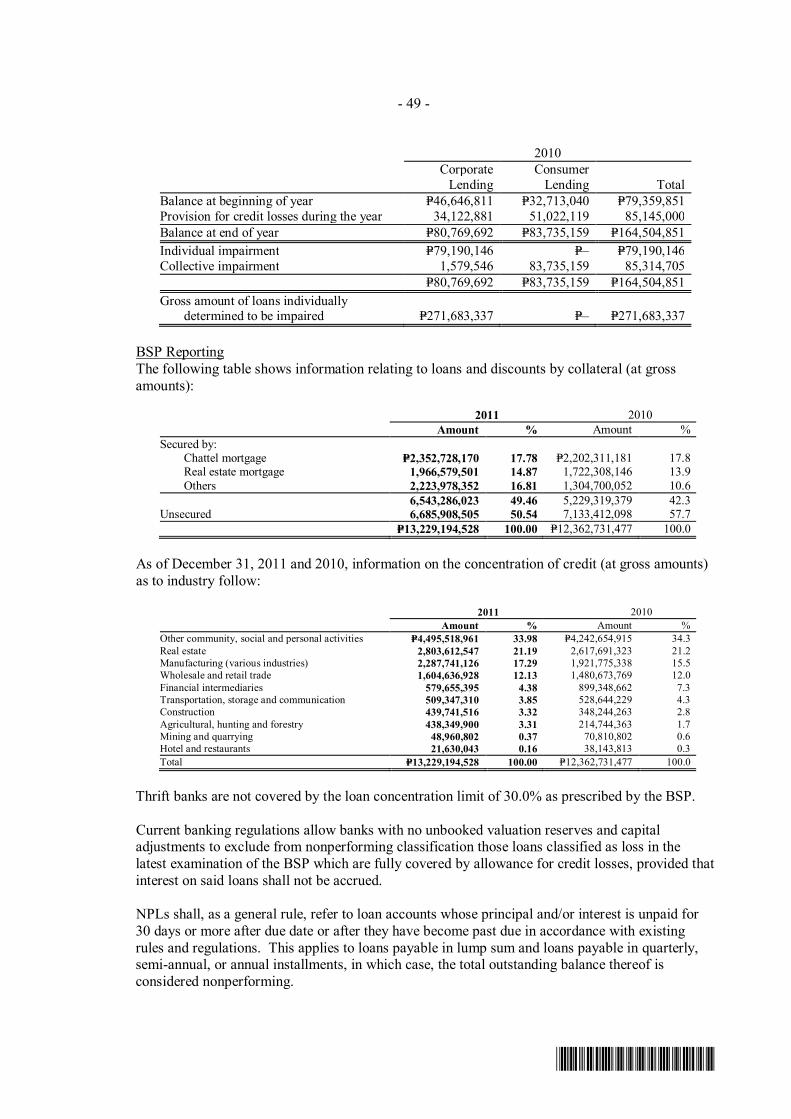
- 49 -
*SGVMC117102*
2010
Corporate
Lending Consumer
Lending Total Balance at beginning of year P=46,646,811 P=32,713,040 P=79,359,851 Provision for credit losses during the year 34,122,881 51,022,119 85,145,000 Balance at end of year P=80,769,692 P=83,735,159 P=164,504,851 Individual impairment P=79,190,146 P=– P=79,190,146 Collective impairment 1,579,546 83,735,159 85,314,705 P=80,769,692 P=83,735,159 P=164,504,851 Gross amount of loans individually
determined to be impaired P=271,683,337 P=– P=271,683,337 BSP Reporting
The following table shows information relating to loans and discounts by collateral (at gross amounts):
2011 2010 Amount % Amount % Secured by: Chattel mortgage P=2,352,728,170 17.78 P=2,202,311,181 17.8 Real estate mortgage 1,966,579,501 14.87 1,722,308,146 13.9 Others 2,223,978,352 16.81 1,304,700,052 10.6 6,543,286,023 49.46 5,229,319,379 42.3 Unsecured 6,685,908,505 50.54 7,133,412,098 57.7 P=13,229,194,528 100.00 P=12,362,731,477 100.0
As of December 31, 2011 and 2010, information on the concentration of credit (at gross amounts)
as to industry follow:
2011 2010 Amount % Amount % Other community, social and personal activities P=4,495,518,961 33.98 P=4,242,654,915 34.3 Real estate 2,803,612,547 21.19 2,617,691,323 21.2 Manufacturing (various industries) 2,287,741,126 17.29 1,921,775,338 15.5 Wholesale and retail trade 1,604,636,928 12.13 1,480,673,769 12.0 Financial intermediaries 579,655,395 4.38 899,348,662 7.3 Transportation, storage and communication 509,347,310 3.85 528,644,229 4.3 Construction 439,741,516 3.32 348,244,263 2.8 Agricultural, hunting and forestry 438,349,900 3.31 214,744,363 1.7 Mining and quarrying 48,960,802 0.37 70,810,802 0.6 Hotel and restaurants 21,630,043 0.16 38,143,813 0.3 Total P=13,229,194,528 100.00 P=12,362,731,477 100.0
Thrift banks are not covered by the loan concentration limit of 30.0% as prescribed by the BSP. Current banking regulations allow banks with no unbooked valuation reserves and capital adjustments to exclude from nonperforming classification those loans classified as loss in the latest examination of the BSP which are fully covered by allowance for credit losses, provided that interest on said loans shall not be accrued.
NPLs shall, as a general rule, refer to loan accounts whose principal and/or interest is unpaid for 30 days or more after due date or after they have become past due in accordance with existing rules and regulations. This applies to loans payable in lump sum and loans payable in quarterly, semi-annual, or annual installments, in which case, the total outstanding balance thereof is considered nonperforming.

- 50 -
*SGVMC117102*
In the case of receivables that are payable in monthly installments, the total outstanding balance is considered nonperforming when three or more installments are in arrears. In the case of receivables that are payable in daily, weekly, or semi-monthly installments, the total outstanding balance thereof is considered nonperforming at the same time that they become past due in accordance with existing BSP regulations, i.e., the entire outstanding balance of the receivable is considered as past due when the total amount of arrearages reaches ten percent (10.0%) of the total receivable balance.
As of December 31, 2011 and 2010, the Bank’s NPLs not fully covered by allowance for credit losses follow:
2011 2010 Total NPLs P=767,676,256 P=583,368,518 Less NPLs classified as loss by the BSP and are
fully covered by allowance for credit losses 106,110,806 31,618,555 P=661,565,450 P=551,749,963
As of December 31, 2011 and 2010, the Bank’s NPLs that is secured and unsecured are as follows:
2011 2010 Secured P=379,113,228 P=157,763,031 Unsecured 388,563,028 425,605,487 P=767,676,256 P=583,368,518
Restructured loans which do not meet the requirements to be treated as performing receivables are also considered as NPLs. As of December 31, 2011 and 2010, the Bank’s restructured loans amounted to P=23.24 million and P=13.14 million, respectively, while interest income on these restructured receivables amounted to P=2.5 million and P=1.1 million, respectively.
The details of interest income on loans and receivables follow:
2011 2010 Corporate loans P=610,237,491 P=522,668,750 Consumer loans 542,833,158 507,016,544 Unquoted debt securities 69,062,892 56,927,001 P=1,222,133,541 P=1,086,612,295
Of the total loans and receivables as of December 31, 2011 and 2010, 66.2% and 51.7%, respectively, are subject to periodic interest repricing. Remaining peso-denominated loans earn annual fixed interest rates ranging from 4.5% to 24% in 2011 and 5.0% to 24.0% in 2010. Dollar-denominated loans are subject to quarterly interest repricing.
9. Business Combination
Acquisition of Centennial Savings Bank, Inc. (CSB) As discussed in Note 1, on March 9, 2009, the Bank entered into a Share Purchase Agreement with AFPSLAI and AFPMBAI to buy the shares of stock of CSB, a banking corporation based in the Philippines.

- 51 -
*SGVMC117102*
On August 4, 2009, the BSP approved the Bank’s acquisition of CSB and approved, in principle, the following merger incentives:
1. Relocation to restricted areas of the existing two (2) branches of CSB located in Baguio and
Sta. Rosa, both non-restricted areas, within a period of one (1) year from date of BSP approval of such request for relocation pursuant to Section X112 of the MORB;
2. Establishment of three (3) additional branches in restricted areas within 6 months subject to the licensing requirements under Section X151 of the MORB, provided that the Bank shall comply with the submission of application for merger; and
3. Authority of the Bank’s directors and officers to exercise concurrent functions as directors and officers of CSB, except for the President/Chief Executive Officer, Chief Operating Officer and Chief Financial Officer, from date of BSP approval up to the eventual effective merger of the two (2) banks or up to a period of at least six (6) months from date of approval.
On August 18, 2009, the Bank completed its acquisition of 100.0% of the voting shares of CSB.
In 2009, the Bank recorded its share in the identifiable assets and liabilities of CSB using provisional fair values due to unavailability of certain information to facilitate fair value computation of branch licenses. The fair value of the branch licenses could not be finalized because the valuation depends on the BSP’s final approval of the merger incentives that would allow the Bank to relocate 2 CSB branches to restricted areas as well as to establish 3 new branches also in restricted areas.
On March 29, 2010, the Bank obtained final approval of the merger and the merger incentives from the BSP.
With the final approval of the merger and merger incentives, the Bank remeasured the 2 branch licenses in non-restricted areas that will be relocated and recognized the additional 3 branch licenses in restricted areas provided by the BSP. Branch licenses for restricted areas were valued using recent market transactions while those for non-restricted areas were based on the licensing fee required to be paid under BSP Circular No. 624 in establishing branches in non-restricted areas.
The Bank finalized the purchase price allocation and the purchase price consideration has been allocated to the assets and liabilities on the basis of fair values at the date of acquisition as follows:
Fair Values
(As restated) Provisional
Values Assets Cash and cash equivalents P=62,003,737 P=62,003,737 Loans and receivables 7,493,890 7,493,890 Property and equipment 48,105,403 48,105,403 Branch licenses 128,000,000 48,500,000 Other assets 6,002,759 6,002,759 251,605,789 172,105,789
(Forward)
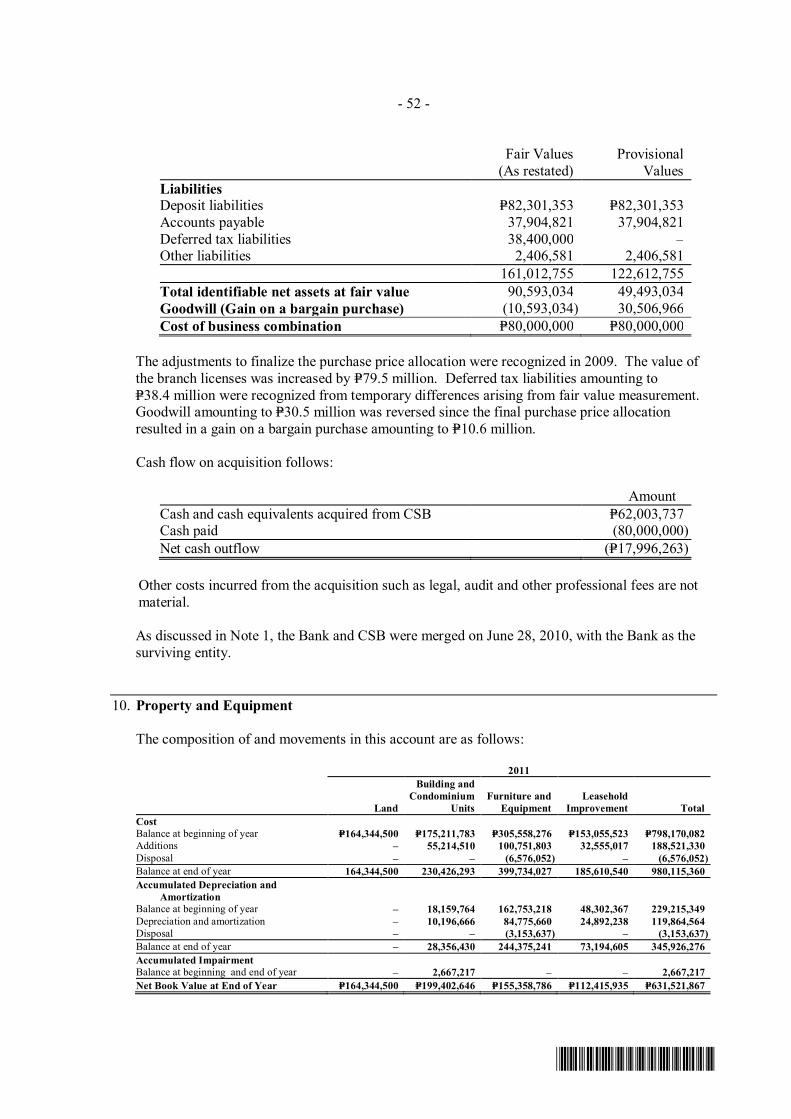
- 52 -
*SGVMC117102*
Fair Values
(As restated) Provisional
Values Liabilities Deposit liabilities P=82,301,353 P=82,301,353 Accounts payable 37,904,821 37,904,821 Deferred tax liabilities 38,400,000 – Other liabilities 2,406,581 2,406,581 161,012,755 122,612,755 Total identifiable net assets at fair value 90,593,034 49,493,034 Goodwill (Gain on a bargain purchase) (10,593,034) 30,506,966 Cost of business combination P=80,000,000 P=80,000,000
The adjustments to finalize the purchase price allocation were recognized in 2009. The value of
the branch licenses was increased by P=79.5 million. Deferred tax liabilities amounting to P=38.4 million were recognized from temporary differences arising from fair value measurement. Goodwill amounting to P=30.5 million was reversed since the final purchase price allocation resulted in a gain on a bargain purchase amounting to P=10.6 million.
Cash flow on acquisition follows:
Amount Cash and cash equivalents acquired from CSB P=62,003,737 Cash paid (80,000,000) Net cash outflow (P=17,996,263)
Other costs incurred from the acquisition such as legal, audit and other professional fees are not material. As discussed in Note 1, the Bank and CSB were merged on June 28, 2010, with the Bank as the surviving entity.
10. Property and Equipment
The composition of and movements in this account are as follows:
2011
Land
Building and Condominium
Units Furniture and
Equipment Leasehold
Improvement Total Cost Balance at beginning of year P=164,344,500 P=175,211,783 P=305,558,276 P=153,055,523 P=798,170,082 Additions – 55,214,510 100,751,803 32,555,017 188,521,330 Disposal – – (6,576,052) – (6,576,052) Balance at end of year 164,344,500 230,426,293 399,734,027 185,610,540 980,115,360 Accumulated Depreciation and
Amortization Balance at beginning of year – 18,159,764 162,753,218 48,302,367 229,215,349 Depreciation and amortization – 10,196,666 84,775,660 24,892,238 119,864,564 Disposal – – (3,153,637) – (3,153,637) Balance at end of year – 28,356,430 244,375,241 73,194,605 345,926,276 Accumulated Impairment Balance at beginning and end of year – 2,667,217 – – 2,667,217 Net Book Value at End of Year P=164,344,500 P=199,402,646 P=155,358,786 P=112,415,935 P=631,521,867
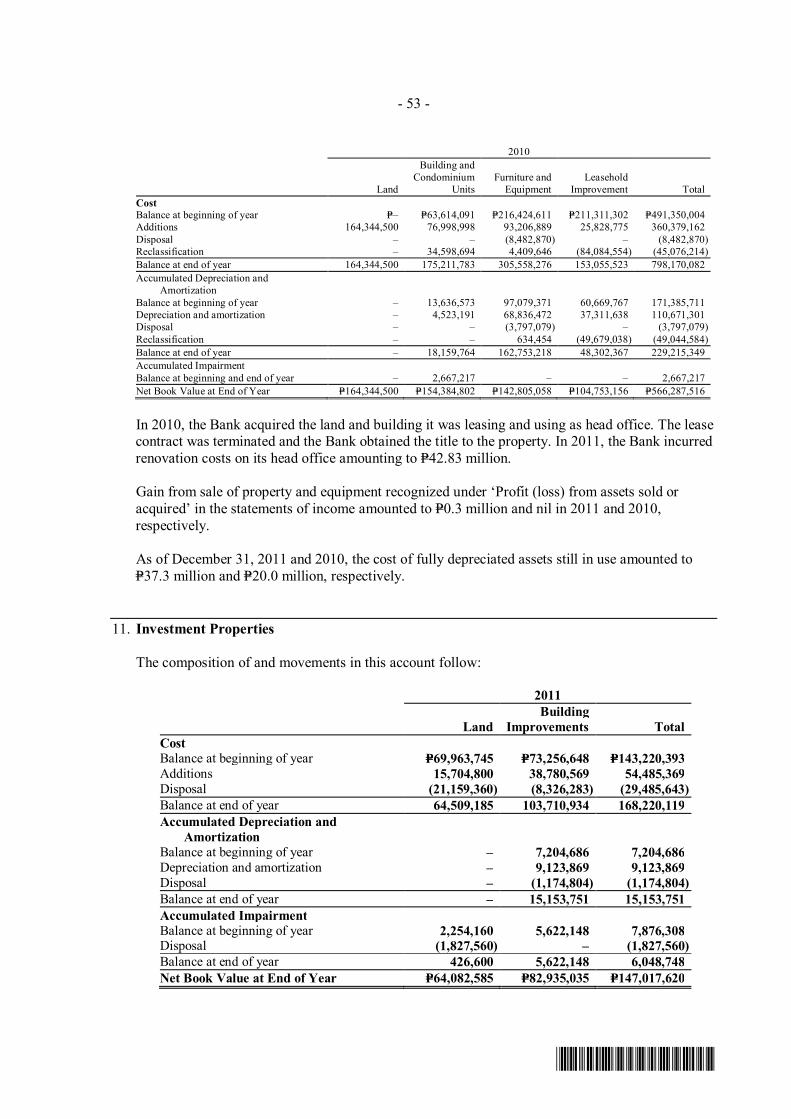
- 53 -
*SGVMC117102*
2010
Land
Building and Condominium
Units Furniture and
Equipment Leasehold
Improvement Total Cost Balance at beginning of year P=– P=63,614,091 P=216,424,611 P=211,311,302 P=491,350,004 Additions 164,344,500 76,998,998 93,206,889 25,828,775 360,379,162 Disposal – – (8,482,870) – (8,482,870) Reclassification – 34,598,694 4,409,646 (84,084,554) (45,076,214) Balance at end of year 164,344,500 175,211,783 305,558,276 153,055,523 798,170,082 Accumulated Depreciation and
Amortization Balance at beginning of year – 13,636,573 97,079,371 60,669,767 171,385,711 Depreciation and amortization – 4,523,191 68,836,472 37,311,638 110,671,301 Disposal – – (3,797,079) – (3,797,079) Reclassification – – 634,454 (49,679,038) (49,044,584) Balance at end of year – 18,159,764 162,753,218 48,302,367 229,215,349 Accumulated Impairment Balance at beginning and end of year – 2,667,217 – – 2,667,217 Net Book Value at End of Year P=164,344,500 P=154,384,802 P=142,805,058 P=104,753,156 P=566,287,516
In 2010, the Bank acquired the land and building it was leasing and using as head office. The lease contract was terminated and the Bank obtained the title to the property. In 2011, the Bank incurred renovation costs on its head office amounting to P=42.83 million. Gain from sale of property and equipment recognized under ‘Profit (loss) from assets sold or acquired’ in the statements of income amounted to P=0.3 million and nil in 2011 and 2010, respectively.
As of December 31, 2011 and 2010, the cost of fully depreciated assets still in use amounted to P=37.3 million and P=20.0 million, respectively.
11. Investment Properties
The composition of and movements in this account follow:
2011
Land Building
Improvements Total Cost Balance at beginning of year P=69,963,745 P=73,256,648 P=143,220,393 Additions 15,704,800 38,780,569 54,485,369 Disposal (21,159,360) (8,326,283) (29,485,643) Balance at end of year 64,509,185 103,710,934 168,220,119 Accumulated Depreciation and
Amortization Balance at beginning of year – 7,204,686 7,204,686 Depreciation and amortization – 9,123,869 9,123,869 Disposal – (1,174,804) (1,174,804) Balance at end of year – 15,153,751 15,153,751 Accumulated Impairment Balance at beginning of year 2,254,160 5,622,148 7,876,308 Disposal (1,827,560) – (1,827,560) Balance at end of year 426,600 5,622,148 6,048,748 Net Book Value at End of Year P=64,082,585 P=82,935,035 P=147,017,620

- 54 -
*SGVMC117102*
2010
Land Building
Improvements Total Cost Balance at beginning of year P=64,914,801 P=59,790,944 P=124,705,745 Additions 36,581,744 47,181,440 83,763,184 Disposal (31,532,800) (33,715,736) (65,248,536) Balance at end of year 69,963,745 73,256,648 143,220,393 Accumulated Depreciation Balance at beginning of year – 2,256,545 2,256,545 Depreciation and amortization – 7,292,128 7,292,128 Disposal – (2,343,987) (2,343,987) Balance at end of year – 7,204,686 7,204,686 Accumulated Impairment Provision during the year 2,254,160 5,622,148 7,876,308 Net Book Value at End of Year P=67,709,585 P=60,429,814 P=128,139,399
The Bank’s investment properties include real estate properties acquired in settlement of loans and receivables. The difference between the fair value of the assets upon foreclosure and the carrying value of the loans amounting to P=6.7 million in 2011 and P=17.1 million in 2010 is recognized under ‘Profit (loss) from assets sold or acquired’ in the statements of income. Annually, management reviews the recoverable amount of investment properties. Several factors are considered such as real estate prices and the physical condition of these properties. The aggregate market value of the Bank’s investment properties as of December 31, 2011 and 2010 amounted to P=171.2 million and P=149.4 million, respectively, as determined by independent and/or in-house appraisers using market data approach. As of December 31, 2011 and 2010, the Bank’s investment properties amounting to P=36.4 million and P=58.3 million, respectively, are still subject to redemption. Gain (loss) on sale or redemption of investment properties amounting to P=4.6 million in 2011 and (P=17.2 million) in 2010 is included under ‘Profit (loss) from assets sold or acquired’ in the statements of income. Direct operating expenses, pertaining to depreciation and amortization and repairs and maintenance, arising from investment properties amounted to P=13.8 million and P=8.1 million, in 2011 and 2010, respectively.
12. Branch Licenses
On January 16, 2007, the Bank purchased from BPI Family Savings Bank fourteen (14) branch licenses amounting to P=57.5 million, including P=5.5 million licensing fees paid to the BSP. Seven (7) branch licenses are in restricted areas and the other seven (7) are in unrestricted areas. On May 16, 2007, the Monetary Board of the BSP approved the acquisition of these branches and granted the Bank the authority to operate under certain conditions.
On February 14, 2008, the Bank purchased additional branch licenses from the BSP amounting to P=38.6 million.
In 2009, the Bank opened 5 additional branches in unrestricted areas and incurred licensing fees amounting to P=1.3 million.

- 55 -
*SGVMC117102*
In 2010, the Bank finalized the accounting for the acquired branch licenses from CSB amounting to P=128.0 million (see Note 9).
As of December 31, 2011 and 2010, the Bank has a total of 33 and 28 branches, respectively. Eighteen (18) and fourteen (14) of the branches as of December 31, 2011 and 2010, respectively, are in restricted areas.
The Retail Banking Group has been identified as the CGU for impairment testing of branch
licenses. The recoverable amount of the CGU has been determined based on value-in-use calculation using
cash flow projections from financial budgets approved by senior management covering a five-year period. The discount rate applied to cash flow projections is 10.1 % in 2011 and 10.7% in 2010 and cash flows beyond the five year-period are extrapolated using a steady growth rate of 3.7% in 2011 and 3.0% in 2010, which does not exceed the long-term average growth rate for the industry.
The calculation of the value-in-use of the CGU is most sensitive to the following assumptions:
• Discount rates • Steady growth rate used to extrapolate cash flows beyond the budget period • Local inflation rates
With regard to the assessment of value in use of the CGU, management believes that no
reasonably possible change in any of the above key assumptions would cause the carrying value of the branch licenses to materially exceed its recoverable amount.
13. Other Assets
This account consists of:
2011 2010 Chattel mortgage properties P=51,694,304 P=28,935,696 Prepaid expenses 37,029,303 34,340,373 Refundable deposits 15,241,345 11,550,705 Recoverable tax payments 10,491,349 21,281,328 Other investments 6,163,333 5,163,333 Deferred lease expense 3,670,492 4,171,351 Documentary stamp tax 3,111,966 6,085,421 RCOCI 1,446,600 7,854,846 Supplies on hand 667,326 1,364,826 Advances to contractors – 6,839,200 Miscellaneous 6,255,721 5,051,401 P=135,771,739 P=132,638,480

- 56 -
*SGVMC117102*
The movements in the Bank’s chattel mortgage properties follow:
2011 2010 Cost Balance at beginning of year P=35,089,665 P=9,379,502 Additions 90,805,628 64,669,063 Disposals (62,585,125) (38,958,900) Balance at end of year 63,310,168 35,089,665 Accumulated Depreciation Balance at beginning of year 5,446,807 876,036 Depreciation 17,237,253 7,939,555 Disposals (11,068,196) (3,368,784) Balance at end of year 11,615,864 5,446,807 Accumulated Impairment Balance at beginning of year 707,162 – Additions – 707,162 Disposal (707,162) – Balance at end of year – 707,162 Net Book Value at End of Year P=51,694,304 P=28,935,696
Chattel mortgage properties refer to automobiles acquired by the Bank in settlement of loans and receivables. The difference between the fair values upon foreclosure and the carrying value of the loans amounting to (P=12.2 million) in 2011 and 2010 is recognized under ‘Profit (loss) from assets sold or acquired’ in the statements of income. Gain on sale of chattel mortgage properties amounted to P=8.7 million in 2011 and P=4.0 million in 2010. This is presented under ‘Profit (Loss) from assets sold or acquired’ in the statements of income. Recoverable tax payments represent the balance of the excess tax payments for the year 1999 for which the Bank has exercised its option to carry over and apply as tax credits in the succeeding taxable years. In a Petition for Review submitted by the Bank to the Court of Tax Appeals (CTA) on July 28, 2003, the Bank has claimed for a refund or issuance of a tax credit certificate in the amount of P=27.1 million, allegedly representing overpaid income tax for the calendar year ending December 31, 1999. The Bank, however, has already exercised its option to carry over the 1999 excess tax credits to the succeeding year and is therefore, no longer entitled to claim for the refund or issuance of a tax credit certificate. The CTA cited the provision under Section 76 of the 1997 Tax Code which states that if a corporation exercises the option to carry over its excess tax credits to the succeeding years, the option becomes irrevocable for the taxable period and no application for cash refund or issuance of a tax credit certificate shall be allowed. The Bank, however, may still claim the excess income tax payments as a tax credit against future income tax liabilities. The Bank applied P=9.6 million for both 2011 and 2010 against its income tax liabilities. Unapplied tax credits as of December 31, 2010 amounted to P=11.4 million. As of December 31, 2011 and 2010, recoverable tax payments also include the Bank’s excess income tax payments for its FCDU amounting to P=8.7 million and P=9.9 million, respectively. This can be claimed as tax credit against future income tax liabilities. The Bank applied P=1.2 million and P=1.0 million in 2011 and 2010, respectively against its income tax liabilities.
Prepaid expenses include prepaid rentals and prepaid employee benefits related to the Bank’s car
plan for its officers and retainers fee.
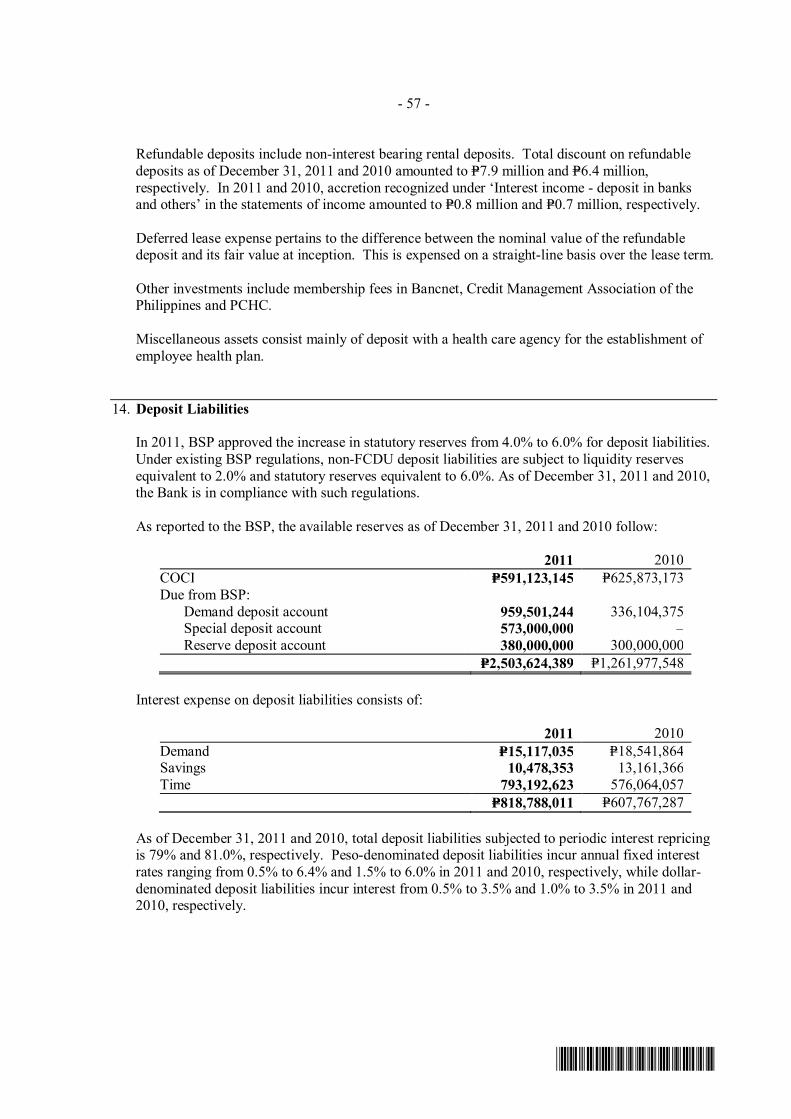
- 57 -
*SGVMC117102*
Refundable deposits include non-interest bearing rental deposits. Total discount on refundable deposits as of December 31, 2011 and 2010 amounted to P=7.9 million and P=6.4 million, respectively. In 2011 and 2010, accretion recognized under ‘Interest income - deposit in banks and others’ in the statements of income amounted to P=0.8 million and P=0.7 million, respectively.
Deferred lease expense pertains to the difference between the nominal value of the refundable deposit and its fair value at inception. This is expensed on a straight-line basis over the lease term.
Other investments include membership fees in Bancnet, Credit Management Association of the Philippines and PCHC. Miscellaneous assets consist mainly of deposit with a health care agency for the establishment of employee health plan.
14. Deposit Liabilities
In 2011, BSP approved the increase in statutory reserves from 4.0% to 6.0% for deposit liabilities. Under existing BSP regulations, non-FCDU deposit liabilities are subject to liquidity reserves equivalent to 2.0% and statutory reserves equivalent to 6.0%. As of December 31, 2011 and 2010, the Bank is in compliance with such regulations. As reported to the BSP, the available reserves as of December 31, 2011 and 2010 follow:
2011 2010 COCI P=591,123,145 P=625,873,173 Due from BSP: Demand deposit account 959,501,244 336,104,375 Special deposit account 573,000,000 – Reserve deposit account 380,000,000 300,000,000 P=2,503,624,389 P=1,261,977,548
Interest expense on deposit liabilities consists of:
2011 2010 Demand P=15,117,035 P=18,541,864 Savings 10,478,353 13,161,366 Time 793,192,623 576,064,057 P=818,788,011 P=607,767,287
As of December 31, 2011 and 2010, total deposit liabilities subjected to periodic interest repricing is 79% and 81.0%, respectively. Peso-denominated deposit liabilities incur annual fixed interest rates ranging from 0.5% to 6.4% and 1.5% to 6.0% in 2011 and 2010, respectively, while dollar-denominated deposit liabilities incur interest from 0.5% to 3.5% and 1.0% to 3.5% in 2011 and 2010, respectively.

- 58 -
*SGVMC117102*
15. Bills Payable
As of December 31, 2011 and 2010, bills payable consists of BSP rediscounted loans with interest rates of 4.5% in 2011 and 4.0% in 2010. Interest expense on bills payable amounted to P=4.0 million in 2011 and P=2.3 million in 2010.
16. Accrued Interest, Taxes and Other Expenses
This account consists of:
2011 2010 Accrued interest payable P=81,803,962 P=61,244,478 Retirement liability (Note 20) 26,868,778 13,261,569 Gross Receipts Tax 21,632,043 9,127,582 Accrued other expenses Rent 29,804,101 27,914,739 Security, messengerial and janitorial 8,515,449 6,068,038 Travel and transportation 5,916,513 1,861,141 Professional fees 4,331,314 1,420,833 Utilities and leased line 3,703,334 2,264,773 Others 7,193,764 8,118,801 P=189,769,258 P=131,281,954
Others pertain to accrued expenses for utilities, insurance, publications, repairs and maintenance and other staff costs.
17. Other Liabilities
This account consists of:
2011 2010 Accounts payable Cash cards P=225,835,756 P=207,265,630 Chattel mortgage, insurance and loan service fees 110,069,670 129,395,900 Bancnet and VISA 27,946,944 32,256,535 Others 47,684,373 53,849,325 Bills purchased - contra 285,284,146 646,161,068 Deposits for future stock subscription 125,000,000 – Other deferred credits 34,706,435 25,265,559 Due to PDIC 23,634,266 19,132,784 Withholding taxes payable 15,660,096 12,070,394 Payment orders payable 2,131,098 2,239,727 Miscellaneous 5,444,340 2,552,065 P=903,397,124 P=1,130,188,987
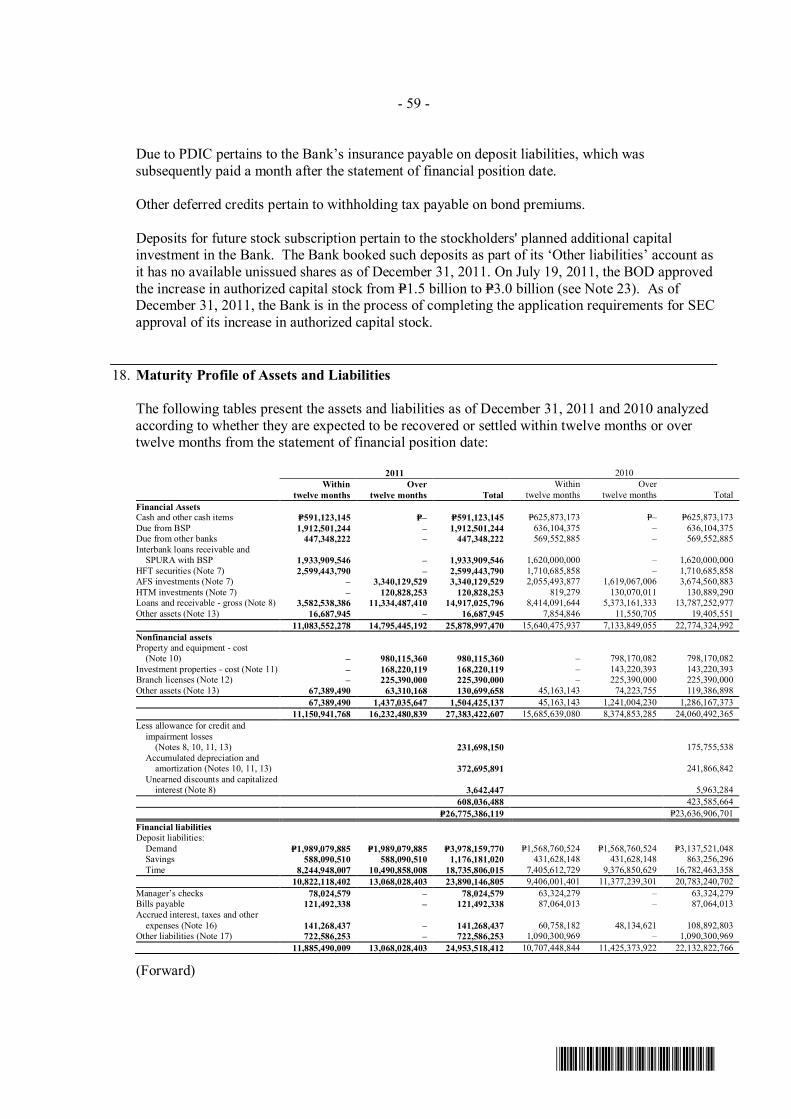
- 59 -
*SGVMC117102*
Due to PDIC pertains to the Bank’s insurance payable on deposit liabilities, which was subsequently paid a month after the statement of financial position date.
Other deferred credits pertain to withholding tax payable on bond premiums.
Deposits for future stock subscription pertain to the stockholders' planned additional capital investment in the Bank. The Bank booked such deposits as part of its ‘Other liabilities’ account as it has no available unissued shares as of December 31, 2011. On July 19, 2011, the BOD approved the increase in authorized capital stock from P=1.5 billion to P=3.0 billion (see Note 23). As of December 31, 2011, the Bank is in the process of completing the application requirements for SEC approval of its increase in authorized capital stock.
18. Maturity Profile of Assets and Liabilities
The following tables present the assets and liabilities as of December 31, 2011 and 2010 analyzed according to whether they are expected to be recovered or settled within twelve months or over twelve months from the statement of financial position date:
2011 2010
Within
twelve months Over
twelve months Total Within
twelve months Over
twelve months Total Financial Assets Cash and other cash items P=591,123,145 P=– P=591,123,145 P=625,873,173 P=– P=625,873,173 Due from BSP 1,912,501,244 – 1,912,501,244 636,104,375 – 636,104,375 Due from other banks 447,348,222 – 447,348,222 569,552,885 – 569,552,885 Interbank loans receivable and
SPURA with BSP 1,933,909,546 – 1,933,909,546 1,620,000,000 – 1,620,000,000 HFT securities (Note 7) 2,599,443,790 – 2,599,443,790 1,710,685,858 – 1,710,685,858 AFS investments (Note 7) – 3,340,129,529 3,340,129,529 2,055,493,877 1,619,067,006 3,674,560,883 HTM investments (Note 7) – 120,828,253 120,828,253 819,279 130,070,011 130,889,290 Loans and receivable - gross (Note 8) 3,582,538,386 11,334,487,410 14,917,025,796 8,414,091,644 5,373,161,333 13,787,252,977 Other assets (Note 13) 16,687,945 – 16,687,945 7,854,846 11,550,705 19,405,551 11,083,552,278 14,795,445,192 25,878,997,470 15,640,475,937 7,133,849,055 22,774,324,992 Nonfinancial assets Property and equipment - cost (Note 10) – 980,115,360 980,115,360 – 798,170,082 798,170,082 Investment properties - cost (Note 11) – 168,220,119 168,220,119 – 143,220,393 143,220,393 Branch licenses (Note 12) – 225,390,000 225,390,000 – 225,390,000 225,390,000 Other assets (Note 13) 67,389,490 63,310,168 130,699,658 45,163,143 74,223,755 119,386,898 67,389,490 1,437,035,647 1,504,425,137 45,163,143 1,241,004,230 1,286,167,373 11,150,941,768 16,232,480,839 27,383,422,607 15,685,639,080 8,374,853,285 24,060,492,365 Less allowance for credit and
impairment losses (Notes 8, 10, 11, 13) 231,698,150 175,755,538 Accumulated depreciation and
amortization (Notes 10, 11, 13) 372,695,891 241,866,842 Unearned discounts and capitalized
interest (Note 8) 3,642,447 5,963,284 608,036,488 423,585,664 P=26,775,386,119 P=23,636,906,701 Financial liabilities Deposit liabilities: Demand P=1,989,079,885 P=1,989,079,885 P=3,978,159,770 P=1,568,760,524 P=1,568,760,524 P=3,137,521,048 Savings 588,090,510 588,090,510 1,176,181,020 431,628,148 431,628,148 863,256,296 Time 8,244,948,007 10,490,858,008 18,735,806,015 7,405,612,729 9,376,850,629 16,782,463,358 10,822,118,402 13,068,028,403 23,890,146,805 9,406,001,401 11,377,239,301 20,783,240,702 Manager’s checks 78,024,579 – 78,024,579 63,324,279 – 63,324,279 Bills payable 121,492,338 – 121,492,338 87,064,013 – 87,064,013 Accrued interest, taxes and other
expenses (Note 16) 141,268,437 – 141,268,437 60,758,182 48,134,621 108,892,803 Other liabilities (Note 17) 722,586,253 – 722,586,253 1,090,300,969 – 1,090,300,969 11,885,490,009 13,068,028,403 24,953,518,412 10,707,448,844 11,425,373,922 22,132,822,766
(Forward)
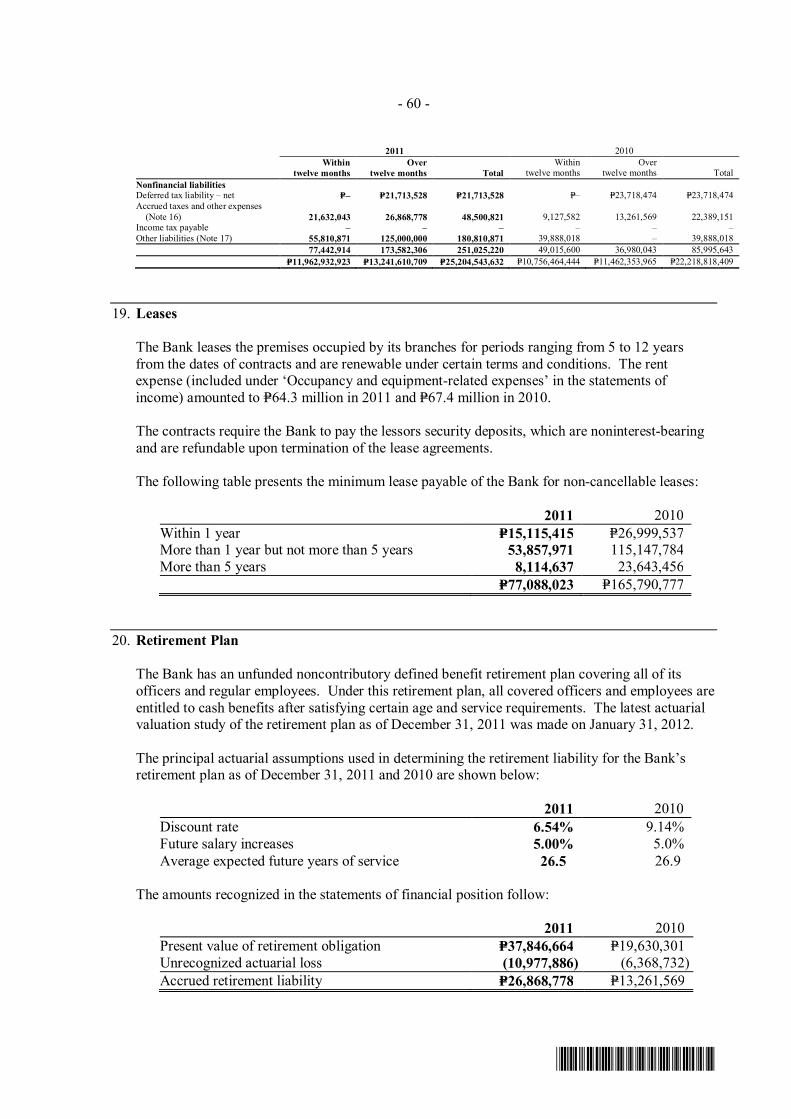
- 60 -
*SGVMC117102*
2011 2010
Within
twelve months Over
twelve months Total Within
twelve months Over
twelve months Total Nonfinancial liabilities Deferred tax liability – net P=– P=21,713,528 P=21,713,528 P=– P=23,718,474 P=23,718,474 Accrued taxes and other expenses
(Note 16) 21,632,043 26,868,778 48,500,821 9,127,582 13,261,569 22,389,151 Income tax payable – – – – – – Other liabilities (Note 17) 55,810,871 125,000,000 180,810,871 39,888,018 – 39,888,018 77,442,914 173,582,306 251,025,220 49,015,600 36,980,043 85,995,643 P=11,962,932,923 P=13,241,610,709 P=25,204,543,632 P=10,756,464,444 P=11,462,353,965 P=22,218,818,409
19. Leases
The Bank leases the premises occupied by its branches for periods ranging from 5 to 12 years from the dates of contracts and are renewable under certain terms and conditions. The rent expense (included under ‘Occupancy and equipment-related expenses’ in the statements of income) amounted to P=64.3 million in 2011 and P=67.4 million in 2010.
The contracts require the Bank to pay the lessors security deposits, which are noninterest-bearing
and are refundable upon termination of the lease agreements.
The following table presents the minimum lease payable of the Bank for non-cancellable leases:
2011 2010 Within 1 year P=15,115,415 P=26,999,537 More than 1 year but not more than 5 years 53,857,971 115,147,784 More than 5 years 8,114,637 23,643,456 P=77,088,023 P=165,790,777
20. Retirement Plan
The Bank has an unfunded noncontributory defined benefit retirement plan covering all of its officers and regular employees. Under this retirement plan, all covered officers and employees are entitled to cash benefits after satisfying certain age and service requirements. The latest actuarial valuation study of the retirement plan as of December 31, 2011 was made on January 31, 2012.
The principal actuarial assumptions used in determining the retirement liability for the Bank’s retirement plan as of December 31, 2011 and 2010 are shown below:
2011 2010 Discount rate 6.54% 9.14% Future salary increases 5.00% 5.0% Average expected future years of service 26.5 26.9
The amounts recognized in the statements of financial position follow:
2011 2010 Present value of retirement obligation P=37,846,664 P=19,630,301 Unrecognized actuarial loss (10,977,886) (6,368,732) Accrued retirement liability P=26,868,778 P=13,261,569
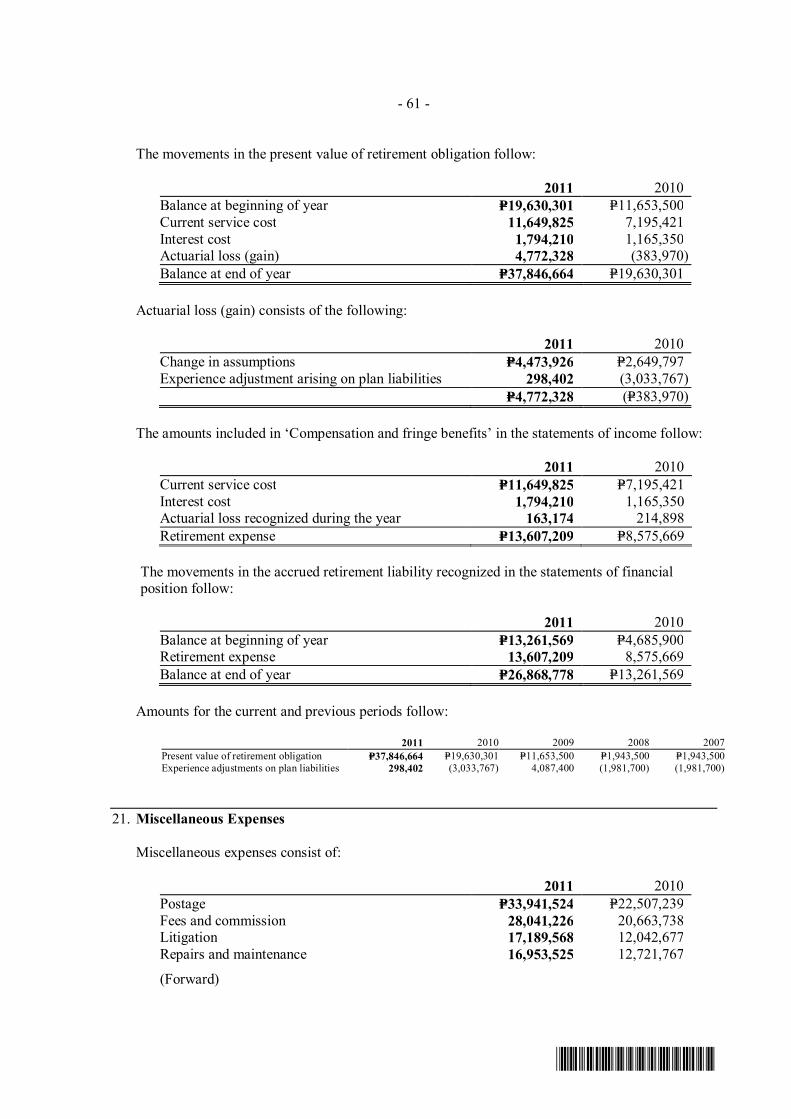
- 61 -
*SGVMC117102*
The movements in the present value of retirement obligation follow:
2011 2010 Balance at beginning of year P=19,630,301 P=11,653,500 Current service cost 11,649,825 7,195,421 Interest cost 1,794,210 1,165,350 Actuarial loss (gain) 4,772,328 (383,970) Balance at end of year P=37,846,664 P=19,630,301
Actuarial loss (gain) consists of the following:
2011 2010 Change in assumptions P=4,473,926 P=2,649,797 Experience adjustment arising on plan liabilities 298,402 (3,033,767) P=4,772,328 (P=383,970)
The amounts included in ‘Compensation and fringe benefits’ in the statements of income follow:
2011 2010 Current service cost P=11,649,825 P=7,195,421 Interest cost 1,794,210 1,165,350 Actuarial loss recognized during the year 163,174 214,898 Retirement expense P=13,607,209 P=8,575,669
The movements in the accrued retirement liability recognized in the statements of financial position follow:
2011 2010 Balance at beginning of year P=13,261,569 P=4,685,900 Retirement expense 13,607,209 8,575,669 Balance at end of year P=26,868,778 P=13,261,569
Amounts for the current and previous periods follow:
2011 2010 2009 2008 2007 Present value of retirement obligation P=37,846,664 P=19,630,301 P=11,653,500 P=1,943,500 P=1,943,500 Experience adjustments on plan liabilities 298,402 (3,033,767) 4,087,400 (1,981,700) (1,981,700)
21. Miscellaneous Expenses
Miscellaneous expenses consist of:
2011 2010 Postage P=33,941,524 P=22,507,239 Fees and commission 28,041,226 20,663,738 Litigation 17,189,568 12,042,677 Repairs and maintenance 16,953,525 12,721,767
(Forward)

- 62 -
*SGVMC117102*
2011 2010 Promotions and advertising P=13,278,110 P=10,626,086 Transportation and travel 10,926,280 9,561,835 Stationery and supplies used 8,374,456 8,843,365 Appraisal fees 7,604,407 8,584,395 Supervision fees 5,581,943 4,241,227 Management and other professional fees 3,385,114 4,399,512 Membership fees and dues 1,099,767 1,318,649 Fines and penalties 429,813 357,511 Others 4,132,813 2,737,525 P=150,938,546 P=118,605,526
‘Others’ includes check processing and courier fees, brokerage fees and notarial fees.
22. Income and Other Taxes
Provision for income tax consists of:
2011 2010 Current: Final tax P=62,293,471 P=42,829,211 MCIT 11,299,769 10,100,787 73,593,240 52,929,998 Deferred (2,004,946) (2,013,780) P=71,588,294 P=50,916,218
Under Philippine tax laws, the Bank is subject to percentage and other taxes (presented as ‘Taxes and licenses’ in the statements of income) as well as income taxes. Percentage and other taxes paid consist principally of gross receipts tax (GRT), documentary stamp taxes and value added tax.
Provision for income tax include corporate income tax, as discussed below, and 20.0% final tax paid, on gross interest income from government securities and other deposit substitutes.
Republic Act (RA) No. 9337, An Act Amending National Internal Revenue Code, provides that the RCIT rate shall be 30.0% and interest expense allowed as deductible expense shall be reduced by 33.0% of interest income subjected to final tax.
An MCIT of 2.0% on modified gross income is computed and compared with the RCIT. Any excess of the MCIT over the RCIT is deferred and can be used as a tax credit against future income tax liability for the next three years. In addition, the NOLCO is allowed as a deduction from the taxable income in the next three years from the year of inception. Current tax regulations also set a limit on the amount of entertainment, amusement and recreation (EAR) expenses that can be deducted for income tax purposes. EAR expenses are limited to 1.0% of net revenue for sellers of services.

- 63 -
*SGVMC117102*
RA No. 9294, which became effective in May 2004, provides that the income derived by the FCDU from foreign currency transactions with non-residents, off-shore banking units (OBUs), and local commercial banks, including branches of foreign banks, is tax-exempt while interest income on foreign currency-denominated loans from residents other than OBUs or other depository banks under the expanded system is subject to 10.0% income tax.
Details of the Bank’s MCIT and NOLCO follow:
MCIT
Year Incurred Amount Used/Expired Balance Expiry Year 2008 P=2,234,337 P=2,234,337 P=– 2011 2009 4,723,990 – 4,723,990 2012 2010 10,100,787 – 10,100,787 2013 2011 11,299,769 – 11,299,769 2014 P=28,358,883 P=2,234,337 P=26,124,546
NOLCO
Year Incurred Amount Used/Expired Balance Expiry Year 2008 P=175,203,344 P=175,203,344 P=– 2011 2009 62,683,791 – 62,683,791 2012 2011 21,181,377 – 21,181,377 2014 P=259,068,512 P=175,203,344 P=83,865,168
The Bank’s ‘Deferred tax liabilities - net’ in the statements of financial position consists of:
2011 2010 Deferred tax assets on: Allowance for credit and impairment losses P=21,454,246 P=21,454,246 21,454,246 21,454,246 Deferred tax liability on: Branch licenses acquired in business
combination (Note 9) (38,400,000) (38,400,000) Unrealized gain on foreclosure of acquired
assets (4,767,774) (4,887,273) Capitalization of capital gains tax – (1,885,447) (43,167,774) (45,172,720) (P=21,713,528) (P=23,718,474)
As of December 31, 2011 and 2010, deferred tax assets of the Bank that have not been recognized in respect of the deductible temporary differences follow:
2011 2010 Allowance for credit and impairment losses P=160,183,997 P=104,241,385 NOLCO 83,865,168 237,887,135 Accrued rent 29,804,101 27,914,739 Retirement liability 26,868,778 13,261,569 Depreciation of investment properties and chattel mortgage properties 26,769,615 12,651,493 Carry forward benefits of MCIT 26,124,546 17,059,114 P=353,616,205 P=413,015,435
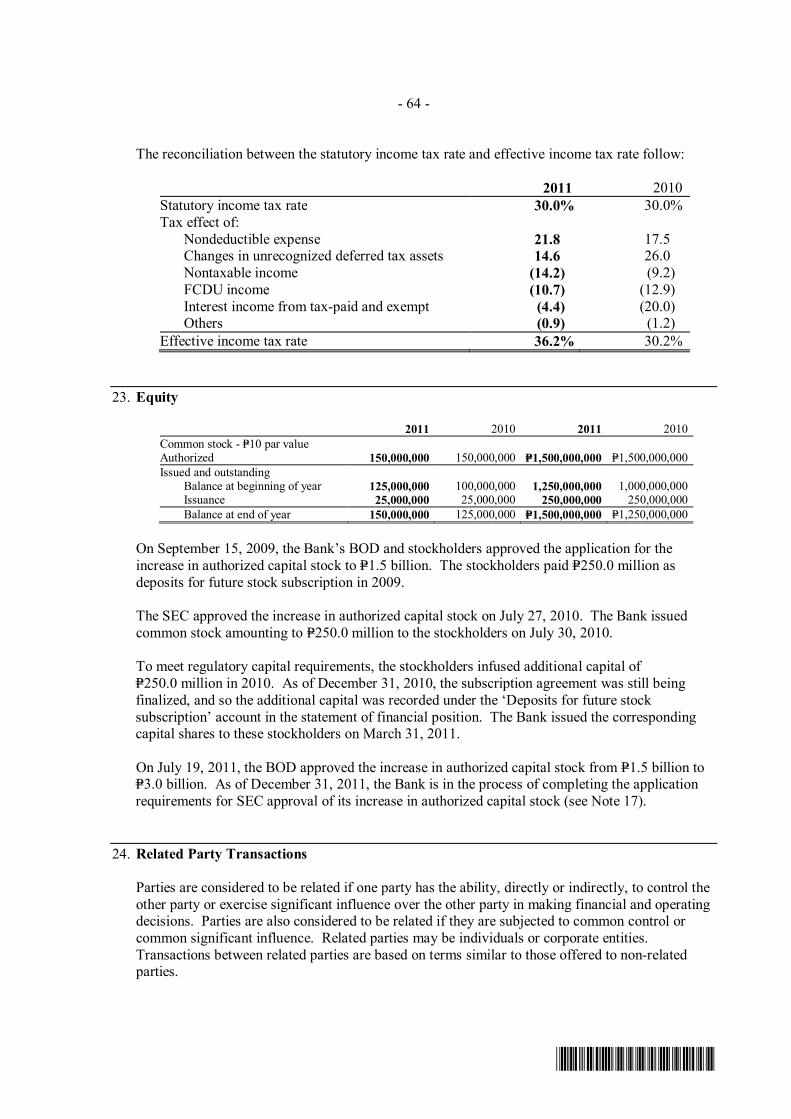
- 64 -
*SGVMC117102*
The reconciliation between the statutory income tax rate and effective income tax rate follow:
2011 2010 Statutory income tax rate 30.0% 30.0% Tax effect of: Nondeductible expense 21.8 17.5 Changes in unrecognized deferred tax assets 14.6 26.0 Nontaxable income (14.2) (9.2) FCDU income (10.7) (12.9) Interest income from tax-paid and exempt (4.4) (20.0) Others (0.9) (1.2) Effective income tax rate 36.2% 30.2%
23. Equity
2011 2010 2011 2010 Common stock - P=10 par value Authorized 150,000,000 150,000,000 P=1,500,000,000 P=1,500,000,000 Issued and outstanding Balance at beginning of year 125,000,000 100,000,000 1,250,000,000 1,000,000,000 Issuance 25,000,000 25,000,000 250,000,000 250,000,000 Balance at end of year 150,000,000 125,000,000 P=1,500,000,000 P=1,250,000,000
On September 15, 2009, the Bank’s BOD and stockholders approved the application for the increase in authorized capital stock to P=1.5 billion. The stockholders paid P=250.0 million as deposits for future stock subscription in 2009.
The SEC approved the increase in authorized capital stock on July 27, 2010. The Bank issued common stock amounting to P=250.0 million to the stockholders on July 30, 2010.
To meet regulatory capital requirements, the stockholders infused additional capital of P=250.0 million in 2010. As of December 31, 2010, the subscription agreement was still being finalized, and so the additional capital was recorded under the ‘Deposits for future stock subscription’ account in the statement of financial position. The Bank issued the corresponding capital shares to these stockholders on March 31, 2011. On July 19, 2011, the BOD approved the increase in authorized capital stock from P=1.5 billion to P=3.0 billion. As of December 31, 2011, the Bank is in the process of completing the application requirements for SEC approval of its increase in authorized capital stock (see Note 17).
24. Related Party Transactions
Parties are considered to be related if one party has the ability, directly or indirectly, to control the other party or exercise significant influence over the other party in making financial and operating decisions. Parties are also considered to be related if they are subjected to common control or common significant influence. Related parties may be individuals or corporate entities. Transactions between related parties are based on terms similar to those offered to non-related parties.

- 65 -
*SGVMC117102*
In the ordinary course of business, the Bank can enter into loan and other transactions with its subsidiary and affiliates and with certain directors, officers, stockholders, and related interests (DOSRI). Under the Bank’s policy, these loans and other transactions are made substantially on the same terms as with other individuals and businesses of comparable risks. The amount of individual loans to DOSRI, of which 70.0% must be secured, should not exceed the amount of their respective deposits and book value of their respective investments in the Bank. These limits do not apply to loans secured by assets considered as non-risk as defined in the regulations.
On January 31, 2007, BSP Circular No. 560 was issued providing the rules and regulations that shall govern loans, other credit accommodations and guarantees granted to subsidiaries and affiliates of banks and quasi-banks. Under the said circular, the total outstanding loans, credit accommodations and guarantees to each of the bank’s subsidiaries and affiliates shall not exceed 10.0% of bank’s net worth, the unsecured portion shall not exceed 5.0% of such net worth. Further, the total outstanding exposures shall not exceed 20.0% of the net worth of the lending bank. The said Circular became effective on February 15, 2007. On March 15, 2004, the BSP issued Circular No. 423 which provides for the amended definition of DOSRI accounts. The following table shows information relating to DOSRI accounts of the Bank:
2011 2010 Total outstanding DOSRI loans P=4,746,190 P=6,541,189 Percent of DOSRI accounts granted under BSP Circular No. 423 0.03% 0.05% Percent of DOSRI accounts to total loans 0.03% 0.05% Percent of unsecured DOSRI accounts to
total DOSRI loans P=– P=– Percent of past due DOSRI accounts to
total DOSRI loans – – Percent of nonperforming DOSRI accounts to
total DOSRI loans – – Any violation of the provisions under Circular No. 423 is subject to regulatory sanctions.
However, loans, other credit accommodations and guarantees, as well as availments of previously approved loans and committed credit lines that are not considered DOSRI (non-DOSRI) accounts prior to the issuance of Circular No. 423 are not covered by such sanctions for a transition period of two years from the effectivity of the Circular or until said loan, other credit accommodations and guarantees become past due, or are extended, renewed or restructured, whichever comes later.
Total interest income on DOSRI accounts amounted to P=14.8 million in 2011 and P=13.2 million in
2010. The effects of the foregoing transactions are shown under the appropriate accounts in the Bank’s
financial statements.
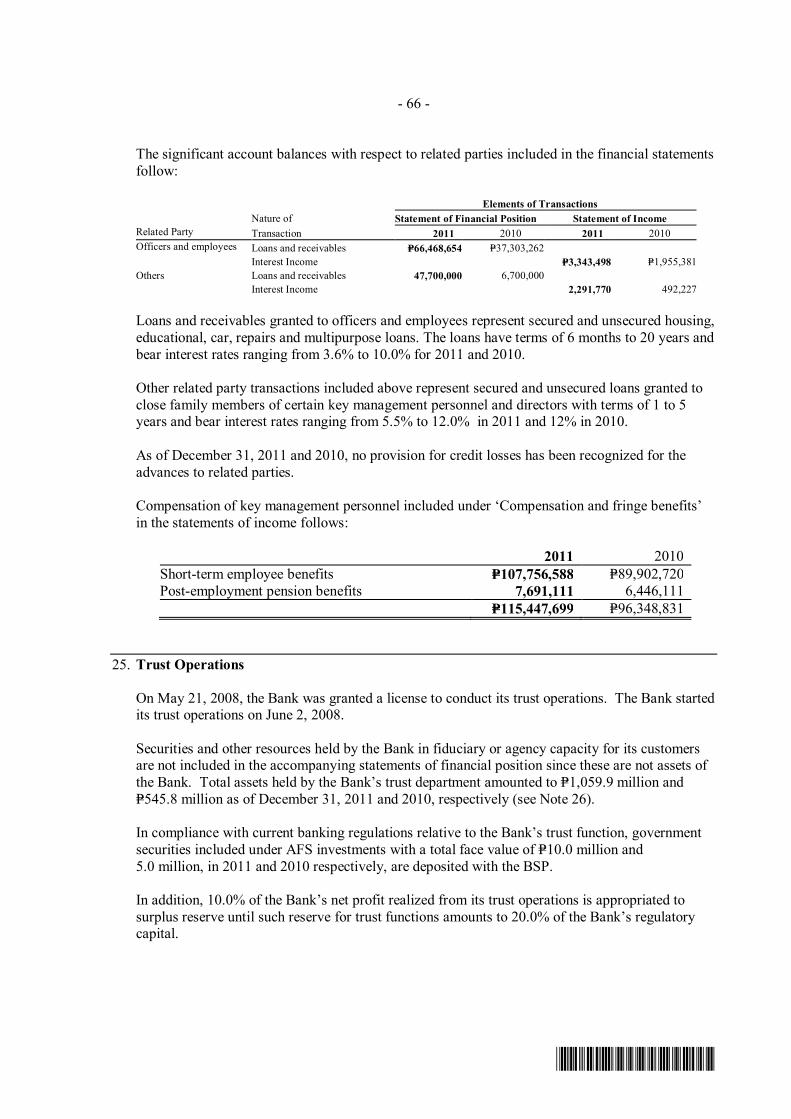
- 66 -
*SGVMC117102*
The significant account balances with respect to related parties included in the financial statements follow:
Elements of Transactions Nature of Statement of Financial Position Statement of Income Related Party Transaction 2011 2010 2011 2010 Officers and employees Loans and receivables P=66,468,654 P=37,303,262 Interest Income P=3,343,498 P=1,955,381Others Loans and receivables 47,700,000 6,700,000 Interest Income 2,291,770 492,227 Loans and receivables granted to officers and employees represent secured and unsecured housing, educational, car, repairs and multipurpose loans. The loans have terms of 6 months to 20 years and bear interest rates ranging from 3.6% to 10.0% for 2011 and 2010. Other related party transactions included above represent secured and unsecured loans granted to close family members of certain key management personnel and directors with terms of 1 to 5 years and bear interest rates ranging from 5.5% to 12.0% in 2011 and 12% in 2010.
As of December 31, 2011 and 2010, no provision for credit losses has been recognized for the
advances to related parties.
Compensation of key management personnel included under ‘Compensation and fringe benefits’ in the statements of income follows:
2011 2010 Short-term employee benefits P=107,756,588 P=89,902,720 Post-employment pension benefits 7,691,111 6,446,111 P=115,447,699 P=96,348,831
25. Trust Operations
On May 21, 2008, the Bank was granted a license to conduct its trust operations. The Bank started its trust operations on June 2, 2008. Securities and other resources held by the Bank in fiduciary or agency capacity for its customers are not included in the accompanying statements of financial position since these are not assets of the Bank. Total assets held by the Bank’s trust department amounted to P=1,059.9 million and P=545.8 million as of December 31, 2011 and 2010, respectively (see Note 26).
In compliance with current banking regulations relative to the Bank’s trust function, government
securities included under AFS investments with a total face value of P=10.0 million and 5.0 million, in 2011 and 2010 respectively, are deposited with the BSP.
In addition, 10.0% of the Bank’s net profit realized from its trust operations is appropriated to surplus reserve until such reserve for trust functions amounts to 20.0% of the Bank’s regulatory capital.
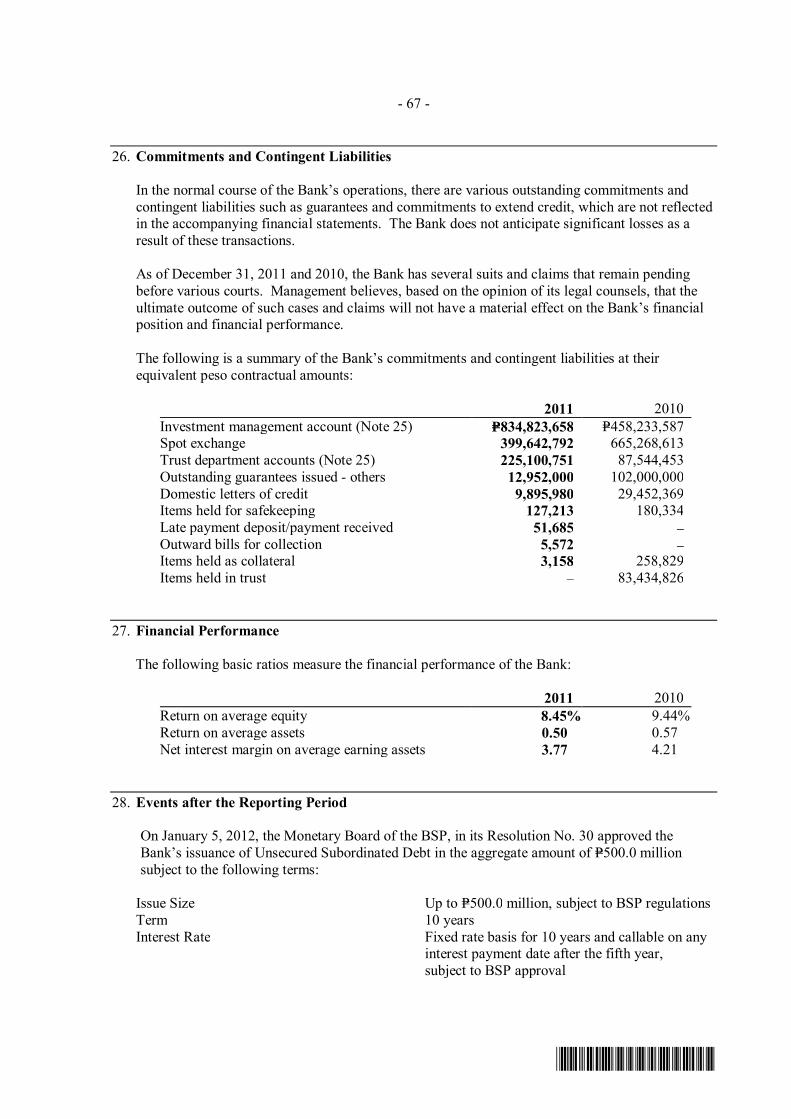
- 67 -
*SGVMC117102*
26. Commitments and Contingent Liabilities
In the normal course of the Bank’s operations, there are various outstanding commitments and contingent liabilities such as guarantees and commitments to extend credit, which are not reflected in the accompanying financial statements. The Bank does not anticipate significant losses as a result of these transactions.
As of December 31, 2011 and 2010, the Bank has several suits and claims that remain pending before various courts. Management believes, based on the opinion of its legal counsels, that the ultimate outcome of such cases and claims will not have a material effect on the Bank’s financial position and financial performance.
The following is a summary of the Bank’s commitments and contingent liabilities at their
equivalent peso contractual amounts:
2011 2010 Investment management account (Note 25) P=834,823,658 P=458,233,587 Spot exchange 399,642,792 665,268,613 Trust department accounts (Note 25) 225,100,751 87,544,453 Outstanding guarantees issued - others 12,952,000 102,000,000 Domestic letters of credit 9,895,980 29,452,369 Items held for safekeeping 127,213 180,334 Late payment deposit/payment received 51,685 – Outward bills for collection 5,572 – Items held as collateral 3,158 258,829 Items held in trust – 83,434,826
27. Financial Performance
The following basic ratios measure the financial performance of the Bank:
2011 2010 Return on average equity 8.45% 9.44% Return on average assets 0.50 0.57 Net interest margin on average earning assets 3.77 4.21
28. Events after the Reporting Period
On January 5, 2012, the Monetary Board of the BSP, in its Resolution No. 30 approved the Bank’s issuance of Unsecured Subordinated Debt in the aggregate amount of P=500.0 million subject to the following terms:
Issue Size Up to P=500.0 million, subject to BSP regulations Term 10 years Interest Rate Fixed rate basis for 10 years and callable on any
interest payment date after the fifth year, subject to BSP approval
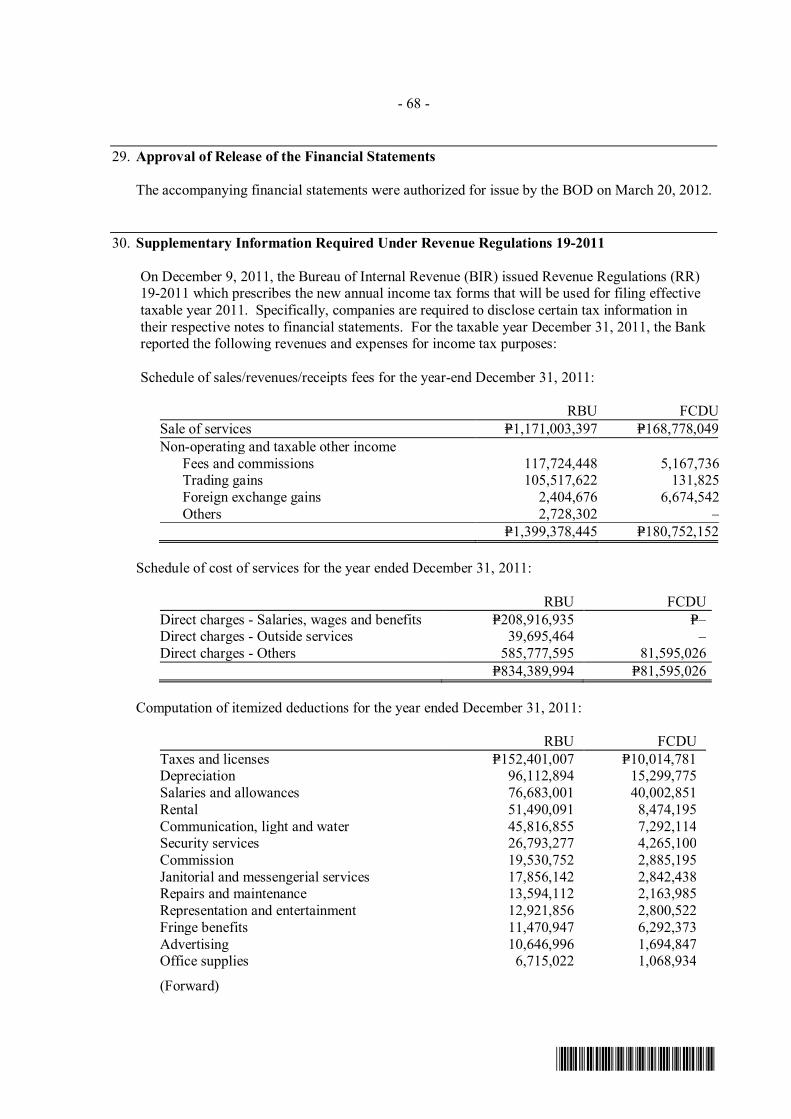
- 68 -
*SGVMC117102*
29. Approval of Release of the Financial Statements The accompanying financial statements were authorized for issue by the BOD on March 20, 2012. 30. Supplementary Information Required Under Revenue Regulations 19-2011
On December 9, 2011, the Bureau of Internal Revenue (BIR) issued Revenue Regulations (RR) 19-2011 which prescribes the new annual income tax forms that will be used for filing effective taxable year 2011. Specifically, companies are required to disclose certain tax information in their respective notes to financial statements. For the taxable year December 31, 2011, the Bank reported the following revenues and expenses for income tax purposes: Schedule of sales/revenues/receipts fees for the year-end December 31, 2011:
RBU FCDUSale of services P=1,171,003,397 P=168,778,049Non-operating and taxable other income
Fees and commissions 117,724,448 5,167,736Trading gains 105,517,622 131,825Foreign exchange gains 2,404,676 6,674,542Others 2,728,302 –
P=1,399,378,445 P=180,752,152 Schedule of cost of services for the year ended December 31, 2011:
RBU FCDU Direct charges - Salaries, wages and benefits P=208,916,935 P=– Direct charges - Outside services 39,695,464 – Direct charges - Others 585,777,595 81,595,026 P=834,389,994 P=81,595,026
Computation of itemized deductions for the year ended December 31, 2011:
RBU FCDU Taxes and licenses P=152,401,007 P=10,014,781 Depreciation 96,112,894 15,299,775 Salaries and allowances 76,683,001 40,002,851 Rental 51,490,091 8,474,195 Communication, light and water 45,816,855 7,292,114 Security services 26,793,277 4,265,100 Commission 19,530,752 2,885,195 Janitorial and messengerial services 17,856,142 2,842,438 Repairs and maintenance 13,594,112 2,163,985 Representation and entertainment 12,921,856 2,800,522 Fringe benefits 11,470,947 6,292,373 Advertising 10,646,996 1,694,847 Office supplies 6,715,022 1,068,934
(Forward)

- 69 -
*SGVMC117102*
RBU FCDU Fuel and oil P=4,794,063 P=763,145 Transportation and travel 3,967,128 631,509 Insurance 2,920,578 7,509,594 Management and consultancy fee 2,714,339 432,083 SSS, GSIS, Philhealth, HDMF and Other
Contributions 1,631,252 1,324,317
Miscellaneous 10,919,948 2,096,750 Others 17,189,568 – Total P=586,169,828 P=117,854,508
31. Supplementary Information Required Under Revenue Regulations 15-2010
On November 25, 2010, the BIR issued RR 15-2010 to amend certain provisions of RR 21-2002. The Regulations provide that starting 2010, the notes to financial statements shall include information on taxes and licenses paid or accrued during the taxable year.
The Bank reported and/or paid the following types of taxes in 2011:
Gross Receipt Tax (GRT) The Bank is subject to GRT on its gross income from Philippine sources. GRT is imposed on interest, fees and commissions from lending activities at 5.0% or 1.0%, depending on the loan term, and at 7.0% on non-lending fees and commissions, trading and foreign exchange gains and other items constituting gross income. In FCDU, income classified under Others, is subject to corporate income tax. The details of the Bank’s GRT expense and corresponding GRT tax base in 2011 are as follows:
GRT GRT tax base Interest income P=72,004,503 P=1,553,467,570 Other income 29,648,589 443,497,453 P=101,653,092 P=1,996,965,023
Taxes and Licenses This includes all other taxes, local and national, incurred in 2011 and lodged under the ‘Taxes and licenses’ account in the statement of income, as follows:
Amount GRT P=101,653,092 Documentary stamp taxes 64,915,929 Mayor’s permit and real estate taxes 6,094,289 Fringe benefit taxes 2,406,428 Land Transportation Office registration 172,610 Other taxes 129,273
P=175,371,621
Documentary stamp taxes paid relating to time deposits and additional capitalization amounted to P=63.4 million and P=1.5 million, respectively.
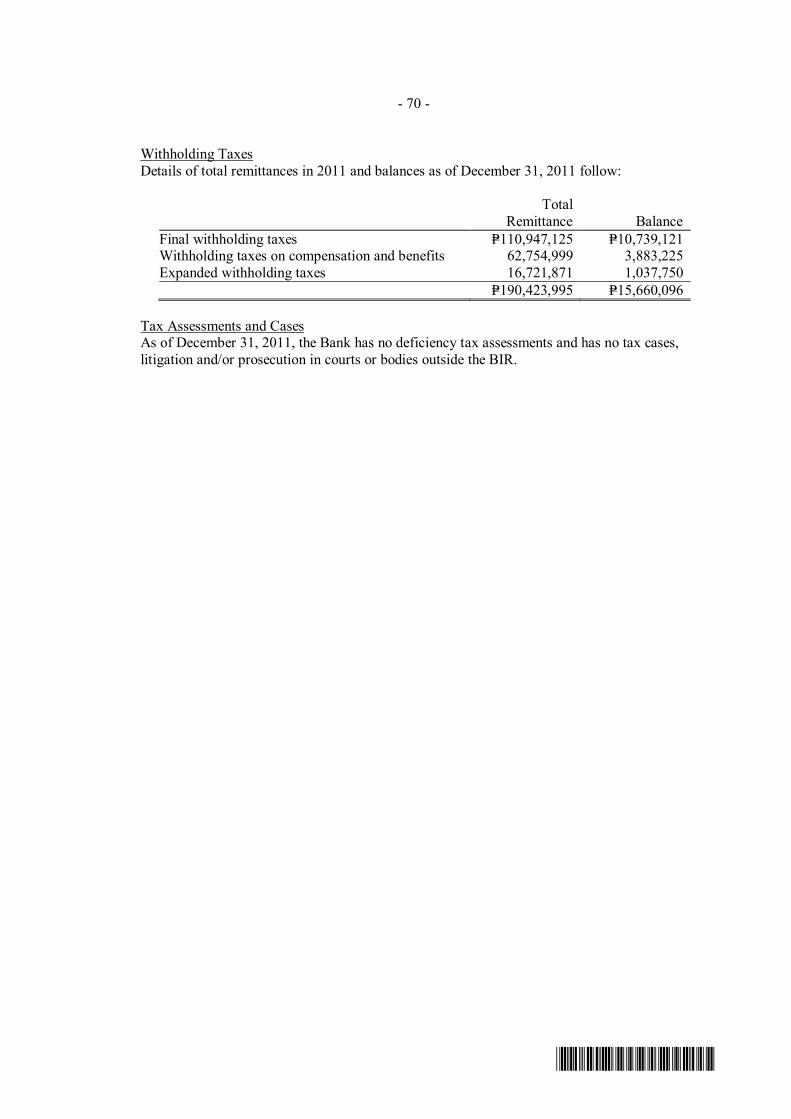
- 70 -
*SGVMC117102*
Withholding Taxes Details of total remittances in 2011 and balances as of December 31, 2011 follow:
Total
Remittance Balance Final withholding taxes P=110,947,125 P=10,739,121 Withholding taxes on compensation and benefits 62,754,999 3,883,225 Expanded withholding taxes 16,721,871 1,037,750 P=190,423,995 P=15,660,096
Tax Assessments and Cases As of December 31, 2011, the Bank has no deficiency tax assessments and has no tax cases, litigation and/or prosecution in courts or bodies outside the BIR.