stereotype threat and women s math performance · stereotype threat and women’s math ......
TRANSCRIPT

Stereotype Threat and Women’s Math Performance
Steven J. Spencer
University of Waterloo
Claude M. Steele
Stanford University
and
Diane M. Quinn
University of Michigan
Received February 25, 1998; revised May 23, 1998; accepted June 16, 1998
When women perform math, unlike men, they risk being judged by the negativestereotype that women have weaker math ability. We call this predicamentstereotypethreat and hypothesize that the apprehension it causes may disrupt women’s mathperformance. In Study 1 we demonstrated that the pattern observed in the literature thatwomen underperform on difficult (but not easy) math tests was observed among a highlyselected sample of men and women. In Study 2 we demonstrated that this difference inperformance could be eliminated when we lowered stereotype threat by describing the testas not producing gender differences. However, when the test was described as producinggender differences and stereotype threat was high, women performed substantially worsethan equally qualified men did. A third experiment replicated this finding with a less highlyselected population and explored the mediation of the effect. The implication thatstereotype threat may underlie gender differences in advanced math performance, even
This paper was based on a doctoral dissertation completed by Steven J. Spencer under the directionof Claude M. Steele. This research was supported by a National Institute of Mental Health predoctoralfellowship to Steven J. Spencer and grants from the National Institute of Mental Health (MH45889)and the Russell Sage Foundation (879.304) to Claude M. Steele. The authors thank Jennifer Crocker,Lenard Eron, Hazel Markus, David Myers, Richard Nisbett, William Von Hippel, and severalanonymous reviewers for their helpful advice and comments on earlier drafts of the manuscript. Theyalso thank Latasha Nash, Sabrina Voelpel, and Nancy Faulk for their help in running experimentalsessions.
Correspondence concerning this article and reprint requests should be addressed to Steven J.Spencer, Department of Psychology, University of Waterloo, Waterloo, Ontario, Canada, N2L 3G1.
Journal of Experimental Social Psychology35,4–28 (1999)Article ID jesp.1998.1373, available online at http://www.idealibrary.com on
4
0022-1031/99 $30.00Copyrightr 1999 by Academic PressAll rights of reproduction in any form reserved.
jesp 1373@xyserv2/disk3/CLS_jrnl/GRP_jesp/JOB_jesp35-1/DIV_325a05 cind
No. of Pages—25 First page no.—4 Last page no.—28

those that have been attributed to genetically rooted sex differences, is discussed.r 1999
Academic Press
There was an enormous body of masculine opinion to the effect that nothing could beexpected of women intellectually. Even if her father did not read out loud these opinions,any girl could read them for herself; and the reading, even in the nineteenth century, musthave lowered her vitality, and told profoundly upon her work. There would always havebeen that assertion—you cannot do this, you are incapable of doing that—to protest against,to overcome.
Virginia Woolf (A room of one’s own)
No other science has been more concerned with the nature of prejudice andstereotyping than social psychology. Since its inception, the field has surveyed thecontent of stereotypes (e.g., Katz & Braly, 1933), examined their effect on socialperception and behavior (e.g., Brewer, 1979; Devine, 1989; Duncan, 1976; Sagar& Schofield, 1980; Gaertner & Dovidio, 1986; Hamilton, 1979; Rothbart, 1981),explored the processes through which they are formed (Hamilton, 1979; Rothbart,1981; Smith & Zarate, 1992), examined motivational bases of prejudice (e.g.,Rokeach & Mezei, 1966; Tajfel, 1978), and, along with personality psychologists,examined the origins of prejudice in human character (e.g., Adorno, Frenkel-Brunswick, Levinson, & Sanford, 1950; Ehrlich, 1973; Jordan, 1968). It issurprising, then, that there has been no corresponding attention to the experienceof being the target of prejudice and stereotypes. Of all the topics covered inGordon Allport’s (1954) classicThe nature of prejudice,this one has been amongthe least explored in subsequent research. Happily now, this situation has begun tochange (e.g., Swim & Stangor, 1998, and this issue), at least in the sense of therehaving emerged a greater interest in the effects of, and reactions to, societaldevaluation. For the most part, this work has focused on stigmatization, theexperience of bearing, in the words of Goffman (1963), ‘‘a spoiled identity’’—some characteristic that, in the eyes of society, causes one to be broadly devalued(Crocker & Major, 1989; Frable, 1989; Jones, Farina, Hastorf, Markus, Miller, &Scott, 1984; S. Steele, 1990).
The present research extends this focus by examining the experience of beingin a situation where one faces judgment based on societal stereotypes about one’sgroup, an experience we refer to as ‘‘stereotype threat.’’ This experience beginswith the fact that most devaluing group stereotypes are widely known throughouta society. For example, in a sample of participants who varied widely in prejudicetoward African–Americans, Devine (1989) found that all participants knew thestereotypes about this group. Possibly because communicative processes playsuch a central role in the acquisition of stereotypes (Ashmore & Del Boca,1981)—that is, public and private discourse, the media, school curricula, artisticcanons, and the like—knowledge of them is widely disseminated throughout asociety, even among those who do not find them believable. This means thatpeople who are the targets of these stereotypes are likely to know them too. And
5GENDER STEREOTYPES AND MATH
jesp 1373@xyserv2/disk3/CLS_jrnl/GRP_jesp/JOB_jesp35-1/DIV_325a05 mary

herein lies the threat. In situations where the stereotype applies, they face theimplication that anything they do or any feature they have that fits the stereotypemakes it more plausible that they will be evaluated based on the stereotype. As inthe opening quote by Woolf, there is always that assertion ‘‘to protest against, toovercome.’’ This predicament, we argue, is experienced as a self-threat. Considerthe aging grandfather who has misplaced his keys. Prevailing stereotypes aboutthe elderly—their reputed memory deficits, for example—establish a contextwhere his actions that fit the group stereotype, such as losing keys, make it aplausible explanation of his actions. Stereotype threat, it is important to stress, isconceptualized as a situational predicament—felt in situations where one can bejudged by, treated in terms of, or self-fulfill negative stereotypes about one’sgroup. It is not, we assume, peculiar to the internal psychology of particulargroups. It can be experienced by the members of any group about whom negativestereotypes exist—generation ‘‘X,’’ the elderly, white males, etc. And we stressthat it is situationally specific—experienced in situations where the criticalnegative stereotype applies, but not necessarily in others. In this way, it differsfrom the more cross-situational devaluation of ‘‘marking’’ that, for example,stigma is thought to be (e.g., Jones et al., 1984).
In the present research, our central proposition is this: when a stereotype aboutone’s group indicts an important ability, one’s performance in situations wherethat ability can be judged comes under an extra pressure—that of possibly beingjudged by or self-fulfilling the stereotype—and this extra pressure may interferewith performance. We test this proposition in relation to women’s math perfor-mance, both as a test of the theory and as a means of understanding the processesthat depress women’s performance and participation in math-related areas.Consider their predicament. Widely known stereotypes in this society impute towomen less ability in mathematics and related domains (Eccles, Jacobs, &Harold, 1990; Fennema & Sherman, 1977; Jacobs & Eccles, 1985; Swim, 1994).Thus in situations where math skills are exposed to judgment—be it a formal test,classroom participation, or simply computing the waiter’s tip—women bear theextra burden of having a stereotype that alleges a sex-based inability. This is apredicament that others, not stereotyped in this way, do not bear. The presentresearch tests whether this predicament significantly influences women’s perfor-mance on standardized math tests.
We believe, however, that these processes may also contribute to genderdifferences in other forms of math achievement as well as test performance (andto achievement deficits in other groups that face stereotype threat, e.g., Steele &Aronson, 1995). For example, the stereotype threat that women experience inmath-related domains may cause them to feel that they do not belong in mathclasses. Consequently they may ‘‘disidentify’’ with math as an important domain,that is, avoid or drop the domain as an identity or basis of self-esteem—all toavoid the evaluative threat they might feel in that domain (Major, Spencer,Schmader, Wolfe, & Crocker, 1998; Steele, 1992, 1997). Such a process, then,originating with stereotype threat, may influence women’s participation in math-
6 SPENCER, STEELE, AND QUINN
jesp 1373@xyserv2/disk3/CLS_jrnl/GRP_jesp/JOB_jesp35-1/DIV_325a05 mary

related curricula and professions, as well as their test performance. But for now,we turn to the question of gender differences in math test performance.1
In this literature, although such differences are not common (Hyde, Fennema,& Lamon, 1990; Kimball, 1989; Steinkamp & Maehr, 1983), a general pattern hasbegun to emerge: women perform roughly the same as men except when the testmaterial is quite advanced; then, often, they do worse. Benbow and Stanley (1980,1983) found, for example, that among talented junior high school math students,boys outperformed girls on the quantitative SAT, a test that was obviouslyadvanced for this age group. Similarly, Hyde, Fennema, and Lamon (1990) in anextensive review of the literature found that males did not outperform females incomputational ability or understanding of mathematics concepts, but did outper-form them in advanced problem solving at the high school and college levels.Kimball (1989) found virtually no gender differences in math course work exceptfor college level calculus and analytical geometry courses, where males did better.Finally, several national surveys (Armstrong, 1981; Ethington & Wolfe, 1984;Fennema & Sherman, 1977, 1978; Levine & Ornstein, 1983; Sherman &Fennema, 1977) reached the general conclusion that gender differences are morelikely to emerge as students take more difficult course work in high school andcollege.
Explanations of these differences have tended to fall into two camps. Benbowand Stanley (1980, 1983) have argued that they reflect genetically rooted sexdifferences in math ability. Others (e.g., Eccles, 1987; Fennema & Sherman,1978; Levine & Ornstein, 1983; Meece, Eccles, Kaczala, Goff, & Futterman,1982) argue that these differences reflect gender-role socialization, such thatmales, far more than females, are encouraged to participate in math and thesciences and that the cumulative effects of this differential socialization are mostevident on difficult material.
While acknowledging the contribution of socialization, we suggest that thesedifferences might also reflect the influence of stereotype threat, another processthat may be most rife when the material is advanced for the performer’s skills. It isimportant to stress that a test need not be difficult for stereotype threat to occur.Simply being in a situation where one can confirm a negative stereotype aboutone’s group—the women simply sitting down to the math test, for example, couldbe enough to cause this self-evaluative threat. But for several reasons, it should bemost likely to interfere with test performance when the test is difficult. If the test isless than difficult, a woman’s successful experience with it will counter the threatthe stereotype might otherwise have caused. Also, easier material is simply lesslikely to be interfered with by the pressure that stereotype threat is likely to pose.When the test is difficult, however, any difficulty in solving the problems poses
1 In this paper we will use the terms gender and gender difference when we are referring to adifference that we believe has a psychological cause. We will use the term sex when dividing men andwomen into categories and when we refer to a difference that is purported to be based on biologicaldifferences between men and women.
7GENDER STEREOTYPES AND MATH
jesp 1373@xyserv2/disk3/CLS_jrnl/GRP_jesp/JOB_jesp35-1/DIV_325a05 mary
the stereotype as a possible explanation for one’s performance. Thus for womenstereotype threat should be highest on difficult tests.
STUDY 1
As a first step in our research we sought to replicate the pattern found in theliterature—that women underperform in comparison to men on difficult tests, butperform equally with men on easy tests—in a sample of highly qualified equallyprepared men and women. The men and women were selected to have a verystrong math background.
In the experiment we varied the difficulty of the math test that was given. Thedifficult test was taken from the advanced GRE exam in mathematics. Most of thequestions involved advanced calculus, although some required knowledge ofabstract algebra and real variable theory (Educational Testing Service, 1987b).The easier test was taken from the quantitative section of the GRE general exam.It assumes knowledge of advanced algebra, trigonometry, and geometry, but notcalculus (Educational Testing Service, 1987a). For the well-trained participantsused in this research, this latter exam should be more within the limits of theirskills.
The experiment was administered on a computer. This enabled us to measurethe amount of time participants spent on the test and thereby to assess the extent towhich differences in performance might be related to differences in participants’effort.
Method
Participants and Design
Twenty-eight men and 28 women were selected from the introductory psychol-ogy pool at the University of Michigan. All participants were required to havecompleted at least one semester (but not more than a year) of calculus and to havereceived a grade of ‘‘B’’ or better. They also were required to have scored abovethe 85th percentile on the math subsection of the SAT (Scholastic Aptitude Test)or the ACT (American College Test). Further, on 11-point scales anchored bystrongly agree and strongly disagree, participants had to strongly agree (byresponding between 1 and 3) with both of the following statements: (1) I am goodat math and (2) It is important to me that I am good at math. Markus (1977) hasused these items to measure whether a person is self-schematic in a domain. Theexperiment took the form of a 2 (male and female)3 2 (easier and difficult mathtest) design. The primary dependent variables were performance on the math testand the time participants spent working on the test.
Materials and Apparatus
The tests were administered on a microcomputer. On each question participantshad the options of answering the question, leaving the question blank, or skippingthe question, which allowed them to answer it later. The computer recordedparticipants’ responses and how long they worked on each problem. The test was
8 SPENCER, STEELE, AND QUINN
jesp 1373@xyserv2/disk3/CLS_jrnl/GRP_jesp/JOB_jesp35-1/DIV_325a05 mary

scored using the standard formula for scoring the GRE, which yields a percentagescore corrected so as to disadvantage guessing. Correct items got 1 point, itemsleft blank got no points or deductions, and incorrect items got a deduction of 1point divided by the number of response options for that item (usually 4 or5)—the correction factor for guessing.
Procedure
Participants reported to the laboratory in mixed, male and female groups ofthree to six. They were told, ‘‘We are developing some new tests that we areevaluating across a large group of University of Michigan students. Today youwill be taking a math test.’’ The first screen of the test contained instructions thatwere common to both tests. These instructions explained how to use the computerand how the test would be scored. Participants were also informed that they wouldhave 30 min to complete the test and that they would receive their score at the endof the test. All subsequent instructions were taken directly from the GRE examitself. These instructions provided definitions for certain terms and symbols,explained the range of items on the test, and included a sample item. Theexperimenter typed into the computer a randomly assigned code word thatdetermined the participant’s test difficulty condition. This enabled the experi-menter to remain blind to participants’ condition assignments. The single experi-menter was male. After participants completed the test they were thoroughlydebriefed and thanked for their participation.
Results and Discussion
This experiment tested whether the pattern observed in the literature—thatwomen underperform on difficult tests but perform just as well on easiertest—holds true with the highly selected participants used in this research. As themeans in Fig. 1 show, this pattern did emerge. A two-way ANOVA (Sex3 TestDifficulty) revealed a significant main effect for sex,F(1, 52)5 3.99,p 5 .05, anda main effect for test difficulty,F(1, 52) 5 137.27,p , .001, that were bothqualified by the significant interaction between gender and test difficulty,F(1, 52)55.34,p , .05.2 Student–Newman–Keuls posthoc comparisons of all possible pairsof means showed that women taking the difficult math test did worse than each of
2 Throughout the paper we report the results using ANOVA and posthoc comparisons. We alsoanalyzed the results testing planned comparisons based on our predictions. All of these plannedcomparisons were highly significant,p , .01. We present the ANOVA and posthoc comparisons,however, because these more conservative tests show that the results are significant even without theadded assumptions that are required for a planned comparison. In addition, for each of the analyses ofparticipant’s scores reported in the paper we also conducted analyses of covariance using standardizedtest scores, previous grades, number of semesters of calculus, and importance of math as covariates.These analyses produced results which were essentially the same as those reported. Also, we do notreport participants’ performance in terms of an accuracy index, that is, the percentage of problemscorrect of the number they attempted. Because of the small number of items on the test, almost allparticipants attempted almost all of the items. Therefore, it is not surprising that analyses of this indexyielded results that were virtually identical to those reported in the text.
9GENDER STEREOTYPES AND MATH
jesp 1373@xyserv2/disk3/CLS_jrnl/GRP_jesp/JOB_jesp35-1/DIV_325a05 mary

the other groups and that men taking the difficult math test did worse than men orwomen taking the easier test (p , .05).
On average, women taking the difficult test worked 1497 s; men taking thedifficult test worked 1539 s; women taking the easy test worked 1738 s; and mentaking the easy test worked 1599 s. A two-way (Sex3 Test Difficulty) ANOVA ofthis measure revealed only a marginally significant main effect for test difficulty,with participants spending slightly more time on the easier test,F(1, 52)5 3.151,p , .10. No other effects obtained significance.
These results show that the differences observed in the literature can bereplicated with a highly selected and identified group of participants. Womenunderperformed in comparison to men on the difficult test, but did just as well asmen on the easy test.
STUDY 2
The results of Study 1 mirror the results observed in the literature, but thequestion still remains about what causes these differences. Our position is thatwomen experience stereotype threat—the possibility of being stereotyped—whentaking math tests, and this stereotype threat is especially likely to undermineperformance on difficult tests. But alternative interpretations remain. Perhapswomen equaled men on the easier math exam in Study 1 not because stereotypethreat had less effect when women took this exam, but because only advancedmaterial is sensitive to real ability differences between men and women.
In the present study we tested the effects of stereotype threat directly by givingall participants a difficult math exam—similar to the one used in Study 1—butvaried whether the gender stereotype was relevant to their performance. Wemanipulated the relevance of the stereotype by varying how the test wasrepresented. In the relevance condition participants were told that the test hadshown gender differences in the past—a characterization that explicitly evoked
FIG. 1. Performance on a math test as a function of sex of subject and test difficulty
10 SPENCER, STEELE, AND QUINN
jesp 1373@xyserv2/disk3/CLS_jrnl/GRP_jesp/JOB_jesp35-1/DIV_325a05 mary

the stereotype about women’s math ability.3 In the condition where the stereotypewas to be irrelevant, participants were told that the test had never shown genderdifferences in the past. It is important to stress that this last instruction did notattack the validity of the stereotype itself. It merely represented the test in such away as to make the stereotype irrelevant to interpreting women’s performance onthisparticular math test—it being a test on which women do as well as men.
If women underperformed on the difficult test in Studies 1 because ofstereotype threat—the possibility that one’s performance could be judged stereo-typically—then making the stereotype irrelevant to interpreting their performanceshould eliminate this underperformance. That is, representing the test as insensi-tive to gender differences, and thus as a test for which the gender stereotype isunrelated to their performance difficulty, should prevent performance decrementsdue to stereotype threat. But if this underperformance is due to an abilitydifference between men and women that is detectable only with difficult mathitems, women should underperform regardless of how relevant the stereotype is totheir performance. In this way, this study provides a direct test of our theory—thatit is a stereotype-guided interpretation of performance difficulty that causeswomen’s underperformance on the difficult math tests in these experiments.
Method
Participants and Design
Thirty women and twenty-four men were selected from the introductorypsychology participant pool at the University of Michigan using the same criteriaas in Study 1. The experiment took the form of a 23 2 mixed model design withone between-participants factor (sex) and one within-participants factor (testcharacterization). The primary dependent variables were performance on themath test and the time participants spent working on the test.
Materials and Apparatus
The tests were administered on computers using the same format as describedin Study 1. The difficult test used in Study 1 was divided into two halves, andparticipants were given 15 min to complete each half. The first six questions fromthis earlier test comprised the first test and the next five questions comprised thesecond test. Half of the participants were told that the first test was one on whichthere were gender differences and that the second test was one on which therewere no gender differences. The other half were told the opposite, that the first testwas one for which there were no gender differences and that the second test wasone on which there were gender differences. Participants were randomly assignedto these order conditions.
3 We assumed that telling participants that there were gender differences would lead them to believethat men did better than women. Of course, this conclusion is not inevitable, but all participants in thiscondition when asked informally reported this to be their interpretation.
11GENDER STEREOTYPES AND MATH
jesp 1373@xyserv2/disk3/CLS_jrnl/GRP_jesp/JOB_jesp35-1/DIV_325a05 mary
Procedure
The directions and procedure were basically the same as those of Study 1,except that participants were told that they would be working on two tests andwould have 15 min to complete each test. Participants read: ‘‘As you may knowthere has been some controversy about whether there are gender differences inmath ability. Previous research has sometimes shown gender differences andsometimes shown no gender differences. Yet little of this research has been carriedout with women and men who are very good in math. You were selected for thisexperiment because of your strong background in mathematics.’’ The instructionswent on to report that the first test had been shown to produce gender differencesand that the second test had been shown not to produce such differences, or viceversa, depending on the order condition. The single experimenter was again male.
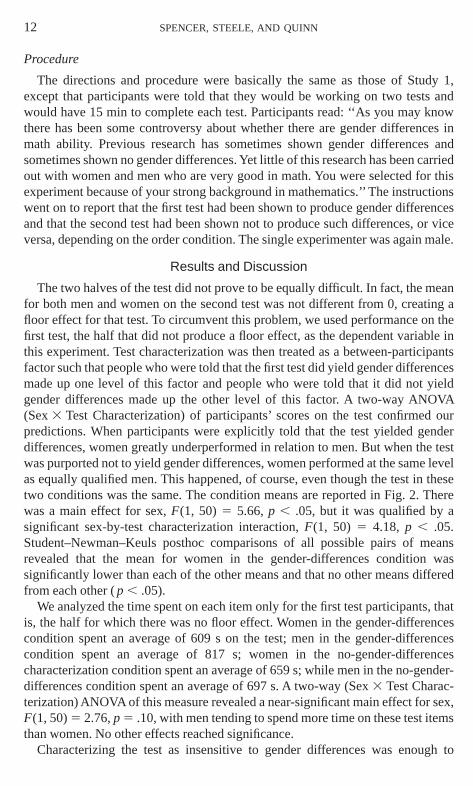
Results and Discussion
The two halves of the test did not prove to be equally difficult. In fact, the meanfor both men and women on the second test was not different from 0, creating afloor effect for that test. To circumvent this problem, we used performance on thefirst test, the half that did not produce a floor effect, as the dependent variable inthis experiment. Test characterization was then treated as a between-participantsfactor such that people who were told that the first test did yield gender differencesmade up one level of this factor and people who were told that it did not yieldgender differences made up the other level of this factor. A two-way ANOVA(Sex3 Test Characterization) of participants’ scores on the test confirmed ourpredictions. When participants were explicitly told that the test yielded genderdifferences, women greatly underperformed in relation to men. But when the testwas purported not to yield gender differences, women performed at the same levelas equally qualified men. This happened, of course, even though the test in thesetwo conditions was the same. The condition means are reported in Fig. 2. Therewas a main effect for sex,F(1, 50) 5 5.66,p , .05, but it was qualified by asignificant sex-by-test characterization interaction,F(1, 50) 5 4.18, p , .05.Student–Newman–Keuls posthoc comparisons of all possible pairs of meansrevealed that the mean for women in the gender-differences condition wassignificantly lower than each of the other means and that no other means differedfrom each other (p , .05).
We analyzed the time spent on each item only for the first test participants, thatis, the half for which there was no floor effect. Women in the gender-differencescondition spent an average of 609 s on the test; men in the gender-differencescondition spent an average of 817 s; women in the no-gender-differencescharacterization condition spent an average of 659 s; while men in the no-gender-differences condition spent an average of 697 s. A two-way (Sex3 Test Charac-terization) ANOVA of this measure revealed a near-significant main effect for sex,F(1, 50)5 2.76,p 5 .10, with men tending to spend more time on these test itemsthan women. No other effects reached significance.
Characterizing the test as insensitive to gender differences was enough to
12 SPENCER, STEELE, AND QUINN
jesp 1373@xyserv2/disk3/CLS_jrnl/GRP_jesp/JOB_jesp35-1/DIV_325a05 mary

totally eliminate women’s underperformance in this experiment. Yet when thesame test was characterized as sensitive to gender differences, women signifi-cantly underperformed in relation to equally qualified men. We believe that bypresenting the test as one on which gender differences do not occur, we made thestereotype of women’s math inability irrelevant to interpreting their performanceon the test—this particular test. It allowed these women to be as unconcerned withthe gender-based stereotype as equally qualified men, which, in turn, allowedthem to perform as well as these men. These findings provide strong evidence thatwomen’s underperformance on these difficult math tests results from stereotypethreat, rather than from sex-linked ability differences that are detectable only onadvanced math material. If women were just unable to do math at the mostadvanced levels as measured on these tests, their performance would not haveimproved when we told them that there were no gender differences on the test theywere taking. That women did improve demonstrates that it was something aboutthe test taking situation rather then something about their ability that accountedfor the difference in their performance.
We should also note that men did slightly worse when they were told that therewere no gender differences on the test than when they were told that there weregender differences. This difference did not obtain significance and thereforeshould be interpreted with caution. However, it might suggest that characterizingthe test as producing gender differences benefited men or that characterizing thetest as not producing gender differences interfered with men’s performance.
Finally, the slight tendency for women in the gender-differences condition tospend less time on the test items did not reach interpretable significance, but could
FIG. 2. Performance on a difficult math test as a function of sex of subject and test characterization
13GENDER STEREOTYPES AND MATH
jesp 1373@xyserv2/disk3/CLS_jrnl/GRP_jesp/JOB_jesp35-1/DIV_325a05 cind
suggest that this condition undermined participants’ motivation—a question towhich we will return.
STUDY 3
Study 2 provided compelling evidence that stereotype threat can depresswomen’s performance on a difficult math test and that eliminating this threat caneliminate their depressed performance. However, for three reasons the experimentdid not make our point as convincingly as it might have. First, the floor effectfound on the second test in Study 2 raises the possibility that the effect ofstereotype threat might be limited to a small number of questions. Second, thehighly selected sample used in Studies 1 and 2 raises the possibility thatstereotype threat effects may have limited generalizability. Third, in Study 2 weexplicitly stated that there were gender differences, leaving open the possibilitythat stereotype threat effects will only emerge when gender differences arealleged. Therefore, in this study we sought to replicate the effect of Study 2 butwith a less highly selected sample from another university, on a test with a widerrange of problems, and with a control group in which no explicit mention ofgender differences is made. If reducing the gender relevance of the stereotype stillimproves women’s performance under these conditions, then we can have greaterconfidence that stereotype threat is playing a significant role in women’s mathperformance.
In addition to this primary purpose, we began to explore the mediation of theeffect of stereotype threat on women’s math performance. Presumably, thepredicament caused by stereotype threat adds to the normal self-evaluative risk ofperformance the further risk for women of confirming or being judged by thenegative stereotype about their math ability. Several literatures suggest that thiskind of threat can interfere with performance. Evaluation apprehension, forexample, is essentially a performance-interfering anxiety and distraction that isaroused by an evaluative audience, real or imagined (e.g., Geen, 1991; Schlenker& Leary, 1982). Stereotype threat can even be thought of as a disruptive reactionto an imagined audience set to view one stereotypically. There is also the literatureon test anxiety (Sarason, 1972; Wigfield & Eccles, 1989; Wigfield & Meece,1988; Wine, 1971)—often characterized as a dispositional characteristic, yetsometimes as a disruptive reaction to an evaluative test-taking context—as well asa literature on ‘‘choking’’ in response to evaluative threat more generally (e.g.,Baumeister & Showers, 1986). Thus ample evidence shows that self-evaluativethreat, of the sort stereotype threat is thought to be, can interfere with intellectualtest performance.
There is the further possibility, however, that women’s underperformance inthese experiments could have stemmed less from stereotype threat than fromlower performance expectations that they brought to the laboratory. Considerableresearch has shown that women generally have lower math performance expecta-tions than men (Crandall, 1969; Dweck & Gilliard, 1975; Dweck & Bush, 1976;Eccles, Jacobs, & Harold, 1990; Eccles Parsons, Adler, Futterman, Goff, Kaczala,
14 SPENCER, STEELE, AND QUINN
jesp 1373@xyserv2/disk3/CLS_jrnl/GRP_jesp/JOB_jesp35-1/DIV_325a05 mary
Meece & Midgley, 1983; Eccles Parsons & Ruble, 1977; Meece et al., 1982). It ispossible, then, that their underperformance in these experiments reflects the effectof lower performance expectations, in turn lowering women’s motivation toperform (e.g., Bandura, 1977, 1986). The ‘‘no-gender-differences’’ condition ofStudy 2, for example, may have overcome women’s underperformance not byrendering the stereotype irrelevant and thus reducing the threat it causes, but byraising women’s performance expectations for this particular test, convincingthem that on this test they would do better. Thus condition differences inself-efficacy rather than differences in stereotype threat could have mediated theeffects of the previous studies.
As a preliminary test of these interpretations, the present study measuredparticipants’ evaluation apprehension, state anxiety, and self-efficacy after theyreceived instructions that manipulated stereotype threat and before they took thedifficult math test. If any of these variables mediate the effects of stereotype threatthey should vary with the instructions for the test—that is, with the independentvariable manipulation—and with performance on the test, thus accounting for theeffects of the instructions on test performance.
Method
Participants and Design
Thirty-six women and 31 men were selected from the introductory psychologyparticipant pool at the State University of New York at Buffalo. In adapting theexperiment to a different participant population, we used a somewhat easier testand selected participants who had scored between 400 and 650 on the mathportion of the SAT and who had completed no more than 1 year of calculus.4
These changes would maintain the basic experimental situation of the test beingquite difficult for the participants but still within the upper ranges of their ability.The experiment took the form of a 23 2 factorial (Sex3 Test Characterization)design. The primary dependent measure was participants’performance on the test.In addition, we collected measures of evaluation apprehension, state anxiety, andself-efficacy.
Materials and Apparatus
The test was given on paper. The participants in this experiment were givenonly one test and were given 20 min to complete it. The test was similar to thetests used in Studies 1 and 2 except that because of the changes in the selectionprocedures and the participant population, we made it somewhat easier. It wasbased on the math portion of the Graduate Management Test (GMAT).
4 Three additional participants were also selected for the experiment that did not report their scoreson the SAT exam. These participants had taken one or two semesters of calculus and had gotten a B orbetter. Two additional subjects, one male and one female, were excluded because they did not make areasonable effort on the test—they worked on the 20-min test for less than 5 min.
15GENDER STEREOTYPES AND MATH
jesp 1373@xyserv2/disk3/CLS_jrnl/GRP_jesp/JOB_jesp35-1/DIV_325a05 mary
Procedure
The directions and procedure were basically the same as those in Studies 1 and2, except for the introduction of questions designed to examine possible mediatorscollected after the test characterization manipulation and prior to the actual test.The no-gender-difference condition was the same as that described for Study 2:Participants were told that there were no gender differences on the test—that menand women performed equally. In the control condition of this experiment,subjects were given no information about gender differences on the test.
After subjects were read the instructions for the test including a sampleproblem, they completed a short questionnaire that had four questions designed tomeasure evaluation apprehension (If I do poorly on this test, people will lookdown on me; People will think I have less ability if I do not do well on this test; IfI don’t do well on this test, others may question my ability; People will look downon me if I do not perform well on this test), five questions designed to measureself-efficacy (I am uncertain I have the mathematical knowledge to do well on thistest; I can handle this test; I am concerned about whether I have enoughmathematical ability to do well on the test; Taking the test could make me doubtmy knowledge of math; I doubt I have the mathematical ability to do well on thetest), and the state–trait anxiety index (Spielberger, Gorsuch, & Lushene, 1970).Upon completion of this questionnaire subjects completed the math test.
Instructions for the experiment including the sample problem were read aloudby the experimenter, so she was not blind to the test characterization manipula-tion. All subjects were run in mixed-sex groups. The sample problem wasincluded so that participants would know that the test was difficult. They did notcomplete the problem; however, to ensure that performance on the sampleproblem did not affect the mediation measures, instructions were read aloud toboth emphasize the instructions and to standardize exposure to the samplequestion. The single experimenter was female. When subjects completed the mathtest they were thoroughly debriefed and thanked for their participation.
Results and Discussion
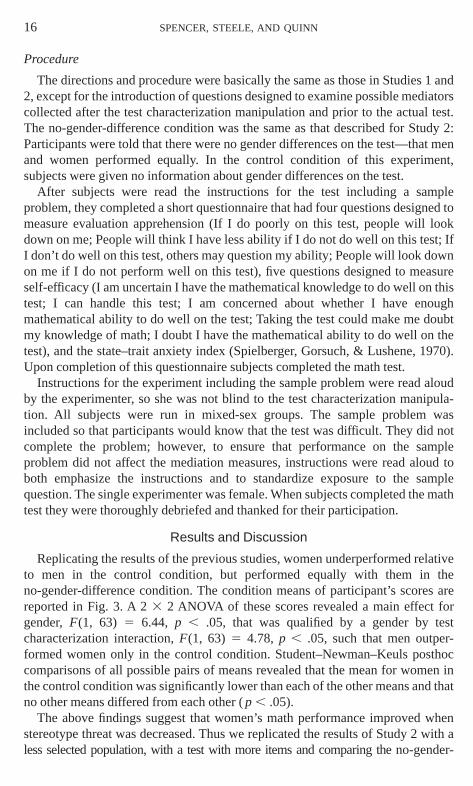
Replicating the results of the previous studies, women underperformed relativeto men in the control condition, but performed equally with them in theno-gender-difference condition. The condition means of participant’s scores arereported in Fig. 3. A 23 2 ANOVA of these scores revealed a main effect forgender,F(1, 63) 5 6.44, p , .05, that was qualified by a gender by testcharacterization interaction,F(1, 63) 5 4.78, p , .05, such that men outper-formed women only in the control condition. Student–Newman–Keuls posthoccomparisons of all possible pairs of means revealed that the mean for women inthe control condition was significantly lower than each of the other means and thatno other means differed from each other (p , .05).
The above findings suggest that women’s math performance improved whenstereotype threat was decreased. Thus we replicated the results of Study 2 with aless selected population, with a test with more items and comparing theno-gender-
16 SPENCER, STEELE, AND QUINN
jesp 1373@xyserv2/disk3/CLS_jrnl/GRP_jesp/JOB_jesp35-1/DIV_325a05 mary
differences condition to a control group where no explicit mention of genderdifferences was made. These two studies provide compelling evidence thatreducing stereotype threat can increase women’s math performance. In addition,as in Study 2, we also found a nonsignificant tendency for men to perform slightlyworse in the no-gender-differences condition than in the control condition,perhaps suggesting that characterizing the test as not producing gender differ-ences has a negative effect on men’s performance.5
The above predicted finding allows us to begin to explore the mediation of theeffect of the test characterization on women’s math performance. Recall that wehad three possible mediators in this study, evaluation apprehension, anxiety, andself-efficacy. To verify these measures, we conducted a factor analysis, withvarimax rotation, on the questionnaire that assessed them. Four factors emergedwith Eigen values greater than 1. These factors correspond quite closely to the
5 It should be noted that this nonsignificant tendency is found repeatedly in stereotype threatresearch. Nonstereotyped groups seem to perform slightly worse in low stereotype threat conditions.This tendency is evident in the Steele and Aronson (1995) study and in several unpublished studies inaddition to Studies 2 and 3 in this paper and therefore might be a reliable effect. At this point we onlyhave speculations about what might cause it. Perhaps nonstereotyped groups gain an advantage by nothaving to consider the possibility that group differences might affect performance on the test and thisadvantage is lost in low stereotype threat conditions. Alternatively, the low stereotype threatmanipulations might heighten anxiety or decrease motivation to perform well among the nonstereo-typed groups. The results of Study 3 do not provide much support for this latter explanation. Amongmen the anxiety, self-efficacy, and evaluation apprehension means and standard deviations for thecontrol and no-gender-differences conditions, respectively, were as follows: anxietyM 5 8.53,s 5
2.72,M 5 7.56,s 5 2.25; self-efficacyM 5 21.07,s 5 4.32,M 5 22.43,s 5 3.88; evaluationapprehensionM 5 8.53,s 5 3.74,M 5 7.75,s 5 4.61. None of these differences are significant.
FIG. 3. Performance on a difficult math test as a function of sex of subject and test characterization
17GENDER STEREOTYPES AND MATH
jesp 1373@xyserv2/disk3/CLS_jrnl/GRP_jesp/JOB_jesp35-1/DIV_325a05 mary

three mediational variables we had intended to measure, so we made scales forthese variables from the items that loaded most strongly on the factors to whichthey corresponded.6 The three scales used in the subsequent analyses and theitems loading on these scales are reported in Table 1.
To examine the mediation of stereotype threat effects we conducted threeadditional analyses as suggested by Baron and Kenny (1986). First, we examinedthe effect of the stereotype threat manipulation on each potential mediator, andthen we examined whether these mediators accounted for the effect of thestereotype threat manipulation on women’s test performance. Finally, we exam-ined each of these mediators individually to see if they could account for the effectof the stereotype threat manipulation on women’s performance.
We conducted these analyses in a regression format just among the women,because it was among women that stereotype threat presumably operated. Toexamine the mediational hypotheses, we first conducted a series of regressionanalyses in which we allowed the stereotype threat manipulation to predict eachof the mediational variables.7 There was no evidence of a relationship between thestereotype threat manipulation and evaluation apprehension (b 5 20.06,T(31) 5 20.311,p . .35) or self-efficacy (b 5 .17, T(31) 5 1.01,p . .15). How-ever, the manipulation did have a marginally significant effect on anxiety(b 5 20.26, T(31) 5 21.3, p 5 .09). Thus, representing the test as gender-fairtended to lower women’s anxiety, but had no discernable effect on their evaluationapprehension or their self-efficacy.8
Next we examined whether any of the potential mediators predicted testperformance and whether these mediators accounted for the effect of the stereo-type threat manipulation on test performance. We used hierarchical regression todo this. In the first block of predictors we included the mediational variables—anxiety, self-efficacy, and evaluation apprehension. In the second block we
6 The factor analysis produced four factors. The results of that factor analysis are reported in Table1. Four additional items from the STAI (I am relaxed; I feel content; I feel steady; and I feel pleasant)loaded on a fourth factor. These items seemed to be less related to anxiety than the other items on theSTAI; therefore, we did not include this factor in our analyses. When this factor was included in theanalyses, it was not related to the test characterization manipulation or to performance on the test anddid not qualify any of the other mediational analyses reported in the paper. To form scales from thefactors we added together participants’ responses to the items that loaded on each factor.
7 In the regression analyses that are reported here we controlled for SAT to avoid leaving out apotentially important factor in the regression equation. By including SAT in the equation two womenwere excluded from the analysis because they failed to report their SAT scores. When SAT is notcontrolled for in the analyses, the results remain much the same and the basic interpretation of the dataremains unqualified, although both the effect of anxiety on performance and the direct effect of the testcharacterization manipulation on performance are somewhat stronger.
8 The means and standard deviations for each of the mediational measures for women in theexperimental group and women in the control group, respectively, were as follows: anxietyM 5 8.16,s 5 2.39,M 5 9.86,s 5 3.51; self-efficacyM 5 21.00,s 5 4.62,M 5 17.36,s 5 4.50; evaluationapprehensionM 5 8.79,s 5 3.63,M 5 10.29,s 5 5.11. Scores ranged on the anxiety scale from 5 to25, on the self-efficacy scale from 4 to 28, and on the evaluation apprehension scale from 5 to 35.Higher numbers indicate more of the psychological construct.
18 SPENCER, STEELE, AND QUINN
jesp 1373@xyserv2/disk3/CLS_jrnl/GRP_jesp/JOB_jesp35-1/DIV_325a05 mary

included the test characterization manipulation. Women’s performance on the testwas the dependent variable. This analysis revealed that anxiety was significantlyrelated to performance (b 5 20.40,T(28) 5 1.98,p , .05), evaluation apprehen-sion was significantly related to performance (b 5 .57,T(28) 5 2.61,p , .05), andself-efficacy was not significantly related to performance (b 5 .20, T(28) 5 .96,p . .30). Furthermore, when these mediators were included in the equation, theeffect of the test characterization manipulation on test performance was reducedto nonsignificance (b 5 .22, T(28) 5 1.26,p . .10). Thus this analysis revealedthat anxiety and evaluation apprehension were related to test performance, butself-efficacy was not.
To provide an additional test of the mediational hypothesis we planned toexamine each of the variables alone as a mediator. However, evaluation apprehen-sion was positively related to performance, while anxiety was negatively relatedto performance and since these variables are positively correlated with each other(r 5 .69) they show a suppressor relationship.9 This means that the effect ofanxiety and evaluation apprehension on performance if considered alone wouldbe muted by the suppressor effect. To correct for this problem we created two newvariables by regressing participants’ evaluation apprehension scores onto theiranxiety scores and vice versa and saving the resulting residual scores. This
9 Although evaluation apprehension was related to performance, it was actually related to perfor-mance in the opposite direction to what was expected. Women in this study performed better whenthey had higher evaluation apprehension than when they had lower evaluation apprehension. Despitethe largeb for evaluation apprehension it would actually be nonsignificant using the one-tailed teststhat we have used throughout these regression analyses because it is in the nonpredicted direction. Asthis might be misleading we reported the two-tailed test in the body of the paper.
TABLE 1THE THREE SCALES CORRESPONDING TO THEPOTENTIAL MEDIATIONAL VARIABLES
DERIVED FROM FACTORANALYSIS
Evaluation apprehension scale (Cronbach’sa 5 .82)1. People will think I have less ability if I do not do well on this test.2. People will look down on me if I do not do well on this test.3. If I don’t do well on this test, others may question my ability.4. If I do poorly on this test, people will look down on me.5. I feel self-confident.
Self-efficacy scale (Cronbach’sa 5 .88)1. I am uncertain I have the mathematical knowledge to do well on this test.2. I am concerned about whether I have enough mathematical ability to do well on the test.3. I doubt I have the mathematical ability to do well on the test.4. I can handle the test.
Anxiety scale (Cronbach’sa 5 .88)1. I am worried.2. I feel nervous.3. I am jittery.4. I feel indecisive.5. Taking the test could make me doubt my knowledge of math.
19GENDER STEREOTYPES AND MATH
jesp 1373@xyserv2/disk3/CLS_jrnl/GRP_jesp/JOB_jesp35-1/DIV_325a05 mary
provided us with a measure of anxiety that was not affected by the suppressorrelationship with evaluation apprehension and a measure of evaluation apprehen-sion that was not affected by the suppressor relationship with anxiety. Thesevariables can be understood as the part of anxiety that is not explained byevaluation apprehension and the part of evaluation apprehension that is notexplained by anxiety. We then tested each of these variables and the self-efficacymeasure individually as possible mediators of the effect of the stereotype threatmanipulation on women’s math scores.
To conduct these analyses we first regressed the stereotype threat manipulationonto each of the possible mediators. Then we conducted a hierarchical regressionwith the potential mediator on the first block and the stereotype threat manipula-tion on the second block. As can be seen in Fig. 4, the part of anxiety that is notexplained by evaluation apprehension may show some evidence of mediation ofthe stereotype threat manipulation in this experiment. The stereotype threatmanipulation had a marginally significant effect on this part of anxiety, and thisanxiety in turn was negatively related to performance, and when this variable wasincluded with the stereotype threat manipulation in a regression analysis, theeffect of the stereotype threat manipulation was somewhat weakened and was nolonger significant. The test for the change in significance for the direct path fromthe stereotype threat manipulation to score on the test when anxiety was includedin the analysis did not reach significance, however,Z 5 1.08,p 5 .14. This resultsuggests that we have not found strong evidence of anxiety as a mediator ofperformance in this experiment. It does not, however, allow us to rule out anxietyas a mediator. Anxiety still might be a mediator of the manipulation in thisexperiment, particularly if it was measured with error (see Baron & Kenny, 1986).
Self-efficacy and the part of evaluation apprehension that was not related toanxiety did not show evidence of mediation. There was no reliable evidence thatself-efficacy was effected by the stereotype threat manipulation and self-efficacydid not predict test performance and, thus, there was no evidence that self-efficacymediated the effect of the stereotype threat manipulation on women’s testperformance. Also, even though evaluation apprehension was related to women’sperformance, its being unaffected by the stereotype threat manipulation meansthat we did not find evidence that evaluation apprehension was a mediator of theeffect of stereotype threat on test performance either. However the failure of thesevariables to mediate the effects in this study must be interpreted with cautiongiven our relatively small sample size and therefore our limited power to detectmediation.
On the whole, these tests of mediation do not give us a clear picture of themediation of the stereotype threat effects in these studies, but they do providesome important information. First, they suggest that self-efficacy and evaluationapprehension are not likely to be mediators of the effect of stereotype threat onwomen’s test performance seen in these studies. Second, although these results donot provide compelling evidence that anxiety is a mediator of these effects,
20 SPENCER, STEELE, AND QUINN
jesp 1373@xyserv2/disk3/CLS_jrnl/GRP_jesp/JOB_jesp35-1/DIV_325a05 mary

neither do they rule anxiety out as a mediator—anxiety is still a plausiblemediator of the stereotype threat effects seen in these studies.
GENERAL DISCUSSION
Being the potential target of a negative group stereotype, we have argued,creates a specific predicament: in any situation where the stereotype applies,behaviors and features of the individual that fit the stereotype make it plausible asa explanation of one’s performance. We call this predicament stereotype threat.The crux of our argument is that collectively held stereotypes in our societyestablish this kind of threat for women in settings that involve math performance,especially advanced math performance. The aim of the present research has beento show that this threat can quite substantially interfere with women’s mathperformance, especially performance that is at the limits of their skills, and thatfactors that remove this threat can improve that performance.
The three experiments reported here provide strong and consistent support forthis reasoning. Study 1 replicated the finding in the literature that womenunderperform on advanced tests but not on tests more within their skills. Study 2attempted to directly manipulate stereotype threat by varying how the test wascharacterized—as one that generally found gender differences or as one that did
FIG. 4. Possible mediators of stereotype threat manipulation tested individually.Note.Anxiety isthe anxiety measure controlling for evaluation apprehension and Evaluation Apprehension is theevaluation apprehension measure controlling for anxiety.
21GENDER STEREOTYPES AND MATH
jesp 1373@xyserv2/disk3/CLS_jrnl/GRP_jesp/JOB_jesp35-1/DIV_325a05 mary

not. Representing test performance as unaffected by gender, we reasoned, wouldmake the gender stereotype irrelevant as an interpretation of test performance,preclude stereotype threat, and thereby allow women to match the performance ofequally qualified men. This is precisely what happened in this condition, while inthe condition where the same test was represented as affected by gender, womenagain underperformed in relation to men. Finally, Study 3 replicated the results ofStudy 2 with a less highly selected population and identified anxiety as a possiblemediator of this effect.
These findings also speak to the generality of stereotype threat’s negative effecton standardized test performance. Other research (Steele & Aronson, 1995;Croizet & Claire, 1998) has shown that stereotype threat can interfere with theperformance of African–American and low socioeconomic students on difficultstandardized tests. Thus, by showing a comparable effect among women testtakers, the present findings help to establish the generality across groups ofstereotype threat’s impairment of standardized test performance.
This is not to say that there are no important differences in the way thatstereotype threat affects different groups. We believe that such important differ-ences do exist. For example, the nature of the stereotype about women’s mathability is different than the stereotype about African–Americans’ ability in school.The stereotype about women is relatively confined—pertaining mainly to mathand science—whereas the stereotype about African–Americans is relativelybroad, impugning almost all academic areas, which may lead to importantdifferences in the way stereotype threat affects women and African–Americans.When women face stereotype threat in a math class, for instance, they can avoid itby dropping math and picking up most other classes. African–Americans,however, face a much more difficult problem when they face stereotype threat inschool. For them it will be much more difficult to avoid. Women can still maintaina view of themselves as smart and capable, but just not good in math, if theydisidentify with math. African–Americans, however, are likely to find it muchmore difficult to maintain a view of themselves as smart and capable, but just notable to cut it at school, if they disidentify with school. This reasoning suggests thatstereotype threat may lead women to disidentify with math more readily than itleads African–Americans to disidentify with school.
The Mediation of Stereotype Threat Effects
Recent research by Steele and Aronson (1995) provided direct evidence of thepsychological state that accompanies stereotype threat among African–Americanstudents taking a difficult standardized verbal test. As in the present research, theyfound that stereotype threat manipulations—for example, making the negativestereotype about their intellectual ability either relevant or irrelevant to their testperformance by representing the test as either diagnostic or nondiagnostic ofability—greatly affected these participants’ performance. But beyond this, theyfound that participants in the stereotype threat condition experienced a distinct
22 SPENCER, STEELE, AND QUINN
jesp 1373@xyserv2/disk3/CLS_jrnl/GRP_jesp/JOB_jesp35-1/DIV_325a05 mary

psychological state marked by cognitive activation of racial stereotypes andstrong motivation to avoid being judged by such stereotypes—a distinct state thataccompanies stereotype threat. We have assumed that this state is experienced as agreater degree of self-evaluative threat—arising from their extra risk of fulfillinga negative group stereotype—and threat of this sort is likely to increase theiremotionality (Baumeister & Showers, 1986; Geen, 1991; Sarason, 1972; Schlen-ker & Leary, 1982; Wine, 1971).
The present studies tested this reasoning more directly. We found evidence thatstereotype threat tended to increase anxiety, but we found little evidence that suchemotionality mediates the observed stereotype threat effects. In particular, wefound that anxiety showed only weak evidence of mediation and that evaluationapprehension and self-efficacy as we measured them in this study did not mediatethe observed stereotype threat effects. These results suggest that the emotionalitythat we assumed undermined people’s performance when they experiencedstereotype threat may accompany their performance but have little impact upon it.
However, we should approach this conclusion with caution. There are severalreasons why it may not be the final story on the mediation of stereotype threateffects. First, in Study 3 where we examined mediation, we only had 34 women, arelatively small sample to detect mediation. This limited power means that thelack of mediational evidence should be interpreted with caution. Second, in othersituations and with other groups of subjects, the effects of stereotype threat maybe mediated differently and some of the factors that we examined here that failedto show mediation might with other groups or in different situations. For example,in some situations, the mediation of stereotype threat effects may involveexpectation effects. Lower expectations about both performance and self-efficacyare, after all, inherent parts of the stereotypes we are considering. Thus it is quitepossible that the priming of these stereotypes in the stereotype threat conditionscould lower expectations among the stereotyped. And this, in turn, could under-mine their performance by undermining their motivation to perform (e.g.,Bandura, 1977, 1986). Now Study 3 shows, we believe, that the effects ofstereotype threat in the present experiments were not mediated in this way.Women’s performance expectations were not significantly affected by the stereo-type threat manipulation and were not related to their test performance. This resultis important in showing that stereotype threat has effects on performance that gobeyond any effect it has on expectations and that it was these extra expectationeffects that mediated the present results.
Having made this point, however, we would stress that these effects are notalways independent. In fact, lowered expectations in response to continuedstereotype threat in a domain, and the demotivation this causes, may be criticalprecursors to disidentifying with the domain—that is, to dropping the domain asan identification and as a basis of self-evaluation (see Major et al., 1998; Steele,1992, 1997). Thus, while the present research shows that lowered expectations arenot necessary mediators of stereotype threat effects, as the period of exposure to
23GENDER STEREOTYPES AND MATH
jesp 1373@xyserv2/disk3/CLS_jrnl/GRP_jesp/JOB_jesp35-1/DIV_325a05 mary

this threatening environment extends—as in the school settings to which we wantto generalize—expectations may play a more important mediational role. If thisproves to be so, then a contribution of the present research is its identifying a newset of conditions that affect these expectations, namely, stereotype threat.
Thus the question of how stereotype threat effects are mediated is a complexone. Certainly in real-life settings these effects are likely to be multiply mediated,involving several processes at once, anxiety, overcautiousness, lowered expecta-tions, and so on. Thus a central challenge of ongoing research will be to discoverwhich mediation occurs under which conditions.
Stereotype Threat and the Genetic Interpretation of Gender Differencesin Math Ability
Our research also has implications for the lingering controversy over the role ofbiology versus the environment in determining the few sex differences that persistin mathematics performance. In its most recent incarnation, this issue hascentered on the claims of Benbow and Stanley (1980, 1983). This much-citedresearch studied a group of seventh and eighth grade boys and girls, exceptionallytalented in math, who scored above 700 on the quantitative section of the SAT.Boys were overrepresented in this group by a factor of 10 to 1. And since theseboys and girls all had the same prior course work in math, the authors took thisfact to indicate a sex difference in biological capacity for math.
There have been several important critiques of this research and its conclusion(e.g., Eccles & Jacobs, 1986; Fennema, 1981; Jacobs & Eccles, 1985). A principalone is that being in the same classes does not mean that boys and girls have thesame environment. Considerable research shows, for example, that boys and girlsare treated very differently in the same classrooms (Constantinople, Cornelius, &Gray, 1988; Leinhardt, Seewald, & Engel, 1979). Over time, this argument goes,these differences in treatment, as well as differences in the larger societalsocialization of women, could produce the findings that Benbow and Stanleyreport. While endorsing these arguments, we suggest that the present findings takethem a step farther. The experience of the testing situation itself may bedramatically different for women and men. As the present research shows,stereotype threat as a feature of this situation can undermine women’s perfor-mance, precisely when the test is difficult. The seventh and eighth grade boys andgirls in the Benbow and Stanley research, who are matched in eighth grade mathability, but given what for them is a very advanced math test (the quantitative SATexam), are essentially in the same position as the participants in the highstereotype threat conditions in the present research. As this threat was able todramatically depress the performance of talented women math students in thepresent experiments, it may well have depressed the performance of the talentedgirls in the Benbow and Stanley research. Thus we may not need to look to theearlier experience of these girls or to their biology to explain their performance.
24 SPENCER, STEELE, AND QUINN
jesp 1373@xyserv2/disk3/CLS_jrnl/GRP_jesp/JOB_jesp35-1/DIV_325a05 mary

The critical factor may be the stereotype threat of the immediate test-takingsituation.10
Finally, in the interest of careful generalization, we note several importantparameters of the stereotype threat effect. It assumes that the test taker construesthe test as a fairly valid assessment of math ability, that they still care about thisability at least somewhat, and that the test be difficult. Stereotype threat effectsshould be less likely if the test is either too easy or too difficult (either in itemcontent or time allotted) to be seen as validly reflecting ability. Also, if the testtaker has already disidentified with math, in the sense of not caring about theirperformance, stereotype threat is not likely to drive their performance lower thantheir lack of motivation would. Thus, it is only when the test reflects on ability andis difficult and the test takers care about this ability that the stereotype becomesrelevant and disturbing as a potential self-characterization. For this reason,stereotype threat probably has its most disruptive real-life effects on women asthey encounter new math material at the limits of their skills—for example, newwork units or a new curriculum level.
This process may also contribute to women’s high attrition from quantitativefields, especially math, engineering, and the physical sciences, where their collegeattrition rate is 21⁄2 times that of men (Hewitt & Seymour, 1991). At some point,continuously facing stereotype threat in these domains, women may disidentify withthem and seek other domains on which to base their identity and esteem. While otherfactors surely contribute to this process—gender-role orientation (Eccles, 1984; Eccleset al., 1990;Yee & Eccles, 1988), lack of role models (Douvan, 1976; Hackett, Esposito,& O’Halloran, 1989), and differential treatment of males and females in school(Constantinople et al., 1988; Peterson & Fennema, 1985)—we suggest thatstereotype threat may be an underappreciated source of these patterns.
Embedded in our analysis is a certain hopefulness: the underperformance ofwomen in quantitative fields may be more tractable than has been assumed. It
10 If stereotype threat depresses women’s performance on standardized math tests relative to that ofmen, one might ask whether it is appropriate to use the SAT as a means of equating men and womenfor skill level in these experiments? Several considerations are relevant. The first bears on the strongmath students selected for these experiments. As the results of Study 1 show, performance-depressingstereotype threat emerged in these studies only when the test was at the limits of their skills. Thus it isvery unlikely that stereotype threat hampered women’s performance on the SAT exam they had takenjust a few years earlier. It too was well within their skills, as indicated by their high scores. Over thefull range of women taking the quantitative SAT, the performance of some, if not many, is likely to bedepressed by stereotype threat and this may well contribute to the mean differences between men andwomen on this test. But because of the strong skills of the women used in our experiments, stereotypethreat is considerably less likely to have affected their SAT performance. Second, even if it did depresstheir SAT performance, it would mean that the women in our studies actually have stronger mathability than the men with whom they were matched. This would only make it more difficult to detect aperformance-depressing effect of stereotype threat; women in these conditions would have tounderperform in relation to men who actually have weaker skills than they do. Thus, whileacknowledging that stereotype threat almost certainly influences the SAT performance in the generalpopulation of test takers, we do not believe that this fact undermines our interpretation of theseexperimental results.
25GENDER STEREOTYPES AND MATH
jesp 1373@xyserv2/disk3/CLS_jrnl/GRP_jesp/JOB_jesp35-1/DIV_325a05 mary

attempts to understand the math performance of women not in terms of internalcharacteristics (e.g., abilities or internalized cultural orientations) but in terms ofthe interaction between the individual and a threatening predicament posed bysocietal stereotypes. Predicaments are circumstantial and thus should be easier tochange than internalized characteristics. And though our experimental manipula-tions have yet to establish broadly generalizable strategies for changing thispredicament, they do show that it can be changed.
REFERENCESAdorno, T. W., Frenkel-Brunswick, E., Levinson, D. J., & Sanford, R. N. (1950).The authoritarian
personality.New York: Harper.Allport, G. W. (1954).The nature of prejudice.Cambridge, MA: Addison–Wesley.Armstrong, J. M. (1981). Achievement and participation of women in mathematics: Results from two
national surveys.Journal of Research in Mathematics Education,12,356–372.Ashmore, R. D., & Del Boca, F. K. (1981). Conceptual approaches to stereotypes and stereotyping. In
D. L. Hamilton (Ed.),Cognitive process in stereotyping and intergroup behavior(pp. 1–35).Hillsdale, NJ: Erlbaum.
Bandura, A. (1977).Social learning theory.Englewood Cliffs, NJ: Prentice Hall.Bandura, A. (1986).Social foundations of thought and action: A social cognitive theory.Englewood
Cliffs, NJ: Prentice Hall.Baron, R. M., & Kenny, D. A. (1986). The moderator-mediator variable distinction in social
psychological research: Conceptual, strategic, and statistical considerations.Journal of Personal-ity and Social Psychology,51,1173–1182.
Baumeister, R. F., & Showers, C. J. (1986). A review of paradoxical performance effects: Chokingunder pressure in sports and mental tests.European Journal of Social Psychology,16,361–383.
Benbow, C. P., & Stanley, J. C. (1980). Sex differences in mathematical ability: Fact or artifact?Science,210,1262–1264.
Benbow, C. P., & Stanley, J. C. (1983). Sex differences in mathematical reasoning ability: More facts.Science,222,1029–1031.
Brewer, M. B. (1979). In-group bias in the minimal intergroup situation: A cognitive-motivationalanalysis.Psychological Bulletin,86,307–324.
Constantinople, A., Cornelius, R., & Gray, J. (1988). The chilly climate: Fact or artifact?Journal ofHigher Education,59,527–550.
Crandall, (1969). Sex differences in expectancy of intellectual and academic reinforcement. In C. P.Smith (Ed.),Achievement-related behaviors in children.New York: Russell Sage Found.
Crocker, J., & Major, B. (1989). Social stigma and self-esteem: The self-protective properties ofstigma.Psychological Review,96,608–630.
Croizet, J. C., & Claire, T. (1998). Extending the concept of stereotype threat to social class: Theintellectual underperformance of students from low socioeconomic backgrounds.Personalityand Social Psychology Bulletin,24,588–594.
Devine, P. (1989). Stereotypes and prejudice: Their automatic and controlled components.Journal ofPersonality and Social Psychology,56,5–18.
Douvan, E. (1976). The role of models in women’s professional development.Psychology of WomenQuarterly,1, 5–20.
Duncan, B. L. (1976). Differential social perception and attribution of intergroup violence: Testing the lowerlimits of stereotyping of blacks.Journal of Personality and Social Psychology,34,590–598.
Dweck, C. S., & Bush, E. (1976). Sex differences in learned helplessness: I. Differential debilitationwith peer and adult evaluations.Developmental Psychology,12,147–156.
Dweck, C. S., & Gilliard, D. (1975). Expectancy statements as determinants of reactions to failure:Sex differences in persistence and expectancy change.Journal of Personality and SocialPsychology,32,1077–1084.
26 SPENCER, STEELE, AND QUINN
jesp 1373@xyserv2/disk3/CLS_jrnl/GRP_jesp/JOB_jesp35-1/DIV_325a05 mary
Eccles, J. S. (1984). Sex differences in achievement patterns. In Sonderegger (Ed.),Nebraskasymposium on motivation(Vol. 32). Lincoln, NE: Univ. of Nebraska Press.
Eccles, J. S. (1987). Gender roles and women’s achievement-related decisions.Psychology of WomenQuarterly,11,135–172.
Eccles, J. S., & Jacobs, J. E. (1986). Social forces shape math attitudes and performance.Signs:Journal of Women in Culture and Society,11,367–380.
Eccles, J. S., Jacobs, J. E., & Harold, R. E. (1990). Gender role stereotypes, expectancy effects, andparents’ socialization of gender differences.Journal of Social Issues,46,183–201.
Eccles Parsons, J. S., Adler, T. F., Futterman, R., Goff, S. B., Kaczala, C. M., Meece, J. L., & Midgley,C. (1983). Expectations, values, and academic behaviors. In J. T. Spence (Ed.).Achievement andachievement motivation(pp. 75–146). New York: Freeman.
Eccles Parsons, J. S., & Ruble, D. N. (1977). The development of achievement-related expectancies.Child Development,48,1075–1079.
Educational Testing Service (1987a).Practicing to take the GRE General Exam.Princeton, NJEducational Testing Service.
Educational Testing Service (1987b).Practicing to take the GRE Mathematics Test.Princeton, NJ:Educational Testing Service.
Ehrlich, H. J. (1973).The social psychology of prejudice: A systematic theoretical review andpropositional inventory of the American social psychological study of prejudice.New York:Wiley.
Ethington, C. A., & Wolfe, L. M. (1984). Sex differences in a causal model of mathematicsachievement.Journal for Research in Mathematics Education,15,361–377.
Fennema, E. H. (1981). Women and mathematics: Does research matter?Journal for Research inMathematics Education,12,380–385.
Fennema, E. H., & Sherman, J. A. (1977). Sex-related differences in mathematics achievement, spatialvisualization, and sociocultural factors.American Educational Research Journal,14,51–71.
Fennema, E. H., & Sherman, J. A. (1978). Sex-related differences in mathematics achievement andrelated factors: A further study.Journal for Research in Mathematics Education,9, 189–203.
Frable, D. E. (1989). Marginal and mindful: Deviants in social interaction.Journal of Personality andSocial Psychology,59,140–149.
Gaertner, S. L., & Dovidio, J. F. (1986). The aversive form of racism. In J. F. Dovidio, & S. L. Gaertner(Eds.)Prejudice, discrimination, and racism(pp. 61–90). New York: Academic Press.
Geen, R. G. (1991). Social motivation.Annual Review of Psychology,42,377–399.Goffman, E. (1963).Stigma: Notes on the management of spoiled identity.New York: Touchstone.Hamilton, D. L. (1979). A cognitive-attributional analysis of stereotyping. In L. Berkowitz (Ed.)
Advances in experimental social psychology(Vol. 12, pp. 53–84). New York: Academic Press.Hackett, G., Esposito, D., & O’Halloran, M. S. (1989). The relationship of role model influence to the
career salience and educational and career plans of college women.Journal of VocationalBehavior,35,164–180.
Hewitt, N. M., & Seymour, E. (1991).Factors contributing to high attrition rates among science andengineering undergraduate majors.Report to the Alfred P. Sloan Foundation.
Hilton, T. L., & Lee, V. E. (1988). Student interest and persistence in science: Changes in theeducational pipeline in the last decade.Journal of Higher Education,59,510–526.
Hyde, J. S., Fennema, E. H., & Lamon, S. J. (1990). Gender differences in mathematics performance:A meta-analysis.Psychological Bulletin,107,139–155.
Jacobs, J. E., & Eccles, J. S. (1985). Gender differences in math ability: The impact of media reportson parents.Educational Researcher,14,20–25.
Jones, E. E., Farina, A., Hastorf, A. H., Markus, H., Miller, D. T., & Scott, R. A. (1984).Social Stigma.New York: Freeman.
Jordan (1968).White over black: American attitudes toward the Negro.Chapel Hill, NC: Univ. ofNorth Carolina Press.
Katz, D., & Braly, K. W. (1933). Racial stereotypes of 100 college students.Journal of Abnormal andSocial Psychology,28,28–290.
27GENDER STEREOTYPES AND MATH
jesp 1373@xyserv2/disk3/CLS_jrnl/GRP_jesp/JOB_jesp35-1/DIV_325a05 mary

Kimball, M. M. (1989). A new perspective on women’s math achievement.Psychological Bulletin,105,198–214.
Leinhardt, G., Seewald, A., & Engel, M. (1979). Learning what’s taught: Sex differences ininstruction.Journal of Educational Psychology,71,432–439.
Levine, D. U., & Ornstein, A. C. (1983). Sex differences in ability and achievement.Journal ofResearch and Development in Education,16,62–72.
Major, B., Spencer, S. J., Schmader, T., Wolfe, C., & Crocker, J. (1998). Coping with negativestereotypes about intellectual performance: The role of psychological disengagement.Personal-ity and Social Psychology Bulletin,24,34–50.
Markus, H. (1977). Self-schemata and processing information about the self.Journal of Personalityand Social Psychology,35.
Meece, J. L., Eccles, J. S., Kaczala, C. M., Goff, S. B., & Futterman, R. (1982). Sex differences in mathachievement: Towards a model of academic choice.Psychological Bulletin,91,324–348.
Peterson, P. L., & Fennema, E. (1985). Effective teaching, student engagement in classroom activities,and sex-related differences in learning mathematics.American Educational Research Journal,22,309–335.
Rokeach, M., & Mezei, L. (1966). Race and shared beliefs as factors in social choice.Science,151,167–172.
Rothbart, M. (1981). Memory processes and social beliefs. In D. L. Hamilton (Ed.)Cognitiveprocesses in stereotyping and intergroup behavior.Hillsdale, NJ: Erlbaum.
Sagar, H.A., &Schofield, J. W. (1980). Racial and behavioral cues in black and white children’s perceptionsof ambiguously aggressive cues.Journal of Personality and Social Psychology,39,590–598.
Sarason, I. G. (1972). Experimental approaches to test anxiety: Attention and the uses of information.In Spielberger, C. D. (Ed.),Anxiety: Current trends in theory and research(Vol. 2). New York:Academic Press.
Schlenker, B. R., & Leary, M. R. (1982). Social anxiety and self-presentation: A conceptualization andmodel.Psychological Bulletin,92,641–669.
Sherman, J. A., & Fennema, E. H. (1977). The study of mathematics by high school girls and boys:Related variables.American Educational Research Journal,14,159–168.
Smith, E. R., & Zarate, M. A. (1992). Exemplar-based model of social judgment.PsychologicalReview,99,3–21.
Spielberger, C. D., Gorsuch, R. L., & Lushene, R. E. (1970).Manual for the State-Trait AnxietyInventory.Palo Alto, CA: Consulting Psychologist Press.
Steele, C. M. (1992). Race and the schooling of Black Americans.Atlantic Monthly,April, 68–78.Steele, C. M. (1997). A threat in the air: How stereotypes shape intellectual identity and performance.
American Psychologist,52,613–629.Steele, C. M., & Aronson, J. (1995). Contending with a stereotype: African-American intellectual test
performance and stereotype threat.Journal of Personality and Social Psychology,69,797–811.Steele, S. (1990).The content of our character: A new vision of race in America.New York: St.
Martin’s Press.Steinkamp, M. W., & Maehr, M. L. (1983). Affect, ability, and science achievement: A quantitative
synthesis of correlation research.Review of Educational Research,53,369–396.Swim, J. K. (1994). Perceived versus meta-analytic effect sizes: An assessment of the accuracy of
gender stereotypes.Journal of Personality and Social Psychology,66,21–36.Swim, J. K., & Stangor, C. (1998).Prejudice: The target’s perspective.New York: Academic Press.Tajfel, H. (Ed.). (1978).Differentiation between social groups.New York: Academic Press.Wigfield, A., & Eccles, J. S. (1989). Test anxiety in elementary and secondary school students.
Educational Psychologist,24,159–183.Wigfield, A., & Meece, J. (1988). Math anxiety in elementary and secondary school students.Journal
of Educational Psychology,80,210–216.Wine, J. (1971). Test anxiety and direction of attention.Psychological Bulletin,76,92–104.Yee, D. K., & Eccles, J. S. (1988). Parent perceptions and attributions for children’s math achieve-
ment.Sex Roles,19,317–333.
28 SPENCER, STEELE, AND QUINN
jesp 1373@xyserv2/disk3/CLS_jrnl/GRP_jesp/JOB_jesp35-1/DIV_325a05 mary