stephen salloway, md, ms professor of neurology and ... · professor of neurology and psychiatry...
TRANSCRIPT
Challenges in Selecting Biomarker Outcomes in AD Clinical Trials
Stephen Salloway, MD, MS Professor of Neurology and Psychiatry
Alpert Medical School, Brown University
8th Leonard Berg Symposium September 28, 2012
Stephen Salloway, M.D., M.S. Disclosure of Interest
Research Support
1. NIA-ADNI
2. NIA-DIAN
3. Alz Assoc-DIAN Clinical Trials
4. Fain Family Foundation, Champlin Foundation, White Family Foundation
5. Avid Radiopharmeceuticals
Speakers Bureau Athena
Clinical Trials
Elan, Janssen AI, Baxter, BMS, Pfizer, Medivation, Genentech, Bayer, GE, Avid, Roche
Consultant
Elan, Janssen AI, Astra-Zeneca, Avid-Lilly, Baxter, Pfizer, Athena, BMS, Merck, and Sanofi
I own no stocks or equity in any pharmaceutical company
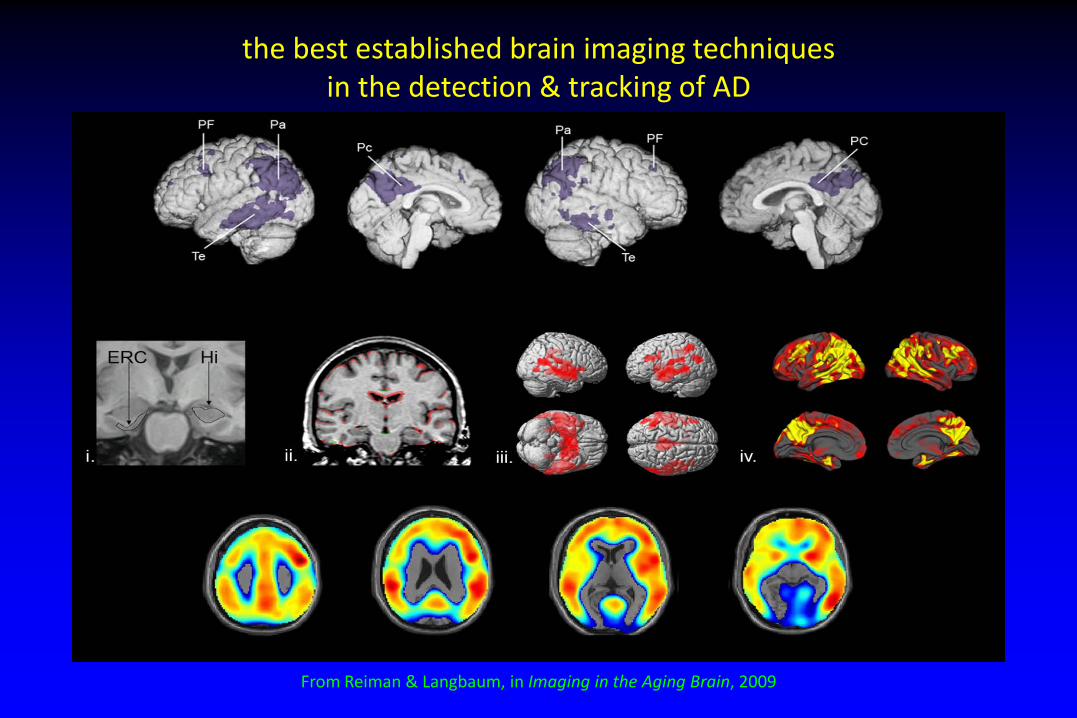
the best established brain imaging techniques in the detection & tracking of AD
From Reiman & Langbaum, in Imaging in the Aging Brain, 2009
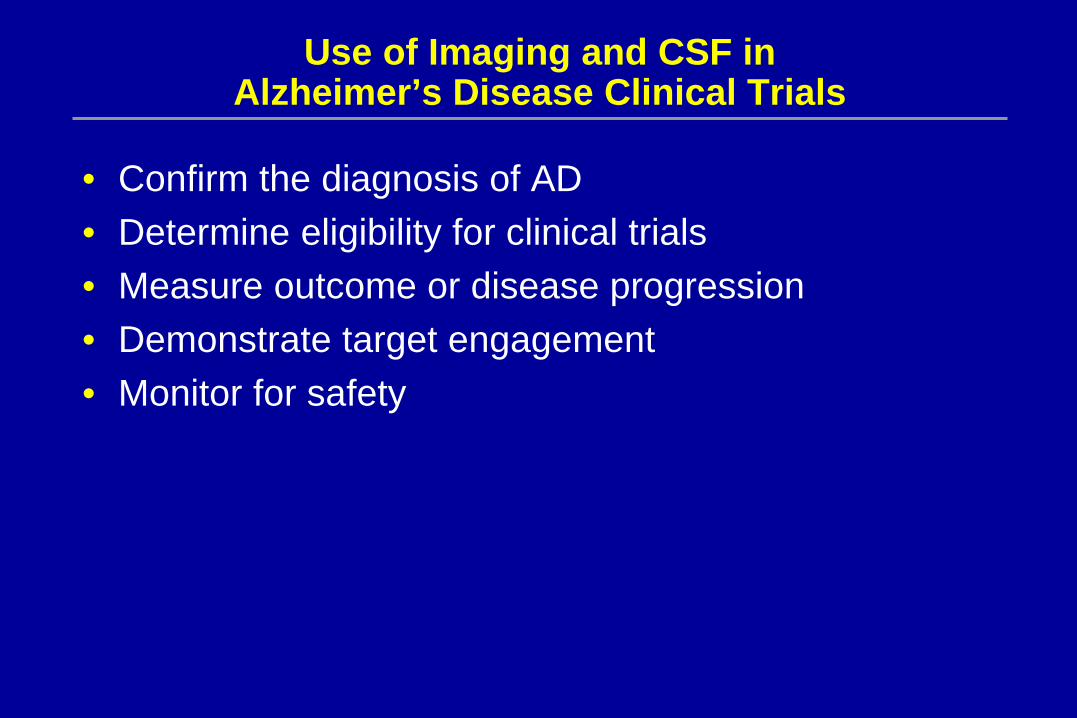
Use of Imaging and CSF in Alzheimer’s Disease Clinical Trials
• Confirm the diagnosis of AD • Determine eligibility for clinical trials • Measure outcome or disease progression • Demonstrate target engagement • Monitor for safety
Volumetric MRI
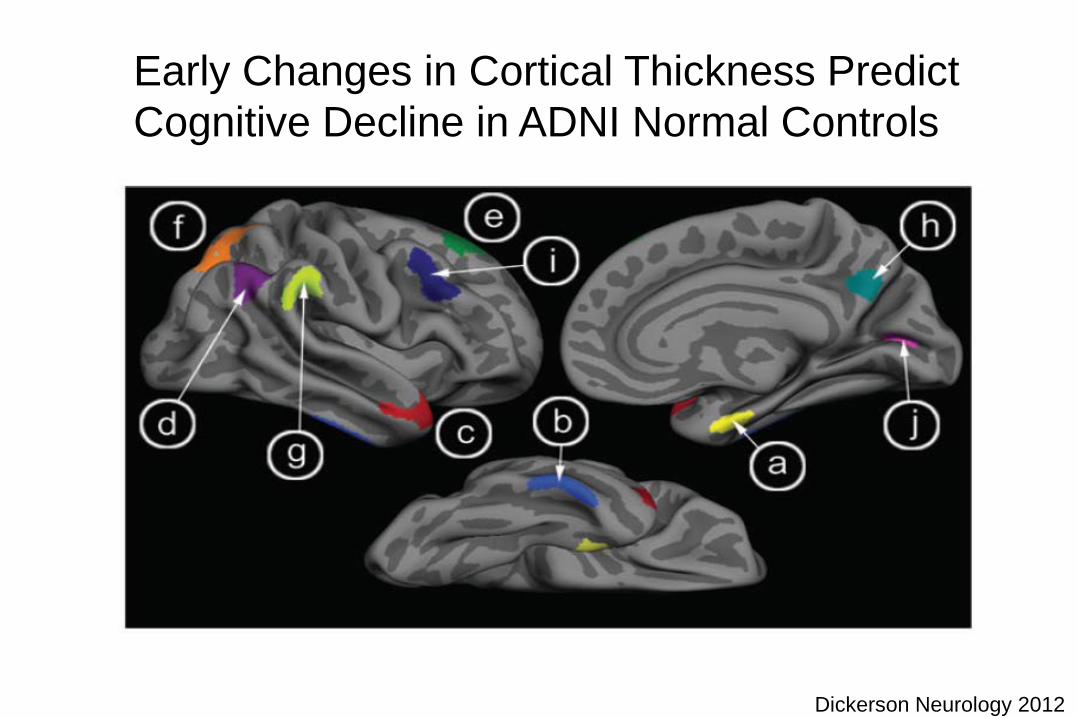
Early Changes in Cortical Thickness Predict Cognitive Decline in ADNI Normal Controls
Dickerson Neurology 2012
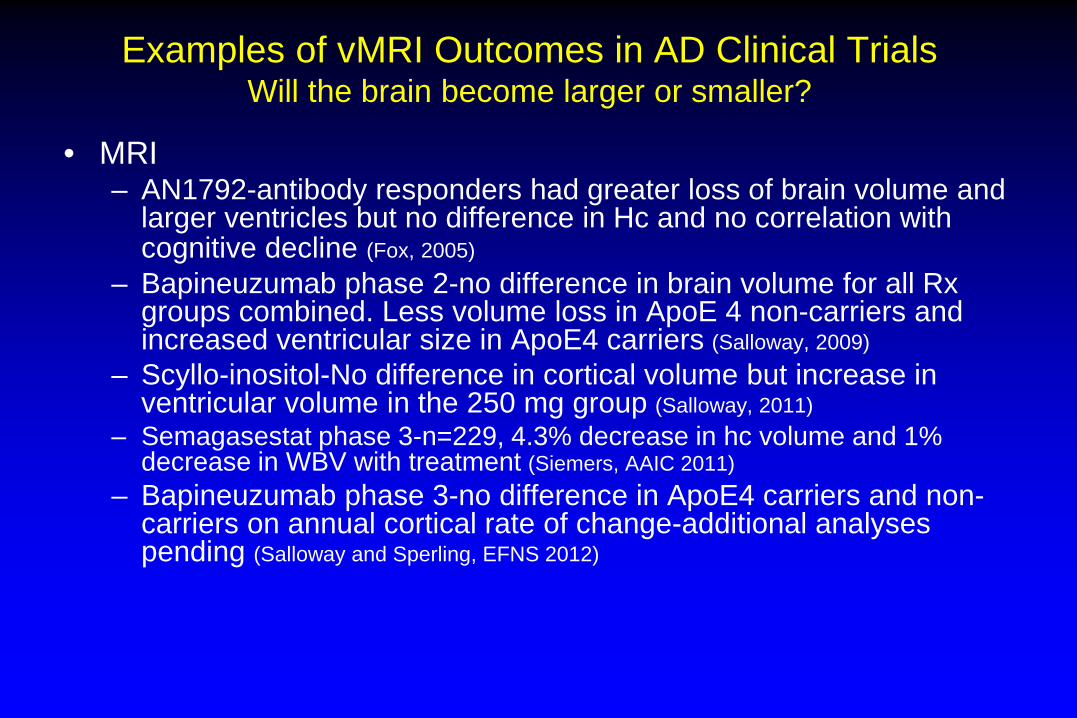
Examples of vMRI Outcomes in AD Clinical Trials Will the brain become larger or smaller?
• MRI – AN1792-antibody responders had greater loss of brain volume and
larger ventricles but no difference in Hc and no correlation with cognitive decline (Fox, 2005)
– Bapineuzumab phase 2-no difference in brain volume for all Rx groups combined. Less volume loss in ApoE 4 non-carriers and increased ventricular size in ApoE4 carriers (Salloway, 2009)
– Scyllo-inositol-No difference in cortical volume but increase in ventricular volume in the 250 mg group (Salloway, 2011)
– Semagasestat phase 3-n=229, 4.3% decrease in hc volume and 1% decrease in WBV with treatment (Siemers, AAIC 2011)
– Bapineuzumab phase 3-no difference in ApoE4 carriers and non-carriers on annual cortical rate of change-additional analyses pending (Salloway and Sperling, EFNS 2012)
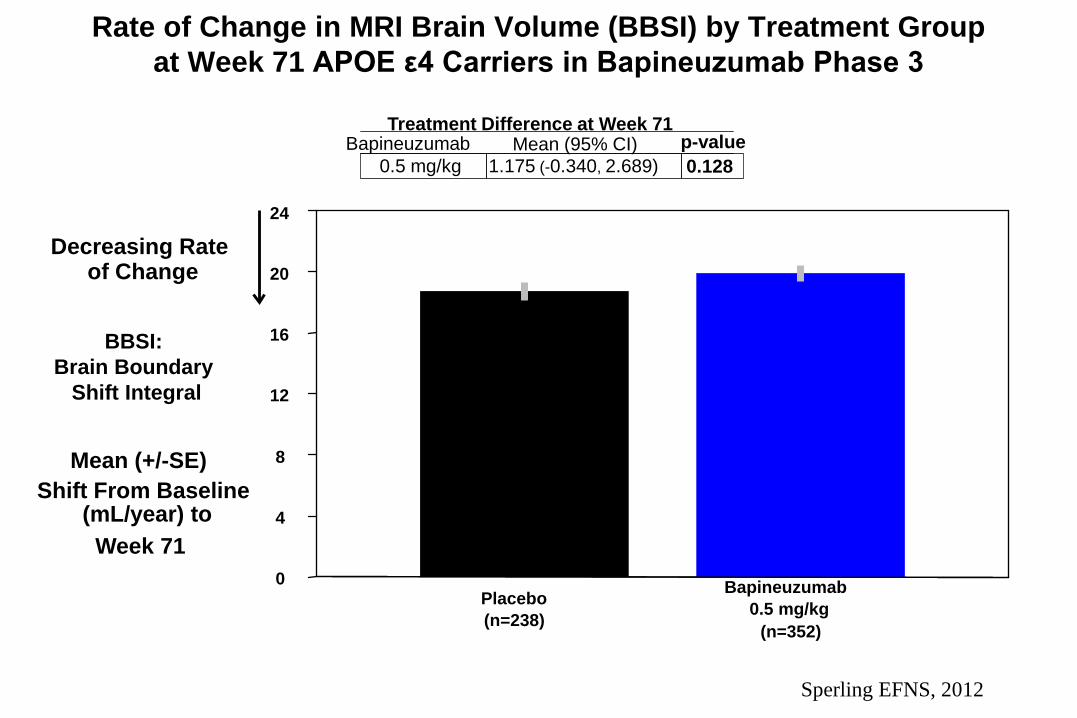
Rate of Change in MRI Brain Volume (BBSI) by Treatment Group at Week 71 APOE ε4 Carriers in Bapineuzumab Phase 3
BBSI: Brain Boundary
Shift Integral
0
4
8
12
16
20
24
Mean (+/-SE) Shift From Baseline
(mL/year) to Week 71
Decreasing Rate of Change
Placebo (n=238)
Bapineuzumab 0.5 mg/kg
(n=352)
0.5 mg/kg 1.175 (-0.340, 2.689) 0.128 Bapineuzumab Mean (95% CI) p-value
Treatment Difference at Week 71
Sperling EFNS, 2012
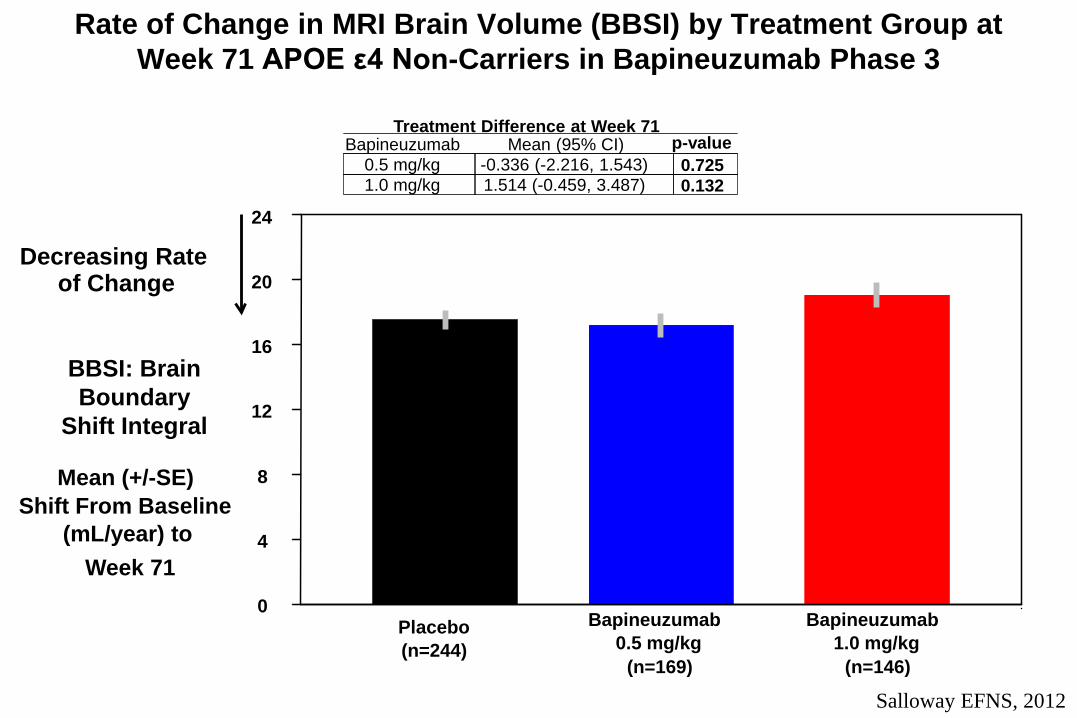
Rate of Change in MRI Brain Volume (BBSI) by Treatment Group at Week 71 APOE ε4 Non-Carriers in Bapineuzumab Phase 3
BBSI: Brain Boundary
Shift Integral
0
4
8
12
16
20
24
Mean (+/-SE) Shift From Baseline
(mL/year) to Week 71
Decreasing Rate of Change
Placebo (n=244)
Bapineuzumab 0.5 mg/kg
(n=169)
Bapineuzumab 1.0 mg/kg
(n=146)
0.5 mg/kg -0.336 (-2.216, 1.543) 0.725 1.0 mg/kg 1.514 (-0.459, 3.487) 0.132
Bapineuzumab Mean (95% CI) p-value Treatment Difference at Week 71
Salloway EFNS, 2012
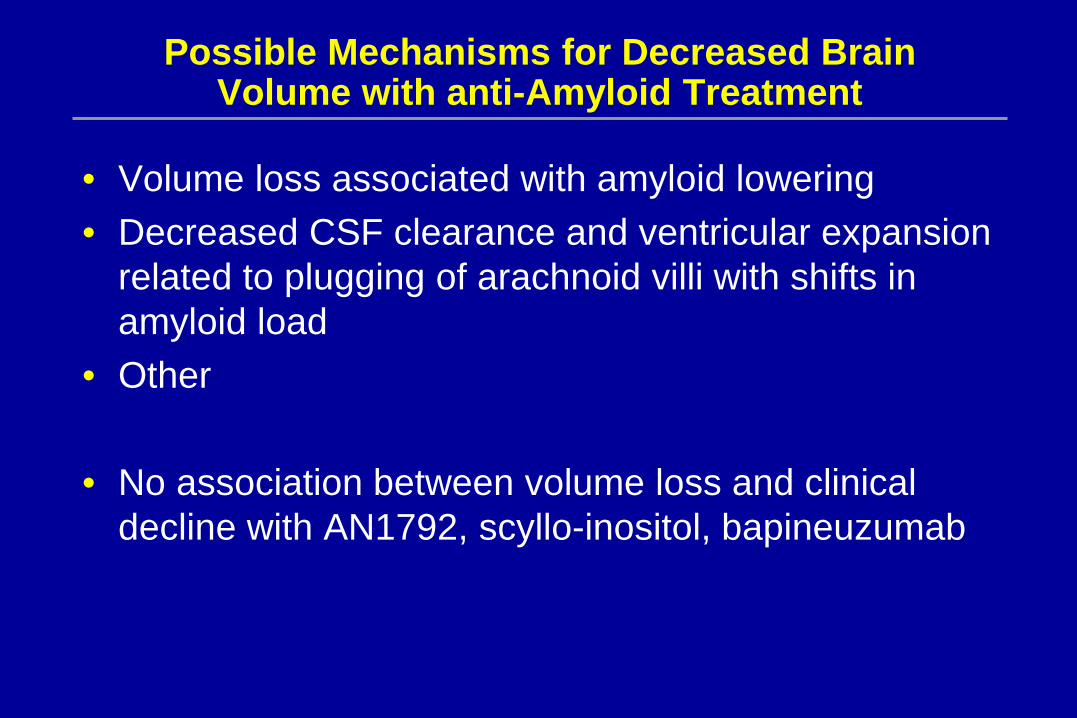
Possible Mechanisms for Decreased Brain Volume with anti-Amyloid Treatment
• Volume loss associated with amyloid lowering • Decreased CSF clearance and ventricular expansion
related to plugging of arachnoid villi with shifts in amyloid load
• Other
• No association between volume loss and clinical decline with AN1792, scyllo-inositol, bapineuzumab
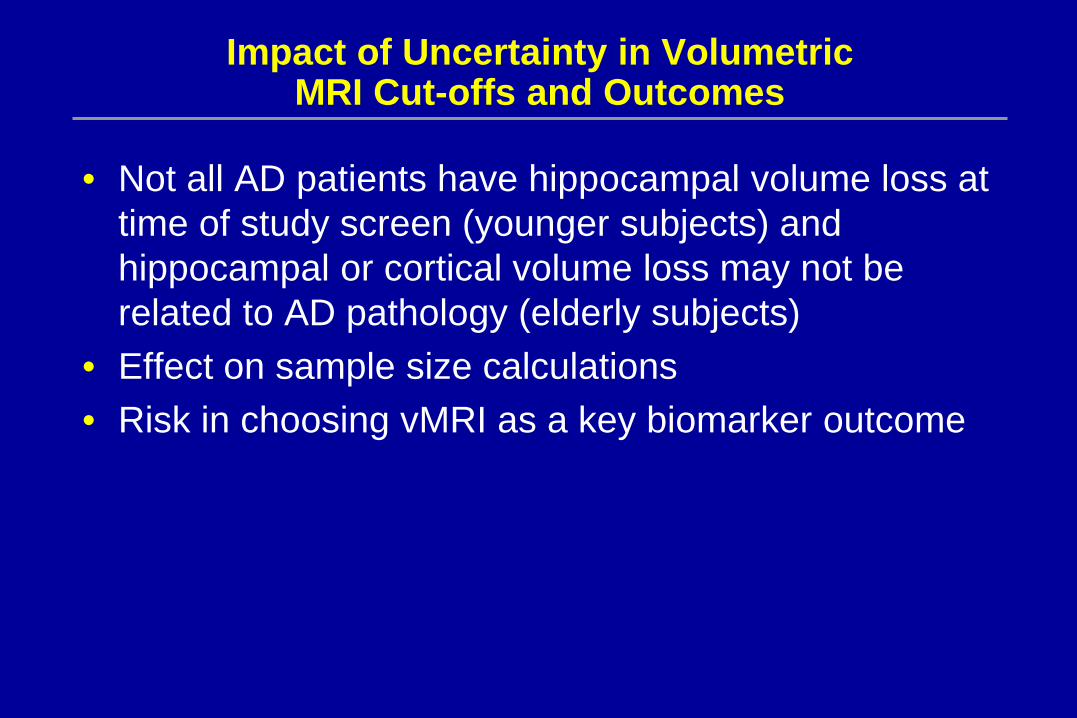
Impact of Uncertainty in Volumetric MRI Cut-offs and Outcomes
• Not all AD patients have hippocampal volume loss at time of study screen (younger subjects) and hippocampal or cortical volume loss may not be related to AD pathology (elderly subjects)
• Effect on sample size calculations • Risk in choosing vMRI as a key biomarker outcome

Amyloid PET
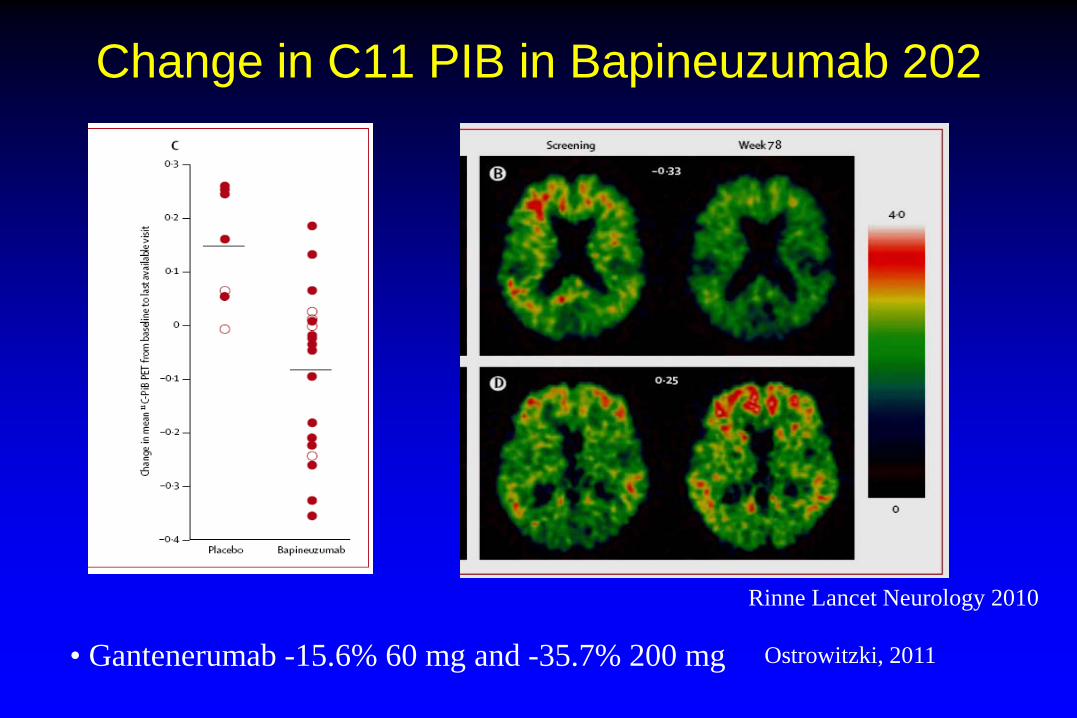
Change in C11 PIB in Bapineuzumab 202
Rinne Lancet Neurology 2010
• Gantenerumab -15.6% 60 mg and -35.7% 200 mg Ostrowitzki, 2011
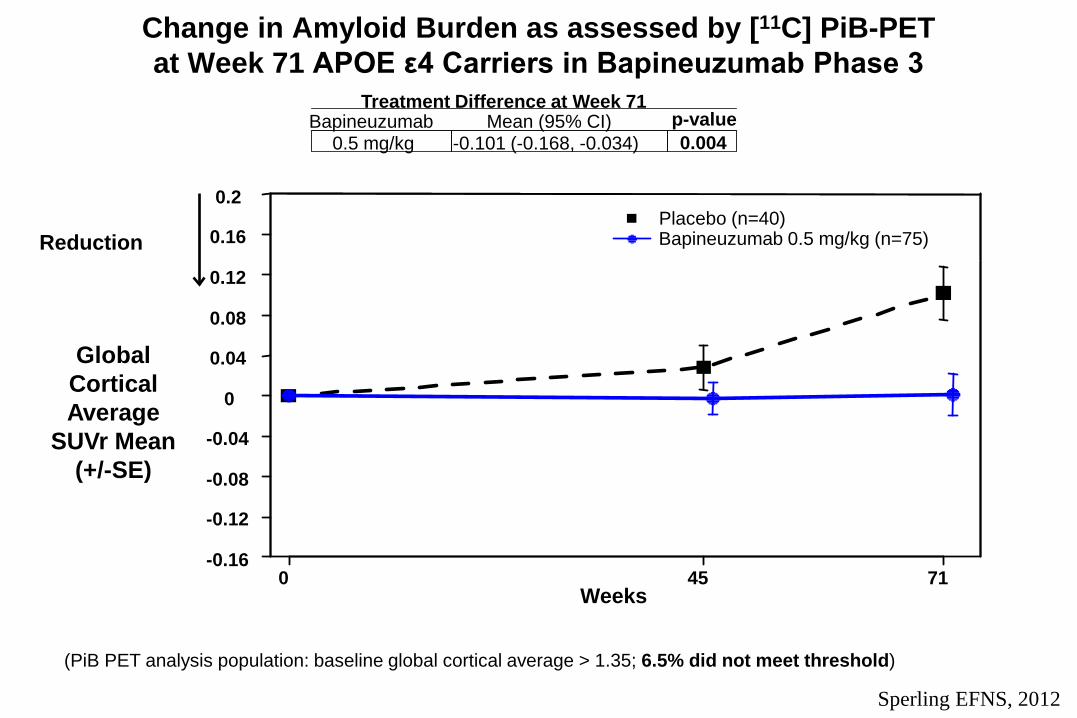
Change in Amyloid Burden as assessed by [11C] PiB-PET at Week 71 APOE ε4 Carriers in Bapineuzumab Phase 3
(PiB PET analysis population: baseline global cortical average > 1.35; 6.5% did not meet threshold)
0 45 71 Weeks
-0.16
-0.12
-0.08
-0.04
0
0.04
0.08
0.12
0.16
0.2
Reduction
0.5 mg/kg -0.101 (-0.168, -0.034) 0.004 Bapineuzumab Mean (95% CI) p-value
Treatment Difference at Week 71
Placebo (n=40) Bapineuzumab 0.5 mg/kg (n=75)
Global Cortical Average
SUVr Mean (+/-SE)
Sperling EFNS, 2012
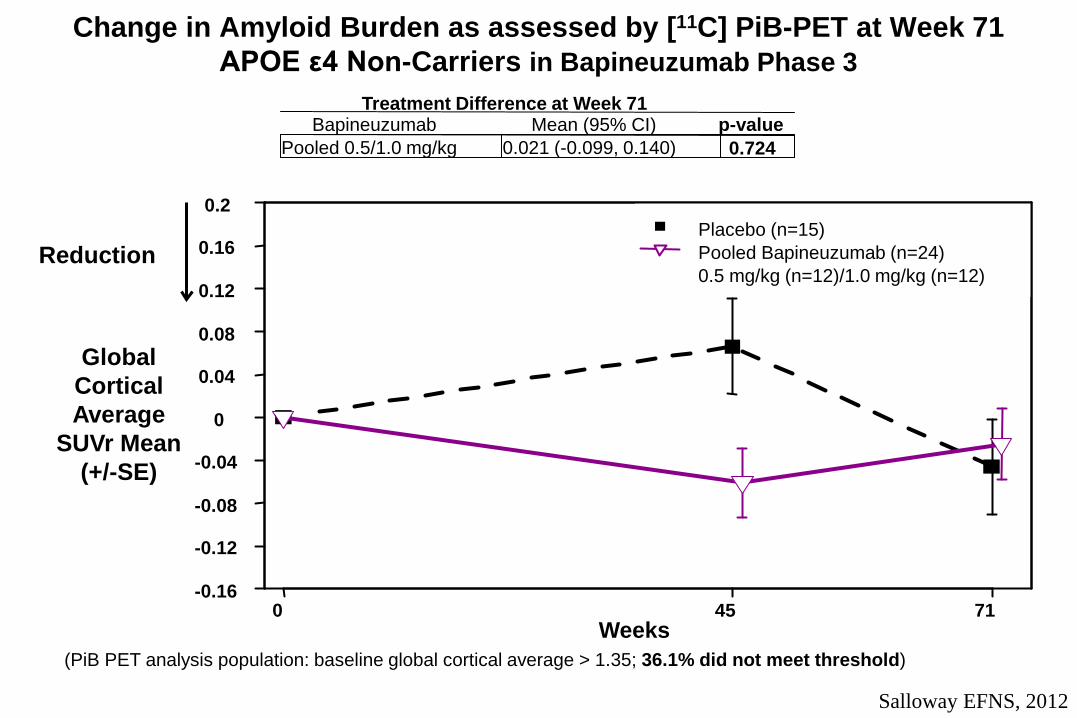
Change in Amyloid Burden as assessed by [11C] PiB-PET at Week 71 APOE ε4 Non-Carriers in Bapineuzumab Phase 3
(PiB PET analysis population: baseline global cortical average > 1.35; 36.1% did not meet threshold)
0 45 71 Weeks
-0.16
-0.12
-0.08
-0.04
0
0.04
0.08
0.12
0.16
0.2
Reduction
Pooled 0.5/1.0 mg/kg 0.021 (-0.099, 0.140) 0.724 Bapineuzumab Mean (95% CI) p-value
Treatment Difference at Week 71
Placebo (n=15) Pooled Bapineuzumab (n=24) 0.5 mg/kg (n=12)/1.0 mg/kg (n=12)
Global Cortical Average
SUVr Mean (+/-SE)
Salloway EFNS, 2012
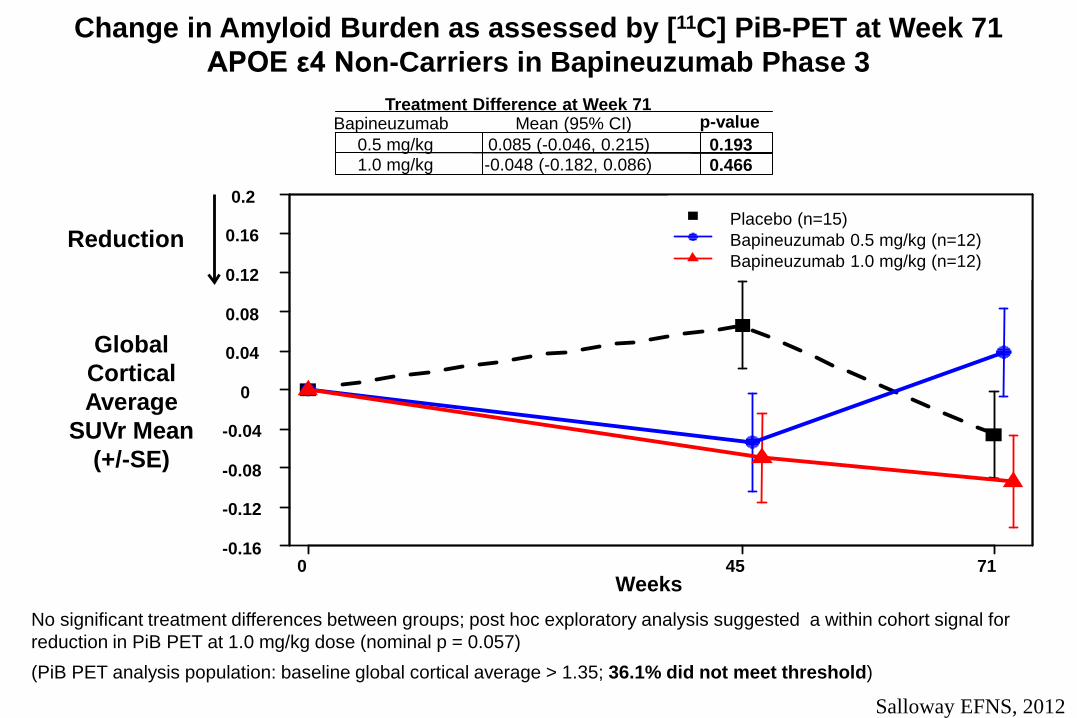
Change in Amyloid Burden as assessed by [11C] PiB-PET at Week 71 APOE ε4 Non-Carriers in Bapineuzumab Phase 3
(PiB PET analysis population: baseline global cortical average > 1.35; 36.1% did not meet threshold)
No significant treatment differences between groups; post hoc exploratory analysis suggested a within cohort signal for reduction in PiB PET at 1.0 mg/kg dose (nominal p = 0.057)
Global Cortical Average
SUVr Mean (+/-SE)
0 45 71 Weeks
-0.16
-0.12
-0.08
-0.04
0
0.04
0.08
0.12
0.16
0.2
Reduction
0.5 mg/kg 0.085 (-0.046, 0.215) 0.193 1.0 mg/kg -0.048 (-0.182, 0.086) 0.466
Bapineuzumab Mean (95% CI) p-value Treatment Difference at Week 71
Placebo (n=15) Bapineuzumab 0.5 mg/kg (n=12) Bapineuzumab 1.0 mg/kg (n=12)
Salloway EFNS, 2012
Possible Reasons for the Sizeable Number of ApoE Non-Carriers with Low SUVr
• Measurement error • Presence of additional pathologies • Subjects did not have AD
• Plan to compare CSF and PIB in subjects who participated in both sub-studies
• Future studies should ensure that subjects receiving anti-amyloid treatments have significant amyloid pathology

CSF
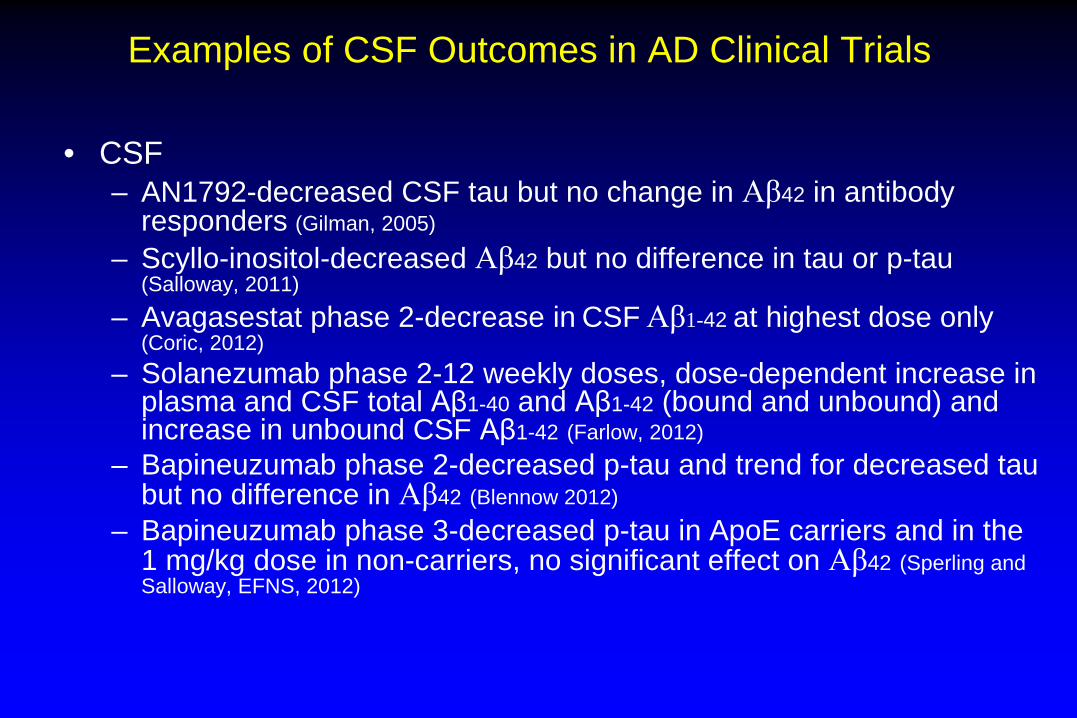
Examples of CSF Outcomes in AD Clinical Trials
• CSF – AN1792-decreased CSF tau but no change in Aβ42 in antibody
responders (Gilman, 2005)
– Scyllo-inositol-decreased Aβ42 but no difference in tau or p-tau (Salloway, 2011)
– Avagasestat phase 2-decrease in CSF Aβ1-42 at highest dose only (Coric, 2012)
– Solanezumab phase 2-12 weekly doses, dose-dependent increase in plasma and CSF total Aβ1-40 and Aβ1-42 (bound and unbound) and increase in unbound CSF Aβ1-42 (Farlow, 2012)
– Bapineuzumab phase 2-decreased p-tau and trend for decreased tau but no difference in Aβ42 (Blennow 2012)
– Bapineuzumab phase 3-decreased p-tau in ApoE carriers and in the 1 mg/kg dose in non-carriers, no significant effect on Aβ42 (Sperling and Salloway, EFNS, 2012)
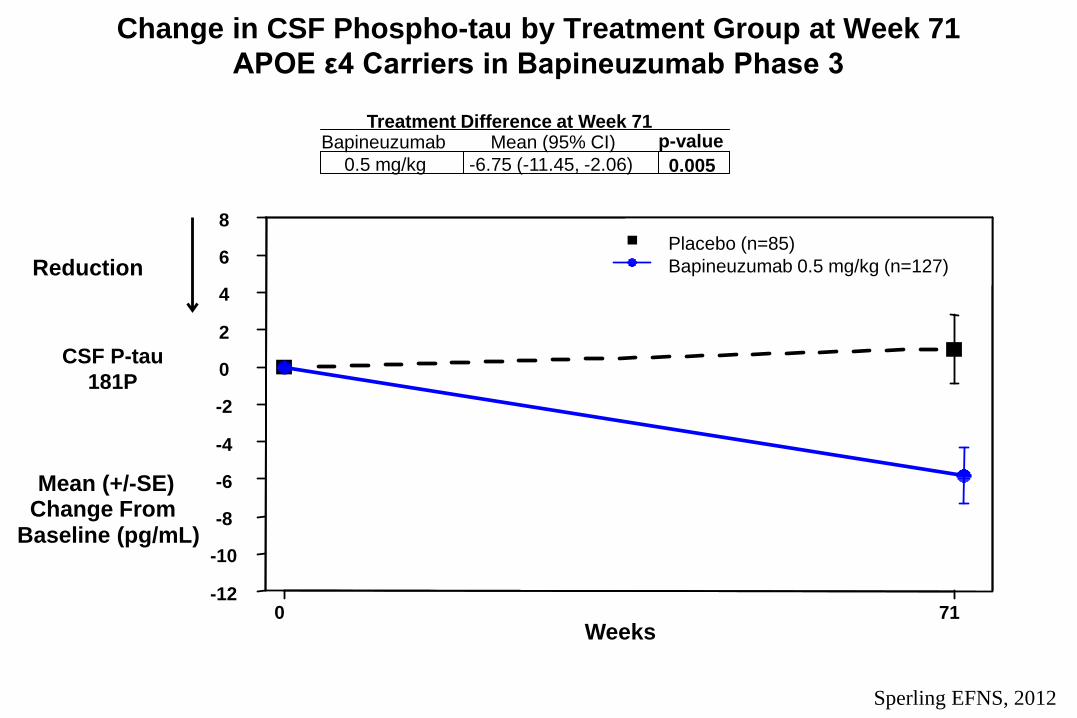
Change in CSF Phospho-tau by Treatment Group at Week 71 APOE ε4 Carriers in Bapineuzumab Phase 3
CSF P-tau 181P
0 71 Weeks
-12
-10
-8
-6
-4
-2
0
2
4
6
8
Mean (+/-SE) Change From
Baseline (pg/mL)
Reduction
0.5 mg/kg -6.75 (-11.45, -2.06) 0.005 Bapineuzumab Mean (95% CI) p-value
Treatment Difference at Week 71
Placebo (n=85) Bapineuzumab 0.5 mg/kg (n=127)
Sperling EFNS, 2012
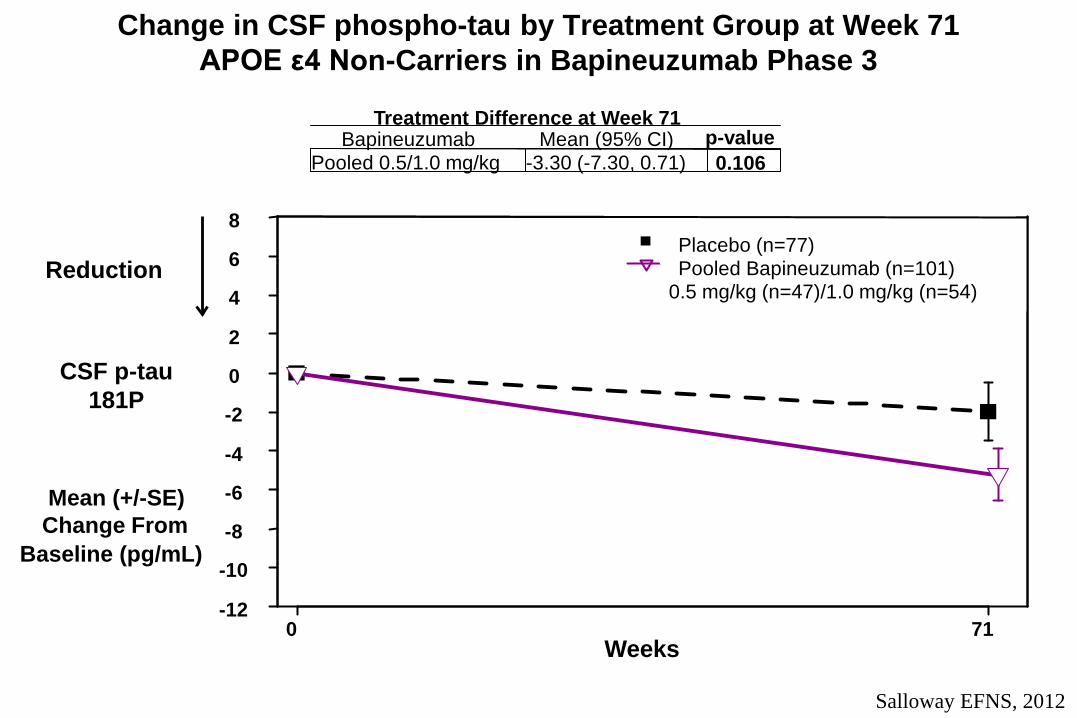
Change in CSF phospho-tau by Treatment Group at Week 71 APOE ε4 Non-Carriers in Bapineuzumab Phase 3
CSF p-tau 181P
0 71 Weeks
-12
-10
-8
-6
-4
-2
0
2
4
6
8
Mean (+/-SE) Change From
Baseline (pg/mL)
Reduction
Pooled 0.5/1.0 mg/kg -3.30 (-7.30, 0.71) 0.106 Bapineuzumab Mean (95% CI) p-value
Treatment Difference at Week 71
Placebo (n=77) Pooled Bapineuzumab (n=101)
0.5 mg/kg (n=47)/1.0 mg/kg (n=54)
Salloway EFNS, 2012
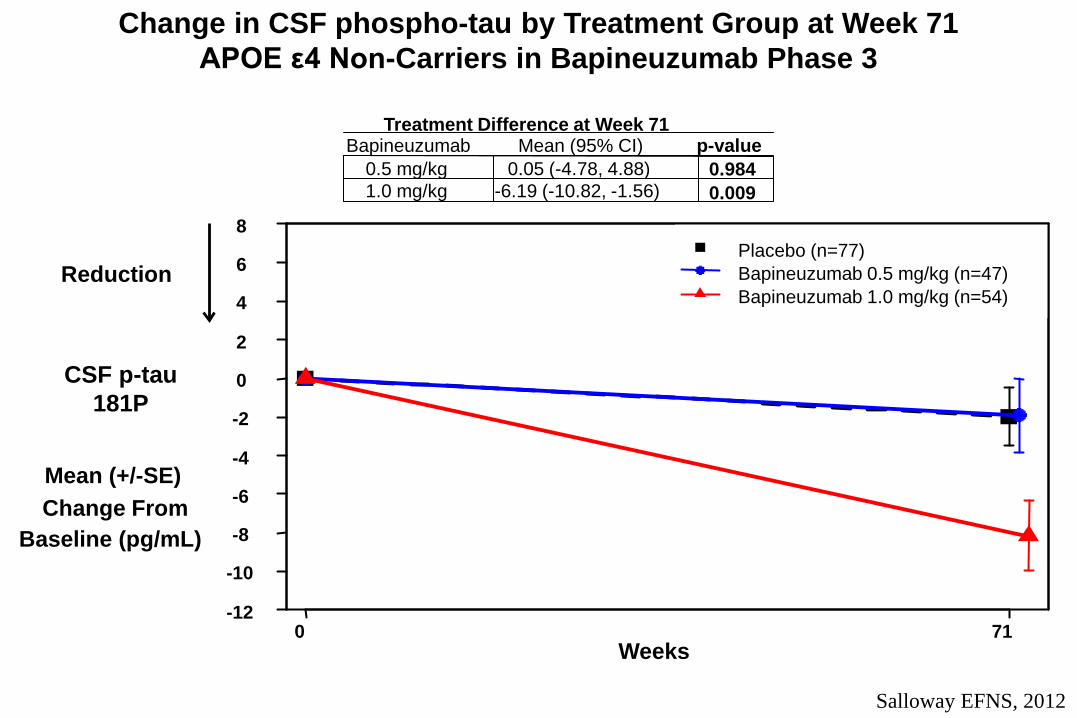
Change in CSF phospho-tau by Treatment Group at Week 71 APOE ε4 Non-Carriers in Bapineuzumab Phase 3
CSF p-tau 181P
0 71 Weeks
-12
-10
-8
-6
-4
-2
0
2
4
6
8
Mean (+/-SE) Change From
Baseline (pg/mL)
Reduction
0.5 mg/kg 0.05 (-4.78, 4.88) 0.984 1.0 mg/kg -6.19 (-10.82, -1.56) 0.009
Bapineuzumab Mean (95% CI) p-value Treatment Difference at Week 71
Placebo (n=77) Bapineuzumab 0.5 mg/kg (n=47) Bapineuzumab 1.0 mg/kg (n=54)
Salloway EFNS, 2012
Targets for Amyloid-Lowering and CSF Markers of Neurodegeneration
• Smaller PIB and p-tau effect sizes in bapineuzumab phase 3 – Phase 2 combined carriers and non-carriers and included higher doses
• Does the magnitude of amyloid-lowering matter – Is the target maximizing the decrease from baseline,
stabilization, or slowing rate of increase? – How will the outcomes vary across the stages of AD?
• Tolerability may limit dose and optimal anti-amyloid effects – Different Abeta targets – Compound modifications – Alternative dosing strategies – Combining anti-amyloid therapies-e.g., BACE inhibitor and
monoclonal antibody or anti-amyloid and tau compounds
Dissociation between biomarker and
clinical results in bapineuzumab phase 3
• No evidence of clinical benefit in mild-moderate AD dementia but PiB PET provides evidence of target engagement and p-tau lowering suggests effects on downstream neurodegeneration
Potential explanations • AD dementia stage of disease may be too far advanced (with widespread
irreversible neuronal loss) to demonstrate clinical benefit • Anti-amyloid monoclonal antibodies may not be the most effective way to target
amyloid • Anti-amyloid therapies may require intervention at earlier stage of AD • May need greater amyloid reduction
Utilizing Amyloid Cut-offs as Selection Criteria in AD Clinical Trials
• Cut-offs may vary at different stages of the disease and by genetic status
• Issues with assay variability • CSF cut-off-Aβ42, tau/Aβ42, or both • High screen failure rate • Include only amyloid + in symptomatic trials • Include amyloid + in secondary prevention/preclinical
trials and possibly amyloid negative in high risk populations
MRI Safety Monitoring for ARIA
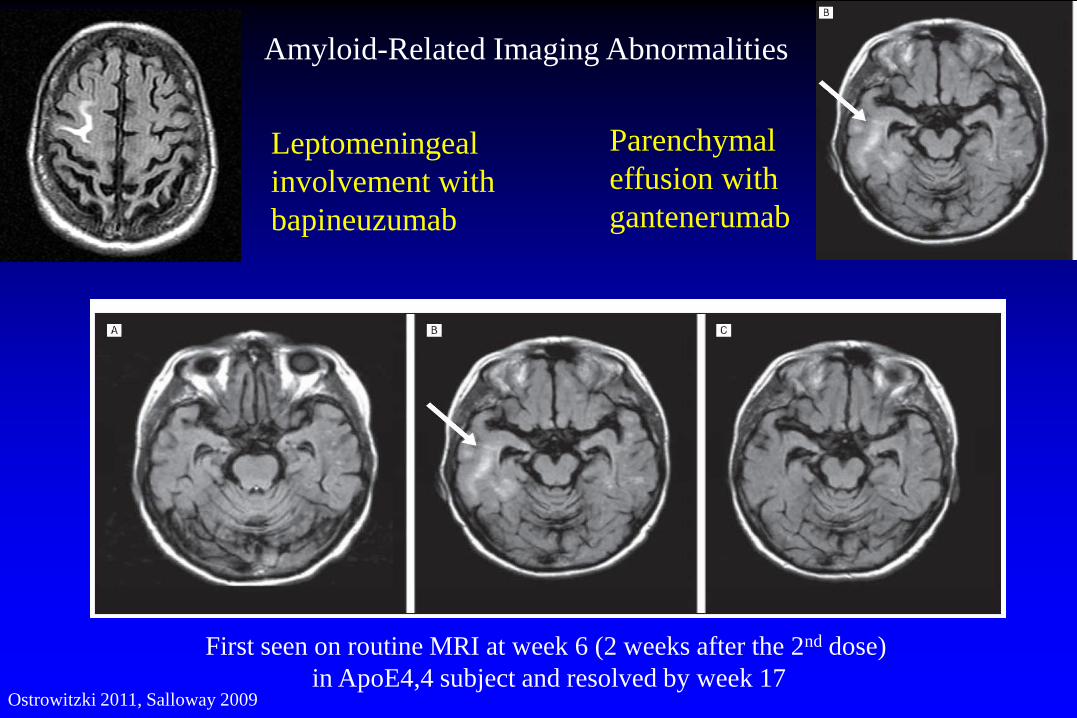
Ostrowitzki 2011, Salloway 2009
First seen on routine MRI at week 6 (2 weeks after the 2nd dose) in ApoE4,4 subject and resolved by week 17
Leptomeningeal involvement with bapineuzumab
Parenchymal effusion with gantenerumab
Amyloid-Related Imaging Abnormalities
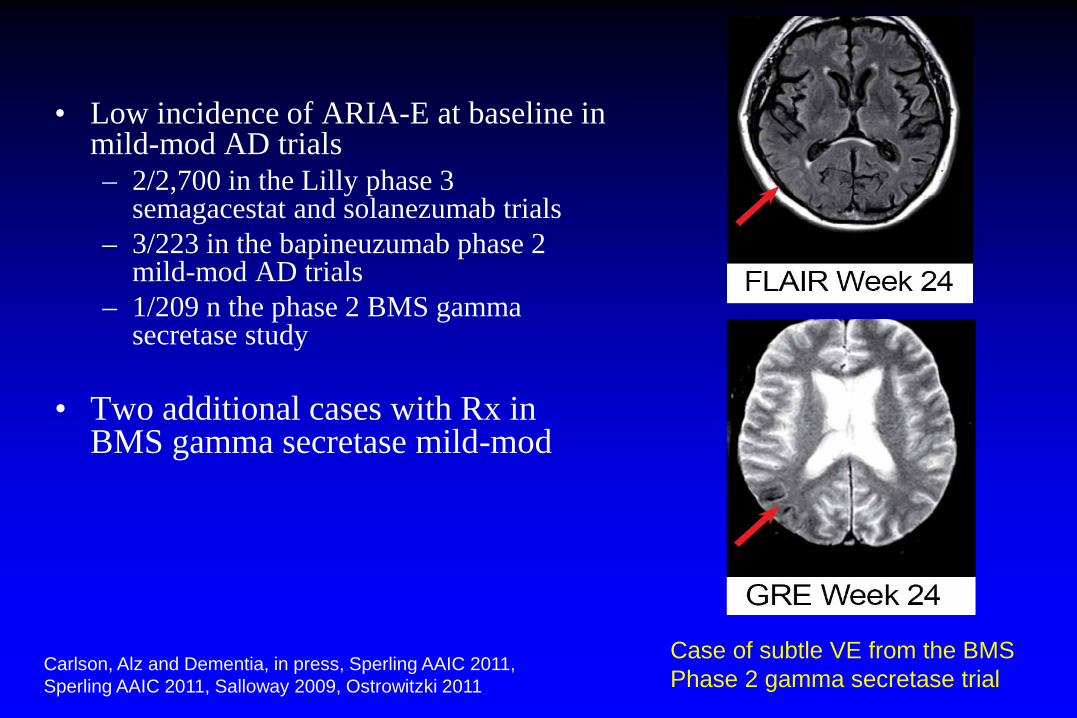
• Low incidence of ARIA-E at baseline in mild-mod AD trials – 2/2,700 in the Lilly phase 3
semagacestat and solanezumab trials – 3/223 in the bapineuzumab phase 2
mild-mod AD trials – 1/209 n the phase 2 BMS gamma
secretase study
• Two additional cases with Rx in BMS gamma secretase mild-mod
Case of subtle VE from the BMS Phase 2 gamma secretase trial
Carlson, Alz and Dementia, in press, Sperling AAIC 2011, Sperling AAIC 2011, Salloway 2009, Ostrowitzki 2011
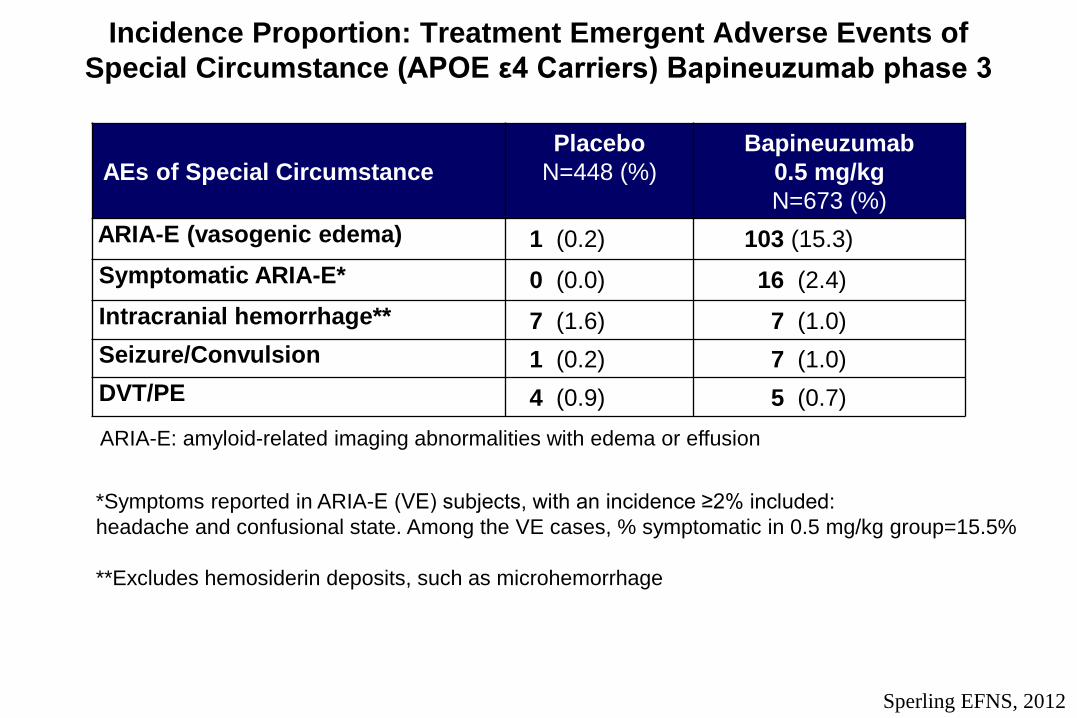
Incidence Proportion: Treatment Emergent Adverse Events of Special Circumstance (APOE ε4 Carriers) Bapineuzumab phase 3
AEs of Special Circumstance Placebo
N=448 (%)
Bapineuzumab 0.5 mg/kg N=673 (%)
ARIA-E (vasogenic edema) 1 (0.2) 103 (15.3) Symptomatic ARIA-E* 0 (0.0) 16 (2.4) Intracranial hemorrhage** 7 (1.6) 7 (1.0) Seizure/Convulsion 1 (0.2) 7 (1.0) DVT/PE 4 (0.9) 5 (0.7)
*Symptoms reported in ARIA-E (VE) subjects, with an incidence ≥2% included: headache and confusional state. Among the VE cases, % symptomatic in 0.5 mg/kg group=15.5% **Excludes hemosiderin deposits, such as microhemorrhage
ARIA-E: amyloid-related imaging abnormalities with edema or effusion
Sperling EFNS, 2012
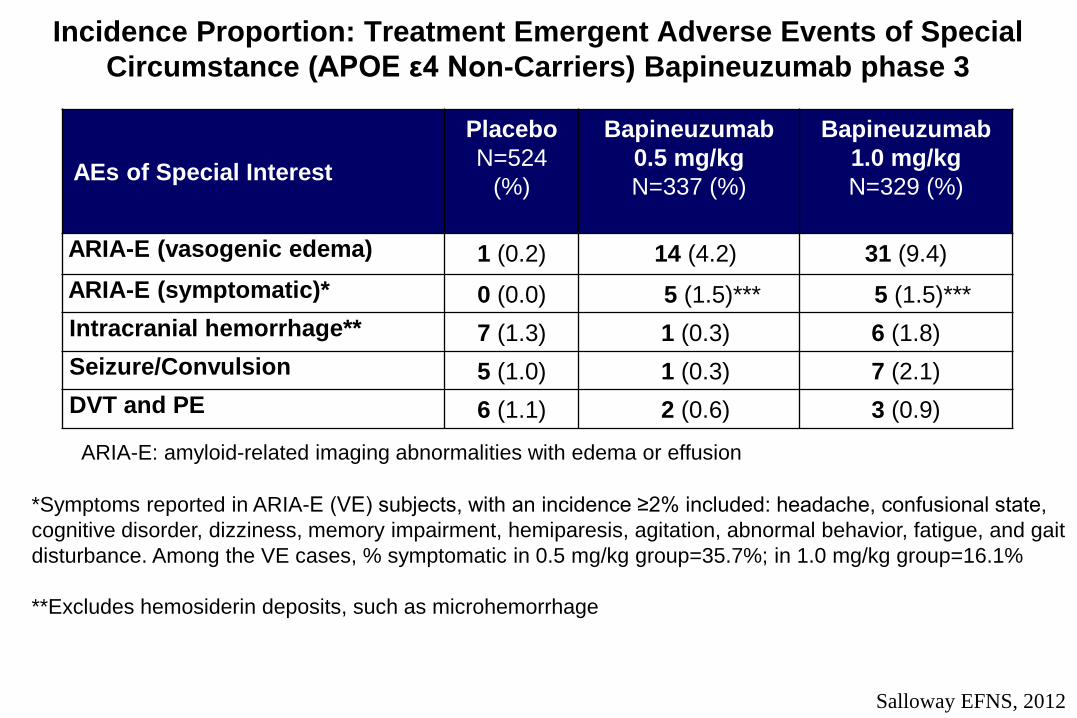
Incidence Proportion: Treatment Emergent Adverse Events of Special Circumstance (APOE ε4 Non-Carriers) Bapineuzumab phase 3
AEs of Special Interest
Placebo N=524
(%)
Bapineuzumab 0.5 mg/kg N=337 (%)
Bapineuzumab 1.0 mg/kg N=329 (%)
ARIA-E (vasogenic edema) 1 (0.2) 14 (4.2) 31 (9.4) ARIA-E (symptomatic)* 0 (0.0) 5 (1.5)*** 5 (1.5)*** Intracranial hemorrhage** 7 (1.3) 1 (0.3) 6 (1.8) Seizure/Convulsion 5 (1.0) 1 (0.3) 7 (2.1) DVT and PE 6 (1.1) 2 (0.6) 3 (0.9)
*Symptoms reported in ARIA-E (VE) subjects, with an incidence ≥2% included: headache, confusional state, cognitive disorder, dizziness, memory impairment, hemiparesis, agitation, abnormal behavior, fatigue, and gait disturbance. Among the VE cases, % symptomatic in 0.5 mg/kg group=35.7%; in 1.0 mg/kg group=16.1% **Excludes hemosiderin deposits, such as microhemorrhage
ARIA-E: amyloid-related imaging abnormalities with edema or effusion
Salloway EFNS, 2012
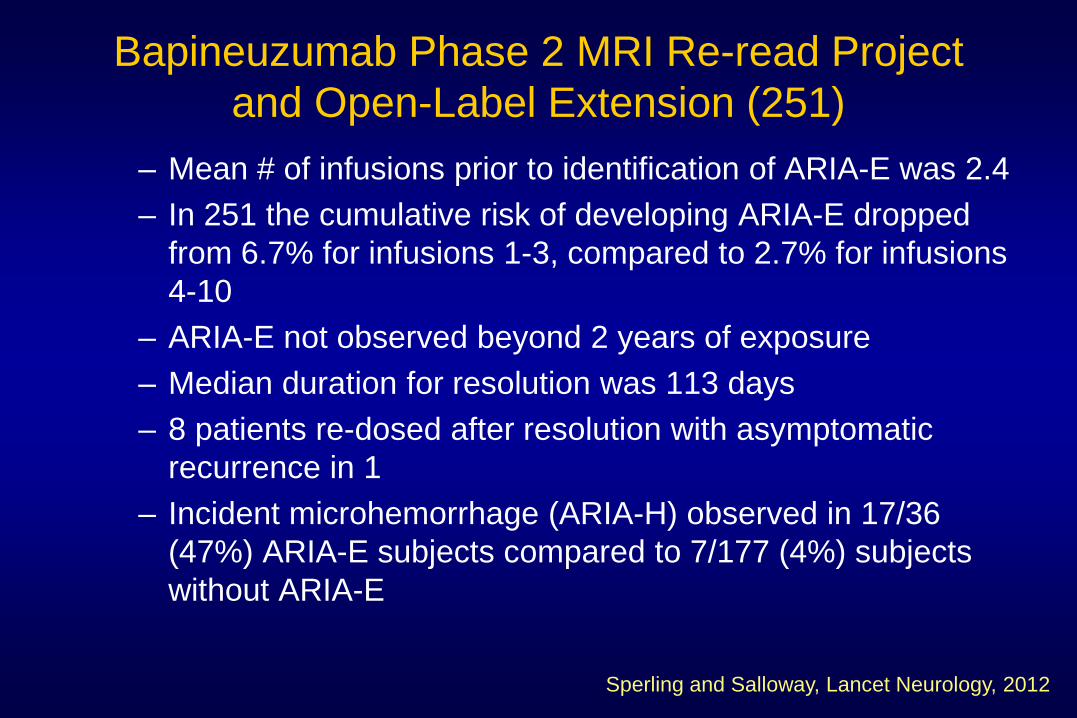
Bapineuzumab Phase 2 MRI Re-read Project and Open-Label Extension (251)
– Mean # of infusions prior to identification of ARIA-E was 2.4 – In 251 the cumulative risk of developing ARIA-E dropped
from 6.7% for infusions 1-3, compared to 2.7% for infusions 4-10
– ARIA-E not observed beyond 2 years of exposure – Median duration for resolution was 113 days – 8 patients re-dosed after resolution with asymptomatic
recurrence in 1 – Incident microhemorrhage (ARIA-H) observed in 17/36
(47%) ARIA-E subjects compared to 7/177 (4%) subjects without ARIA-E
Sperling and Salloway, Lancet Neurology, 2012
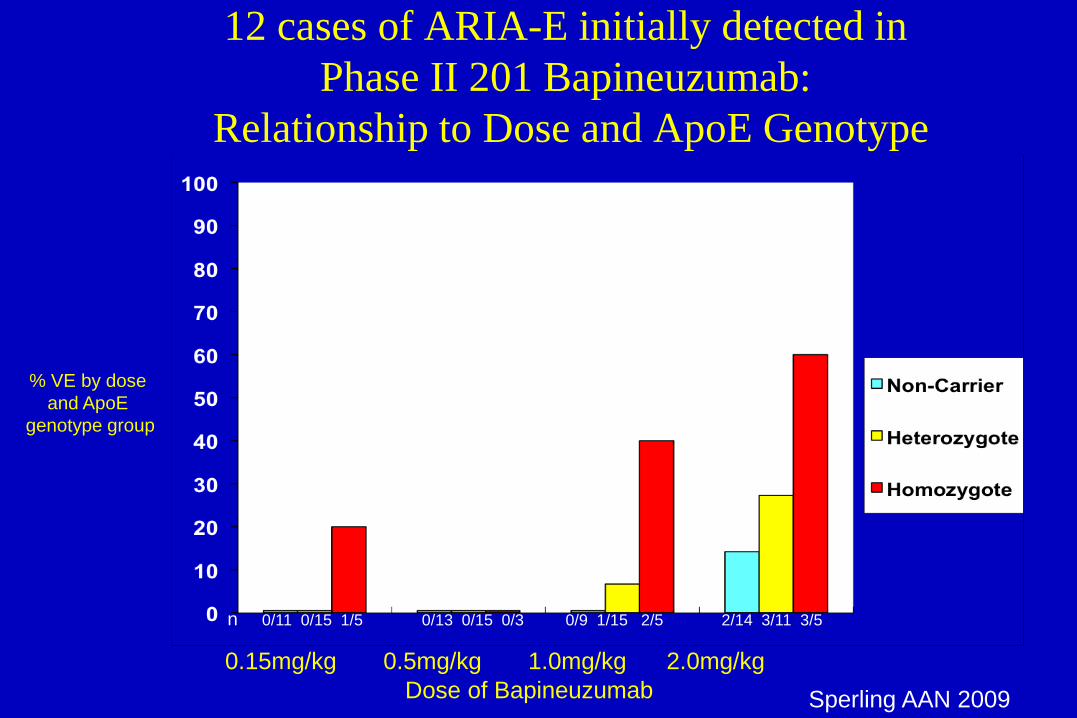
12 cases of ARIA-E initially detected in Phase II 201 Bapineuzumab:
Relationship to Dose and ApoE Genotype
% VE by dose and ApoE
genotype group
0/13 0/15 0/3 0/9 1/15 2/5 2/14 3/11 3/5 0/11 0/15 1/5
0.15mg/kg 0.5mg/kg 1.0mg/kg 2.0mg/kg Dose of Bapineuzumab
n
Sperling AAN 2009
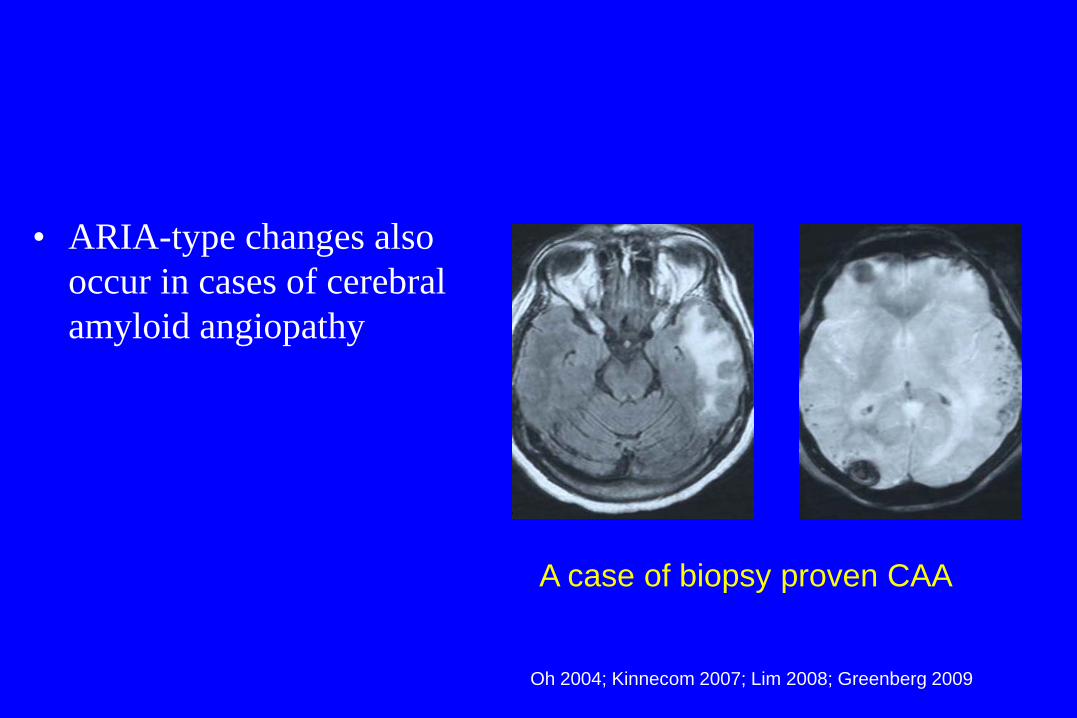
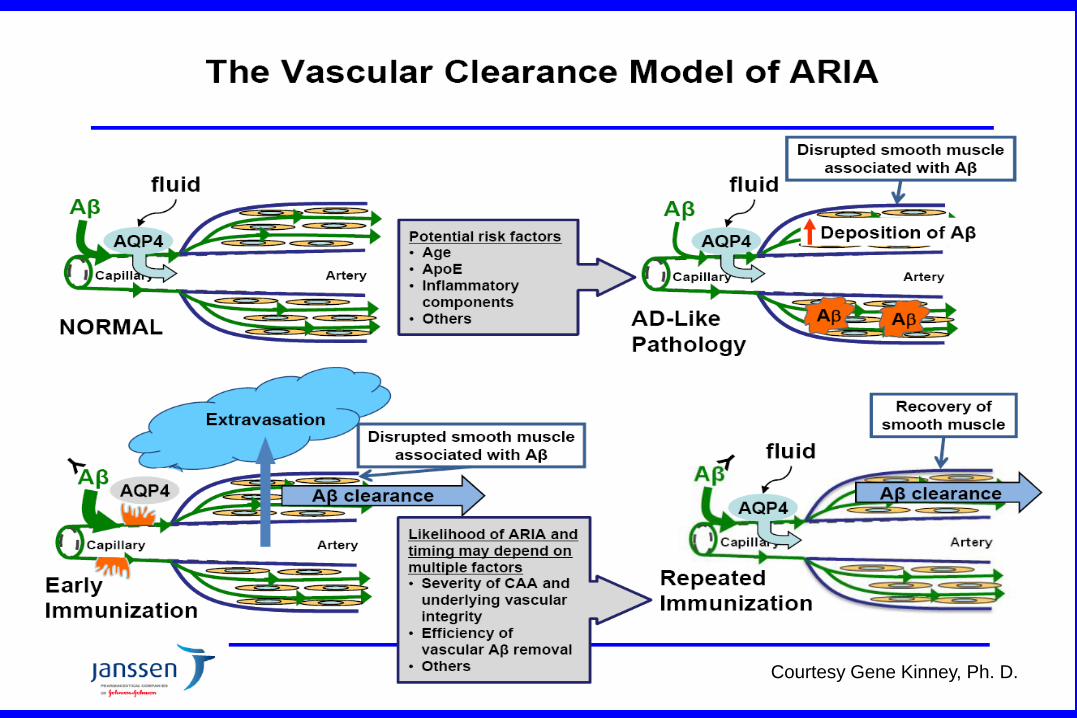
• ARIA-type changes also occur in cases of cerebral amyloid angiopathy
A case of biopsy proven CAA
Oh 2004; Kinnecom 2007; Lim 2008; Greenberg 2009
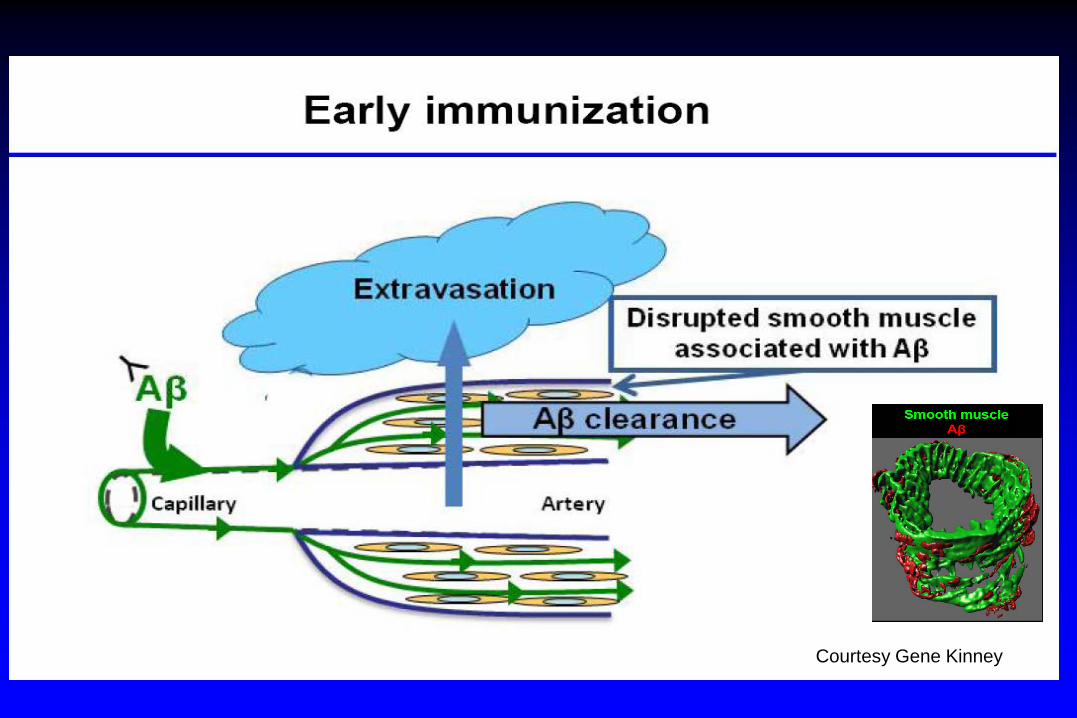
Courtesy Gene Kinney
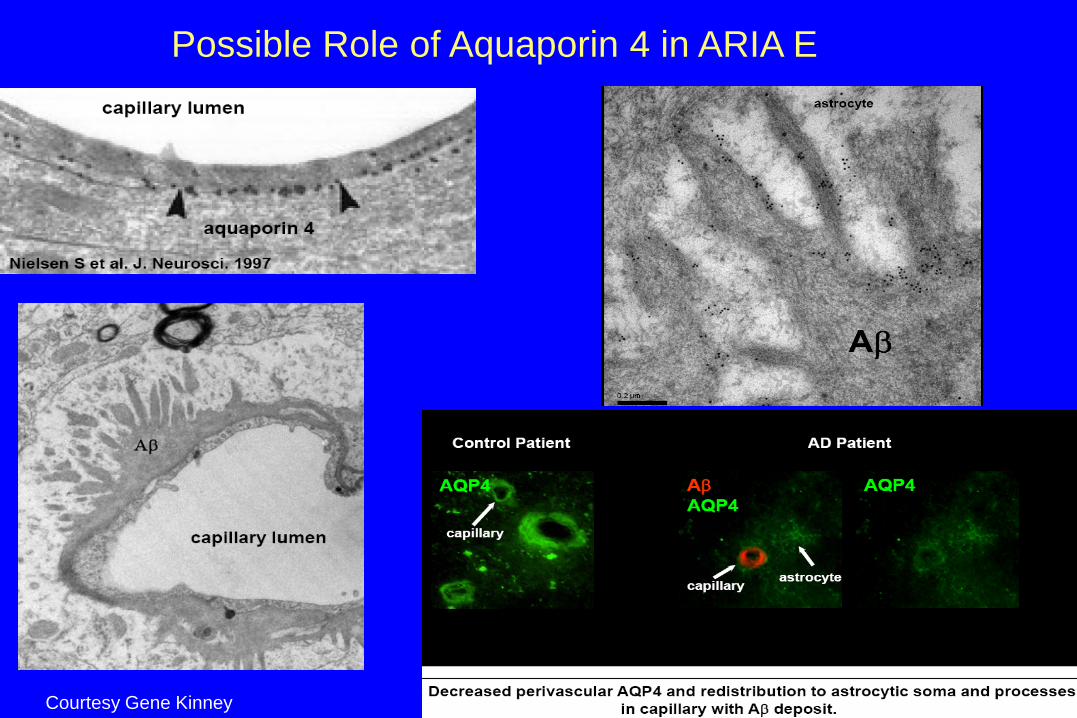
Possible Role of Aquaporin 4 in ARIA E
Courtesy Gene Kinney
Courtesy Gene Kinney, Ph. D.
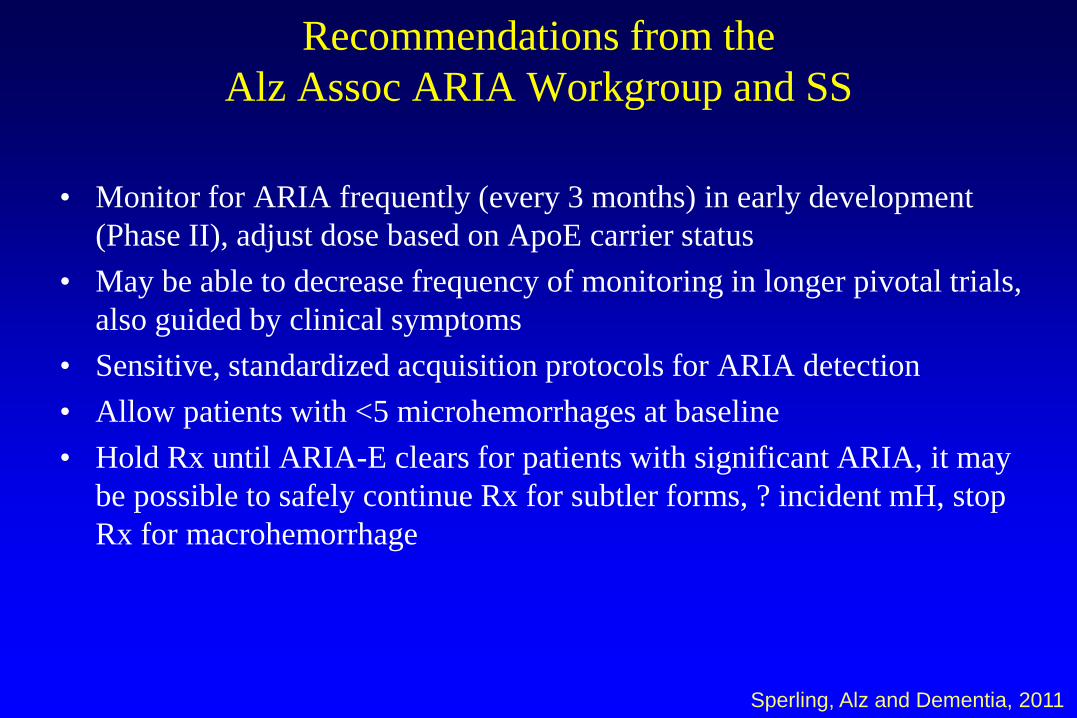
Recommendations from the Alz Assoc ARIA Workgroup and SS
• Monitor for ARIA frequently (every 3 months) in early development (Phase II), adjust dose based on ApoE carrier status
• May be able to decrease frequency of monitoring in longer pivotal trials, also guided by clinical symptoms
• Sensitive, standardized acquisition protocols for ARIA detection • Allow patients with <5 microhemorrhages at baseline • Hold Rx until ARIA-E clears for patients with significant ARIA, it may
be possible to safely continue Rx for subtler forms, ? incident mH, stop Rx for macrohemorrhage
Sperling, Alz and Dementia, 2011
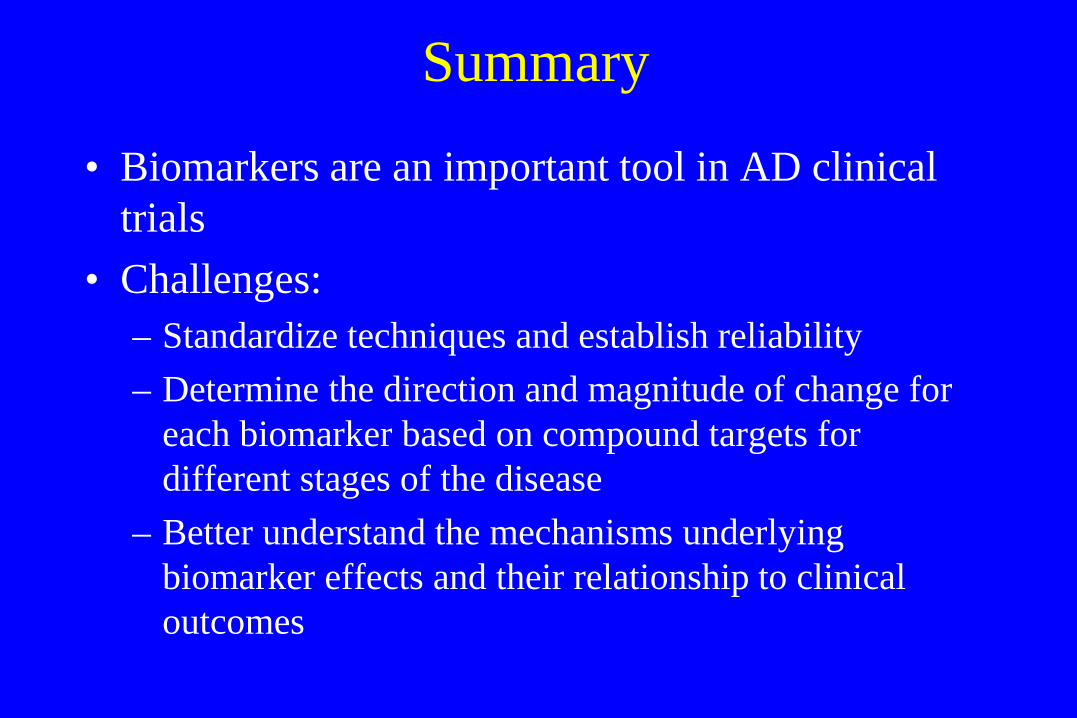
Summary
• Biomarkers are an important tool in AD clinical trials
• Challenges: – Standardize techniques and establish reliability – Determine the direction and magnitude of change for
each biomarker based on compound targets for different stages of the disease
– Better understand the mechanisms underlying biomarker effects and their relationship to clinical outcomes

The Butler Hospital Memory and Aging Program