step trend analysis of status monitoring, confined and ... trend analysis of status monitoring,...
TRANSCRIPT
Step Trend Analysis ofStatus Monitoring, Confined
and Unconfined Aquifers
Rick CopelandWatershed Monitoring Section
“ROC Fest” May 2017

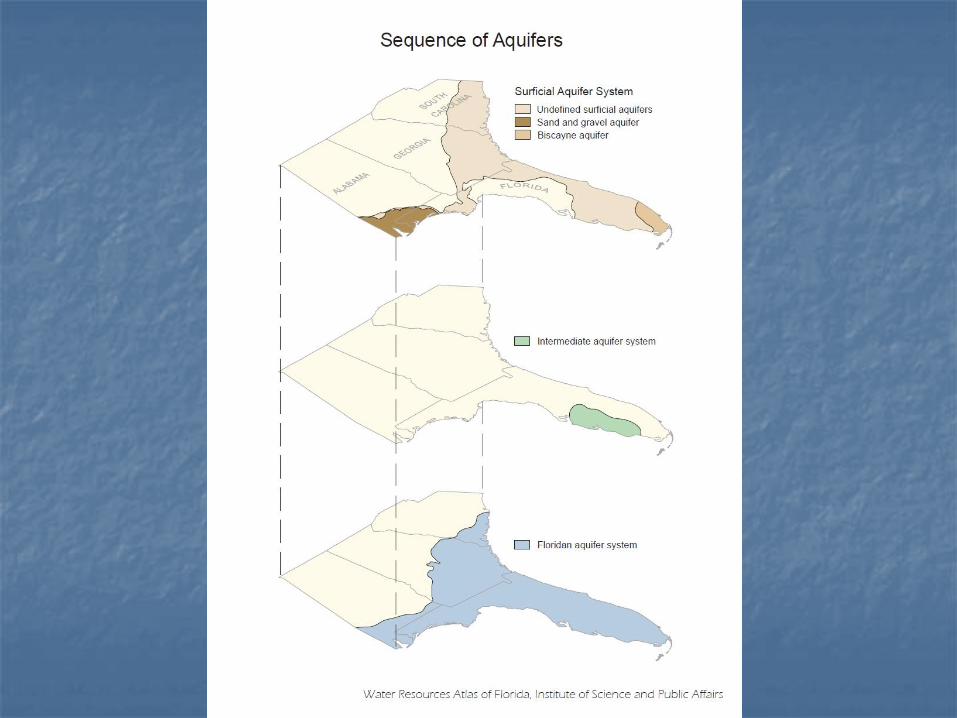
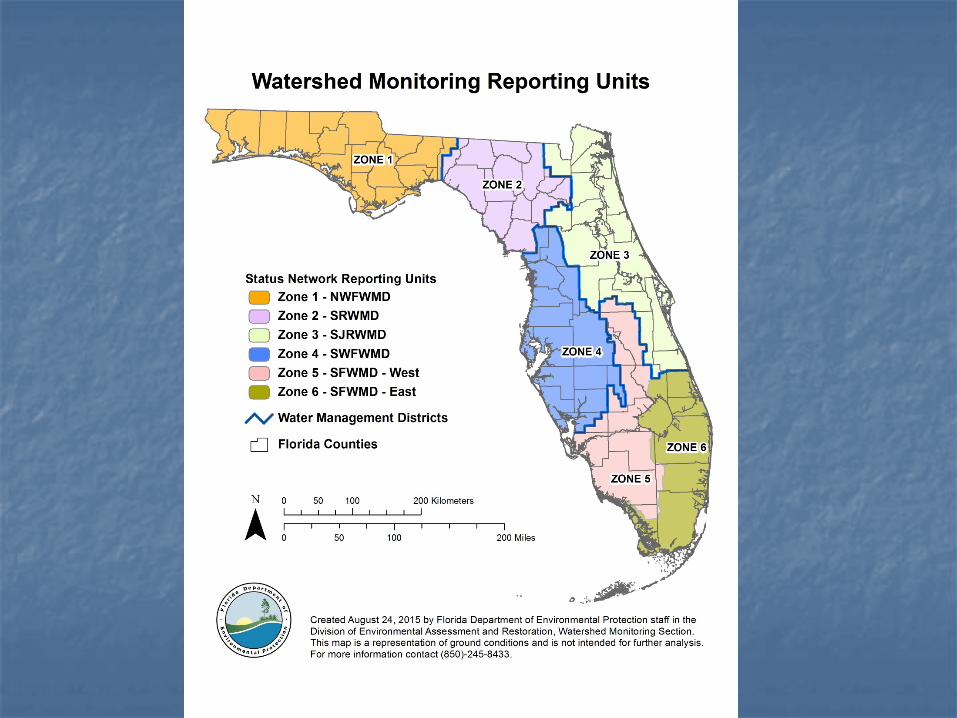
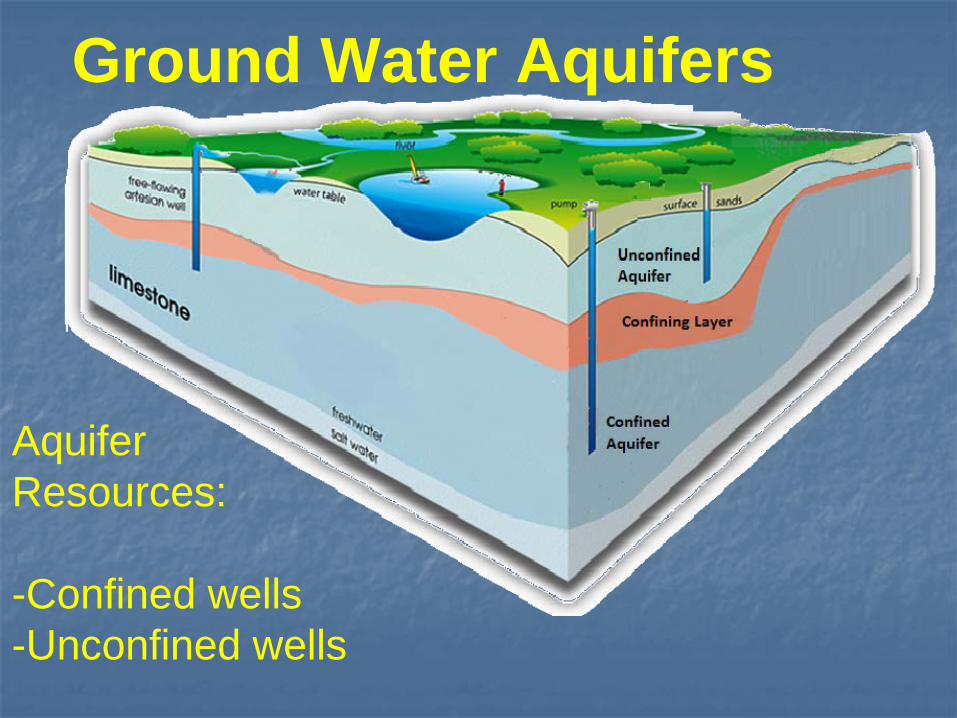
Ground Water
AquiferResources:
-Confined wells-Unconfined wells

1980s through 2015

1980s through 2015

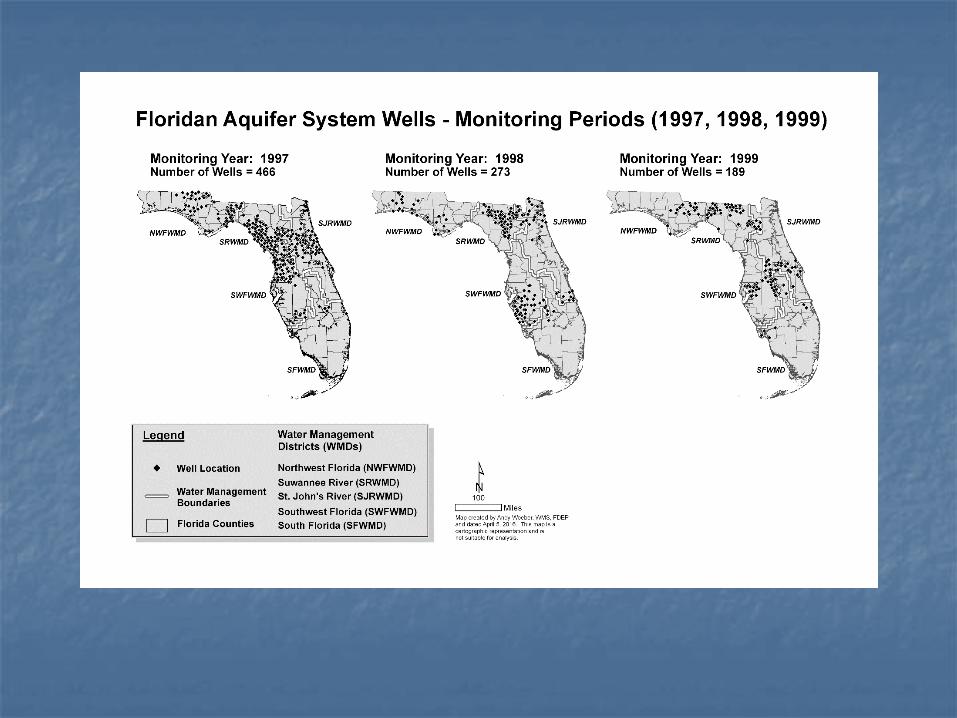
Brief History 1984-1999 Status Monitoring Network was the
Ambient GW Quality Monitoring Network 1991-1999 AGWQMN
Sampled all of FL in three-year cycles “Rotating Basins”
“96-99” Developed Status Network (GW & SW)
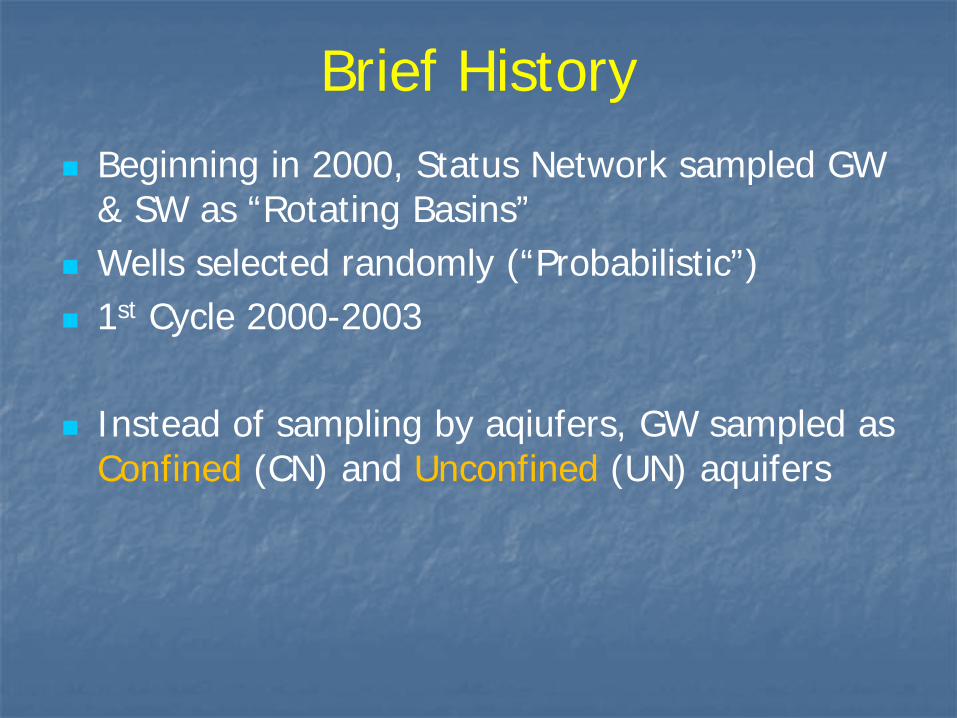
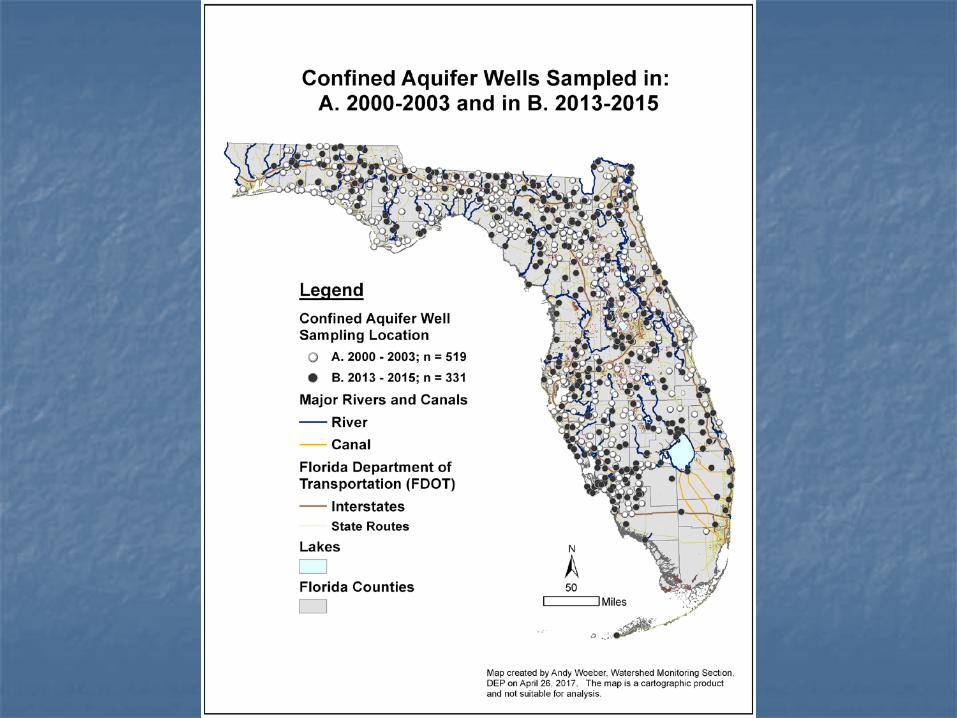
Brief History Beginning in 2000, Status Network sampled GW
& SW as “Rotating Basins” Wells selected randomly (“Probabilistic”) 1st Cycle 2000-2003
Instead of sampling by aqiufers, GW sampled as Confined (CN) and Unconfined (UN) aquifers

Ground Water Sampling
AquiferResources:
-Confined wells-Unconfined wells

Brief History
Design Modifications in 2004 & 2009 Beginning in 2009, FL sampled annually Maintained this design since 2009

Brief History By 2016, SN has been in operation since 2000
Has GW quality changed? If so, what parameters and at what scale?
It was decided to compare: 1st SN cycle (2000-2003) to last three (2013-2015) Begin with statewide scale
Use the STEP TREND for statistical evaluations Can be used at a variety of time and areal scales Can be used for SW as well as GW
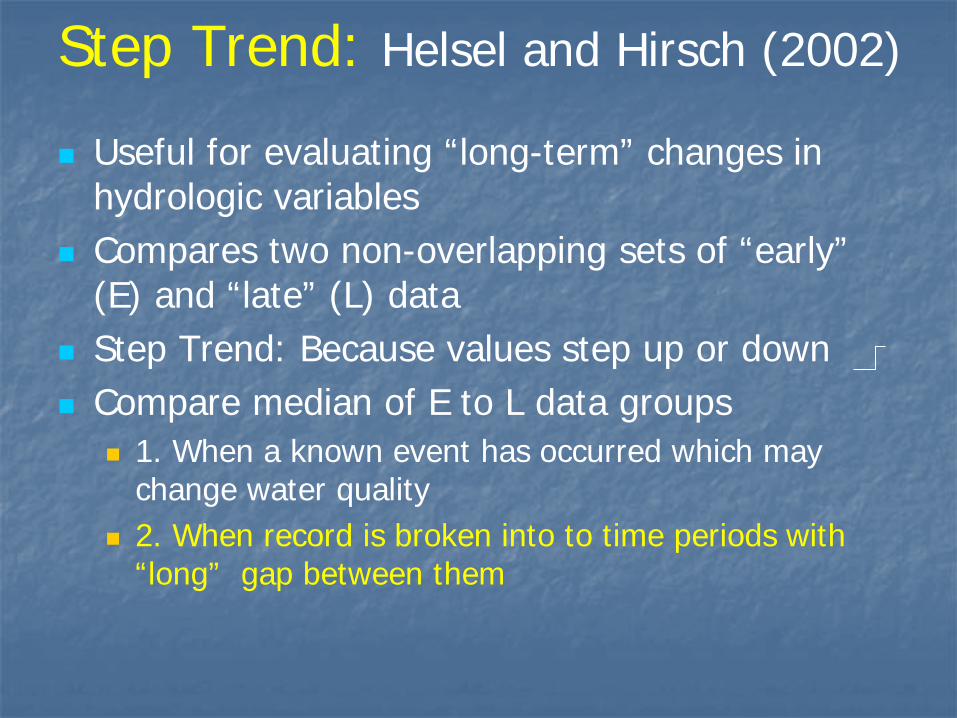
Step Trend: Helsel and Hirsch (2002)
Useful for evaluating “long-term” changes in hydrologic variables
Compares two non-overlapping sets of “early” (E) and “late” (L) data
Step Trend: Because values step up or down Compare median of E to L data groups
1. When a known event has occurred which may change water quality
2. When record is broken into to time periods with “long” gap between them

Step Trend 1. Divide time interval into 3 periods
2. Determine coverage in each period (number of data points within each: E, M, L)
3. If any third has < 20% of total coverage, do not use corresponding period Note we are concerned with the E and L periods only

Step Trend
Helsel and Hirsch (2002)


Step Trend Number of samples for E: 598 – 41 = 557 Number of samples for L: 340 – 41 = 299
Both E and L have > 20% of total: can use

Two Types of Step Trends Used 1. If wells are sampled either in E or L period,
but not in both: Mann-Whitney (MW) test 2. If some of wells are sampled in both periods:
Wilcoxon Sign-Rank (WSR) test (E.G. 41 wells)
Null Hypothesis: Med(E) = Med(L) Confidence Level pre-set = 0.90 or 90% If 10% to 100% sure of equal medians, do not reject If < 10% sure they are equal, reject If 5 to < 10% sure they are equal, “early warning”
Fraction (or %) is called the p-val of the test


MW Results (Selected Params)(UN: n(E)= 557, n(L) = 299](CN: n(E)= 519, n(L) = 282]
Parameter UnconfinedP-val
Unconfined Direction
ConfinedP-val
Confined Direction
Ca 0.046 Up <0.001 Up
Mg <0.001 Up
Na 0.044 Up <0.001 Up
K 0.001 Up <0.001 Up
Alk 0.003 Up
Cl 0.063 (EW) Up <0.001 Up
SO4 <0.001 Up
GW Level 0.004 Up 0.002 Up


WSR Results (Selected Params)(results in table, only if significant change)
[n(Un)= 41; n(CN) = 49]
Parameter UnconfinedP-val
Unconfined Direction
ConfinedP-val
Confined Direction
Ca
Mg 0.009 Up
Na 0.040 Up 0.001 Up
K 0.051 (EW) Up 0.017 Up
Alk
Cl 0.009 Up 0.011 Up
SO4
GW Level 0.005 Up 0.009 Up

Step Trend Concern
Have reasonable idea of data behavior during E and L periods
Do not have knowledge of behavior of data during M period
Examples: Na and Cl MW Tests

Sodium ConcentrationsUnconfined Aquifers
2013-20152000-2003
70
60
50
40
30
20
10
0
mg/
L
Unconfined Aquifers Sodium Concentrations in Florida(Outliers Removed)
Median (2000-2003) = 7.1Median (2013-2015) = 9.9

Chloride ConcentrationsUnconfined Aquifers
2013-20152000-2003
100
80
60
40
20
0
mg/
L
Unconfined Aquifers Chloride Concentrations in Florida(Outliers Removed)
Median (2000-2003) = 11.0Median (2013-2015) = 14.0
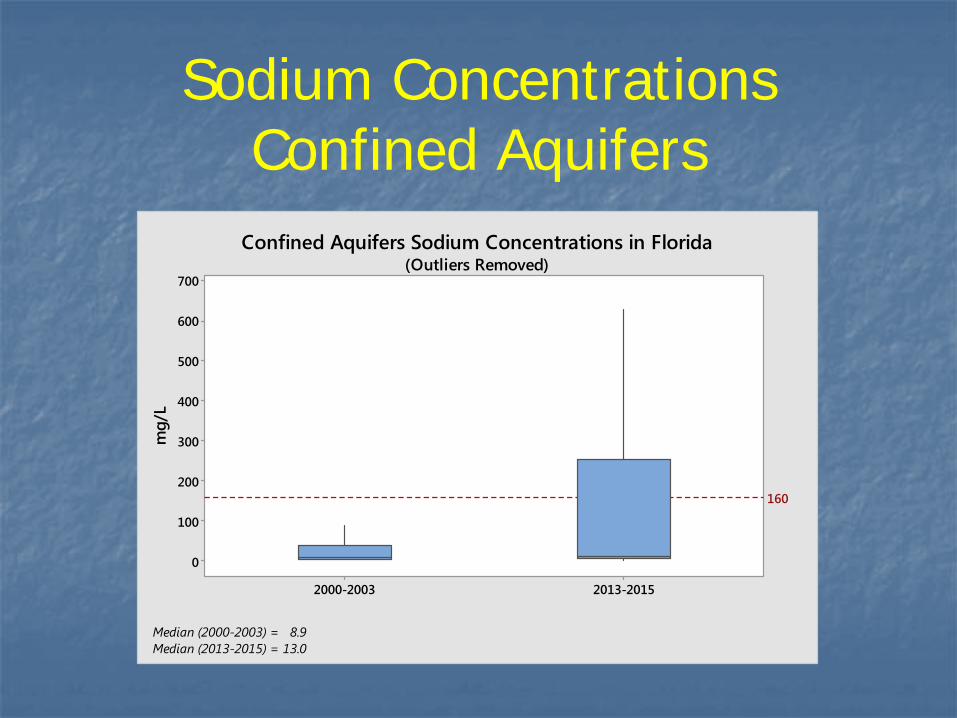
Sodium ConcentrationsConfined Aquifers
2013-20152000-2003
700
600
500
400
300
200
100
0
mg/
L
160
Confined Aquifers Sodium Concentrations in Florida(Outliers Removed)
Median (2000-2003) = 8.9Median (2013-2015) = 13.0

Chloride ConcentrationsConfined Aquifers
2013-20152000-2003
1200
1000
800
600
400
200
0
mg/
L
250
Confined Aquifers Chloride Concentrations in Florida(Outliers Removed)
Median (2000-2003) = 11.0Median (2013-2015) = 18.0

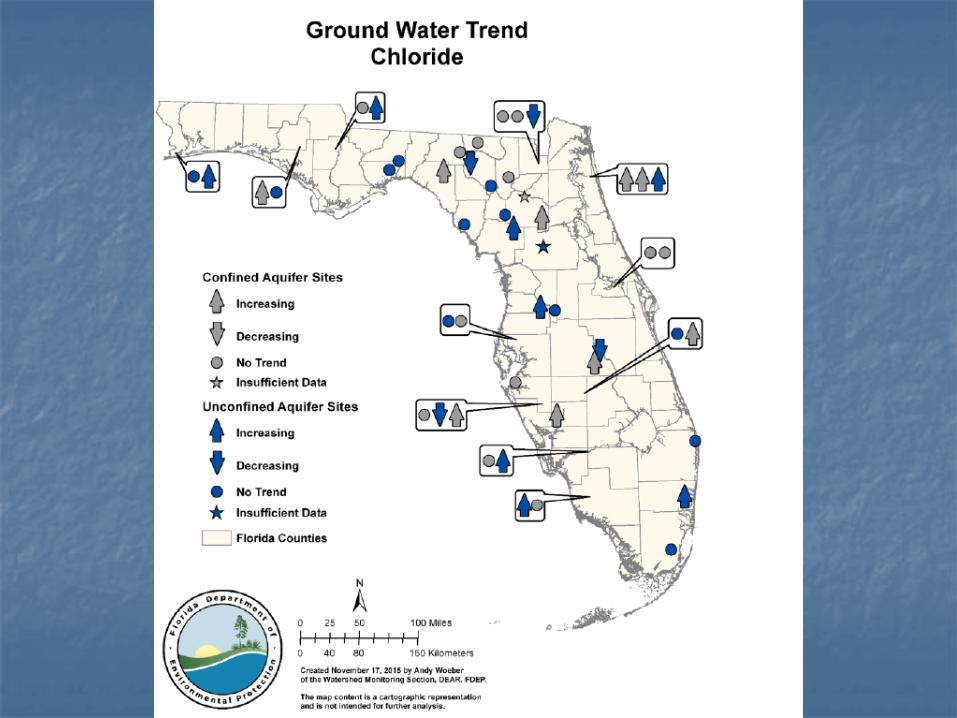
Trend Network can assist

GW Trend Network
From 2016 Integrated Water Quality Assessment Report [“305(b)”] for EPA
GW Trends for Chloride (2000-2014) at 46 Trend sites

6
5
4
3
20162012200820042000
9
8
7
6
5
20162012200820042000
9
8
7
6
9.5
9.0
8.5
8.0
7.5
Na (UN)
Year
Cl (UN)
Na (CN) Cl (CN)
(Annual Medians: 2000-2015)(Concentrations in mg/L)
Median Concentration of Na and Cl for all Trend Network Wells
Trend Network

Kendall Tests for Trends
Mann-Kendall (MK) test Basic test for trend
Seasonal-Kendall (SK) test Adjusts for seasonality effects
Regional-Kendall (RK) test Relatively new Agglomerates all sites in a region in order to evaluate
a regional trend
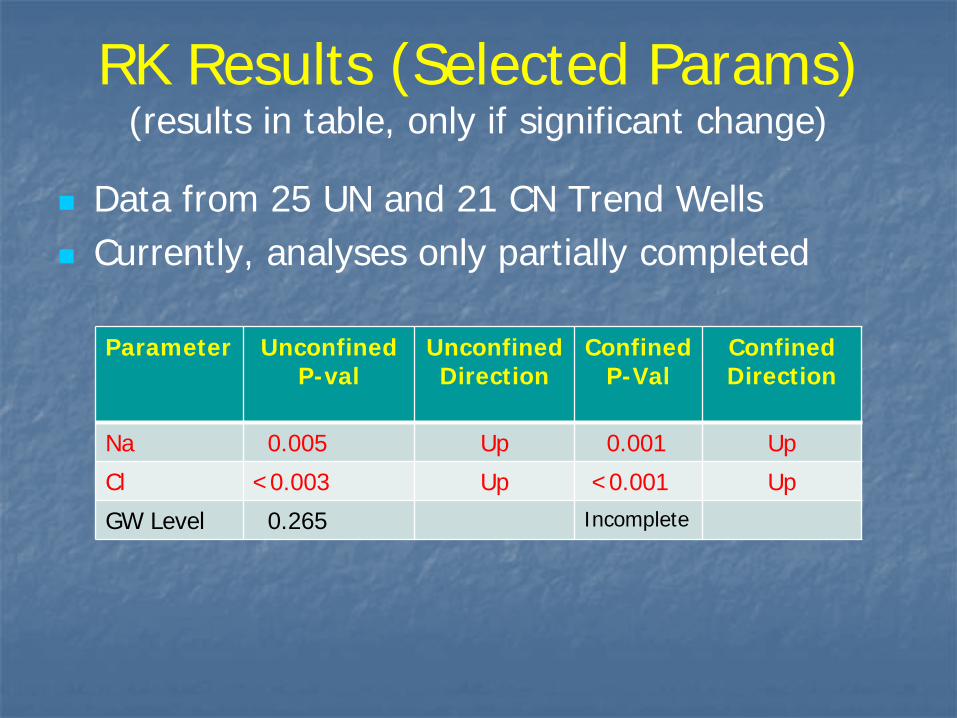
RK Results (Selected Params)(results in table, only if significant change)
Data from 25 UN and 21 CN Trend Wells Currently, analyses only partially completed
Parameter UnconfinedP-val
UnconfinedDirection
ConfinedP-Val
ConfinedDirection
Na 0.005 Up 0.001 Up
Cl <0.003 Up <0.001 Up
GW Level 0.265 Incomplete

Rates* of Change (Na and Cl)
*Rates (mg/L / decade)
“Typical” changes are in “several” mg/L / decade
Med Depth by Well Type
Trend Type UNNa
CNNa
UNCl
CNCl
MW (SN) 2.47 5.65 2.61 3.96
WSR (SN) 2.25 4.00 3.00 3.50
RKT (TrN) 0.34 0.63 0.50 0.30
Med Depth
TRN Wells UN
TRN Wells CN
UN Wells
CN Wells
ft 48 162 55 270

Plausible Reasons

Gyben-Herzberg Principle

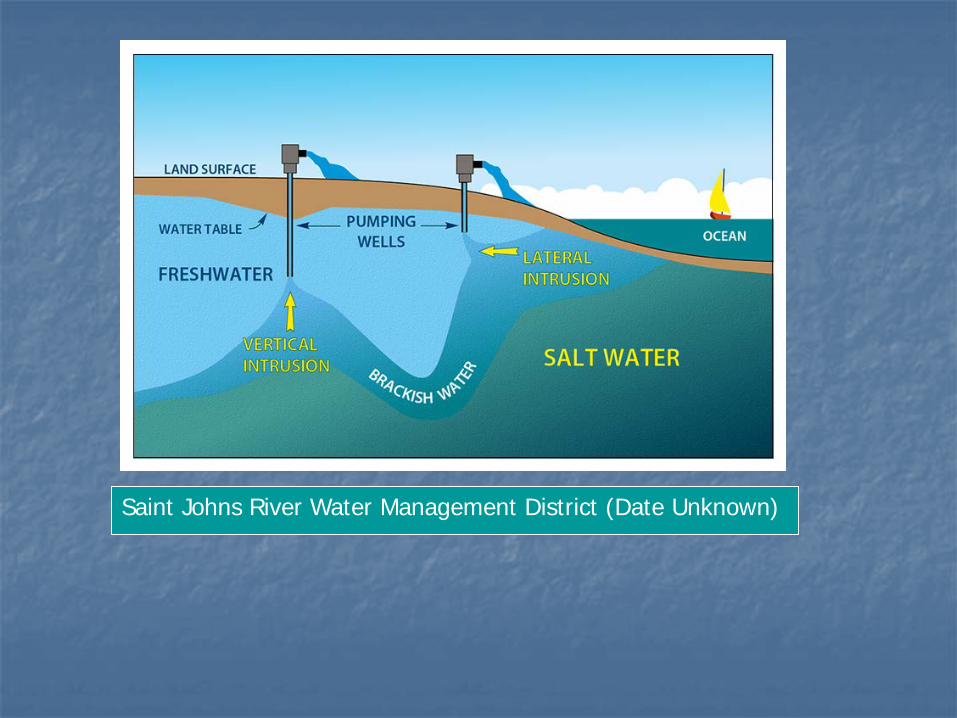
Saint Johns River Water Management District (Date Unknown)
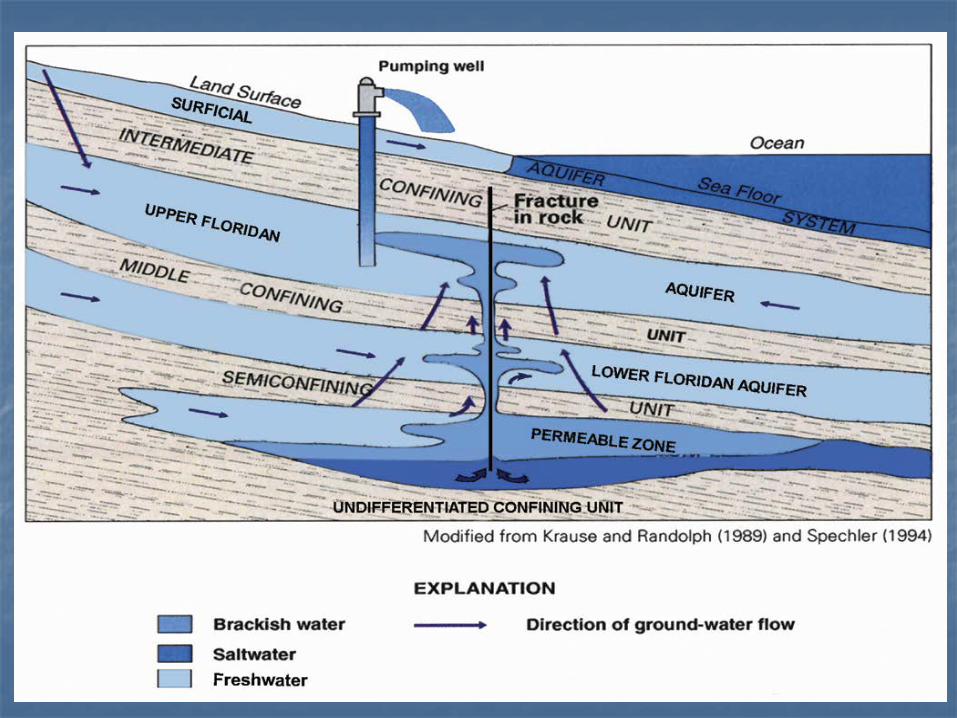

Conceptual Model
Think of Florida’s hydrostratigraphic units containing freshwater as a “lens” with the Floridan aquifer system as its base

Ground Water Aquifers
AquiferResources:
-Confined wells-Unconfined wells

Sodium ConcentrationsUnconfined Aquifers
2013-20152000-2003
70
60
50
40
30
20
10
0
mg/
L
Unconfined Aquifers Sodium Concentrations in Florida(Outliers Removed)
Median (2000-2003) = 7.1Median (2013-2015) = 9.9

Sodium ConcentrationsConfined Aquifers
2013-20152000-2003
700
600
500
400
300
200
100
0
mg/
L
160
Confined Aquifers Sodium Concentrations in Florida(Outliers Removed)
Median (2000-2003) = 8.9Median (2013-2015) = 13.0

2018201620142012201020082006200420022000
65
60
55
50
45
40
Year
FL R
ainf
all (
in)
54.06
Slope = 0.02 in/yr
Mean Florida Rainfall (2000-2015)
SOURCE
SERCC,2016201520102005200019951990
70
65
60
55
50
45
40
Year
FL R
ainf
all (
in)
2000
54.06
p-val = 0.949; Slope = 0.02 in/yr
Scatterplot of FL Rainfall (in) vs Year

Florida’s Water Quality GW Quality is significantly changing, but very
slowly over large portions of Florida E.G. Saline and Rock-Matrix (E.G. Ca, Mg, Alk, SO4)
parameters
Later, Jay Silvanima will discuss evidence of that Emerging Contaminants are finding their way into both SW and GW over significant portions of Florida
Questions? (850) 245-8503 [email protected]