stem human resources: increasing capacity for ... · increasing capacity for competitiveness and...
TRANSCRIPT

STEM Human Resources: Increasing capacity
for competitiveness and growth
William G. Padolina Skills Policy Dialogue
British Council 26 October 2015

https://psa.gov.ph/content/2012-census-philippine-business-and-industry-economy-wide-all-establishments-final-results

National Science and Technology Plan 2002-2020
Courtesy of Usec. F.T. de la Pena

Indicators 2000-2001 2004 2010 2020
6. No. of R&D Personnel Per Million Population
7. No.of World-class S&T
Universities
8. Value Added in Leading High Technology Exports
9. Philippine Ranking in the Global Technology Index
10. Philippine Ranking in Knowledge Jobs
11. Philippine Ranking in the Transformation to a Digital Economy
157 200 250 350
3 9 15
30% 40% 50% 70%
31st 27th 20th 15th
3rd 3rd 2nd 1st
39th 34th 30th 20th
Courtesy of Usec. F.T. de la Pena

APEC Member Country Indicator World Rank based from the
Global Innovation Index (2014) GERD as % of GDP Researchers in R&D (per
million people)
United States (2010) 3 2.73827 3,838 6
Singapore (2010) 3 2.054 6,307 7 Hong Kong SAR, China (2010) 3 0.74927 2,925 10
Canada (2010)3 1.86008 4,579 12 Korea, Rep. (2010) 3 3.73781 5,451 16 Australia (2008)1 2.40778 4,280 17 New Zealand (2009) 1 1.28 3,724 18 Japan (2010) 3 3.25394 5,151 21 China (2010) 3 1.75899 890 29 Malaysia (2010) 3 1.0674 1,459 33 Chile (2010) 3 0.41722 317 46 Thailand (2009) 2 0.21 575 48
Russian Federation (2010) 3 1.1302 3,078 49
Mexico (2010) 3 0.45592 382 66 Vietnam (2002) 2 0.19 511 71 Peru (2004) 1 0.15 181 73 Indonesia (2009) 2 0.08 173 87
Brunei Darussalam (2004)2 0.04 686 88
Philippines (2007) 2 0.11 143 100
Sources: 1UNESCO Institute for Statistics (www.uis.unesco.org), 2DOST Compendium of S&T Statistics, 2012, 3The World Bank (www.worldbank.org), 4Global Innovation Index 2014 (www.globalinnovationindex.org)
Researchers in Headcounts (HC) Researchers in Full Time Equivalents (FTE) *Papua New Guinea and Chinese Taipei were not included in the list

1. No.of Publications by Filipino Scientists and Engineers included in the Science Citation Index
2. No. of Registered Scientists and Engineers (PRC Data)
3. No. of Filipino PhDs in Science and Engineering
4. No.of Internationally Accredited Laboratories
5. Technology Balance of Payments
6. Investments in High Technology Areas
OTHER S&T INDICATORS TO BE MONITORED
Courtesy of Usec. F.T. de la Pena
1. Supply-Driven S&T Undergraduate Scholarship Program
2. Excellence in S&T Education at the Higher Education Level to Stimulate ICT Industries
3. Science and Mathematics Competitions Nationwide at the Basic Educational Level
C. HUMAN RESOURCE DEVELOPMENT PROGRAMS
Courtesy of Usec. F.T. de la Pena

5. ICT-based transformation of governance broadening access to government services (i.e. health and education) for those in the countryside (PH in the top 50 global ranking of e-government by 2016). 6. Improved quality healthcare and quality of life thru science, technology and innovation. 7. Highly skilled and globally competitive S&T human resources in support of the national S&T programs (PSHS to be the leading science high school in ASEAN by 2015 and every town to have at least one DOST scholar by 2016). 8. Science-based weather information and climate change scenarios with associated impact assessments that enable concerned agencies to develop appropriate mitigation strategies for a disaster and climate change resilient Philippines.
PCIEERD, 2015
8 DOST OUTCOMES (CONTINUED)

16

Estimates on the number of HRST: 1990, 2000, & 2010
17
362
593
721
0
100
200
300
400
500
600
700
800
1990 2000 2010
Num
ber i
n Th
ousa
nds
SEI, 2015

Filipino Workers 15 Years Old and Over by S&T/Non-S&T Classification: 1990, 2000 & 2010
18 n = 21,083,973 n = 22,115,573 n = 31,360,957
(2.3%) (1.7%) (2.8%)
SEI, 2015

Distribution of HRST by Occupational Group: 1990, 2000, 2010
7
10
15
13
16
86
118
97
6
17
20
19
68
122
206
137
1
3
12
22
61
112
230
281
0 50 100 150 200 250 300
Mathematicians, statisticians & rel.professionals
Physicists, chemists & rel. professionals
Life science professionals
Architects & rel. professionals
Computer professionals
Health professionals (except nursing)
Engineers and rel. professionals
Nursing and midwifery professionals
Number in Thousands
2010
2000
1990
SEI,2015

Median Age of HRST: 1990, 2000, & 2010
21
32
33
34
31
31.5
32
32.5
33
33.5
34
34.5
1990 2000 2010
SEI, 2015

Distribution of HRST by Overseas Work Status: 1990, 2000, & 2010
n=720,970 n=593,380 n=362,163 24

Distribution of S&T OFWs by Occupational Group: 1990, 2000, & 2010
25
1.46
4.49
4.54
11
18
41
147
170
1.17
9.43
5.42
15
53
56
221
199
0.18
2.12
2.98
38
39
84
478
485
0 100 200 300 400 500 600
Mathematicians, statisticians and rel.professionals
Physicists, chemists and rel. professionals
Life science professionals
Architects and rel. professionals
Computer professionals
Health professionals (except nursing)
Engineers and rel. professionals
Nursing and midwifery professionals
Number in Hundreds
2010
2000
1990

• PROMOTING SCIENCE AND MATHEMATICS IN
PRIMARY, SECONDARY AND TERTIARY EDUCATION • ENHANCING CAREER STRUCTURES AND REWARDS
FOR SCIENTISTS AND ENGINEERS • ADEQUATE SUPPORT FOR HIGHER EDUCATION AND
VOCATIONAL TRAINING • ENCOURAGEMENT OF SCIENTIFIC
ENTREPRENEURSHIP • FOSTERING THE APPRECIATION OF SCIENCE
THROUGHOUT SOCIETY
Correcting our Talent Deficit in Science Technology, Engineering and Mathematics

The Philippine K-12 Basic Education Program
Official Gazette, 2014
Philippine Science High School, 2015
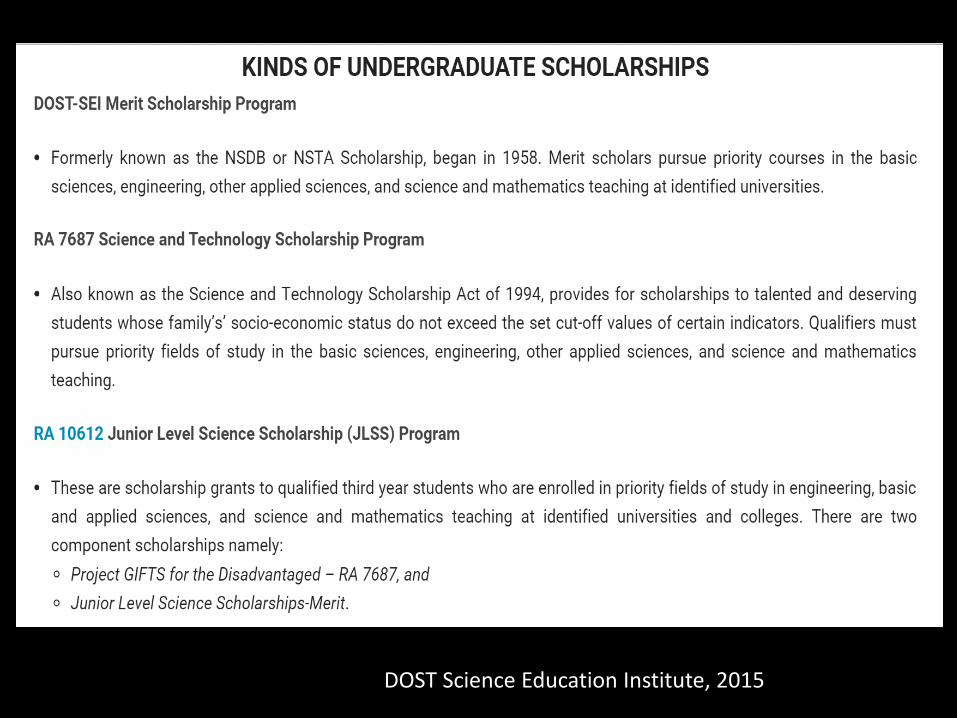
DOST Science Education Institute, 2015

DOST Science Education Institute

CHED: THE PCARI PROJECT
The PCARI Project is a new approach to enhance the skills and expertise of faculty, students and staff of Philippine universities and colleges through scholarships, training and research partnerships with top-notch research universities in California, USA, initially, with the University of California San Francisco (UCSF) and the University of California Berkeley (UCB) in the areas of health, innovation and translational medicine and in information infrastructure and development.

Republic of the Philippines Congress of the Philippines Metro Manila Tenth Congress Republic Act No. 8439 December 22, 1997 AN ACT PROVIDING A MAGNA CARTA FOR SCIENTISTS, ENGINEERS, RESEARCHERS AND OTHER SCIENCE AND TECHNOLOGY PERSONNEL IN GOVERNMENT

Higher Education Enrollment by Discipline Group and Academic Year (STEM): 2008/09 - 2012/13 as of July 12, 2013
Discipline Group 2008/09 2009/10 2010/11 2011/12 2012/13
Engineering and Technology 319,775 344,662 354,218 372,003 406,965
Information Technology 300,882 348,462 376,046 390,826 409,544
Mathematics 14,636 12,154 12,611 13,358 13,860
Medical and Allied 517,319 440,335 363,147 281,038 241,976
Architectural and Town Planning 18,004 20,441 23,103 26,601 31,296
Natural Science 22,641 24,127 25,425 27,304 30,071
Agricultural, Forestry, Fisheries, Vet Med. 63,315 59,692 63,679 68,133 81,348
Subtotal 1,256,572 1,249,873 1,218,229 1,179,263 1,215,060
Source: CHED, 2014

Higher Education Graduates by Discipline Group and Academic Year (STEM): 2008/09 - 2011/12 as of July 12, 2013
Discipline Group 2008/09 2009/10 2010/11 2011/12
Engineering and Technology 48,448 49,705 58,637 56,760
Information Technology 45,830 49,913 54,113 67,727
Mathematics 2,105 1,995 1,874 2,024
Medical and Allied 128,057 115,466 102,782 80,487
Architectural and Town Planning 2,286 2,217 2,263 2,278
Natural Science 4,194 3,912 3,927 4,285
Agricultural, Forestry, Fisheries, Vet Med. 9,842 10,107 9,650 11,575
Subtotal 240,762 233,315 233,246 225,136
Source: CHED, 2014

POST-BACCALAUREATE ENROLLMENT AND GRADUATES
Data compiled by IPD-OPPRI, 2013
Discipline
Masters Doctoral Enrollment Graduates Enrollment Graduates
(AY 2011-2012) (AY 2010-2011) (AY 2010-2011) (AY 2010-2011) Agriculture, Forestry, Fisheries 1,889 261 271 39 Engineering and Tech 2,615 317 272 16 IT-Related Disciplines 2,901 286 124 3 Mathematics 992 142 114 15 Medical and Allied 11,458 2,660 85 4
Natural Sciences 1,507 239 275 37 Other Disciplines 3,114 377 481 101
TOTAL 24,476 4,282 1,622 215

Enrollment of Non-School-Based Technical Vocational Education and Training Philippines
• 2009: 1,703,988 • 2010: 707,698 • 2011: 696,282 • 2012: 762,782 • 2013: 903,899
Philippine Statistics Authority, 2014

University of the Philippines, 2015

COLLABORATE
Recognize and enhance permeability of national
boundaries to knowledge and capital

Empower the STEM workforce and implement optimum organization of
work to foster high productivity and efficiency
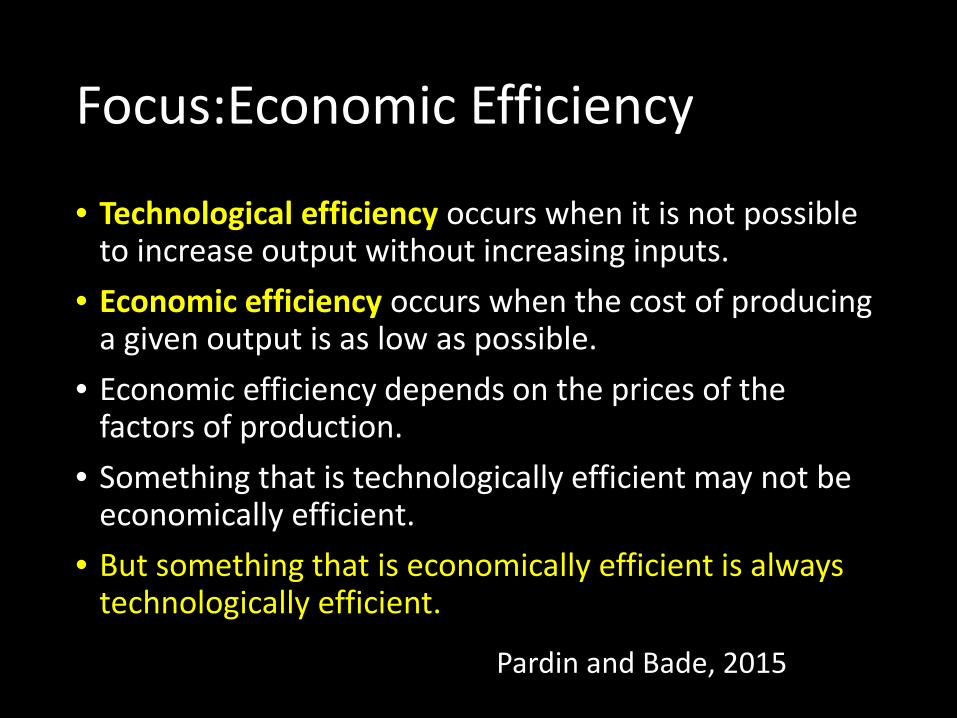
Focus:Economic Efficiency
• Technological efficiency occurs when it is not possible to increase output without increasing inputs.
• Economic efficiency occurs when the cost of producing a given output is as low as possible.
• Economic efficiency depends on the prices of the factors of production.
• Something that is technologically efficient may not be economically efficient.
• But something that is economically efficient is always technologically efficient. Pardin and Bade, 2015

HRST: a critical element of the National Quality Policy
Ensure that goods and services that are exported from or traded in a country are designed, manufactured and supplied in a manner that meet the needs of the market, as well as those of regulatory authorities.
UNIDO

The tasks ahead
• Identify opportunities in the global market • Empower the STEM workforce and implement
optimum organization of work to foster high productivity
• Correct the talent and skills deficit: produce,
employ and retain

Thank you