steering with expected loss
TRANSCRIPT
Steering with Expected LossMethodological Approaches to IFRS 9 Impairment
Wolfgang Reitgruber
FVP, Credit Risk Methods & Risk Integration, UniCredit Bank Austria AG
Risk Expert, Institute for Management Sciences, University of Technology, Vienna
Credit Risk Management Forum, organized by CFP
Vienna, May 7-8, 2015
The presented opinions and methods in this presentation are solely the responsibility of the authorand should not be interpreted as reflecting those of UniCredit Bank Austria AG
© Wolfgang Reitgruber 2015. All rights reserved.
Content
• Challenges in Credit Risk Steering
• Introduction of Impact of Risk©
• PL Dashboard, NPL Dashboard and
Process Calibration under IFRS 9
2
© Wolfgang Reitgruber 2015. All rights reserved.
General Trends in Credit Risk
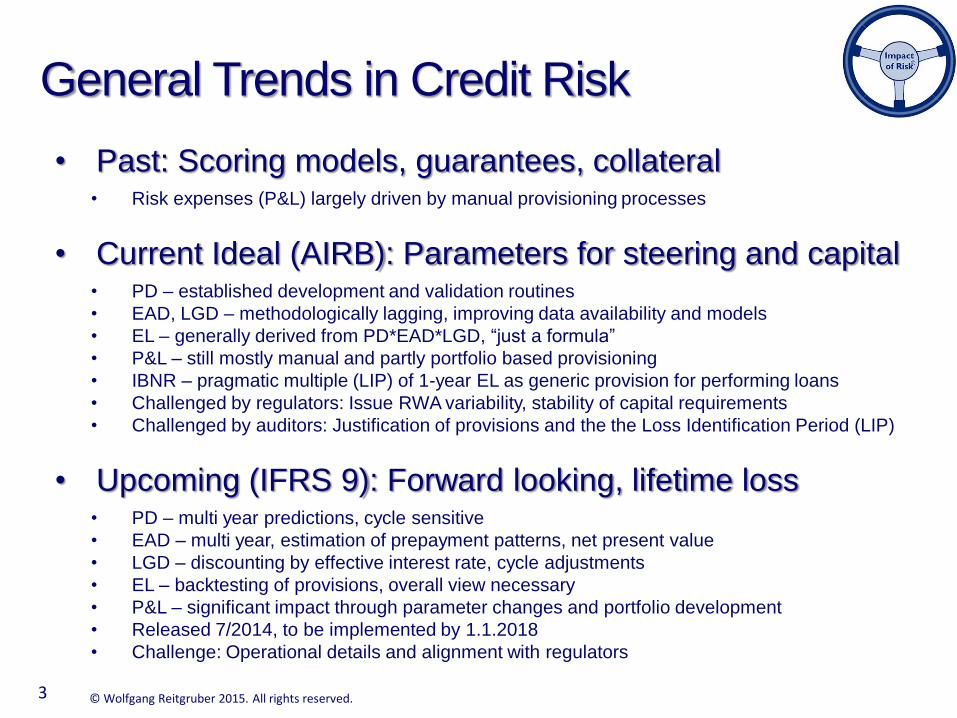
• Past: Scoring models, guarantees, collateral• Risk expenses (P&L) largely driven by manual provisioning processes
• Current Ideal (AIRB): Parameters for steering and capital• PD – established development and validation routines
• EAD, LGD – methodologically lagging, improving data availability and models
• EL – generally derived from PD*EAD*LGD, “just a formula”
• P&L – still mostly manual and partly portfolio based provisioning
• IBNR – pragmatic multiple (LIP) of 1-year EL as generic provision for performing loans
• Challenged by regulators: Issue RWA variability, stability of capital requirements
• Challenged by auditors: Justification of provisions and the the Loss Identification Period (LIP)
• Upcoming (IFRS 9): Forward looking, lifetime loss• PD – multi year predictions, cycle sensitive
• EAD – multi year, estimation of prepayment patterns, net present value
• LGD – discounting by effective interest rate, cycle adjustments
• EL – backtesting of provisions, overall view necessary
• P&L – significant impact through parameter changes and portfolio development
• Released 7/2014, to be implemented by 1.1.2018
• Challenge: Operational details and alignment with regulators
3
© Wolfgang Reitgruber 2015. All rights reserved.
Needed: KPIs Focusing on ECL/LCL
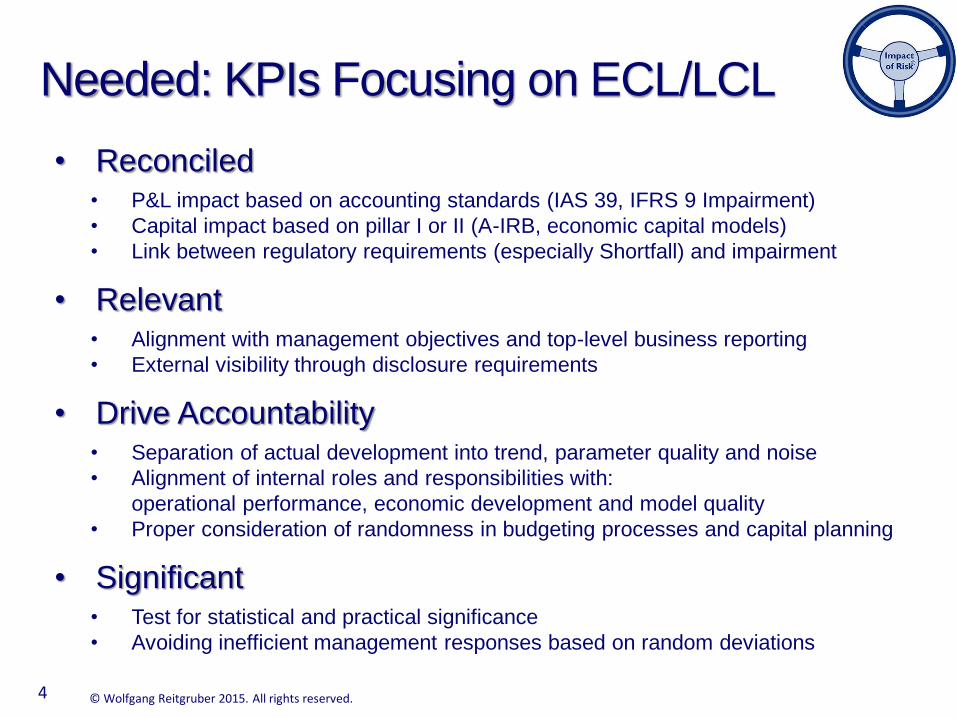
• Reconciled• P&L impact based on accounting standards (IAS 39, IFRS 9 Impairment)
• Capital impact based on pillar I or II (A-IRB, economic capital models)
• Link between regulatory requirements (especially Shortfall) and impairment
• Relevant• Alignment with management objectives and top-level business reporting
• External visibility through disclosure requirements
• Drive Accountability• Separation of actual development into trend, parameter quality and noise
• Alignment of internal roles and responsibilities with:
operational performance, economic development and model quality
• Proper consideration of randomness in budgeting processes and capital planning
• Significant• Test for statistical and practical significance
• Avoiding inefficient management responses based on random deviations
4
© Wolfgang Reitgruber 2015. All rights reserved.
Content
• Challenges in Credit Risk Steering
• Introduction of Impact of Risk©
• PL Dashboard, NPL Dashboard and
Process Calibration under IFRS 9
5

© Wolfgang Reitgruber 2015. All rights reserved.
Process CalibrationBucket 1 – 2 – 3
Credit Risk Steering Based on IoR©
6
PL
Dashboard
NPL
Dashboard
© Wolfgang Reitgruber 2015. All rights reserved.
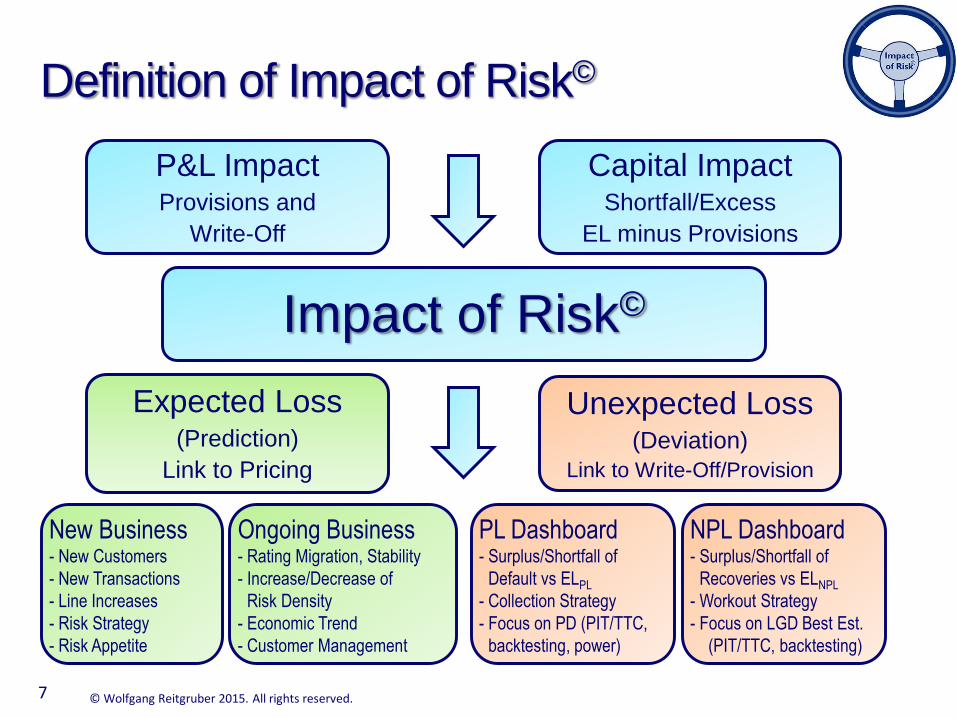
Definition of Impact of Risk©
7
New Business- New Customers
- New Transactions
- Line Increases
- Risk Strategy
- Risk Appetite
Impact of Risk©
P&L ImpactProvisions and
Write-Off
Capital ImpactShortfall/Excess
EL minus Provisions
Expected Loss(Prediction)
Link to Pricing
Unexpected Loss(Deviation)
Link to Write-Off/Provision
Ongoing Business- Rating Migration, Stability
- Increase/Decrease of
Risk Density
- Economic Trend
- Customer Management
PL Dashboard- Surplus/Shortfall of
Default vs ELPL
- Collection Strategy
- Focus on PD (PIT/TTC,
backtesting, power)
NPL Dashboard- Surplus/Shortfall of
Recoveries vs ELNPL
- Workout Strategy
- Focus on LGD Best Est.
(PIT/TTC, backtesting)
© Wolfgang Reitgruber 2015. All rights reserved.
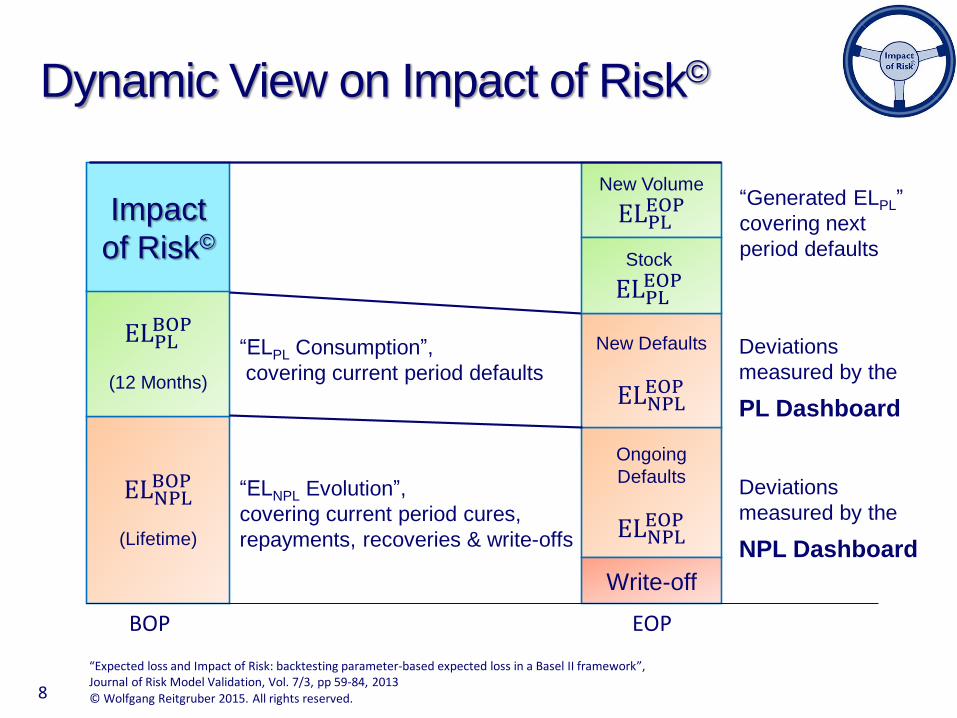
Dynamic View on Impact of Risk©
8
ELNPLBOP
(Lifetime)
Ongoing
Defaults
ELNPLEOP
New Volume
ELPLEOP
ELPLBOP
(12 Months)
New Defaults
ELNPLEOP
“Generated ELPL”
covering next
period defaults
“ELPL Consumption”,
covering current period defaults
“ELNPL Evolution”,
covering current period cures,
repayments, recoveries & write-offs
Write-off
Stock
ELPLEOP
Deviations
measured by the
PL Dashboard
Deviations
measured by the
NPL Dashboard
BOP EOP
Impact
of Risk©
“Expected loss and Impact of Risk: backtesting parameter-based expected loss in a Basel II framework”,Journal of Risk Model Validation, Vol. 7/3, pp 59-84, 2013
© Wolfgang Reitgruber 2015. All rights reserved.
Content
• Challenges in Credit Risk Steering
• Introduction of Impact of Risk©
• PL Dashboard, NPL Dashboard and
Process Calibration under IFRS 9
9
© Wolfgang Reitgruber 2015. All rights reserved.
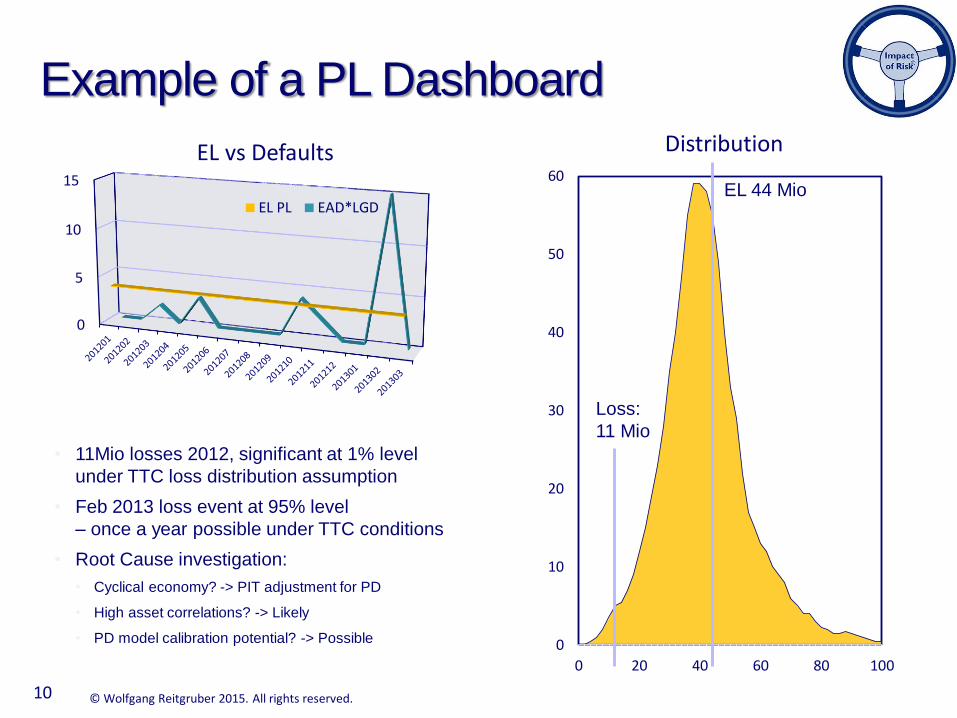
Example of a PL Dashboard
• 11Mio losses 2012, significant at 1% level
under TTC loss distribution assumption
• Feb 2013 loss event at 95% level
– once a year possible under TTC conditions
• Root Cause investigation:
• Cyclical economy? -> PIT adjustment for PD
• High asset correlations? -> Likely
• PD model calibration potential? -> Possible
10
0
5
10
15
EL vs Defaults
EL PL EAD*LGD
0
10
20
30
40
50
60
0 20 40 60 80 100
Distribution
EL 44 Mio
Loss:
11 Mio
© Wolfgang Reitgruber 2015. All rights reserved.11
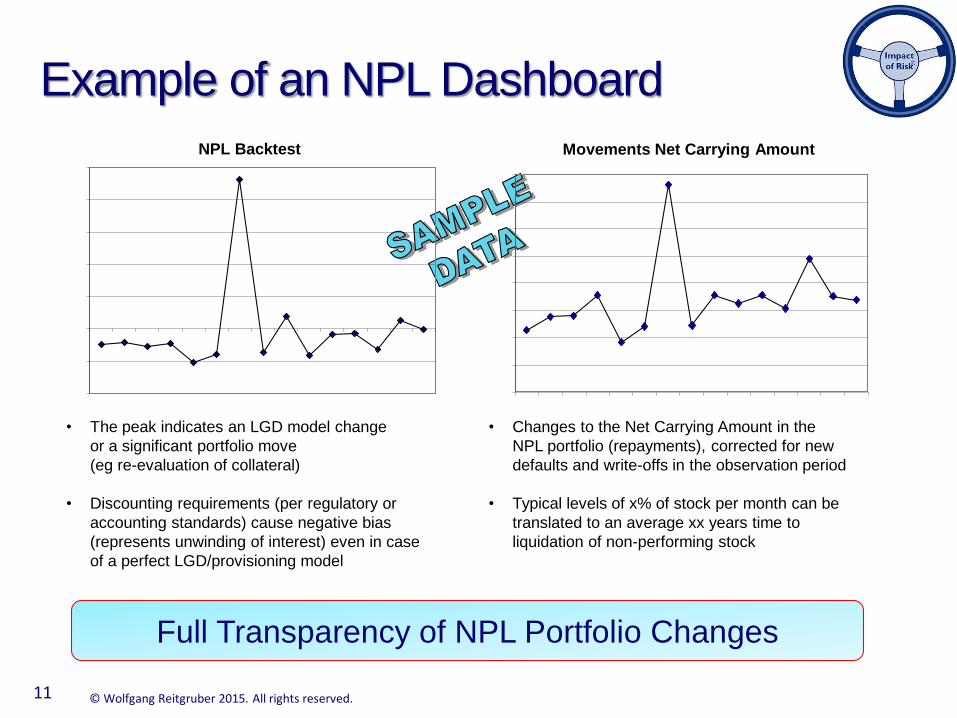
• The peak indicates an LGD model change
or a significant portfolio move
(eg re-evaluation of collateral)
• Discounting requirements (per regulatory or
accounting standards) cause negative bias
(represents unwinding of interest) even in case
of a perfect LGD/provisioning model
• Changes to the Net Carrying Amount in the
NPL portfolio (repayments), corrected for new
defaults and write-offs in the observation period
• Typical levels of x% of stock per month can be
translated to an average xx years time to
liquidation of non-performing stock
Full Transparency of NPL Portfolio Changes
NPL Backtest Movements Net Carrying Amount
Example of an NPL Dashboard
© Wolfgang Reitgruber 2015. All rights reserved.
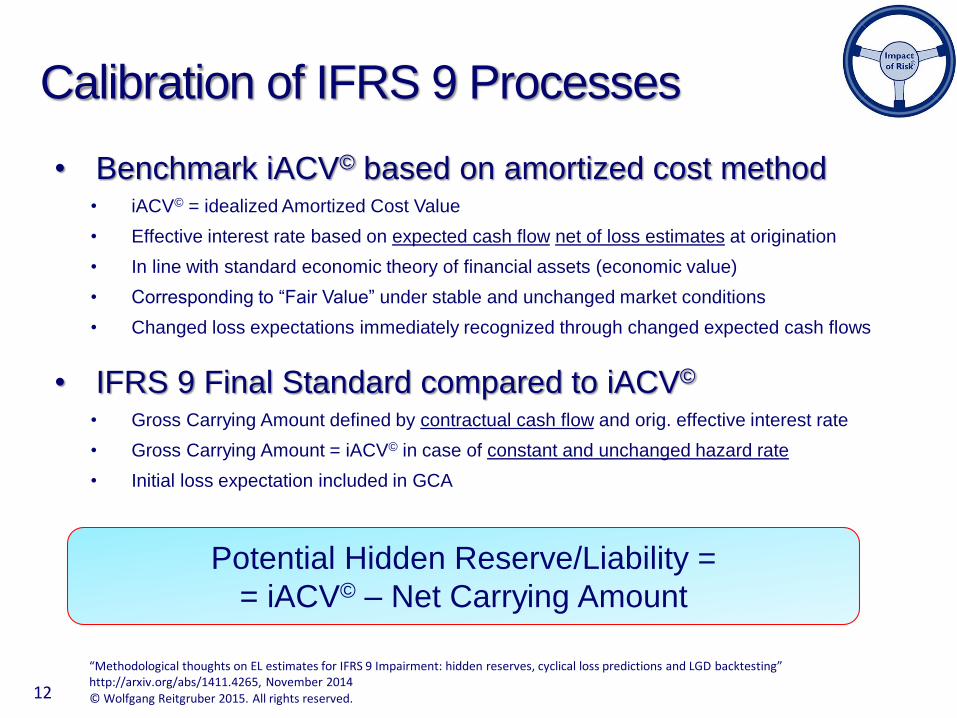
Calibration of IFRS 9 Processes
• Benchmark iACV© based on amortized cost method• iACV© = idealized Amortized Cost Value
• Effective interest rate based on expected cash flow net of loss estimates at origination
• In line with standard economic theory of financial assets (economic value)
• Corresponding to “Fair Value” under stable and unchanged market conditions
• Changed loss expectations immediately recognized through changed expected cash flows
• IFRS 9 Final Standard compared to iACV©
• Gross Carrying Amount defined by contractual cash flow and orig. effective interest rate
• Gross Carrying Amount = iACV© in case of constant and unchanged hazard rate
• Initial loss expectation included in GCA
12
“Methodological thoughts on EL estimates for IFRS 9 Impairment: hidden reserves, cyclical loss predictions and LGD backtesting”http://arxiv.org/abs/1411.4265, November 2014
Potential Hidden Reserve/Liability =
= iACV© – Net Carrying Amount
© Wolfgang Reitgruber 2015. All rights reserved.
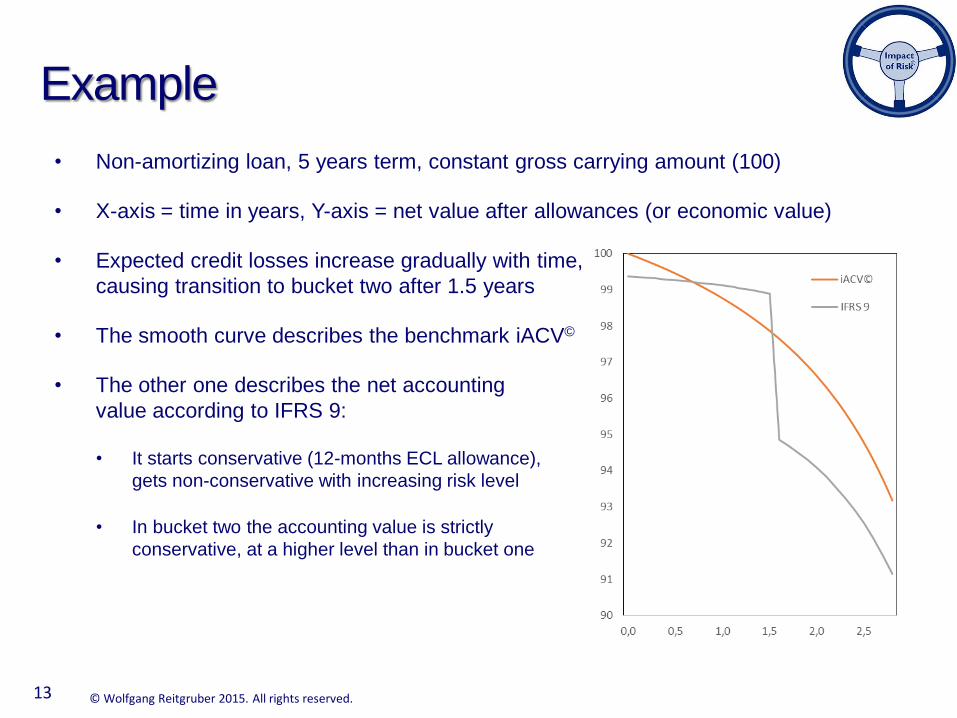
Example
13
• Non-amortizing loan, 5 years term, constant gross carrying amount (100)
• X-axis = time in years, Y-axis = net value after allowances (or economic value)
• Expected credit losses increase gradually with time,
causing transition to bucket two after 1.5 years
• The smooth curve describes the benchmark iACV©
• The other one describes the net accounting
value according to IFRS 9:
• It starts conservative (12-months ECL allowance),
gets non-conservative with increasing risk level
• In bucket two the accounting value is strictly
conservative, at a higher level than in bucket one
© Wolfgang Reitgruber 2015. All rights reserved.
Things you may want to consider:
• Regular credit risk monitoring through PL Dashboard and NPL Dashboard,
Structural analysis of monthly time series:
Understanding the past to improve cycle understanding and loss predictions
• Setup benchmarking framework for bucket 1 & 2 & default identification processes:
Get prepared for new regulations (EBA/CP/2014/32 “Materiality thresholds”)
• Improve LGD model to cover regulatory and accounting requirements:
Get prepared for BCBS “Reducing excessive variability … in RWA”
and EBA/CP/2014/36 on IRB methods (published November 2014)
• Quantify economic cycle impacts to verify forward looking requirement
• Direct estimation of workout LGDs for performing and non-performing loans
based on credit risk monitoring KPIs derived from the NPL Dashboard
• Finally: Develop a lifetime loss calibration test.
Auditors will ask for proper calibration of total provisions!
14

© Wolfgang Reitgruber 2015. All rights reserved.
Wolfgang ReitgruberFVP, Credit Risk Methods & Risk Integration, UniCredit Bank Austria AG
Risk Expert, Institute for Management Sciences, University of Technology, Vienna
Tel. +43 664 812 3393
Walkergasse 25, 1210 Vienna, Austria
http://www.linkedin.com/in/wolfgangreitgruber
Thank You For Your Interest !
Questions Welcome !
15
The presented opinions and methods in this presentation are solely the responsibility of the author and should not be interpreted as reflecting those of UniCredit Bank Austria AG. The concepts and terms “Impact of Risk”, “IoR”, “PL Dashboard” and “NPL Dashboard” are copyright by