steels for hydrogen service at elevated t emperatures and...
TRANSCRIPT

Steels for Hydrogen Service at Elevated Temperatures and Pressures in Petroleum Refineries and Petrochemical Plants
API RECOMMENDED PRACTICE 941
EIGHTH EDITION, FEBRUARY 2016

Special Notes
API publications necessarily address problems of a general nature. With respect to particular circumstances, local,
state, and federal laws and regulations should be reviewed.
Neither API nor any of API's employees, subcontractors, consultants, committees, or other assignees make any
warranty or representation, either express or implied, with respect to the accuracy, completeness, or usefulness of the
information contained herein, or assume any liability or responsibility for any use, or the results of such use, of any
information or process disclosed in this publication. Neither API nor any of API's employees, subcontractors,
consultants, or other assignees represent that use of this publication would not infringe upon privately owned rights.
API publications may be used by anyone desiring to do so. Every effort has been made by the Institute to assure the
accuracy and reliability of the data contained in them; however, the Institute makes no representation, warranty, or
guarantee in connection with this publication and hereby expressly disclaims any liability or responsibility for loss or
damage resulting from its use or for the violation of any authorities having jurisdiction with which this publication may
conflict.
API publications are published to facilitate the broad availability of proven, sound engineering and operating
practices. These publications are not intended to obviate the need for applying sound engineering judgment
regarding when and where these publications should be utilized. The formulation and publication of API publications
is not intended in any way to inhibit anyone from using any other practices.
Any manufacturer marking equipment or materials in conformance with the marking requirements of an API standard
is solely responsible for complying with all the applicable requirements of that standard. API does not represent,
warrant, or guarantee that such products do in fact conform to the applicable API standard.
Classified areas may vary depending on the location, conditions, equipment, and substances involved in any given
situation. Users of this Recommended Practice should consult with the appropriate authorities having jurisdiction.
Users of this Recommended Practice should not rely exclusively on the information contained in this document.
Sound business, scientific, engineering, and safety judgment should be used in employing the information contained
herein.
API is not undertaking to meet the duties of employers, manufacturers, or suppliers to warn and properly train and
equip their employees, and others exposed, concerning health and safety risks and precautions, nor undertaking their
obligations to comply with authorities having jurisdiction.
Information concerning safety and health risks and proper precautions with respect to particular materials and
conditions should be obtained from the employer, the manufacturer or supplier of that material, or the material safety
data sheet.
Where applicable, authorities having jurisdiction should be consulted.
Work sites and equipment operations may differ. Users are solely responsible for assessing their specific equipment
and premises in determining the appropriateness of applying the Recommended Practice. At all times users should
employ sound business, scientific, engineering, and judgment safety when using this Recommended Practice.
All rights reserved. No part of this work may be reproduced, translated, stored in a retrieval system, or transmitted by any means,
electronic, mechanical, photocopying, recording, or otherwise, without prior written permission from the publisher. Contact the
Publisher, API Publishing Services, 1220 L Street, NW, Washington, DC 20005.
Copyright © 2016 American Petroleum Institute

Foreword
Nothing contained in any API publication is to be construed as granting any right, by implication or otherwise, for the
manufacture, sale, or use of any method, apparatus, or product covered by letters patent. Neither should anything
contained in the publication be construed as insuring anyone against liability for infringement of letters patent.
Shall: As used in a standard, “shall” denotes a minimum requirement in order to conform to the specification.
Should: As used in a standard, “should” denotes a recommendation or that which is advised but not required in order
to conform to the specification.
This document was produced under API standardization procedures that ensure appropriate notification and
participation in the developmental process and is designated as an API standard. Questions concerning the
interpretation of the content of this publication or comments and questions concerning the procedures under which
this publication was developed should be directed in writing to the Director of Standards, American Petroleum
Institute, 1220 L Street, NW, Washington, DC 20005. Requests for permission to reproduce or translate all or any part
of the material published herein should also be addressed to the director.
Generally, API standards are reviewed and revised, reaffirmed, or withdrawn at least every five years. A one-time
extension of up to two years may be added to this review cycle. Status of the publication can be ascertained from the
API Standards Department, telephone (202) 682-8000. A catalog of API publications and materials is published
annually by API, 1220 L Street, NW, Washington, DC 20005.
Suggested revisions are invited and should be submitted to the Standards Department, API, 1220 L Street, NW,
Washington, DC 20005, [email protected].
iii


Contents
Page
1 Scope . . . . . . . . . . . . . . . . . . . . . . . . . . . . . . . . . . . . . . . . . . . . . . . . . . . . . . . . . . . . . . . . . . . . . . . . . . . . . . . . . . 1
2 Normative References . . . . . . . . . . . . . . . . . . . . . . . . . . . . . . . . . . . . . . . . . . . . . . . . . . . . . . . . . . . . . . . . . . . . 1
3 Operating Experience . . . . . . . . . . . . . . . . . . . . . . . . . . . . . . . . . . . . . . . . . . . . . . . . . . . . . . . . . . . . . . . . . . . . . 2
3.1 Basis for Setting Integrity Operating Windows . . . . . . . . . . . . . . . . . . . . . . . . . . . . . . . . . . . . . . . . . . . . . . . . 2
3.2 Selecting Materials for New Equipment . . . . . . . . . . . . . . . . . . . . . . . . . . . . . . . . . . . . . . . . . . . . . . . . . . . . . . 2
3.3 High Temperature Hydrogen Attack (HTHA) in a Liquid Hydrocarbon Phase . . . . . . . . . . . . . . . . . . . . . . . 4
3.4 Base Material for Refractory-lined Equipment or Piping . . . . . . . . . . . . . . . . . . . . . . . . . . . . . . . . . . . . . . . . 4
3.5 References and Comments for Figure 1. . . . . . . . . . . . . . . . . . . . . . . . . . . . . . . . . . . . . . . . . . . . . . . . . . . . . . 4
4 Forms of HTHA . . . . . . . . . . . . . . . . . . . . . . . . . . . . . . . . . . . . . . . . . . . . . . . . . . . . . . . . . . . . . . . . . . . . . . . . . . 7
4.1 General . . . . . . . . . . . . . . . . . . . . . . . . . . . . . . . . . . . . . . . . . . . . . . . . . . . . . . . . . . . . . . . . . . . . . . . . . . . . . . . . . 7
4.2 Surface Decarburization . . . . . . . . . . . . . . . . . . . . . . . . . . . . . . . . . . . . . . . . . . . . . . . . . . . . . . . . . . . . . . . . . . . 8
4.3 Internal Decarburization, Fissuring, and Cracking . . . . . . . . . . . . . . . . . . . . . . . . . . . . . . . . . . . . . . . . . . . . . 8
5 Factors Influencing Internal Decarburization, Fissuring, and Cracking Caused by HTHA . . . . . . . . . . . . 9
5.1 Incubation Time . . . . . . . . . . . . . . . . . . . . . . . . . . . . . . . . . . . . . . . . . . . . . . . . . . . . . . . . . . . . . . . . . . . . . . . . . . 9
5.2 Effect of Primary Stresses . . . . . . . . . . . . . . . . . . . . . . . . . . . . . . . . . . . . . . . . . . . . . . . . . . . . . . . . . . . . . . . . 11
5.3 Effect of Secondary Stresses. . . . . . . . . . . . . . . . . . . . . . . . . . . . . . . . . . . . . . . . . . . . . . . . . . . . . . . . . . . . . . 11
5.4 Effect of Heat Treatment . . . . . . . . . . . . . . . . . . . . . . . . . . . . . . . . . . . . . . . . . . . . . . . . . . . . . . . . . . . . . . . . . . 11
5.5 Effect of Stainless Steel Cladding or Weld Overlay . . . . . . . . . . . . . . . . . . . . . . . . . . . . . . . . . . . . . . . . . . . 12
6 Inspection for HTHA . . . . . . . . . . . . . . . . . . . . . . . . . . . . . . . . . . . . . . . . . . . . . . . . . . . . . . . . . . . . . . . . . . . . . 13
6.1 General . . . . . . . . . . . . . . . . . . . . . . . . . . . . . . . . . . . . . . . . . . . . . . . . . . . . . . . . . . . . . . . . . . . . . . . . . . . . . . . . 13
6.2 References . . . . . . . . . . . . . . . . . . . . . . . . . . . . . . . . . . . . . . . . . . . . . . . . . . . . . . . . . . . . . . . . . . . . . . . . . . . . . 14
Annex A (informative) HTHA of 0.5Mo Steels . . . . . . . . . . . . . . . . . . . . . . . . . . . . . . . . . . . . . . . . . . . . . . . . . . . . . . 15
Annex B (informative) HTHA of 1.25 Cr-0.5Mo Steel . . . . . . . . . . . . . . . . . . . . . . . . . . . . . . . . . . . . . . . . . . . . . . . . 25
Annex C (informative) HTHA of 2.25Cr-1Mo Steel . . . . . . . . . . . . . . . . . . . . . . . . . . . . . . . . . . . . . . . . . . . . . . . . . . 27
Annex D (informative) Effective Pressures of Hydrogen in Steel Covered by Clad/Overlay . . . . . . . . . . . . . . . 29
Annex E (informative) Summary of Inspection Methods. . . . . . . . . . . . . . . . . . . . . . . . . . . . . . . . . . . . . . . . . . . . . 30
Annex F (informative) HTHA of Non-PWHT’d Carbon Steels . . . . . . . . . . . . . . . . . . . . . . . . . . . . . . . . . . . . . . . . . 34
Annex G (informative) Methodology for Calculating Hydrogen Partial Pressure in Liquid-filled Piping . . . . . 37
Annex H (informative) Internal Company Data Collection—Request for New Information. . . . . . . . . . . . . . . . . 41
Bibliography . . . . . . . . . . . . . . . . . . . . . . . . . . . . . . . . . . . . . . . . . . . . . . . . . . . . . . . . . . . . . . . . . . . . . . . . . . . . . . . . 43
Figures
1 Operating Limits for Steels in Hydrogen Service to Avoid High Temperature Hydrogen Attack . . . . . . . 3
2 C-0.5Mo Steel (ASTM A204 Grade A) Showing Internal Decarburization and Fissuring in
High Temperature Hydrogen Service . . . . . . . . . . . . . . . . . . . . . . . . . . . . . . . . . . . . . . . . . . . . . . . . . . . . . . . . 9
3 Incubation Time for High Temperature Hydrogen Attack Damage of Carbon Steel (Non-welded
or Welded with Postweld Heat Treatment) in High Temperature Hydrogen Service . . . . . . . . . . . . . . . . . 10
A.1 Experience with C-0.5Mo and Mn-0.5Mo Steel in High Temperature Hydrogen Service . . . . . . . . . . . . . 16
v

Contents
Page
A.2 Steels in High Temperature Hydrogen Service Showing Effect of Molybdenum and Trace
Alloying Elements . . . . . . . . . . . . . . . . . . . . . . . . . . . . . . . . . . . . . . . . . . . . . . . . . . . . . . . . . . . . . . . . . . . . . . . 22
A.3 Incubation Time for High Temperature Hydrogen Attack Damage of 0.5Mo Steels in High
Temperature Hydrogen Service . . . . . . . . . . . . . . . . . . . . . . . . . . . . . . . . . . . . . . . . . . . . . . . . . . . . . . . . . . . . 23
B.1 Operating Conditions for 1.25Cr-0.5Mo Steels That Experienced High Temperature Hydrogen
Attack Below the Figure 1 Curve . . . . . . . . . . . . . . . . . . . . . . . . . . . . . . . . . . . . . . . . . . . . . . . . . . . . . . . . . . . 26
C.1 Operating Conditions of 2.25Cr-1Mo Steels That Experienced High Temperature Hydrogen Attack
Below the Figure 1 Curve . . . . . . . . . . . . . . . . . . . . . . . . . . . . . . . . . . . . . . . . . . . . . . . . . . . . . . . . . . . . . . . . . 28
F.1 Operating Conditions for Carbon Steel (Welded with No PWHT) That Experienced HTHA Below
the 1977 Carbon Steel Figure 1 Curve . . . . . . . . . . . . . . . . . . . . . . . . . . . . . . . . . . . . . . . . . . . . . . . . . . . . . . 35
Tables
A.1 Operating Conditions for C-0.5Mo Steels That Experienced High Temperature Hydrogen Attack
Below the 0.5Mo Steel Curve in Figure A.1 . . . . . . . . . . . . . . . . . . . . . . . . . . . . . . . . . . . . . . . . . . . . . . . . . . 21
A.2 References Along with Chromium, Molybdenum, Vanadium and Molybdenum Equivalent
Values for Figure A.2. . . . . . . . . . . . . . . . . . . . . . . . . . . . . . . . . . . . . . . . . . . . . . . . . . . . . . . . . . . . . . . . . . . . . 24
B.1 Experience with HTHA of 1.25Cr-0.5Mo Steel at Operating Conditions Below the Figure 1 Curve. . . . . 25
C.1 Experience with High Temperature Hydrogen Attack of 2.25Cr-1Mo Steel at Operating
Conditions Below the Figure 1 Curve . . . . . . . . . . . . . . . . . . . . . . . . . . . . . . . . . . . . . . . . . . . . . . . . . . . . . . . 27
E.1 Summary of Ultrasonic Inspection Methods for High Temperature Hydrogen Attack . . . . . . . . . . . . . . . 31
E.2 Summary of Non-ultrasonic Inspection Methods for High Temperature Hydrogen Attack . . . . . . . . . . . 33
G.1 Effective Hydrogen Partial Pressures. . . . . . . . . . . . . . . . . . . . . . . . . . . . . . . . . . . . . . . . . . . . . . . . . . . . . . . 39
G.2 Effective Hydrogen Partial Pressures with the Composition Variation + Compensation Method. . . . . . 40
vi

Introduction
At normal atmospheric temperatures, gaseous molecular hydrogen does not readily permeate steel, even at high
pressures. Carbon steel is the standard material for cylinders that are used to transport hydrogen at pressures of
2000 psi (14 MPa). Many postweld heat treated carbon steel pressure vessels have been used successfully in
continuous service at pressures up to 10,000 psi (69 MPa) and temperatures up to 430 °F (221 °C). However, under
these same conditions, highly stressed carbon steels and hardened steels have cracked due to hydrogen
embrittlement.
The recommended maximum hydrogen partial pressure at atmospheric temperature for carbon steel fabricated in
accordance with the ASME Boiler and Pressure Vessel Code is 13,000 psia (90 MPa). Below this pressure, carbon
steel equipment has shown satisfactory performance. Above this pressure, very little operating and experimental data
are available. If plants are to operate at hydrogen partial pressures that exceed 13,000 psia (90 MPa), the use of an
austenitic stainless steel liner with venting in the shell should be considered.
At elevated temperatures, molecular hydrogen dissociates into the atomic form, which can readily enter and diffuse
through the steel. Under these conditions, the diffusion of hydrogen in steel is more rapid. As discussed in Section 4,
hydrogen reacts with the carbon in the steel to cause either surface decarburization or internal decarburization and
fissuring, and eventual cracking. This form of hydrogen damage is called high temperature hydrogen attack (HTHA),
and this recommended practice discusses the resistance of steels to HTHA.
vii

--```,````,````,`,,``,,`,````,`-`-`,,`,,`,`,,`---

1
Steels for Hydrogen Service at Elevated Temperatures and Pressures in Petroleum Refineries and Petrochemical Plants
1 Scope
This recommended practice (RP) summarizes the results of experimental tests and actual data acquired from
operating plants to establish practical operating limits for carbon and low alloy steels in hydrogen service at elevated
temperatures and pressures. The effects on the resistance of steels to hydrogen at elevated temperature and
pressure that result from high stress, heat treatment, chemical composition, and cladding are discussed. This RP
does not address the resistance of steels to hydrogen at lower temperatures [below about 400 °F (204 °C)], where
atomic hydrogen enters the steel as a result of an electrochemical mechanism.
This RP applies to equipment in refineries, petrochemical facilities, and chemical facilities in which hydrogen or
hydrogen-containing fluids are processed at elevated temperature and pressure. The guidelines in this RP can also be
applied to hydrogenation plants such as those that manufacture ammonia, methanol, edible oils, and higher alcohols.
The steels discussed in this RP resist high temperature hydrogen attack (HTHA) when operated within the guidelines
given. However, they may not be resistant to other corrosives present in a process stream or to other metallurgical
damage mechanisms that can occur in the operating HTHA range. This RP also does not address the issues
surrounding possible damage from rapid cooling of the metal after it has been in high temperature, high pressure
hydrogen service (e.g. possible need for outgassing hydroprocessing reactors). This RP discusses in detail only the
resistance of steels to HTHA.
Presented in this document are curves that indicate the operating limits of temperature and hydrogen partial pressure
for satisfactory resistance of carbon steel and Cr-Mo steels to HTHA in elevated temperature hydrogen service. In
addition, it includes a summary of inspection methods to evaluate equipment for the existence of HTHA.
2 Normative References
The following referenced documents are indispensable for the application of this document. For dated references,
only the edition cited applies. For undated references, the latest edition of the referenced document (including any
amendments) applies.
API 510, Pressure Vessel Inspection Code: In-Service Inspection, Rating, Repair, and Alteration
API 570, Piping Inspection Code: In-Service Inspection, Rating, Repair, and Alteration of Piping Systems
API Recommended Practice 584, Integrity Operating Windows
ASME Boiler and Pressure Vessel Code (BPVC) 1, Section VIII: Pressure Vessels; Division 1
ASME Boiler and Pressure Vessel Code (BPVC), Section VIII: Pressure Vessels; Division 2
ASME/ANSI 2 Code for Pressure Piping B31.3, Chemical Plant and Petroleum Refinery Piping
AWS D10.10/D10.10M 3, Recommended Practices for Local Heating of Welds in Piping and Tubing
WRC Bul-452 4, Recommended Practices for Local Heating of Welds in Pressure Vessels
1 ASME International, 2 Park Avenue, New York, New York 10016-5990, www.asme.org.2 American National Standards Institute, 25 West 43rd Street, 4th Floor, New York, New York 10036, www.ansi.org.3 American Welding Society, 8669 NW 36 Street, # 130, Miami, Florida 33166-6672, www.aws.org4 Welding Research Council, P.O. Box 201547, Shaker Heights, Ohio 44122, www.forengineers.org

2 API RECOMMENDED PRACTICE 941
3 Operating Experience
3.1 Basis for Setting Integrity Operating Windows
Figure 1 illustrates the resistance of steels to attack by hydrogen at elevated temperatures and hydrogen pressures.
HTHA of steel can result in surface decarburization, internal decarburization, fissuring, and cracking, or a combination
of these (see Section 4). Figure 1 gives the operating conditions (process temperature and hydrogen partial pressure)
above which these types of damage can occur.
Figure 1 is based upon experience gathered since the 1940s. Supporting data were obtained from a variety of
commercial processes and laboratory experiments (see the References to Figure 1). While temperature and
hydrogen partial pressure data were not always known precisely, the accuracy is often sufficient for commercial use.
Satisfactory performance has been plotted only for samples or equipment exposed for at least 1 year. Unsatisfactory
performance from laboratory or plant data has been plotted, regardless of the length of exposure time. The chemical
compositions of the steels in Figure 1 should conform to the limits specified for the various grades by ASTM/ASME.
Owners/operators should develop integrity operating windows (IOWs) (as outlined in API 584) to manage risks
associated with HTHA by using operational experience presented in this document.
Since the original version of Figure 1 was prepared for API in 1949 [1], further experience has enabled curves for
most commonly used steels to be more accurately located. All information relevant to 0.5Mo steels (C-0.5Mo and
Mn-0.5Mo) is summarized in Annex A.
The Fifth Edition of this RP also added three data points, which show HTHA of 1.25Cr-0.5Mo steel below the current
1.25Cr-0.5Mo curve. See Annex B for more discussion of 1.25Cr-0.5Mo steel. Annex C gives a similar discussion for
2.25Cr-1.0Mo steel.
This Eighth Edition adds 12 data points and a new curve labeled as “Carbon steel (welded with no PWHT)” for HTHA
of carbon steel not subjected to postweld heat treatment (PWHT), which is below the carbon steel curve appearing in
all previous editions and now labeled as “Carbon steel (non-welded or welded with PWHT).” See Annex F for more
discussion on carbon steel welds not subjected to PWHT.
3.2 Selecting Materials for New Equipment
The API Subcommittee on Corrosion and Materials collects data on the alloys shown in all figures or similar alloys
that may come into use. Follow the guidance in Annex H for submitting new data.
Figure 1 is often used when selecting materials for new equipment in hydrogen service. When using Figure 1 as an
aid for materials selection, it is important to recognize that Figure 1 only addresses a material’s resistance to HTHA. It
does not take into account other factors important at high temperatures such as:
a) other corrosive species that may be in the system such as hydrogen sulfide;
b) creep, temper embrittlement, or other high temperature damage mechanisms;
c) interaction of hydrogen and stress (primary, secondary, and residual); and
d) synergistic effects such as between HTHA and creep.
Temperatures for data plotted in the figures represent a range in operating conditions that in previous editions was
stated to be about ±20 °F (±11 °C). Because of the uncertainty of the actual operating conditions over many decades
of operation for data points contained in the curves, users need to understand that Figure 1 is based largely upon
empirical experience and from the guidance in API TR 941 [39]. Therefore, an operating company should add a safety
margin, below the relevant curve, when selecting steels.

STEELS FOR HYDROGEN SERVICE AT ELEVATED TEMPERATURES AND PRESSURES IN PETROLEUM REFINERIES AND PETROCHEMICAL PLANTS 3
Fig
ure
1—
Op
era
tin
g L
imit
s f
or
Ste
els
in
Hyd
rog
en
Serv
ice t
o A
vo
id H
igh
Tem
pera
ture
Hyd
rog
en
Att
ack
30
00
50
00
70
00
90
00
11
,00
01
3,0
00
20
0
40
0
30
0
50
0
60
0
70
0
80
0
Temperature, °C
25
00
20
00
15
00
10
00
50
03
00
50
0
40
0
60
0
70
0
80
0
90
0
10
00
11
00
12
00
13
00
14
00
15
00
Temperature, °F
Hyd
rog
en
Pa
rtia
l P
ressu
re,
psia
3.4
56
.90
10
.34
13
.79
17
.24
20
.73
4.5
48
.36
2.1
73
.8
Hyd
rog
en
Pa
rtia
l P
ressu
re,
MP
a A
bso
lute
0
10
10
22
49
1 9
4
Su
rfa
ce
de
ca
rbu
riza
tio
n
Inte
rna
l d
eca
rbu
riza
tio
n
Sa
tisfa
cto
ry
Inte
rna
l d
eca
rbu
riza
tio
n
an
d f
issu
rin
g
Su
rfa
ce
de
ca
rbu
riza
tio
n
Se
e c
om
me
nts
Le
ge
nd
:
Ca
rbo
nste
el
No
n-P
WH
TC
arb
on
ste
el
1.0
Cr
0.5
Mo
2.2
5C
r1
.00
Mo
3.0
Cr
1.0
Mo
6.0
Cr
0.5
Mo
8 (
24
0 °
F)
13
8U
56
3
6
22
17
15
13
+0
.1%
V
24
(2
8,0
00
)
13
+0
.5%
W0
.75
%V
3
13
13
13
3
14
+0
.25
%V
6.0
Cr-
0.5
Mo
ste
el
3.0
Cr-
1M
o s
tee
l2
.25
Cr-
1M
o-V
ste
el
2.2
5C
r-1
.0M
o s
tee
l
1.2
5C
r-0
.5M
o o
r 1
.0C
r-0
.5M
o s
tee
l
7
1N1Q
1J
1 1
1P
7
1
1L
1N
1
Ca
rbo
n s
tee
l (n
on
-we
lde
d o
r
we
lde
d w
ith
PW
HT
)
Ca
rbo
n s
tee
l (w
eld
ed
with
no
PW
HT
)
3
2K
3
1K
1
1
11
20
23
7
7,3 1 5
23
7 7
23
19
12
B
20
A
21
G
25
H
21
E
21
E2
6
35
h 23
F
23
23
16
C1
D
33
S
23
20
11
19
23
1
23
23
40
34
37
36
35
a
39
23
18
T1
1
16
3 (
15
10
°F
)
3
Sca
le c
ha
ng
e
1.2
5C
r-0
.5M
o s
tee
l
1.0
Cr-
0.5
Mo
ste
el
No
te:
Se
e A
nn
ex A
an
d F
igu
re A
.1
fo
r 0
.5M
o s
tee
ls
The lim
its d
escribed b
y these c
urv
es a
re b
ased o
n s
erv
ice e
xperience o
rigin
ally
colle
cte
d b
y G
.A. N
els
on a
nd o
n a
dditio
nal
info
rmation g
ath
ere
d b
y o
r m
ade a
vaila
ble
to A
PI.
Auste
nitic
sta
inle
ss s
teels
are
genera
lly n
ot decarb
urized in h
ydro
gen a
t any tem
pera
ture
or
hydro
gen p
ressure
.T
he lim
its d
escribed b
y these c
urv
es a
re b
ased o
n e
xperience w
ith c
ast ste
el as w
ell
as a
nneale
d a
nd n
orm
aliz
ed s
teels
at
str
ess levels
defined b
y S
ection V
III, D
ivis
ion 1
, of th
e A
SM
E C
ode. S
ee 5
.3 a
nd 5
.4 in text fo
r additio
nal in
form
ation.
Severa
l fa
ilure
s o
f 1.2
5C
r1-M
o s
teel have b
een r
eport
ed in the s
atisfa
cto
ry r
egio
n. S
ee A
nnex B
for
deta
ils.
The inclu
sio
n o
f th
e 2
.25C
r-1M
o-V
cla
ss o
f ste
els
is b
ased o
n 1
0,0
00+
hr
labora
tory
tests
where
these a
lloys w
ere
at le
ast
equal to
the 3
Cr-
1M
o s
teel. S
ee R
efe
rence [22] lis
ted in the B
iblio
gra
phy.
NO
TE
1
NO
TE
2N
OT
E 3
NO
TE
4N
OT
E 5
Copyright ©
1967 b
y G
.A. N
els
on. P
roduction r
ights
gra
nte
d b
y a
uth
or
to A
PI.
This
fig
ure
was r
evis
ed b
y A
PI in
1969, 1983, 1990, 1996, and 2
015.
38

4 API RECOMMENDED PRACTICE 941
3.3 High Temperature Hydrogen Attack (HTHA) in a Liquid Hydrocarbon Phase
HTHA can occur in a liquid hydrocarbon phase if it can occur in the gas phase in equilibrium with the liquid phase. For
materials selection purposes (using Figure 1), hydrogen dissolved in liquid hydrocarbon should be assumed to exert
a vapor pressure equal to the hydrogen partial pressure of the gas with which the liquid is, or was last, in equilibrium.
Recent plant experience and testing of field-exposed specimens have shown that HTHA can occur under such
conditions [10].
HTHA has been found in liquid-filled carbon steel piping downstream of a heavy oil desulfurization unit separator that
was operating at hydrogen partial pressure and temperature conditions above the Figure 1 welded with PWHT
carbon steel curve. Testing of field-exposed test specimens showed HTHA of both chrome-plated and bare carbon
steel samples that were totally immersed in liquid [10].
Several HTHA failures were found in liquid-filled carbon steel piping not subject to PWHT downstream of gasoline
desulfurization unit reactors that were operating at hydrogen partial pressures and temperatures below the welded
and PWHT carbon steel curve as it appeared in Figure 1 in previous editions of this RP. See Annex F for more
discussion of non-PWHT’d carbon steel. See Annex G for more discussion on how to calculate the hydrogen partial
pressure in liquid-filled equipment and piping.
3.4 Base Material for Refractory-lined Equipment or Piping
For cold-wall refractory-lined equipment or piping, there can be a risk of HTHA when:
— the internal process conditions are above the relevant carbon steel curve of Figure 1, and
— the refractory becomes degraded or there is gas bypass behind the refractory, resulting in a hot spot on the outer
shell.
The materials selection for the outer shell should consider the risk and possible severity of metal hot spots due to
refractory damage. The risk of hot spots is greater if the refractory is known to experience erosion or other
degradation mechanisms in the specific service. The risk level may be mitigated if there are effective techniques of
promptly detecting hot spots and efficient means of keeping the hot spot areas cooled. As such, owners/operators
should inspect refractory-lined equipment periodically with thermography and mitigate the hot spots with air/steam to
a temperature below the Nelson curve, but above any process dew point.
A more reliable way of protecting the base metal in refractory-lined equipment with a risk of HTHA is to select
materials resistant to the internal hydrogen partial pressure and predicted hot spot temperatures. The design can still
take advantage of higher allowable stresses at the cooler refractory-protected temperatures to enable less wall
thickness, while protecting the base metal from the potential of HTHA failure.
3.5 References and Comments for Figure 1
NOTE The data points in Figure 1 are labeled with reference numbers corresponding to the sources listed in 3.5.1. The letters in the figure correspond to the comments listed in 3.5.2.
3.5.1 References
1) Shell Oil Company, private communication to API Subcommittee on Corrosion.
2) Timken Roller Bearing Company, private communication to API Subcommittee on Corrosion.
3) F.K. Naumann, “Influence of Alloy Additions to Steel Upon Resistance to Hydrogen Under High Pressure,”
Technische Mitieilungen Krupp, Vol. 1, No. 12, pp. 223–234, 1938.

STEELS FOR HYDROGEN SERVICE AT ELEVATED TEMPERATURES AND PRESSURES IN PETROLEUM REFINERIES AND PETROCHEMICAL PLANTS 5
4) N.P. Inglis and W. Andrews, “The Effect on Various Steels of Hydrogen at High Pressure and Temperature,”
Journal of the Iron and Steel Institute, Vol. 128, No. 2, pp. 383–397, 1933.
5) J.L. Cox, “What Steel to Use at High Pressures and Temperatures,” Chemical and Metallurgical Engineering, Vol.
40, pp. 405–409, 1933.
6) R.J. Sargant and T.H. Middleham, “Steels for Autoclaves,” Chemical Engineering Congress Transactions, Vol. I,
World Power Conference, London, pp. 66–110, June 1936.
7) Standard Oil Company of California, private communication to API Subcommittee on Corrosion.
8) E.I. du Pont de Nemours and Company, private communication to API Subcommittee on Corrosion.
9) Ammoniawerk Merseberg, private communication to API Subcommittee on Corrosion, 1938.
10) Hercules Powder Company, private communication to API Subcommittee on Corrosion.
11) C.A. Zapffe, “Boiler Embrittlement,” Transactions of the ASME, Vol. 66, pp. 81–126, 1944.
12) The M.W. Kellogg Company, private communication to API Subcommittee on Corrosion.
13) German operating experience, private communication to API Subcommittee on Corrosion, 1946.
14) Vanadium Corporation of America, private communication to API Subcommittee on Corrosion.
15) Imperial Chemical Industries, Billingham, England, private communication to API Subcommittee on Corrosion.
16) T.C. Evans, “Hydrogen Attack on Carbon Steels,” Mechanical Engineering, Vol. 70, pp. 414–416, 1948.
17) Norweg Hydroelectric, Oslo, Norway, private communication to API Subcommittee on Corrosion.
18) Union Oil Company of California, private communication to API Subcommittee on Corrosion, 1980.
19) A.R. Ciuffreda and W.D. Rowland, “Hydrogen Attack of Steel in Reformer Service,” Proceedings, Vol. 37, API,
New York, pp. 116–128, 1957.
20) API Refinery Corrosion Committee Survey, 1957.
21) Air Products, Inc., private communication to API Subcommittee on Corrosion, March 1960.
22) G.D. Gardner and J.T. Donovan, “Corrosion and Erosion in the Synthetic Fuels Demonstration Plants,”
Transactions of the ASME, Vol. 75, pp. 525–533, 1953.
23) Amoco Oil Company, private communication to API Subcommittee on Corrosion, 1960.
24) E.W. Comings, High Pressure Technology, McGraw-Hill, New York, 1956.
25) M. Hasegawa and S. Fujinaga, “Attack of Hydrogen on Oil Refinery Steels,” Tetsu To Hagane, Vol. 46, No. 10,
pp. 1349–1352, 1960.
26) K.L. Moore and D.B. Bird, “How to Reduce Hydrogen Plant Corrosion,” Hydrocarbon Processing, Vol. 44, No. 5,
pp. 179–184, 1965.
27) Union Oil Company of California, private communication to API Subcommittee on Corrosion, 1976.
28) Amoco Oil Company, private communication to API Subcommittee on Corrosion, 1976.
29) Standard Oil Company of California, private communication to API Subcommittee on Corrosion, 1976.
6 API RECOMMENDED PRACTICE 941
30) Exxon Corporation, private communication to API Subcommittee on Corrosion, 1976.
31) Shell Oil Company, private communication to API Subcommittee on Corrosion, 1976.
32) Cities Service Company, private communication to API Subcommittee on Corrosion, 1976.
33) Gulf Oil Corporation, private communication to API Subcommittee on Corrosion, 1976.
34) J. McLaughlin, J. Krynicki, and T. Bruno, “Cracking of non-PWHT’d Carbon Steel Operating at Conditions
Immediately Below the Nelson Curve,” Proceedings of 2010 ASME Pressure Vessels and Piping Conference,
July 2010, Bellevue Washington, PVP2010-25455.
35) Eight separate points 35a through 35h. Valero Energy Corporation, private communication to API Subcommittee
on Corrosion, 2012.
36) Phillips 66 Company, private communication to API Subcommittee on Corrosion, 2012.
37) Phillips 66 Company, private communication to API Subcommittee on Corrosion, 2012.
38) Total Refining and Marketing, private communication to API Subcommittee, 2011.
39) Marathon Petroleum Co., private communication to API Subcommittee, 2014.
40) Marathon Petroleum Co., private communication to API Subcommittee, 2014.
3.5.2 Comments
A) A section made of A106 pipe was found to be damaged to 27 % of its thickness after 5745 hours. Other pieces of
pipe in the same line were unaffected.
B) The damage was concentrated in the overheated section of a hot bent steel elbow. The unheated straight portions
of the elbow were not attacked.
C) In a series of 29 steel samples, 12 were damaged, while 17 were not.
D) After 2 years exposure, five out of six pieces of carbon steel pipe were damaged. One piece of pipe was
unaffected.
E) Damage was concentrated in the weld and heat-affected sections of A106 pipe. Base metal on either side of this
zone was unaffected.
F) After 11 years of service, damage was found in the hot bent section of A106 pipe. Unheated straight sections were
not affected.
G) After 2 years of service, all parts of carbon steel pipe, including weld and heat-affected zone (HAZs), were
satisfactory.
H) After 4 years of service, weld and HAZs of A106 pipe showed cracks.
J) After 31 years of service, a forging of 0.3C-1.3Cr-0.25Mo steel showed cracks 0.007 in. (0.2 mm) deep.
K) Pipes of 1.25Cr-0.25Mo steel.
L) After 4 years of service, a forging of 0.3C-1.3Cr-0.25Mo steel was unaffected.
N) After 7 years of service, a forging of 0.3C-1.52Cr-0.50Mo steel showed cracks 0.050 in. (1.3 mm) deep.

STEELS FOR HYDROGEN SERVICE AT ELEVATED TEMPERATURES AND PRESSURES IN PETROLEUM REFINERIES AND PETROCHEMICAL PLANTS 7
P) After 30 years of service, a forging of 0.30C-0.74Cr-0.43Ni steel was unaffected.
Q) After 15 years in ammonia service, a pipe of 0.15C-2.25Cr-1.00Mo steel showed no HTHA but was nitrided to a
depth of 0.012 in. (0.3 mm).
S) After 8 years, carbon steel cracked.
T) After 18 years, carbon steel did not show HTHA.
U) After 450 days exposure, a 1.25Cr-0.5Mo valve body was not damaged by HTHA.
V) Point 34. After 30+ years non-PWHT’d carbon steel reactor, vessels, and associated piping in light distillate
hydrotreating service cracked from HTHA. Operating at roughly 580 °F (304 °C) and at 125 psia (0.86 MPa).
W) Points 35a and 35h. These 2 points on the plot represent the range of 8 different failures. After 4.5 to 8 years, 7
different non-PWHT’d carbon steel flanges cracked in the HAZs on the flange side of a flange-to-pipe weld in
gasoline hydrotreating service. One cracked on the pipe side of the pipe-to-flange weld. Operating at roughly
645 °F (340 °C) and at 57 psia to 94 psia (0.39 MPa to 0.65 MPa) hydrogen partial pressure.
X) Point 37. After 14 years, a non-PWHT’d SA-105 carbon steel flange cracked in the HAZ on the flange side of a
flange-to-pipe weld. Operating at roughly 600 °F (316 °C) and at 280 psia (1.9 MPa).
Y) Point 36. After 6 years, multiple non-PWHT’d carbon steel flanges cracked in the HAZs on the flange side of a
flange to pipe welds in a gasoline desulfurization unit. Operating at roughly 670 °F (354 °C) and at 85 psia (0.59
MPa).
Z) Point 38. After 29 years, a non-PWHT’d carbon steel exchanger shell in Hydrodesulfurization (HDS) service
cracked. Operating at roughly 500 °F (260 °C) and at 670 psia (4.6 MPa).
A.1) Point 39. After 10 years, inspection found cracks in a non-PWHT’d carbon steel exchanger shell in light
hydrotreater service. Operating at roughly 540°F (282 °C) and at 130 psia (0.90 MPa).
B.1) Point 40. After 30+ years, inspection found cracks in a non-PWHT’d carbon steel exchanger shell in light
hydrotreater service. Operating at roughly 490 °F (254 °C) and at 195 psia (1.3 MPa).
4 Forms of HTHA
4.1 General
High temperature hydrogen can attack steels in two ways:
a) surface decarburization, and
b) internal decarburization and fissuring, eventually leading to cracking.
The combination of high temperature and low hydrogen partial pressure favors surface decarburization without
internal decarburization and fissuring. The combination of low temperature, but above 400 °F (204 °C), and high
hydrogen partial pressure, above 2200 psia (15.17 MPa), favors internal decarburization and fissuring, which can
eventually lead to cracking. At high temperatures and high hydrogen partial pressures, both mechanisms are active.
These mechanisms are described in detail below.
The broken-line curves at the top of Figure 1 represent the tendencies for surface decarburization of steels while they
are in contact with hydrogen. The solid-line curves represent the tendencies for steels to decarburize internally with
resultant fissuring and cracking.

8 API RECOMMENDED PRACTICE 941
4.2 Surface Decarburization
Surface decarburization without fissuring has been associated with hydrogen partial pressure and temperature
conditions that are not severe enough to generate the methane pressures needed to form fissures. This typically
occurs in carbon steel where the Nelson curves become vertical [39].
Surface decarburization as a form of HTHA is similar to that resulting from the high-temperature exposure of steel to
certain other gases such as air, oxygen, or carbon dioxide. The usual effects of surface decarburization are a slight,
localized reduction in strength and hardness and an increase in ductility. Because these effects are usually small,
there is often much less concern with surface decarburization than there is with internal decarburization.
A number of theories have been proposed to explain surface decarburization [2] [3] [4], but the currently accepted view
is based on the migration of carbon to the surface where gaseous compounds of carbon are formed, rendering the
steel less rich in carbon. The gaseous compounds formed are CH4 or, when oxygen-containing gases are present,
CO. Water vapor hastens the reaction. While carbon in solution diffuses to the surface to form gaseous carbon
compounds, the carbon in solution is continuously supplied from the carbide compounds in the steel. Thus, carbide
stability is directly related to the rate of surface decarburization.
In cases where surface decarburization predominates over internal attack, the actual values of pressure-temperature
combinations have not been extensively studied, but the limits defined by Naumann [5] probably give the most
accurate trends.
4.3 Internal Decarburization, Fissuring, and Cracking
The solid-line curves in Figure 1 define the areas above which material damage by internal decarburization and
fissuring/cracking have been reported. Below and to the left of the curve for each alloy, satisfactory performance has
been experienced with periods of exposure of up to approximately 60 years. At temperatures above and to the right of
the solid curves, there is a probability that internal decarburization and fissuring/cracking may occur. Internal
decarburization and fissuring are preceded by a period of time where no immediate damage is detected, and this is
often referred to as an “incubation period.” The incubation period depends on temperature and hydrogen partial
pressure (see 5.1 for further discussion).
Internal decarburization and fissuring are caused by hydrogen permeating the steel and reacting with carbon to form
methane [5]. The methane formed cannot diffuse out of the steel and typically accumulates at grain boundaries. This
results in high localized stresses that lead to the formation of fissures, cracks, or blisters in the steel. Fissures in
hydrogen-damaged steel lead to a substantial deterioration of mechanical properties.
Figure 2 shows the microstructure of a sample of C-0.5Mo steel damaged by internal decarburization and fissuring.
The service conditions were 790 °F (421 °C) at a hydrogen partial pressure of 425 psia (2.9 MPa) for approximately
65,000 hours in a catalytic reformer.
The addition of carbide stabilizers to steel reduces the tendency toward internal fissuring. Elements, such as
chromium, molybdenum, tungsten, vanadium, titanium, and niobium, form more stable alloy carbides that resist
breakdown by hydrogen and thereby decrease the propensity to form methane [6]. The solid-line curves in Figure 1
reflect the increased resistance to internal attack when molybdenum and chromium are present.
The presence of nonmetallic inclusions tends to increase the extent of blistering damage. If steel contains segregated
impurities, stringer-type inclusions or laminations then severe blistering may in these areas from hydrogen or
methane accumulation [7].
Alloys other than those shown in Figure 1 may also be suitable for resisting HTHA. These include modified carbon
steels and low alloy steels to which carbide stabilizing elements (molybdenum, chromium, vanadium, titanium, or
niobium) have been added such as some European alloys [8]. Austenitic stainless steels are resistant to
decarburization, even at temperatures above 1000 °F (538 °C) [9].

STEELS FOR HYDROGEN SERVICE AT ELEVATED TEMPERATURES AND PRESSURES IN PETROLEUM REFINERIES AND PETROCHEMICAL PLANTS 9
5 Factors Influencing Internal Decarburization, Fissuring, and Cracking Caused by HTHA
5.1 Incubation Time
Internal HTHA begins once the service conditions (high pressure and high temperature hydrogen) are such that the
hydrogen diffused into the steel begins to react with the carbon or carbides in the steel. In the initial stages of attack,
there is a period of time where the damage is so microscopic that it cannot be detected by current NDE and
metallographic technology. Beyond this there is also a period when no noticeable change in mechanical properties is
detectable by current testing methods. After this period of time has elapsed, material damage is evident with resultant
decreases in strength, ductility, and toughness. This varies with the type of steel and severity of exposure; it may take
only a few hours under extreme conditions and take progressively longer at lower temperatures and hydrogen partial
pressures. With some steels under mild conditions, no damage can be detected even after many years of exposure.
During this initial stage of attack, in some cases, laboratory examination (high magnification metallography, utilizing
optical microscopy and scanning electron microscopy) of samples removed from the equipment have revealed the
initial stages of attack with voids at grain boundaries.
The period of time until mechanical damage can be detected is commonly referred to as the “incubation time” in the
petrochemical industry. The length of the incubation period is important because it determines the useful life of a steel
at conditions under which internal HTHA occurs. Useful theoretical models of the HTHA mechanism and incubation
period have been proposed [11] [12] [13] [39].
Internal HTHA can be viewed as occurring in four stages:
a) the incubation period during which the microscopic damage cannot be detected with advanced NDE techniques
and the mechanical properties are not affected;
b) the stage where damage is detectable optically (<1000X), possibly detectable by advanced NDE techniques, and
mechanical properties are partially deteriorated;
Figure 2—C-0.5Mo Steel (ASTM A204 Grade A) Showing Internal Decarburization
and Fissuring in High Temperature Hydrogen Service
Fissure
Unaltered pearlite
Decarburized zone
Ferrite
NOTE Service conditions were 65,000 hours in a catalytic reformer at a temperature of 790 °F (421 °C) and a
hydrogen partial pressure of 425 psia (2.9 MPa). From Reference [11] in the Bibliography. Magnification: 520X; nital etched.

10 API RECOMMENDED PRACTICE 941
c) the stage of rapid mechanical property deterioration associated with rapid fissure growth; and
d) the final stage where carbon in solid solution is reduced to compromise material mechanical properties to a level
where cracking can occur.
During the incubation period, methane pressure builds up in submicroscopic voids. These voids grow slowly due to
both internal methane pressure and applied stress. When the voids reach a critical size and begin connecting to form
fissures, the effects on mechanical properties become evident. The incubation period depends on many variables
including the type of steel, degree of cold working, amount of impurity elements, applied stress, hydrogen pressure,
and temperature.
Incubation curves for non-welded or welded with PWHT carbon steel are given in Figure 3. These can be used as a
guide in determining approximate safe operating times when PWHT’d carbon steel equipment operates above its
curve in Figure 1. Annex A includes similar curves that may be useful for some heats of C-0.5Mo steel, with the
precaution that the resistance of C-0.5Mo steel to HTHA is particularly sensitive to heat treatment, chemical
composition, and the heating/cooling history of the steel during forming [15] [16] [17] [18]. API Technical Report (TR) 941,
The Technical Basis Document for API RP 941, provides additional guidance on safe operating times for steels above
their respective curves in Figure 1.
The Figure 3 and Annex A incubation curves, as well as the guidance in API TR 941, are commonly used to evaluate
unintentional upsets and short-term intentional operating periods such as during start-up of a process unit and
elevated temperatures at end of run. Recent experience with HTHA in liquid-filled hydrocarbon service showed that
HTHA occurred much more rapidly than what these curves predict. Incubation curves should not be used for liquid-
filled streams.
Figure 3—Incubation Time for High Temperature Hydrogen Attack Damage of Carbon Steel (Non-welded or
Welded with Postweld Heat Treatment) in High Temperature Hydrogen Service
(see 6.2 for references for this figure)
0400
500<17,000 C
<17,000 J<8500 B
<29,000 A
<27,000 A
500 F
<5800 L
300 D
300 D 30 E 10 D
25 E
25 D
65 E
<100 G
<100 G
<100 D
10,000 hoursNo attack
Hydrogen Partial Pressure, psia
Hydrogen Partial Pressure, MPa Absolute
Tem
pera
ture
, °C
Tem
pera
ture
, °F
1000 hours
400 hours
200 hours
100 hours
31 E
<280 M (7000 psia)
>280 M (7000 psia)
<5500 G (12,500 psia)
<100 G (4200 psia)
>100 G
>100 G
120 E
280 E
<95,000 A<34,000 H
<8500 K
600
700
800
900
1000
500 1000 1500 2000 2500
0 3.45 6.90 10.34 13.79 17.24
300
400
500

STEELS FOR HYDROGEN SERVICE AT ELEVATED TEMPERATURES AND PRESSURES IN PETROLEUM REFINERIES AND PETROCHEMICAL PLANTS 11
5.2 Effect of Primary Stresses
Primary stresses are design stresses imposed by internal pressure, nozzle loadings, and the like. While it is known
that very high stress levels can accelerate the rate of HTHA development (see, for example, Annex C), long-term
operating experience dating from before 1969 has demonstrated that equipment designed within the allowable
stresses of the relevant ASME Codes, which include ASME Section VIII Divisions 1 and 2 for pressure vessels and
ASME B31.3 for piping, as well as equivalent foreign national codes, will perform satisfactorily when operated within
the temperature and hydrogen partial pressure limits given in Figure 1 for the particular steel.
ASME Section VIII Division 2 has higher allowable design stresses than Division 1 and is typically used for high
pressure, high temperature, thick-wall pressure vessels made of Cr-Mo steels. The Cr-Mo steels typically receive a
normalized and tempered (N&T) or quenched and tempered (Q&T) heat treatment to provide improved fracture
toughness, as well as slightly higher strength, as compared to carbon steel. Cr-Mo steel vessels designed to the
higher allowable stress levels of Division 2 have a long, successful history of resistance to HTHA, as long as stresses
are within the ASME Code allowable limits (or similar allowable limits in equivalent non-ASME Codes) and when
operated within the temperature and hydrogen partial pressure limits given in Figure 1. This is evidenced by the lack
of internal decarburization and fissuring data points for the steels in Figure 1.
While unusually high localized stresses have, in rare cases, caused HTHA in 2.25Cr-1Mo steel under temperature
and hydrogen partial pressure conditions not expected to cause damage according to Figure 1 [23], there is no report
of HTHA below the Figure 1 limits when stresses are within the design limits of the ASME Code.
Research studies [19] [20] [21] [22] have shown that creep strength and ductility of 2.25Cr-1Mo steel are diminished in
very high pressure H2 as compared to air. However, as long as operating temperatures are kept below the 850 °F
(454 °C) limit given in Figure 1, creep of 2.25Cr should not be an issue.
5.3 Effect of Secondary Stresses
HTHA can be accelerated by secondary stresses such as thermal stresses or those induced by cold work. High
thermal stresses were considered to play a significant role in the HTHA of some 2.25Cr-1Mo steel piping [24]. Other
2.25Cr-1Mo steel piping in the same system, subjected to more severe hydrogen partial pressures and temperatures,
was not attacked.
The effect of cold work was demonstrated by Vitovec in research sponsored by API and summarized in API 940 [6].
Vitovec compared specific gravities of SAE 1020 steel with varying degrees of cold work tested in 900 psi (6.2 MPa)
hydrogen at 700 °F (371 °C), 800 °F (427 °C), and 1000 °F (538 °C). The decrease in specific gravity over time
indicates the rate at which internal fissures are produced by HTHA. Annealed samples (0 % strain) had an incubation
period followed by a decrease in specific gravity. Steels with 5 % strain had shorter incubation periods and specific
gravity decreased at a more rapid rate. Steels with 39 % strain showed no incubation period at any test temperature,
indicating that fissuring and cracking started immediately upon exposure to hydrogen.
These tests are considered significant in explaining the cracks sometimes found in highly stressed areas of an
otherwise apparently resistant material. In addition, Cherrington and Ciuffreda [25] have emphasized the need for
removing notches (stress concentrators) in hydrogen service equipment.
5.4 Effect of Heat Treatment
Both industry experience and research indicate that PWHT of steels (carbon steels, C-0.5Mo steels and chromium-
molybdenum steels) in hydrogen service improves resistance to HTHA. The PWHT stabilizes alloy carbides. This
reduces the amount of carbon available to combine with hydrogen, thus improving HTHA resistance. Also, PWHT
reduces residual stresses and is, therefore, beneficial for all steels.
Research [4] [13] [17] [18] [26] has shown that certain metal carbides may be more resistant to decomposition in high
temperature hydrogen environments. Creep tests in hydrogen demonstrated the beneficial effect of increased PWHT
on the HTHA resistance of 2.25Cr-1Mo steel [19]. In these tests, 2.25Cr-1Mo steels PWHT’d for 16 hours at 1275 °F

12 API RECOMMENDED PRACTICE 941
(691 °C) showed more resistance to HTHA than the same steels PWHT’d for 24 hours at 1165 °F (630 °C). While
PWHT for longer duration showed some beneficial effect, high PWHT temperatures have a more beneficial effect on
HTHA resistance. Similarly, HTHA resistance of 1Cr-0.5Mo and 1.25Cr-0.5Mo steels is improved by raising the
minimum PWHT temperature to 1250 °F (677 °C) from the 1100 °F (593 °C) minimum required by past additions of
Section VIII of the ASME Code.
The user must balance the advantages of high PWHT temperatures with other factors such as the effect upon
strength and notch toughness.
NOTE Note higher PWHT temperatures can affect the ability to meet ASME Code Class 2 strength requirements, and the strength requirements of enhanced grades of low alloy steels.
Local PWHT bands often do not effectively reach desired temperatures throughout the weldment. In order to improve
the effectiveness of PWHT, the band widths shall be increased as recommended by American Welding Society
(AWS) D10.10 for piping and Welding Research Council (WRC) 452 for vessels. For each PWHT, three different band
widths are specified in these standards, namely soak band, heating band, and gradient control band. The
recommended thermocouple placements in these standards shall also be followed.
5.5 Effect of Stainless Steel Cladding or Weld Overlay
The solubility of hydrogen in austenitic stainless steel is about an order of magnitude greater than for ferritic
steels [27]. The diffusion coefficient of hydrogen through austenitic stainless steel is roughly two orders of magnitude
lower than for ferritic steels [28] [29] [39]. This can result in a significant reduction in the effective hydrogen partial
pressure experienced by the underlying steel below the cladding.
Ferritic or martensitic stainless steel (400 Series) claddings or weld overlays have similar solubilities and diffusivities
than the underlying ferritic steel [39] [41]. As a result, the only reduction in hydrogen partial pressure realized for ferritic
or martensitic cladding is roughly equal to the ratio of the cladding to the base metal as follows:
where
PH2 is the hydrogen partial pressure,
Peff is the effective hydrogen partial pressure,
tbase metal is the thickness of base metal,
tcladding is the thickness of clad/overlay.
A sound metallurgically bonded austenitic stainless steel cladding or weld overlay can significantly reduce the
effective hydrogen partial pressure acting on the base metal. The amount of hydrogen partial pressure reduction
depends upon the materials and the relative thickness of the cladding/weld overlay and the base metal. The thicker
the stainless steel barrier is relative to the base metal, the lower the hydrogen concentration [30] [39]. Archakov and
Grebeshkova [31] mathematically considered how stainless steel corrosion barrier layers increase resistance of
carbon and low alloy steels to HTHA. The calculation for determining the effective hydrogen pressure at the clad/weld
overlay-to-base metal interface is presented in Annex D.
There have been a few instances of HTHA of base metal that was clad or overlayed with austenitic stainless steel. All
of the reported instances involved C-0.5Mo steel base metal. In one case [32], HTHA occurred in a reactor vessel at a
nozzle location where the C-0.5Mo base metal was very thick, relative to the cladding/overlay. Another incident of
HTHA of C-0.5Mo steel occurred under intergranularly cracked Type 304 austenitic stainless steel cladding (see data
point 51U in Annex A). The other cases involved ferritic or martensitic stainless steel cladding.
Peff PH2
tbase metal
tbase metal tcladding +-----------------------------------------
=

STEELS FOR HYDROGEN SERVICE AT ELEVATED TEMPERATURES AND PRESSURES IN PETROLEUM REFINERIES AND PETROCHEMICAL PLANTS 13
It is not advisable to take a credit for the presence of a stainless steel cladding/weld overlay when selecting the base
metal for a new vessel. Some operators have successfully taken credit for the presence of an austenitic stainless
steel cladding/weld overlay for operation when conditions exceeded the Figure 1 curve for the base metal.
Satisfactory performance in such cases requires assurance that the effective hydrogen partial pressure acting on the
base metal be accurately determined and that the integrity of the cladding/weld overlay be maintained. Such
assurance may be difficult to achieve, especially where complex geometries are involved. Many operators take the
presence of an austenitic stainless steel cladding/weld overlay into account when establishing inspection priorities for
HTHA, especially for C-0.5Mo steel equipment.
More background information and details about many of these factors can be found in API TR 941 [39].
6 Inspection for HTHA
6.1 General
The selection of optimum inspection methods and frequencies for HTHA in specific equipment or applications is the
responsibility of the user. The information below and in Annex E, Table E.1 and Table E.2 are intended to assist the
user in making such decisions. The user is also referred to API TR 941, Annex C, “Estimating Damage Rates for Life
Assessment” [39]. This damage rate model may assist in determining inspection needs and prioritization.
Most users do not inspect equipment for HTHA damage unless it has been operated near or above its curve. An
HTHA inspection program should also consider equipment that operates infrequently above its curve (e.g. operations
such as “hot hydrogen stripping” in hydroprocessing reactors and associated piping and equipment). Only a small
number of documented instances of HTHA occurring at conditions below the curves have been reported to API (see
Annex A, Annex B, Annex C, and Annex F). Most of these have involved C-0.5Mo steel [33] or non-PWHT’d carbon
steel [40]. Periodic inspection of C-0.5Mo steel equipment and piping should be considered if operated above the
carbon steel curve, based on factors such as relative position of the operating parameters versus the carbon steel
curve, consequence of failure, presence of cladding, prior heat treatment, etc. Because it is time dependent, existing
C-0.5Mo steel equipment and piping may continue to deteriorate with time, if susceptible. As this equipment and
piping age, the owner should consider increasing the inspection frequency (also see Annex A).
HTHA damage may occur in welds, weld HAZs, or base metal. Even within these specific areas, the degree of
damage may vary widely. Consequently, if damage is suspected, then a thorough inspection means that
representative samples of these areas be examined.
Table E.1 and Table E.2 provide a summary of available methods of inspection for HTHA damage and includes a
discussion of the advantages and limitations of each. While ultrasonic testing (UT) methods, as described in Table
E.1, are the most effective for detecting internal HTHA damage, two or more inspection methods are often used in
combination to overcome the limitations of any single method [34] [35].
HTHA is a difficult inspection challenge. The early stages of attack with fissures, or even small cracks, can be difficult
to detect. The advanced stage of attack, with significant cracking, is much easier to detect, but at that point there is
already a higher likelihood of equipment failure. In addition to attack of the base metal, HTHA has been known to
occur as a very narrow band of intense attack and cracking, running alongside and parallel to welds.
Of all the inspection methods for base metal examination, UT methods have the best chance of detecting HTHA
damage while it’s still in the fissuring stage, prior the onset of significant cracking. Most effective is the use of a
frequency dependent backscatter method in combination with the velocity ratio and spectral analysis techniques.
Backscatter can be used as a first step of inspection and can be used to quantify the depth of damage. Velocity ratio
and spectral analysis are useful for confirmation of backscatter indications. Other methods are capable of detecting
HTHA only after discrete cracks have formed and there is significant degradation of mechanical properties.
For weldment examination where attack can be highly localized, as mentioned above, only two UT methods of
examination are considered effective. High frequency shear wave and angle-beam spectrum analysis techniques

14 API RECOMMENDED PRACTICE 941
should be used to detect HTHA damage in the fissuring stage [36] [37]. Conventional shear wave UT and time of flight
diffraction (TOFD) techniques can be used to try to detect HTHA in the advanced stages, when there is significant
cracking.
When the internal surface is accessible, wet fluorescent magnetic particle testing (WFMT) can be used to find HTHA
damage in the form of surface breaking cracks. Close visual inspection can detect small coin-sized surface blisters,
which can be an indication of the presence of internal HTHA. In situ metallography can be effective in detecting the
early stages of HTHA (decarburization and fissuring) at the surface of the steel as well as differentiating between
HTHA and other forms of cracking. Skill is required for the surface polishing, etching, replication, and microstructural
interpretation. Because in situ metallography only examines a small specific area, other methods should be used to
complement it. It requires access to the surface of interest, and may require removal of a small amount of surface
material from the process side for best results (see Table E.2). One note of caution is that HTHA may be subsurface;
using a surface inspection technique, such as replication or WFMT, may not detect damage. Another is that the
absence of surface blisters does not ensure that internal HTHA is not occurring, since HTHA frequently occurs
without the formation of surface blisters.
6.2 References
Amoco Oil Company, private communication to API Subcommittee on Corrosion, 1960.
A.R. Ciuffreda and W.D. Rowland, “Hydrogen Attack of Steel in Reformer Service,” Proceedings, Vol. 37, API, New
York, pp. 116–128, 1957.
C.A. Zapffe, “Boiler Embrittlement,” Transactions of the ASME, Vol. 66, pp. 81–126, 1944.
R.E. Allen, R.J. Jansen, P.C. Rosenthal, and F.H. Vitovec, “The Rate of Irreversible Hydrogen Attack of Steel at
Elevated Temperatures,” Proceedings, Vol. 41, API, New York, pp. 74–84, 1961.
L.C. Weiner, “Kinetics and Mechanism of Hydrogen Attach of Steel,” Corrosion, Vol. 17, pp. 109–115, 1961.
J.J. Hur, J.K. Deichler, and G.R. Worrell, “Building a Catalytic Reformer,” Oil & Gas Journal, Vol. 54, No. 78, pp.
103–107, Oct. 29, 1956.
F.K. Naumann, “Influence of Alloy Additions to Steel Upon Resistance to Hydrogen Under High Pressure,”
Technische Mitteilungen Krupp, Vol. 1, No. 12, pp. 223–234, 1938.
H.M. Hasegawa and S. Fujinaga, “Attack of Hydrogen on Oil Refinery Steels,” Tetsu To Hagane, Vol. 46, No. 10, pp.
1349–1352, 1960.
T.C. Evans, “Hydrogen Attack on Carbon Steels,” Mechanical Engineering, Vol. 70, pp. 414–416, 1948.
Air Products, Inc., private communication to API Subcommittee on Corrosion, March 1960.
API Refinery Corrosion Committee Survey, 1957.
I. Class, “Present State of Knowledge in Respect to the Properties of Steels Resistant to Hydrogen Under Pressure,”
Stahl and Eisen, Vol. 80, pp. 1117–1135, Aug. 18, 1960.

15
Annex A(informative)
HTHA of 0.5Mo Steels
A.1 General
The purpose of this annex is to provide a brief summary of the information and experience regarding the use of 0.5Mo
(C-0.5Mo and Mn-0.5Mo) steels in elevated temperature and pressure hydrogen service.
Most companies no longer specify C-0.5Mo steel for new or replacement equipment used for operation above the
PWHT’d carbon steel curve in Figure 1 because of the uncertainties regarding its performance after prolonged use.
Since 1970, a series of unfavorable service experiences with C-0.5Mo steels has reduced confidence in the position
of the 0.5Mo curve [40] [41]. In the Second Edition (1977) of this publication, the 0.5Mo curve was lowered
approximately 60 °F (33 °C) to reflect a number of plant experiences that involved HTHA of C-0.5Mo equipment. In
the Fourth Edition (1990) of this publication, the 0.5Mo curve was removed from Figure 1 due to additional cases of
HTHA of C-0.5Mo steel equipment occurring by as much as 200 °F (111 °C) below the curve. At that time, experience
had identified 27 instances of HTHA below the 1977 curve. The operating conditions for these instances are given in
Table A.1 and are plotted on Figure A.1.
No instances of HTHA have been reported using Mn-0.5Mo steel operating below the Figure A.1 0.5Mo curve. The
information and use of this material at elevated temperatures and hydrogen partial pressures are limited.
C-0.5Mo steels vary in their resistance to HTHA. Many heats seem to have resistance at conditions indicated by
the 0.5Mo curve in Figure A.1. However, some heats seem to have HTHA resistance only marginally better than
carbon steel. Published works [41] [42] [43] [44] suggest a correlation between thermal history of the steel and its
resistance to HTHA. Slow-cooled, annealed C-0.5Mo steels have less resistance to HTHA than normalized steels.
The studies have shown that PWHT improves the HTHA resistance of weldments and HAZs for both annealed and
normalized C-0.5Mo steels. However, the base metals of slow-cooled, annealed C-0.5Mo steels show a decrease
in HTHA resistance after PWHT. The initial studies suggest that this is due to free carbon being present in the
ferrite matrix after PWHT. Normalized C-0.5Mo steel base metals, on the other hand, show improvement in HTHA
resistance following tempering or PWHT. Such normalized and PWHT’d C-0.5Mo steel appears to have hydrogen
attack resistance about as indicated by the 0.5Mo curve in the Second Edition (1977) of this publication. Until the
factors controlling the HTHA resistance of C-0.5Mo are better understood, each user should carefully assess the
use of C-0.5Mo steel in services above the PWHT’d carbon steel curve in Figure 1.
Existing C-0.5Mo steel equipment that is operated above the PWHT’d carbon steel curve in Figure 1 should be
inspected to detect HTHA. Owners/operators should evaluate and prioritize for inspection C-0.5Mo equipment
operating above the carbon steel limit—Hattori and Aikawa [45] addressed this issue. The work cited above and plant
experience suggest that important variables to consider in prioritizing equipment for inspection include severity of
operating condition (hydrogen partial pressure and temperature), thermal history of the steel during fabrication,
stress, cold work, and cladding composition and thickness, when present.
To provide a historical summary of the data regarding the use of C-0.5Mo steels, two additional figures are included
here:
a) Figure A.2, which shows the effect of trace alloying elements and molybdenum on PWHT’d carbon steel operating
limits; and
b) Figure A.3, which shows HTHA incubation times for C-0.5Mo steels.
Figure A.2 is from the second edition of this publication (1977) and is a revision of a similar figure from the original
edition (1970). Figure A.2 shows that molybdenum has long been considered to be beneficial to the HTHA resistance

16 API RECOMMENDED PRACTICE 941
Fig
ure
A
.1—
Exp
eri
en
ce w
ith
C-0
.5M
o a
nd
Mn
-0.5
Mo
Ste
el in
Hig
h T
em
pera
ture
Hyd
rog
en
Serv
ice
3000
5000
7000
9000
11,0
00
13,0
00
200
400
300
500
600
700
800
Temperature, °C
2500
2000
1500
1000
500
300
500
400
600
700
800
900
1000
1100
1200
1300
1400
1500
Temperature, °F
Hydro
gen P
art
ial P
ressure
, psia
3.4
56.9
010.3
413.7
917.2
420.7
34.5
48.3
62.1
73.8
Hydro
gen P
art
ial P
ressure
, M
Pa A
bsolu
te
0
Scale
change
Carb
on s
teel (n
on-w
eld
ed o
r w
eld
ed w
ith P
WH
T)
0.5
Mo S
teel
1.2
5C
r-0.5
Mo o
r 1.0
0C
r-0.5
Mo S
teel
1.0
Cr-
0.5
Mo s
teel
1.2
5C
r-0.5
Mo s
teel
Co
pyrig
ht
© 1
96
7 b
y G
.A.
Ne
lso
n.
Pro
du
ctio
n r
igh
ts g
ran
ted
by a
uth
or
to A
PI.
Th
is f
igu
re w
as r
evis
ed
by A
PI
in 1
96
9,
19
83
, 1
99
0,
19
96
, a
nd
20
15
.
Inte
rna
l d
eca
rbu
riza
tio
n
an
d f
issu
rin
g
Inte
rna
l d
eca
rbu
riza
tio
n
an
d f
issu
rin
g
Sa
tisfa
cto
ry
Le
ge
nd
Su
rfa
ce
de
ca
rbu
riza
tio
n
NO
TE
1
Re
fere
nce
s a
nd
co
mm
en
ts a
re s
ho
wn
on
Ta
ble
A.1
.
NO
TE
2
Cu
rve
s f
or
ca
rbo
n s
tee
l, 1
.0C
r-0
.5M
o s
tee
l, a
nd
1.2
5 C
r-0
.5M
o s
tee
l a
re in
clu
de
d f
or
refe
ren
ce
.
NO
TE
3
Th
e s
ym
bo
l
is r
eta
ine
d a
s a
re
fere
nce
ag
ain
st
pre
vio
us e
ditio
ns o
f th
is p
ub
lica
tio
n.
NO
TE
4
Re
fere
nce
nu
mb
ers
are
th
e s
am
e a
s in
pre
vio
us e
ditio
ns o
f th
is p
ub
lica
tio
n.
NO
TE
5
Th
e 0
.5M
o s
tee
l cu
rve
is t
he
sa
me
as t
he
on
e s
ho
wn
in
th
e S
eve
nth
Ed
itio
n o
f th
is p
ub
lica
tio
n (
20
08
).
45
45
43
43
54
46
44
40
65
427
77
7
77
7
7
7
7
1
13
0
30
30
26
31
R
31
R 31
R
31
R7
53
0R
30
R
34
P1
78
R
78
R7
7R
77
R
77
R
7
27
50
27
52
18
O
50
.00
53
53
40
1
1
1
1
13
6
60
54
55565
72
72
8
27
35
37
61
29
51

STEELS FOR HYDROGEN SERVICE AT ELEVATED TEMPERATURES AND PRESSURES IN PETROLEUM REFINERIES AND PETROCHEMICAL PLANTS 17
of steels. The data in Figure A.3 should be used with caution, since some heats of C-0.5Mo steels have suffered
HTHA during exposure to conditions under the lower solid curve (equivalent to the C-0.5Mo curve of Figure A.1). The
data for the instances of HTHA listed in Table A.1 and plotted on Figure A.1 are also shown for reference in
Figure A.3. In these cases, the service life at the time the attack was detected was less than the incubation time
indicated by the curves, which, of course, is not possible.
A.2 References
R.D. Merrick and A.R. Ciuffreda, “Hydrogen Attack of Carbon-0.5-Molybdenum Steels,” 1982 Proceedings, Refining
Department, Vol. 61, API, Washington, DC, pp. 101–114.
M.C. Maggard, “Detecting Internal Hydrogen Attack,” Oil & Gas Journal, pp. 90–94, Mar. 10, 1980.
K. Ishii, K. Maeda, R. Chiba, and K. Ohnishi, “Intergranular Cracking of C-0.5Mo Steel in a Hydrogen Environment at
Elevated Temperatures and Pressures,” 1984 Proceedings, Refining Department, Vol. 63, API, Washington, DC,
pp. 55–64.
R. Chiba, K. Ohnishi, K. Ishii, and K. Maeda, “Effect of Heat Treatment on the Resistance of C-0.5Mo Steel Base
Metal and Its Welds to Hydrogen Attack,” 1985 Proceedings, Refining Department, Vol. 64, API, Washington, DC,
pp. 57–74.
T. Ishiguro, K. Kimura, T. Hatakeyama, T. Tahara, and K. Kawano, “Effect of Metallurgical Factors on Hydrogen Attack
Resistance in C-0.5Mo,” presented at the Second International Conference on Interaction with Hydrogen in Petroleum
Industry Pressure Vessel and Pipeline Service, Materials Properties Council, Vienna, Austria, Oct. 19–21, 1994.
K. Hattori and S. Aikawa, “Scheduling and Planning Inspection of C-0.5Mo Equipment Using the New Hydrogen
Attack Tendency Chart,” PVP-Vol. 239/MPC-Vol. 33, Serviceability of Petroleum Process and Power Equipment,
ASME, 1992.
A.3 References and Comments for Figure A.1
NOTE The data in Figure A.1 are labeled with the reference numbers corresponding to the sources listed below. The letters in the figure correspond to the comments listed on this page.
A.3.1 References
1) Shell Oil Company, private communication to API Subcommittee on Corrosion.
7) Standard Oil Company of California, private communication to API Subcommittee on Corrosion.
18) Union Oil Company of California, private communication to API Subcommittee on Corrosion, 1980.
27) Union Oil Company of California, private communication to API Subcommittee on Corrosion, 1976.
28) Amoco Oil Company, private communication to API Subcommittee on Corrosion, 1976.
29) Standard Oil Company of California, private communication to API Subcommittee on Corrosion, 1976.
30) Exxon Corporation, private communication to API Subcommittee on Corrosion, 1976.
31) Shell Oil Company, private communication to API Subcommittee on Corrosion, 1976.
32) Cities Service Company, private communication to API Subcommittee on Corrosion, 1976.

18 API RECOMMENDED PRACTICE 941
34) Koch Refining Company, private communication to API Subcommittee on Corrosion, 1980.
36) ATexaco Incorporated, private communication to API Subcommittee on Corrosion, 1980.
37) BExxon Corporation, private communication to API Subcommittee on Corrosion, 1979.
38) CExxon Corporation.
39) DExxon Corporation.
41) FCaltex Petroleum Corporation, private communication to API Subcommittee on Corrosion, 1980.
42) GGetty Oil Company.
43) HGetty Oil Company.
44) ICaltex Petroleum Corporation, private communication to API Subcommittee on Corrosion and Materials
Engineering, 1984.
45) JJGC Corporation/Japan Steel Works, API Midyear Refining Meeting, 1984.
46) K,EJGC Corporation/Japan Steel Works, Exxon Corporation.
47) LJGC Corporation/Japan Steel Works, API Midyear Refining Meeting, 1985.
48) MAir Products & Chemicals, Inc., private communication to API Subcommittee on Corrosion and Materials
Engineering, 1985.
49) STexaco USA, API Fall Refining Meeting, 1985.
50) TMobil R&D Corporation, private communication to API Subcommittee on Corrosion and Materials Engineering,
1986.
51) UShell Oil Company, private communication to API Subcommittee on Materials Engineering and Inspection,
1987.
52) VTexaco, Inc., private communication to API Subcommittee on Corrosion, 1981.
53) Kemira, B. V., private communication to API Subcommittee on Materials Engineerings and Inspection, 1986.
54) AAChevron Research and Technology Company, private communication to API Subcommittee on Corrosion and
Materials, June 1992.
55) BBChevron Research and Technology Company, private communication to API Subcommittee on Corrosion and
Materials, June 1992.
56) CCChevron Research and Technology Company, private communication to API Subcommittee on Corrosion and
Materials, June 1992.
57) DDChevron Research and Technology Company, private communication to API Subcommittee on Corrosion and
Materials, June 1992.
58) EEChevron Research and Technology Company, private communication to API Subcommittee on Corrosion and
Materials, June 1992.

STEELS FOR HYDROGEN SERVICE AT ELEVATED TEMPERATURES AND PRESSURES IN PETROLEUM REFINERIES AND PETROCHEMICAL PLANTS 19
59) FFChevron Research and Technology Company, private communication to API Subcommittee on Corrosion and
Materials, June 1992.
60) GGChevron Research and Technology Company, private communication to API Subcommittee on Corrosion and
Materials, June 1992.
61) HHChevron Research and Technology Company, private communication to API Subcommittee on Corrosion and
Materials, June 1992.
62) IIChevron Research and Technology Company, private communication to API Subcommittee on Corrosion and
Materials, June 1992.
63) JJTosco, private communication to API Subcommittee on Corrosion and Materials, April 1993.
64) KKTosco, private communication to API Subcommittee on Corrosion and Materials, April 1993.
65) LLExxon report: “Hydrogen Attack of Gofiner Reactor Inlet Nozzle,” 1988.
A.3.2 Comments
A) Feed line pipe leaked; isolated areas damaged. Blistered, decarburized, fissured; PWHT’d at 1100 °F to 1350 °F.
B) Effluent line, pipe and HAZ, isolated areas damaged; no PWHT.
C) Weld and pipe, isolated areas damaged; no PWHT.
D) Effluent line; weld, isolated areas damaged; PWHT.
E) Feed line; weld and HAZ, isolated areas damaged; PWHT.
F) Feed/effluent exchanger nozzle-to-shell weld, cracks in welds and in exchanger tubes.
G) Effluent exchanger channel; welds, plate, and HAZ, isolated areas damaged; PWHT.
H) Effluent exchanger channel; welds, plate, and HAZ, isolated areas damaged; PWHT’d at 1100 °F.
I) Catalytic reformer, combined feed/effluent exchanger shell; plate; PWHT’d at 1250 °F.
J) Hydrodesulfurization unit effluent exchanger channel head and shell plate. (Hydrocarbon feed to unit and makeup
hydrogen from ethylene unit.)
K) Catalytic reformer combined feed piping; welds and base metal; PWHT.
L) Gas-oil hydrodesulfurization unit. Elbow cracked intergranularly and decarburized at fusion line between weld
metal and HAZ; no PWHT.
M) Ammonia plant converter; exit piping; intergranular cracking and internal decarburization of pipe.
P) Hydrodesulfurization unit hydrogen preheat exchanger shell; blisters, intergranular fissuring, and decarburization
in weld metal; PWHT’d at 1150 °F.
Q) Attack of heat exchanger tubing in tubesheet.
R) Stainless steel cladding on 0.5Mo steel; no known HTHA.

20 API RECOMMENDED PRACTICE 941
S) Decarburization and fissuring of weld metal; PWHT’d at 1150 °F.
T) Forged tubesheet cracked with surface decarburization; tubes blistered.
U) Hydrodesulfurization unit, C-0.5Mo steel exchanger tubesheet; decarburized, fissured, and cracked under
intergranularly cracked ASTM Type 304 cladding.
V) Hydrocracker charge exchanger liquid with a small amount of hydrogen; C-0.5Mo with Type 410S rolled bond
clad. Extensive blistering and fissuring under clad.
W) C-0.5Mo steel piping in ammonia plant syngas loop; decarburized and fissured.
AA) Blistering and fissuring of a flange.
BB) HAZ and base metal fissuring of pipe.
CC) Base metal fissuring and surface blistering in heat exchanger shell.
DD) Attack at weld, HAZ and base material in piping.
EE) Localized attack in weld, HAZ in piping.
FF) Base metal attack in piping.
GG) Base metal attack in a heat exchanger channel.
HH) Base metal attack in piping.
II) Blistering and base metal attack in a heat exchanger shell.
JJ) Base metal attack in a TP405 roll bond clad vessel.
KK) Base metal attack in a TP405 roll bond clad vessel.
LL) Attack in nozzle attachment area of a vessel weld overlaid with Type 309Nb.
MM) Internal decarburization/fissuring of piping in a hydrocracker unit after 235,000 hours of service.

STEELS FOR HYDROGEN SERVICE AT ELEVATED TEMPERATURES AND PRESSURES IN PETROLEUM REFINERIES AND PETROCHEMICAL PLANTS 21
Table A.1—Operating Conditions for C-0.5Mo Steels That Experienced High Temperature
Hydrogen Attack Below the 0.5Mo Steel Curve in Figure A.1
PointTemperature
Hydrogen Partial Pressure (Absolute) Service Hours
(Approximate)
Degrees Below 0.5Mo Curve (Approximate)
°F °C psi MPa °F °C
36A a 790 421 350 2.41 80,000 20 11
37B a 800 427 285 1.97 57,000 30 17
38C a 640 338 270 1.86 83,000 180 100
39D a 700 371 300 2.07 96,000 125 69
41F a 760 404 375 2.59 85,000 40 22
42G a 750 399 350 2.41 150,000 60 33
43H a 625 329 350 2.41 150,000 185 103
44I a 730 b 388 b 313 2.16 116,000 90 50
45J c 620/640 327/338 457 3.15 70,000 167/147 93/82
46K a 626/680 330/360 350 2.41 131,000 184/130 102/72
47L c 684 b 362 738 5.09 61,000 54 30
48M e 550/570 288/299 1060/1100 7.31/7.59 79,000 125/105 69/58
f 655/670 346/354 — — 17,500 20/5 11/3
49S c 750/770 399/410 390 2.69 67,000 50/30 28/17
f 650 343 — — 163,000 150 83
51U c 690 366 397 2.74 — 100 56
53W e 545 285 2190 15.1 140,000 45 25
54AA a 725/760 385/404 300/380 2.07/2.62 105,000 40/100 22/56
55BB a 800/850 427/454 175/190 1.21/1.31 124,000 80/30 44/17
56CC a 810/825 432/441 275/300 1.90/2.07 223,000 15/0 8/0
57DD a 850 d 454 d 225 d 1.55 d 158,000 10 6
58EE a 810/855 432/457 170 1.17 138,000 70/25 39/14
59FF c 550/600 288/316 2000 13.79 210,000 50/0 28/0
60GG c 550/600 288/316 2000 13.79 210,000 50/0 28/0
61HH c 530/600 277/316 2200 15.17 210,000 60/0 33/0
62II c 670/700 354/371 190 1.31 192,000 180/150 100/83
63JJ c 600/750 316/399 500 3.45 235,000 180/30 100/17
64KK c 600/770 316/410 525 3.62 283,000 170/0 94/0
65LL c 775 413 550 3.79 — 0 0
NOTE Numbers and letters in the first column (labeled “Point”) refer to references and comments for Figure A.1. Where two numbers are given, the first number represents average operating conditions while the second number represents maximum operating conditions.
a Catalytic reformer service.
b Average.
c Hydrodesulfurizer service.
d Maximum.
e Ammonia plant.
f API task group currently resolving these points.

22 API RECOMMENDED PRACTICE 941
A.4 References for Figure A.2
The data in Figure A.2 are labeled with the reference numbers corresponding to the sources listed in Table A.2.
Figure A.2—Steels in High Temperature Hydrogen Service Showing Effect
of Molybdenum and Trace Alloying Elements
200
Carbon steel(non-welded or
welded with PWHT)
0.1Mo steel
0.25Mo steel
0.5Mo steel
300
9
9
9
9 8816
1014
14
1414
14
13
13 12
2
3
1 1
411
13
14
15
9
8
8
88
99 9
917
6
1
1
8(1400)
7
400 500
Hydrogen Partial Pressure, psia
Legend
00.01–0.10
0.11–0.20
0.21–0.30
0.31–0.40
0.41–0.50
0.51–0.60
Equivalentmolybdenumcontent
Satisfactory
HTHA
300
400
Tem
pe
ratu
re, °C
Tem
pe
ratu
re, °F
500
600 700 800 900 1000100
1.38 2.07 2.76 3.45 4.14
Hydrogen Partial Pressure, MPa Absolute
4.83 5.52 6.21 6.9014
500
600
700
800
900
1000
NOTE 1 Mo has four times the resistance of Cr to HTHA.
NOTE 2 Mo is equivalent to V, Ti, or Nb up to 0.1 %.
NOTE 3 Si, Ni, and Cu do not increase resistence.
NOTE 4 P and S decrease resistance.

STEELS FOR HYDROGEN SERVICE AT ELEVATED TEMPERATURES AND PRESSURES IN PETROLEUM REFINERIES AND PETROCHEMICAL PLANTS 23
Figure A.3—Incubation Time for High Temperature Hydrogen Attack Damage of 0.5Mo Steels in High
Temperature Hydrogen Service
6059
61
<100 CSatisfactoryHTHA
Legend 500
400
300
<8500 C
100 Hours
400 Hours
1000 Hours10,000 Hours53
H
A
AA47
4241
6536555856
57E
E
ED D
100B
E
G 37
<18,000 F
<18,000 F<34,000 A
<26,000 A
<39,000 E
45
39
5444
6238
48
63 6448
4649
51A
AA <37,000 J
<3700 K
E
No attack
0 500
500
600
700
Te
mp
era
ture
, °F
Te
mp
era
ture
, °C800
900
1000
1000 1500 2000 2500Hydrogen Partial Pressure, psia
Hydrogen Partial Pressure, MPa absolute
3000 3500 45004000
0 3.45 6.90 10.34 13.79 17.24 20.68 24.13 31.027.58
E

24 API RECOMMENDED PRACTICE 941
Table A.2—References Along with Chromium, Molybdenum, Vanadium and
Molybdenum Equivalent Values for Figure A.2
No. ReferenceAnalysis Mo
Equiv.Cr Mo V
1 Shell Oil Company a 0.50 0.50
2 Weld Deposits, D.J. Bergman a 0.79 0.39 0.59
3 Weld Deposits, D.J. Bergman a 0.80 0.15 0.35
4 Weld Deposits, D.J. Bergman a 0.50 0.25 0.37
5 Continental Oil Company a 0.25 0.25
6 Standard Oil Co. of California a 0.27 0.27
7 Standard Oil Co. of California a 0.05 0.06 0.08
8 A.O. Smith Corp. a 0.13 to 0.18 0.11
9 Shell Development Co., Drawing No. VT 659-2
10 Amoco Oil Company a 0.04 0.01
11 R.W. Manuel, Corrosion, 17(9), pp. 103–104, Sept. 1961 0.27 0.15 0.22
12 The Standard Oil Co. of Ohio a 0.11 0.43 0.50
13 Exxon Corporation a
14 Union Oil of California a
15 Amoco Oil Company a
16 Standard Oil Co. of California a
17 Gulf Oil Corporation a
a Private communication to Subcommittee on Corrosion (now Subcommittee on Corrosion and Materials).

25
Annex B(informative)
HTHA of 1.25 Cr-0.5Mo Steel
The purpose of this annex is to provide a brief summary of the information and experience regarding three case
histories with HTHA of 1.25Cr-0.5Mo steel.
Experiences with HTHA are listed in Table B.1 and the operating conditions are plotted in Figure B.1.
Cases A and B were reported by Chiyoda Corporation in Japan. Case C was originally reported by Merrick and
Maguire of Exxon [7]. The mechanisms of attack were similar in Cases B and C. That is, damage was in the form of
internal blistering with decarburization and intergranular cracking from the edges of the blisters. In Case A, however,
attack resulted in intergranular separation. All three steels had chromium contents near 1.1 %, near the 1.0 % lower
limit for 1.25Cr-0.5Mo steels. Additionally, the Case A steel had a relatively high impurity content with an X-bar equal
to 31.5, as defined by Bruscato [38].
Table B.1—Experience with HTHA of 1.25Cr-0.5Mo Steel at Operating Conditions Below the Figure 1 Curve
CaseTemperature
Hydrogen Partial Pressure (Absolute) Service
YearsDescription
°F °C psi MPa
A 960 516 331 2.28 26
1.5 NPS Schedule 80 nozzle was broken off a catalytic reformer outlet line during a shutdown. Metallography indicated surface decarburization and intergranular cracking with bubbles. Cr content was 1.09 %.
B 977 525 354 2.44 14
Blistering was detected with ultrasonic examination in catalytic reformer piping. Metallography indicated surface decarburization and blistering at nonmetallic inclusions, with intergranular cracks growing from the blisters. Cr content was 1.10 %.
C 957/982 514/528 294/408 2.03/2.81 16
Blistering near pipe inner surface. Examination showed decarburization between the inner surface and the blister. Gas analysis indicated methane in the blister. Cr content was 1.12 %.
See Note See Note See Note See Note
NOTE Average conditions are reported as the left number. Maximum condition reported as the right number.

26 API RECOMMENDED PRACTICE 941
Figure B.1—Operating Conditions for 1.25Cr-0.5Mo Steels That Experienced High Temperature Hydrogen
Attack Below the Figure 1 Curve
1000 200 300 400 500 600 700 800400
900
1000
1100
1200
700
600
500
800
Hydrogen Partial Pressure, psia
700
300
400
200
600
500
3.452.762.071.380.69 4.14 4.83 5.52
Case B
Case C
1.25Cr-0.5Mo steel
1.00Cr-0.5Mo steel
Case A
Hydrogen Partial Pressure, MPa Absolute
Carbon steel (non-welded or welded with PWHT)

27
Annex C(informative)
HTHA of 2.25Cr-1Mo Steel
The purpose of this annex is to provide a brief summary of experience regarding a case history 5 with HTHA of
2.25Cr-1Mo steel.
A recent experience with HTHA is described in Table C.1. This case history may indicate that highly stressed
components can suffer HTHA at conditions below the curve in Figure 1. In this case history, a mixing tee was believed
to be highly stressed by thermal stresses due to the mixing of hot and cooler hydrogen. Figure C.1 plots the operating
conditions of both the hot upstream hydrogen and the mixed hydrogen downstream of the tee.
5 Communication to the API Subcommittee on Corrosion and Materials from Exxon Research and Engineering, August 1995.
Table C.1—Experience with High Temperature Hydrogen Attack of 2.25Cr-1Mo Steel
at Operating Conditions Below the Figure 1 Curve
TemperatureHydrogen Partial
Pressure (Absolute)Time in Service Years
Description
°F °C psi MPa
675/820 357/438 1385/1570 9.54/10.82 >20
A mixing tee for the hot and cold makeup hydrogen to a hydroprocessing unit leaked near the weld to the downstream piping. SEM examination indicated decarburization and fissuring along the internal surface of the tee.
See Note See Note See Note See Note
Although the leak path was not positively identified, it was concluded to be most likely due to fine, interconnected fissures. Some thermal fatigue cracking was also identified in the tee. Piping downstream of the tee was also found to have fissuring and internal decarburization to a depth of about 3.90 mils (0.1 mm) along the inside surface. The hot, upstream piping was not found to be attacked.
NOTE Average conditions are reported as first number. Maximum condition reported as second number.

28 API RECOMMENDED PRACTICE 941
Figure C.1—Operating Conditions of 2.25Cr-1Mo Steels That Experienced High Temperature Hydrogen
Attack Below the Figure 1 Curve
1500
1400
1300
1200
1100
1000
800
900
700
600
500
400
300
3.45 6.90 10.34 13.79 17.24
700
600
500
400
300
200
Hydrogen Partial Pressure, MPa Absolute
0 500 1000 1500 2000 2500
1.0Cr-0.5Mo steel
Hydrogen Partial Pressure, psia
2.25Cr-1.0Mo steel
1.25Cr-0.5Mo steelor 1.0Cr-0.5Mo steel
Carbon steel (non-welded or welded with PWHT)
1.25Cr-0.5Mo steel
Operating window of 2.25Cr-1.0Mo
attacked
Operating window of 2.25Cr-1.0Mo piping upstream attacked

29
Annex D(informative)
Effective Pressures of Hydrogen in Steel Covered by Clad/Overlay
The purpose of this annex is to provide a method for determining the effective pressure at the clad/overlay-to-base
metal interface. More details and information (such as data for solubility and diffusivity for various alloys) can be
obtained in the technical basis document [39].
Very low diffusivity of hydrogen in stainless clad or overlay materials used for corrosion protection results in an
effective pressure of hydrogen at the clad/overlay-to-base metal interface (bond line) that is lower than that of the
process stream. This effective pressure is calculated as follows.
(D.1)
The maximum steady state hydrogen concentration in the base metal without a stainless steel clad or overlay is given
by:
(D.2)
The maximum steady state hydrogen concentration in the base metal with a stainless steel clad or overlay is given by:
(D.3)
The ratio of the of the hydrogen concentration in the base metal without and with a cladding is then given by:
(D.4)
The effective hydrogen partial pressure for a wall with an intact clad or overlay is therefore given by:
(D.5)
where
PH2 is the hydrogen partial pressure in operating environment;
PH2, effective is the effective hydrogen pressure at the clad/overlay-to-base metal interface;
DC, DB is the diffusivities of hydrogen in clad/overlay and base metal, respectively;
XC, XB is the thicknesses of clad/overlay and base metal, respectively;
KC, KB is the solubility of hydrogen in clad/overlay and base metal at 1 psi hydrogen partial pressure,
respectively.
NOTE Terms are dependent on temperature and must be expressed in appropriate units.
CB, without clad KB PH2=
CB, with clad
KC PH2
1 Z+-------------------=
ZDBXCKB
DCXBKC
--------------------=
RCB, without clad
CB, with clad
---------------------------1
1 Z+------------+=
PH2, effective
1
1 Z+( )2
-------------------=

30
Annex E(informative)
Summary of Inspection Methods

STEELS FOR HYDROGEN SERVICE AT ELEVATED TEMPERATURES AND PRESSURES IN PETROLEUM REFINERIES AND PETROCHEMICAL PLANTS 31Tab
le E
.1—
Su
mm
ary
of
Ult
raso
nic
In
sp
ecti
on
Meth
od
s f
or
Hig
h T
em
pera
ture
Hyd
rog
en
Att
ack
Ult
raso
nic
Meth
od
s
Velo
cit
y R
ati
oA
tten
uati
on
Sp
ectr
al
An
aly
sis
Backscatt
er
Co
nven
tio
nal
Sh
ear
Wave
UT
an
d T
OF
D
Hig
h
Fre
qu
en
cy
Sh
ear
Wave
An
gle
-beam
S
pectr
um
A
naly
sis
Am
plitu
de
Based
Patt
ern
R
eco
gn
itio
nS
pati
al
Avera
gin
gD
irecti
on
al
Dep
en
den
ce
Fre
qu
en
cy
Dep
en
den
ce
Description
Ratio
of shear
and lo
ngitu
din
al
wave v
elo
city
is
measure
d.
HT
HA
changes
the r
atio
.
Dis
pers
ion o
f ultr
asonic
shear
wave is
m
easure
d b
y
record
ing d
rop
in a
mplit
ude o
f m
ulti
ple
echoes.
HT
HA
incre
ases
attenuatio
n.
The first
backw
all
sig
nal
is a
naly
zed in
te
rms o
f am
plit
ude
vers
us
frequency.
H
TH
A w
ill
attenuate
hig
h
frequency
response m
ore
th
an lo
w
frequencie
s.
Hig
h fre
quency
ultr
asonic
w
aves
backscattere
d
from
with
in the
meta
l are
m
easure
d.
HT
HA
can
incre
ase
backscatter
sig
nal
am
plit
ude.
Hig
h fre
quency
ultr
asonic
w
aves
backscattere
d
from
with
in the
meta
l are
analy
zed. H
TH
A
causes a
ris
e
and fall
in
backscatter
pattern
.
Backscatter
data
are
colle
cte
d o
ver
an a
rea
scanned. T
he
sig
nal i
s
avera
ged to
negate
gra
in
nois
e.
Com
pare
s
backscatter
sig
nal a
s taken
from
ID
and O
D
directio
ns.
HT
HA
dam
aged
mate
rial w
ill
show
a s
hift
in
indic
ate
d
dam
age
tow
ard
s the
exposed s
urf
ace
(ID
).
Com
pare
s
backscatter
of
two d
iffere
nt
frequency
transducers
. H
TH
A d
am
aged
mate
rial w
ill
show
a s
hift
and
spre
ad o
f backscatter
in
time.
Routin
ely
used
for
cra
ck
dete
ctio
n a
t w
eld
ments
. H
igher
frequencie
s
incre
ase
dete
ctio
n
capabili
ty. T
OF
D
is a
develo
pin
g
technolo
gy.
Hig
h fre
quency
(10 M
Hz o
r hig
her)
shear
waves o
pera
ted
in p
uls
e-e
cho
mode for
dete
ctio
n o
f H
TH
A in
w
eld
ments
/H
AZ
. R
equires
use o
f fo
cused
beam
to in
spect
thic
k v
essels
.
The s
pectr
um
of
any s
uspect
sig
nal f
rom
puls
e-e
cho
inspectio
n o
f w
eld
/HA
Z is
com
pare
d w
ith a
re
fere
nce
spectr
um
taken
in the p
itch-
catc
h m
ode
from
the b
ase
meta
l. H
TH
A
causes the
puls
e-e
cho
spectr
um
to
incre
ase
am
plit
ude w
ith
incre
ase o
f fr
equency.
Dete
ction c
apabili
tyH
as b
een
show
n to d
ete
ct
HT
HA
fis
sure
s
in b
ase m
eta
l aw
ay fro
m
weld
ments
. Can
diff
ere
ntia
te
betw
een H
TH
A
dam
age a
nd
pla
te
lam
inations.
Has b
een
show
n to d
ete
ct
HT
HA
fis
sure
s
in b
ase m
eta
l aw
ay fro
m
weld
ments
.
Has b
een
show
n to d
ete
ct
HT
HA
fis
sure
s
in b
ase m
eta
l aw
ay fro
m
weld
ments
.
Has b
een
show
n to d
ete
ct
HT
HA
fis
sure
s
in b
ase m
eta
l aw
ay fro
m
weld
ments
.
Has b
een
show
n to d
ete
ct
HT
HA
fis
sure
s
in b
ase m
eta
l and w
eld
meta
l.
Has b
een
show
n to d
ete
ct
HT
HA
fis
sure
s
in b
ase m
eta
l and w
eld
meta
l.
Has b
een
show
n to d
ete
ct
HT
HA
fis
sure
s
in b
ase m
eta
l and w
eld
meta
l.
Has b
een
show
n to d
ete
ct
HT
HA
fis
sure
s
in b
ase m
eta
l and w
eld
meta
l.
Can r
elia
bly
dete
ct H
TH
A
only
after cra
cks
have form
ed.
Cannot dete
ct
HT
HA
fis
sure
s.
Has b
een
show
n to d
ete
ct
HT
HA
fis
sure
s
in w
eld
HA
Z.
Has b
een
show
n to d
ete
ct
HT
HA
fis
sure
s
in w
eld
HA
Z.
Advanta
ges
Not affecte
d b
y
inclu
sio
ns, gra
in
siz
e, or
surf
ace
roughness, or
curv
atu
re. N
o
prior
inspectio
n
his
tory
needed
for
inte
rpre
tatio
n.
Sim
ple
to u
se.
Very
sensiti
ve to
in
tern
al f
issuring
due to H
TH
A.
Can b
e u
sed to
diff
ere
ntia
te
betw
een
inclu
sio
ns a
nd
HT
HA
dam
age.
Very
sensitiv
e to
in
tern
al f
issuring
due to H
TH
A.
Can b
e u
sed for
scannin
g. C
an
giv
e a
n
indic
atio
n o
f depth
of H
TH
A.
Can b
e
auto
mate
d in
eith
er
a B
-scan
or
C-s
can
mode. C
an b
e
used to m
onito
r changes in
exte
nt of
dam
age.
Very
sensiti
ve to
in
tern
al f
issuring
due to H
TH
A.
Can b
e u
sed for
scannin
g. C
an
giv
e a
n
indic
atio
n o
f depth
of H
TH
A.
Can d
iffere
ntia
te
betw
een H
TH
A
dam
age a
nd
inclu
sio
ns.
Sensiti
ve to
inte
rnal f
issuring
due to H
TH
A.
Can b
e u
sed to
impro
ve
dete
ctio
n o
f fis
suring s
tages
of H
TH
A a
nd to
dete
rmin
e d
epth
of dam
age.
Very
sensiti
ve to
in
tern
al f
issuring
due to H
TH
A.
Can b
e u
sed to
diff
ere
ntia
te
betw
een H
TH
A
dam
age a
nd
oth
er
inte
rnal
defe
cts
such a
s
inclu
sio
ns.
Very
sensiti
ve to
in
tern
al f
issuring
due to H
TH
A.
Can b
e u
sed to
diff
ere
ntia
te
betw
een H
TH
A
dam
age a
nd
oth
er
inte
rnal
defe
cts
such a
s
inclu
sio
ns.
Can s
can full
covera
ge o
f w
eld
ments
fro
m
the O
D.
Can s
can full
covera
ge o
f w
eld
ments
fro
m
the O
D. V
ery
sensiti
ve to
inte
rnal f
issuring
due to H
TH
A.
Can b
e u
sed to
diff
ere
ntia
te
betw
een H
TH
A
dam
age a
nd
weld
ing d
efe
cts
and in
clu
sio
ns.
Can b
e u
sed for
scannin
g. C
an
giv
e a
n
indic
atio
n o
f depth
of H
TH
A.
Can b
e
auto
mate
d in
eith
er
a B
-scan
or
C-s
can
mode. C
an b
e
used to m
onito
r changes in
exte
nt of
dam
age.
Can s
can full
covera
ge o
f w
eld
ments
fro
m
the O
D. V
ery
sensiti
ve to
inte
rnal f
issuring
due to H
TH
A.
Can b
e u
sed to
diff
ere
ntia
te
betw
een H
TH
A
dam
age a
nd
weld
ing d
efe
cts
and in
clu
sio
ns.

32 API RECOMMENDED PRACTICE 941
Lim
itations
Covers
only
lo
cal s
pot w
here
pro
be is
held
. C
annot be u
sed
for
scannin
g
larg
e a
reas.
Cannot dete
ct
HT
HA
dam
age
that is
less than
10 %
thro
ugh
wall.
Cla
ddin
g
can c
ause fals
e
inte
rpre
tatio
n if
in
clu
ded in
velo
city
m
easure
ment.
Covers
only
lo
cal s
pot w
here
pro
be is
held
. C
annot be u
sed
for
scannin
g. ID
or
OD
surf
ace
corr
osio
n c
an
giv
e fals
e
readin
gs. N
eeds
para
llel
surf
aces. T
hic
k
mate
rials
decre
ase
sensiti
vity
. D
iffic
ult
to g
et
sim
ilar
repeat
readin
gs w
hen
used a
s a
m
onito
ring
pro
gra
m.
Techniq
ue is
best w
hen u
sed
as a
com
parison
of a c
lean n
on-
HT
HA
are
a
vers
us a
suspect are
a.
Inclu
sio
ns, l
arg
e
gra
ins, ID
pitt
ing, la
min
ar
defe
cts
, or scale
can g
ive fals
e
indic
atio
ns o
f H
TH
A. D
am
age
from
HT
HA
attenuate
s
backscatter
sig
nal,
whic
h
can c
ause fals
e
inte
rpre
tatio
ns in
siz
ing a
nd
chara
cte
rizin
g
the fla
w.
Not a p
rim
ary
m
eth
od,
usually
a
com
ple
menta
ry
meth
od.
Requires
access to b
oth
ID
and O
D
surf
aces. D
oes
not w
ork
well
on
cla
d e
quip
ment.
Not a p
rim
ary
m
eth
od,
usually
a
com
ple
menta
ry
meth
od. D
oes
not w
ork
well
on
very
shallo
w
HT
HA
dam
age.
Cannot dete
ct
HT
HA
fis
sure
s.
Can o
nly
dete
ct
HT
HA
cra
cks.
Actu
al c
rack
siz
ing c
an b
e
diff
icult.
Accura
tely
siz
ing the d
epth
of H
TH
A
fissure
s in
weld
H
AZ
may b
e
diff
icult.
Recom
mendatio
ns
Recom
mended
for
base m
eta
l H
TH
A d
ete
ctio
n
when 1
) advanced
HT
HA
dam
age
is s
uggeste
d b
y
the r
esults
of
oth
er
meth
ods
or
2)
used a
s a
com
ple
menta
ry
techniq
ue w
ith a
backscatter
meth
od.
Not
recom
mended
for
HT
HA
in
spectio
n.
Used a
s a
com
ple
menta
ry
techniq
ue a
fter
backscatter
meth
od
indic
ate
s
possib
le
dam
age.
Recom
mended
only
when u
sed
with
oth
er
techniq
ues.
Should
be
limite
d to the
initi
al s
cre
enin
g.
Recom
mended
only
when u
sed
with
oth
er
techniq
ues a
s
the first ste
p o
f in
spectio
n.
Used a
s a
com
ple
menta
ry
techniq
ue w
hen
depth
of
dam
age c
annot
be c
learly
identif
ied.
Used a
s a
com
ple
menta
ry
techniq
ue a
fter
backscatter
pattern
re
cogniti
on
techniq
ue
indic
ate
s
possib
le
dam
age.
Used a
s a
com
ple
menta
ry
techniq
ue a
fter
backscatter
pattern
re
cogniti
on
techniq
ue
indic
ate
s
possib
le
dam
age.
Not
recom
mended
for
HT
HA
in
spectio
n to
dete
ct fis
sure
s.
Can b
e u
sed to
dete
ct
develo
ped
cra
cks.
Recom
mended
for
dete
ctio
n
and s
izin
g o
f lo
caliz
ed H
TH
A
in w
eld
/HA
Z.
Recom
mended
as a
com
ple
menta
ry
techniq
ue a
fter
hig
h fre
quency
shear
wave
indic
ate
s
possib
le
dam
age.
Tab
le E
.1—
Su
mm
ary
of
Ult
raso
nic
In
sp
ecti
on
Meth
od
s f
or
Hig
h T
em
pera
ture
Hyd
rog
en
Att
ack (
Co
nti
nu
ed
)
Ult
raso
nic
Meth
od
s
Velo
cit
y R
ati
oA
tten
uati
on
Sp
ectr
al
An
aly
sis
Backscatt
er
Co
nven
tio
nal
Sh
ear
Wave
UT
an
d T
OF
D
Hig
h
Fre
qu
en
cy
Sh
ear
Wave
An
gle
-beam
S
pectr
um
A
naly
sis
Am
plitu
de
Based
Patt
ern
R
eco
gn
itio
nS
pati
al
Avera
gin
gD
irecti
on
al
Dep
en
den
ce
Fre
qu
en
cy
Dep
en
den
ce
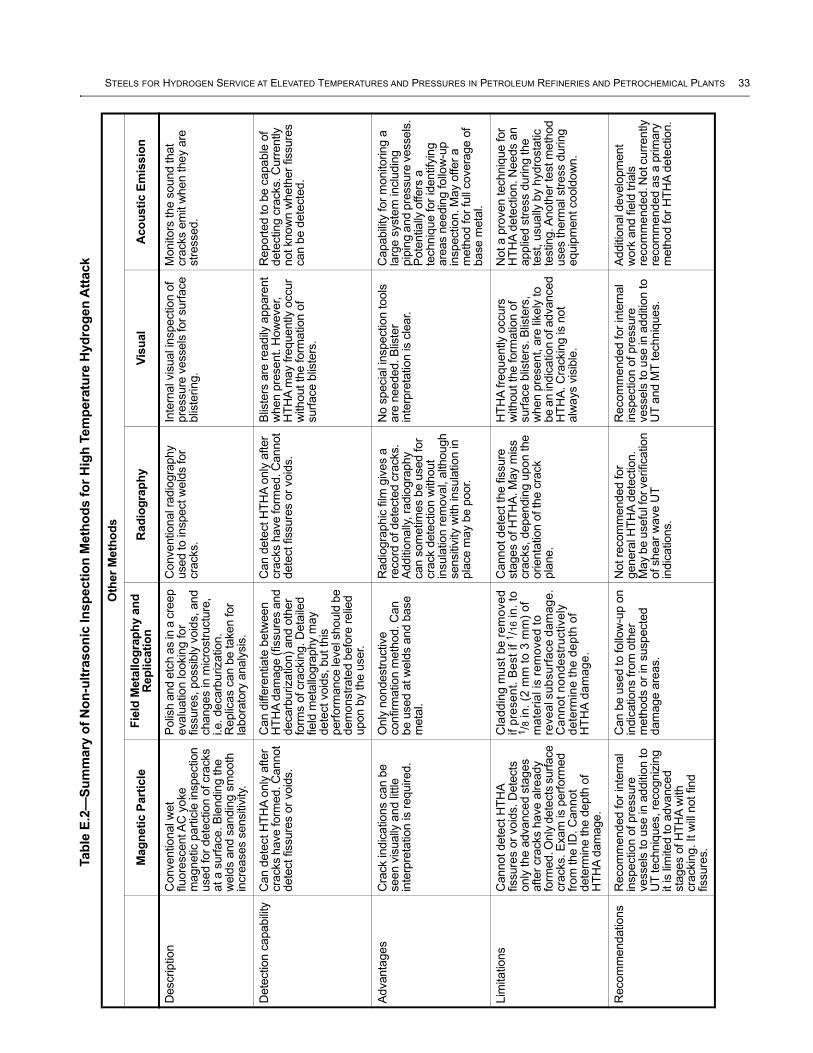
STEELS FOR HYDROGEN SERVICE AT ELEVATED TEMPERATURES AND PRESSURES IN PETROLEUM REFINERIES AND PETROCHEMICAL PLANTS 33Tab
le E
.2—
Su
mm
ary
of
No
n-u
ltra
so
nic
In
sp
ecti
on
Meth
od
s f
or
Hig
h T
em
pera
ture
Hyd
rog
en
Att
ack
Oth
er
Meth
od
s
Mag
neti
c P
art
icle
Fie
ld M
eta
llo
gra
ph
y a
nd
R
ep
licati
on
Rad
iog
rap
hy
Vis
ual
Aco
usti
c E
mis
sio
n
Description
Conventional w
et
fluore
scent A
C y
oke
magnetic p
art
icle
inspection
used for
dete
ction o
f cra
cks
at a s
urf
ace. B
lendin
g the
weld
s a
nd s
andin
g s
mooth
in
cre
ases s
ensitiv
ity.
Polis
h a
nd e
tch a
s in
a c
reep
evalu
ation lookin
g for
fissure
s, possib
ly v
oid
s, and
changes in m
icro
str
uctu
re,
i.e. decarb
urization.
Replic
as c
an b
e taken for
labora
tory
analy
sis
.
Conventional ra
dio
gra
phy
used to inspect w
eld
s for
cra
cks.
Inte
rnal vis
ual in
spection o
f pre
ssure
vessels
for
surf
ace
blis
tering.
Monitors
the s
ound that
cra
cks e
mit w
hen they a
re
str
essed.
Dete
ction c
apabili
tyC
an d
ete
ct H
TH
A o
nly
after
cra
cks h
ave form
ed. C
annot
dete
ct fissure
s o
r void
s.
Can d
iffere
ntiate
betw
een
HT
HA
dam
age (fissure
s a
nd
decarb
urization)
and o
ther
form
s o
f cra
ckin
g. D
eta
iled
field
meta
llogra
phy m
ay
dete
ct void
s, but th
is
perf
orm
ance le
vel s
hould
be
dem
onstr
ate
d b
efo
re r
elie
d
upon b
y the u
ser.
Can d
ete
ct H
TH
A o
nly
after
cra
cks h
ave form
ed. C
annot
dete
ct fissure
s o
r void
s.
Blis
ters
are
readily
appare
nt
when p
resent. H
ow
ever,
HT
HA
may fre
quently o
ccur
without th
e form
ation o
f surf
ace b
liste
rs.
Report
ed to b
e c
apable
of
dete
cting c
racks. C
urr
ently
not know
n w
heth
er
fissure
s
can b
e d
ete
cte
d.
Advanta
ges
Cra
ck indic
ations c
an b
e
seen v
isually
and little
inte
rpre
tation is r
equired.
Only
nondestr
uctive
confirm
ation m
eth
od. C
an
be u
sed a
t w
eld
s a
nd b
ase
meta
l.
Radio
gra
phic
film
giv
es a
re
cord
of dete
cte
d c
racks.
Additio
nally
, ra
dio
gra
phy
can s
om
etim
es b
e u
sed for
cra
ck d
ete
ction w
ithout
insula
tion r
em
oval, a
lthough
sensitiv
ity w
ith insula
tion in
pla
ce m
ay b
e p
oor.
No s
pecia
l in
spection tools
are
needed. B
liste
r in
terp
reta
tion is c
lear.
Capabili
ty for
monitoring a
la
rge s
yste
m inclu
din
g
pip
ing a
nd p
ressure
vessels
. P
ote
ntially
offers
a
techniq
ue for
identify
ing
are
as n
eedin
g follo
w-u
p
inspection. M
ay o
ffer
a
meth
od for
full
covera
ge o
f base m
eta
l.
Lim
itations
Cannot dete
ct H
TH
A
fissure
s o
r void
s. D
ete
cts
only
the a
dvanced s
tages
after
cra
cks h
ave a
lready
form
ed. O
nly
dete
cts
surf
ace
cra
cks. E
xam
is p
erf
orm
ed
from
the ID
. C
annot
dete
rmin
e the d
epth
of
HT
HA
dam
age.
Cla
dd
ing
mu
st
be
re
mo
ve
d
if p
rese
nt.
Be
st
if 1
/16 in
. to
1/8
in
. (2
mm
to
3 m
m)
of
ma
teri
al is
re
mo
ve
d t
o
reve
al s
ub
su
rfa
ce
da
ma
ge
. C
an
no
t n
on
de
str
uctive
ly
de
term
ine
th
e d
ep
th o
f H
TH
A d
am
ag
e.
Cannot dete
ct th
e fis
sure
sta
ges o
f H
TH
A. M
ay m
iss
cra
cks, dependin
g u
pon the
orienta
tion o
f th
e c
rack
pla
ne.
HT
HA
fre
quently o
ccurs
w
ithout th
e form
ation o
f surf
ace b
liste
rs. B
liste
rs,
when p
resent, a
re lik
ely
to
be a
n in
dic
ation o
f advanced
HT
HA
. C
rackin
g is n
ot
alw
ays v
isib
le.
Not a p
roven techniq
ue for
HT
HA
dete
ction. N
eeds a
n
applie
d s
tress d
uring the
test, u
sually
by h
ydro
sta
tic
testing. A
noth
er
test m
eth
od
uses therm
al str
ess d
uring
equip
ment coold
ow
n.
Recom
mendations
Recom
mended for
inte
rnal
inspection o
f pre
ssure
vessels
to u
se in a
dditio
n to
UT
techniq
ues, re
cogniz
ing
it is lim
ited to a
dvanced
sta
ges o
f H
TH
A w
ith
cra
ckin
g. It w
ill n
ot find
fissure
s.
Can b
e u
sed to follo
w-u
p o
n
indic
ations fro
m o
ther
meth
ods o
r in
suspecte
d
dam
age a
reas.
Not re
com
mended for
genera
l H
TH
A d
ete
ction.
May b
e u
sefu
l for verification
of shear
wave U
T
indic
ations.
Recom
mended for
inte
rnal
inspection o
f pre
ssure
vessels
to u
se in a
dditio
n to
UT
and M
T techniq
ues.
Additio
nal develo
pm
ent
work
and fie
ld trials
re
com
mended. N
ot c
urr
ently
recom
mended a
s a
prim
ary
m
eth
od for
HT
HA
dete
ction.

34
Annex F(informative)
HTHA of Non-PWHT’d Carbon Steels
F.1 General
The purpose of this annex is to provide a brief summary of the information and experience regarding the use of
welded, but not PWHT’d, carbon steels in elevated temperature and pressure hydrogen service.
In the fall of 2011 API issued an alert to inform users that there have been several reports of cracking-related issues with
carbon steel piping and equipment in high temperature, high pressure hydroprocessing service at operating conditions
where carbon steel was previously thought to be resistant to HTHA. Some companies no longer specify non-PWHT’d
steel for new or replacement equipment used for operation up to the earlier carbon steel curve in Figure 1 because of
the uncertainties regarding its performance after prolonged use. Since the year 2000, a series of unfavorable service
experiences has reduced confidence in the position of the carbon steel curve for non-PWHT’d components [34].
In the Eighth Edition (2015) of this publication, a new welded carbon steel, but not PWHT’d, curve was introduced
positioned at 400 °F (204 °C) from about 2200 psia (15.17 MPa) to 13,000 psia (89.63 MPa), then approximately
50 °F (28 °C) lower than the 1977 edition, from about 900 psia (6.21 MPa) to 2200 psia (15.17 MPa), then widening
its separation with the non-welded or PWHT’d carbon steel curve to a maximum slightly higher than about 100 °F
(56 °C) at the curve elbow to finally turn vertical at 50 psia (0.34 MPa). The past carbon steel curve will continue to be
used to represent carbon steel components that are not welded or welded and PWHT’d. Plant experience has
identified 12 new instances of HTHA or cracking of welded, but not PWHT’d carbon steel below the 1977 curve. The
operating conditions for these instances are given in F.2 for Figure F.1 and are plotted on Figure F.1.
Prior to these recent reports, the only reported failures of carbon steel below the API RP 941, Figure 1 curve were in
cases of exceptionally high stress, as discussed in 5.2 and 5.3. All of the new reports of HTHA involve carbon steel
equipment that was not PWHT’d after welding during fabrication. Past research summarized in API TR 941, The
Technical Basis Document for API RP 941, states that non-PWHT’d welds not only retain high residual welding stresses,
but also have lower carbide stability in the weld HAZ that further increases HTHA susceptibility.
Existing equipment with non-PWHT’d welded carbon steel that is operated above the new non-PWHT’d welded
carbon steel curve in Figure 1 should be evaluated in regards to HTHA risk. Owners/operators may choose to replace
such equipment or prioritize such equipment operating above the new curve for inspection. Plant experience
suggests that important variables to consider in prioritizing equipment for inspection include severity of operating
condition (hydrogen partial pressure and temperature), thermal history of the steel during fabrication, stress, cold
work, and cladding composition and thickness, when present.
Owners/operators should add a safety factor even to the new Figure F.1 curve, because operations just below the
curve may still be at-risk due to issues such as discrepancies in temperature measurement, fouling of heat transfer
surfaces, and temperature excursions.
F.2 References and Comments for Figure F.1
F.2.1 References
34) J. McLaughlin, J. Krynicki, and T. Bruno, “Cracking of Non-PWHT’d Carbon Steel Operating at Conditions
Immediately Below the Nelson Curve,” Proceedings of 2010 ASME Pressure Vessels and Piping Conference,
July 2010, Bellevue Washington, PVP2010-25455.
35) Eight separate points, 35a through 35h. Valero Energy Corporation, private communication to API Subcommittee
on Corrosion, 2012.

STEELS FOR HYDROGEN SERVICE AT ELEVATED TEMPERATURES AND PRESSURES IN PETROLEUM REFINERIES AND PETROCHEMICAL PLANTS 35
36) Phillips 66 Company, private communication to API Subcommittee on Corrosion, 2012.
37) Phillips 66 Company, private communication to API Subcommittee on Corrosion, 2012.
38) Total Refining and Marketing, private communication to API Subcommittee, 2011.
39) Marathon Petroleum Co., private communication to API Subcommittee, 2014.
40) Marathon Petroleum Co., private communication to API Subcommittee, 2014.
F.2.2 Comments
V) Point 34. After 30+ years, non-PWHT’d carbon steel reactor, vessels, and associated piping in light distillate
hydrotreating service cracked from HTHA. Operating at roughly 580 °F and at 125 psia.
W) Points 35a and 35h. These 2 points on the plot represent the range of 8 different failures. After 4.5 to 8 years, 7
different non-PWHT’d carbon steel flanges cracked in the HAZs on the flange side of a flange-to-pipe welds in
gasoline hydrotreating service. One cracked on the pipe side of the pipe-to-flange weld. Operating at 645 °F
(340 °C) and 57 psia to 94 psia (0.39 MPa to 0.65 MPa) hydrogen partial pressure.
X) Point 37. After 14 years, non-PWHT’d SA-105 carbon steel flange cracked in the HAZ on the flange side of a
flange to pipe weld. Operating at roughly 600 °F and at 280 psia.
NOTE This Figure is adapted from Figure 1, Eighth Edition (2015) of this publication. Numbered and lettered references for point in this figure refer to data listed in 3.5 and F.2.
Figure F.1—Operating Conditions for Carbon Steel (Welded with No PWHT) That
Experienced HTHA Below the 1977 Carbon Steel Figure 1 Curve
250
300
Tem
pera
ture
, °C
100 200 300 400 500 600 700
500
400
600
700
Tem
pera
ture
, °F
Hydrogen Partial Pressure, psia
3.452.762.071.38 4.14 4.83
Hydrogen Partial Pressure, MPa Absolute
0
0
21E
21E 26
23F
2323
16C 1D
33S
232011
19
23
1
23
23
40
34
37
36
35a35h
39
23
18T 1
1
16
38
350
Carbon steel (non-welded or
welded with PWHT)
Carbon steel (welded with no PWHT)

36 API RECOMMENDED PRACTICE 941
Y) Point 36. After 6 years, multiple non-PWHT’d carbon steel flanges cracked in the HAZs on the flange side of
flange to pipe welds in a gasoline desulfurization unit. Operating at roughly 670 °F and at 85 psia.
Z) Point 38. After 29 years, non-PWHT’d carbon steel exchanger shell in HDS service cracked. Operating at roughly
500 °F and at 670 psia.
A.1) Point 39. After 10 years, inspection found cracks in non-PWHT’d carbon steel exchanger shell in light
hydrotreater service. Operating at roughly 540 °F and at 130 psia.
B.1) Point 40. After 30+ years, inspection found cracks in non-PWHT’d carbon steel exchanger shell in light
hydrotreater service. Operating at roughly 490 °F and at 195 psia.
F.3 References
J. McLaughlin, J. Krynicki, and T. Bruno, “Cracking of Non-PWHT’d Carbon Steel Operating at Conditions
Immediately Below the Nelson Curve,” Proceedings of 2010 ASME Pressure Vessels and Piping Conference, July
2010, Bellevue Washington, PVP2010-25455.
Chemical Safety Board draft report titled “Draft Report 2010-08-I-WA, Tesoro Anacortes Refinery.”
D. Miller, API letter to The Honorable Rafael Moure-Eraso of the CSB, dated March 14, 2014, titled “Draft Report
2010-08-I-WA, Tesoro Anacortes Refinery.”

37
Annex G(informative)
Methodology for Calculating Hydrogen Partial Pressure in Liquid-filled Piping
G.1 General
This annex addresses the issue of calculating the hydrogen partial pressure to be applied to Figure 1 for liquid only or
liquid-filled systems, where the liquid contains dissolved hydrogen, but there is no separate vapor phase present,
both with and without downstream increases in total pressure. The RP is to use the hydrogen partial pressure of the
vapor that was last in equilibrium with the liquid in question, or the calculated hydrogen partial pressure that would be
in equilibrium with the liquid at its operating temperature and pressure. Prior to the Eighth Edition of this RP, it did not
address the issue of a liquid containing dissolved hydrogen that is pumped to a pressure above its bubble point. For
such a liquid, there is no “co-existing” vapor to examine for hydrogen partial pressure; however, the dissolved
hydrogen in the liquid can lead to HTHA.
Examples of liquid-filled lines containing hydrogen include hydroprocessing unit separator liquid lines (upstream of
pressure let-down valves), some hydroprocessing unit feed lines and equipment (when hydrogen is injected as a soak
gas and then is completely absorbed by the liquid as the temperature increases), gasoline desulfurization units with
pumping of the reactor bottoms streams, some biofuel units, some coal liquefaction units, and some gasification units.
Operating companies observed piping failure in pressurized liquid services containing dissolved hydrogen where the
piping was thought to be in compliance with this RP. This annex contains five proposed methods to enable engineers
to use this RP for pressurized liquid services.
The five methods are as follows.
— Conventional Thermodynamics
1) The partial pressure of dissolved gaseous species is generally defined as the partial pressure of the dissolved
species (in vapor) in equilibrium with the liquid at the same temperature (i.e. the partial pressure downstream
of the pumps is assumed to be very close to the partial pressure upstream). Process modeling experts report
that this should be very close to the actual value (within 5 %).
2) This is consistent with the previous API 941 guidance and is appropriate for liquid lines from vessels down to
pumps.
— Total Pressure Method
1) Start with the pressurized liquid and reduce the pressure to the bubble point. Calculate the hydrogen mole
fraction of the incipient vapor.
2) Determine the pressurized liquid effective ppH2 by multiplying that mole fraction by the total (absolute)
pressure of the pressurized liquid.
For liquids that are pumped from bubble point to some higher pressure, the practitioner can simply start with the
known equilibrium vapor phase properties, prior to pumping.
The other possible calculation methods are as follows:
— Pure Hydrogen Equivalency Method,
— Fugacity Correction Method, and

38 API RECOMMENDED PRACTICE 941
— Composition Variation and Compensation Method.
These tend to give results within 5 % of the Conventional Thermodynamics Method.
— Pure Hydrogen Equivalency Method
1) Using an appropriate thermodynamic method, calculate the fugacity of hydrogen in the liquid phase. Actual
temperature and pressure should be used.
2) Find the pressure of a pure hydrogen stream (at the same temperature) such that the hydrogen fugacity is the
same. The resulting pure hydrogen pressure (absolute) is the effective ppH2 of the stream in question.
The hydrogen equivalency method finds the pure hydrogen pressure that would have the same HTHA propensity
as the subject pressurized stream with dissolved hydrogen. Since the Nelson curves are drawn with ppH2 as the
independent variable, this method will often result in a higher HTHA propensity (effective ppH2) than the simple
ppH2 would indicate.
— Fugacity Correction Method
1) Start with the pressurized liquid and reduce the pressure to the bubble point. Calculate the hydrogen fugacity
(it will be the same for both phases) and ppH2 for the equilibrium vapor phase.
2) Calculate the hydrogen fugacity in the liquid after pressurization.
3) The ratio of the hydrogen fugacity at higher pressure to the hydrogen fugacity at the lower pressure
equilibrium is the fugacity correction factor.
4) To find the effective ppH2 for the high pressure liquid, multiply the equilibrium vapor phase ppH2 by the
correction factor.
For liquids that are pumped from bubble point to some higher pressure, the practitioner can simply start with the
known vapor phase ppH2 prior to pumping and apply the correction factor to account for the pressure increase.
This method rigorously corrects for the increase in HTHA propensity, while maintaining consistency with the data
in this RP.
— Composition Variation + Compensation Method
1) Again start with a pressurized liquid and appropriate thermodynamic model.
2) Hold state and compositional variables constant, then add hydrogen until the sub-cooled liquid reaches the
bubble point.
3) The pseudo-saturation H2 partial pressure is determined.
4) This pseudo-saturation value is multiplied by the ratio of actual H2 in the sub-cooled liquid to compensate for
the H2 addition, thus arriving at the sought after effective H2 partial pressure.
G.2 Example 1 Showing the Total Pressure Method, the H2 Equivalency Method, and the Fugacity Correction Method
The sketch below shows a typical example analysis. A narrow boiling range heavy cat naphtha (HCN) is drawn from
a high pressure separator operating at 650 °F, 295 psig, and 124 psia ppH2. The hydrocarbon liquid has a boiling

STEELS FOR HYDROGEN SERVICE AT ELEVATED TEMPERATURES AND PRESSURES IN PETROLEUM REFINERIES AND PETROCHEMICAL PLANTS 39
range of 384 °F to 443 °F (by ASTM D86 Method for Distillation of Petroleum Products). The pump increases the
pressure by 100 psi.
Table G.1 shows the effective hydrogen partial pressures for the streams before and after the pump (A and B) using
the three methods.
G.3 Example 2 Showing the Methods in Example 1 with the Composition Variation + Compensation Method
Table G.1—Effective Hydrogen Partial Pressures
All values are psia
Calculation Method Effective ppH2 at A Effective ppH2 at B
Previous edition of API RP 941 (Conventional Thermodynamics) 124 164
Total Pressure Method 124 164
Pure H2 Equivalency 153 (Note) 162
Fugacity Correction Method (factor = 1.0595) 124 131
NOTE With the Pure Hydrogen Equivalency Method, the dissolved hydrogen before the pump has the same fugacity (chemical potential and activity) as pure hydrogen at 153 psia (for 650 °F). This is a higher value than the 124 psia ppH2 as calculated using API RP 941.
A
B
395 psig650 °F
Hydrotreator Vapor Liquid Separator
295 psig650 °F
yH2 40 %ppH2 124 psia
A
B
395 psig650 °F
Hydrotreator Vapor Liquid Separator
295 psig650 °F
yH2 40 %ppH2 124 psia

40 API RECOMMENDED PRACTICE 941
— Simulate a separator with a H2-Cetane (n-C16) liquid packed line at 550 °F, 650 psia. The hydrogen molar
percentage at the separator is 97.5 % with a H2 pp of 633.6 psia. The new conditions at point B are 550 °F and
800 psia.
— H2-Cetane system is an idealization of a diesel hydrotreater.
— Bottoms of separator taken through a pump with a pressure differential of 150 psi.
— The H2 partial pressure determined at the discharge using the various methods described above is presented in
Table G.2.
G.4 References
P66 Technical Memorandum titled “Estimating Hydrogen Attack Potential for Pressurized Liquids Containing
Dissolved Hydrogen,” from Mitch Loescher, dated Sept. 1, 2011
“Methods for Approximating H2 Partial Pressure in Subcooled Liquids,” presented at NACE CTW, Sept. 17, 2012, by
Cathy Shargay, Alex Cuevas, Paul Mathias, and Garry Jacobs of Fluor.
Table G.2—Effective Hydrogen Partial Pressures with the Composition Variation + Compensation Method
Thermodynamic Definition
Total PressureHydrogen
Equivalency
Fugacity Correction
Factor
Composition Variation +
Compensation
H2 pp 633.6 779.8 646.1 620.1 630.1
% difference 0.0 23.1 2.0 2.1 0.6
Effective H2 pp at this location A B B B B

41
Annex H(informative)
Internal Company Data Collection
Request for New Information
The API Subcommittee on Corrosion and Materials collects data on the alloys shown in all figures or similar alloys
that may come into use. Revisions to the curves will be published as the need arises.
For the existing curves, data are desired for instances of HTHA damage that occur above or below the curve for the
steel involved; data are also desired for successful experience in the area above the curve for the steel involved. For
chromium-molybdenum steels not included on the existing figures, data for successes and HTHA damage in any
meaningful area are desired.
The following datasheet is provided for the reader’s convenience in submitting new data. Available data should be
furnished by inserting information in the spaces provided and checking the appropriate answer where a selection is
indicated. Any additional information should be attached.
While both hydrogen partial pressure and temperature are important, particular attention should be given to obtaining
the best estimate of accurate metal temperature. One method of obtaining more accurate data for a specific area is to
attach a skin thermocouple to the area that previously exhibited high temperature hydrogen damage.
The completed form should be returned to the following address:
American Petroleum Institute
API Standards Department
1220 L Street, NW
Washington, DC 20005

42 API RECOMMENDED PRACTICE 941
Datasheet for Reporting High Temperature Hydrogen Attack (HTHA) of Carbon and Low-alloy Steels
Date ________________________________________ File No. ____________________________
By ________________________________________________________________________________________________________________
(Name, Company, Address)
1. (a) ASTM specification (or equivalent) for the steel: _______________________________________________________________________
(b) Design Code____________________________ _________
2. (a) Composition of steel (wt%) Fe ________ Cr________ Mo _________ V ________ Ni ________ P________ Sn ___________
Ti _________ Nb _______ C __________ Si ________ Mn________ S________ As ___________
(b) Steel protection: None __________________ Weld overlay material _________________________ Sb ___________
Cladding material _______ Other _______________
(c) Thickness Base metals _________ Weld overlay or cladding (if any) __________________________________
3. Heat treatment: Postweld heat treatment Yes ______ No ______ Temperature/Time _________________ °F/hr
Normalized and tempered Yes ______ No ______ Tempering Temperature ______________ °F
Quenched and tempered Yes ______ No ______ Tempering Temperature ______________ °F
Other _________________________________________________________________________________
4. Mechanical properties
(prior to exposure): Yield strength (actual) _____________________ psi
Ultimate strength (actual) __________________ psi
5. Temperature: Process: Average __________ °F Maximum ____________ °F
Metal: Average __________ °F Maximum ____________ °F
6. Hydrogen partial pressure: ________________ psia (Describe method) Hydrogen purity _________________ %
7. Calculated operating stress: ________________ psi
8. Microhardness: For a failure, at or near crack: ____________________
For successes: Weld: _______________ Base material ________________________
Heat-affected zone: _______________________
9. Days in service: Total ___________________________ At maximum temperature __________________________
10. Damage Appearance Surface decarburization Yes ______ No ______ Surface cracking Yes ______ No ______
Internal decarburization Yes ______ No ______ Internal fissuring Yes ______ No ______
Blisters Yes ______ No ______ Isolated Blisters Yes ______ No ______
Voids Yes ______ No ______
11. Location of failure
(include photograph): Weld metal Yes______ No______ Heat-affected zone Yes______ No______
Base material Yes______ No______
Other _________________________________________________________________________________
12. The type of process unit involved ______________________________________________________________________________________
13. Type of equipment (piping, vessels, heat exchanger, etc.) __________________________________________________________________
14. Submit a photomicrograph showing typical failure and grain structure. Include 100X and 500X photomicrographs, plus any other appropriate
magnifications. Attach any reports, if available. Please note any unusual circumstances.

43
Bibliography
In addition, this publication draws upon the work referenced in the following publications.
[1] G.A. Nelson, “Hydrogenation Plant Steels,” 1949 Proceedings, Vol. 29M, API, Washington, DC, pp. 163–174.
[2] W.A. Pennington, Transactions of the American Society for Metals, Vol. 37, 1946.
[3] E.E. Fletcher and A.R. Elsea, “Defense Metals Information Center Report 202,” Battelle Memorial Institute,
Columbus, Ohio, 1964.
[4] API Publication 945, A Study of the Effects of High-temperature, High-pressure Hydrogen on Low-alloy
Steels, API, Washington, DC, 1975 (out of print).
[5] F.K. Naumann, “Influence of Alloy Additions to Steel Upon Resistance to Hydrogen Under High Pressure,”
Technische Mitteilungen Krupp, Vol. 1, No. 12, pp. 223–234, 1938.
[6] API Publication 940, Steel Deterioration in Hydrogen, API, Washington, DC, 1967 (out of print).
[7] R.D. Merrick and C.J. Maguire, “Methane Blistering of Equipment in High Temperature Service,” Paper No. 30
presented at the Annual Meeting of the National Association of Corrosion Engineers, March 1979.
[8] I. Class, “Present State of Knowledge in Respect to the Properties of Steels Resistant to Hydrogen Under
Pressure,” Stahl and Eisen, Vol. 80, pp. 1117–1135, Aug. 18, 1960.
[9] R.P. Jewett, “Effect of Gaseous Hydrogen on the Mechanical Properties of Metals Used in the Petroleum
Industry,” 1979 Proceedings, Refining Department, Vol. 58, API, Washington, DC, pp. 151–160.
[10] T. Nomura, K. Murayama, and M. Matsushita, “Sample Test Results of All Liquid Phase Hydrogen Attack,”
Japan Energy Corporation, presented to the API Task Group on Hydrogen Deterioration of Steels, May 1994.
[11] F.H. Vitovec, “The Growth Rate of Fissures During Hydrogen Attack of Steels,” 1964 Proceedings, Vol. 44,
API, Washington, DC, pp. 179–188.
[12] G. Sundararajan and P. Shewmon, “The Kinetics of Hydrogen Attack of Steels,” Metallurgical Transactions A,
Vol. 12, pp. 1761–1765, 1981.
[13] B.L. Chao, G.R. Odette, and G.E. Lucas, “Kinetics and Mechanisms of Hydrogen Attack in 2.25Cr-1Mo Steel,”
ORNL/Sub/82-22276/01, August 1988.
[14] G.A. Nelson, “Operating Limits and Incubation Times for Steels in Hydrogen Service,” 1965 Proceedings,
Vol. 45, API, Washington, DC, pp. 190–195.
[15] R.D. Merrick and A.R. Ciuffreda, “Hydrogen Attack of Carbon-0.5Molybdenum Steels,” 1982 Proceedings,
Refining Department, Vol. 61, API, Washington, DC, pp. 101–114.
[16] M.G. Maggard, “Detecting Internal Hydrogen Attack,” Oil and Gas Journal, March 10, 1980, pp. 90–94.
[17] K. Ishii, K. Maeda, R. Chiba, and K. Ohnishi, “Intergranular Cracking of C-0.5Mo Steel in a Hydrogen
Environment at Elevated Temperatures and Pressures,” 1984 Proceedings, Refining Department, Vol. 63,
API, Washington, DC, pp. 55–64.

44 API RECOMMENDED PRACTICE 941
[18] R. Chiba, K. Ohnishi, K. Ishii, and K. Maeda, “Effect of Heat Treatment on the Resistance of C-0.5Mo Steel
Base Metal and Its Welds to Hydrogen Attack,” 1985 Proceedings, Refining Department, Vol. 64, API,
Washington, DC, pp. 57–74.
[19] M. Prager, “Hydrogen Attack Susceptibility of Chrome-Moly Steels and Weldments,” PVP-Vol. 239/MPC-
Vol. 33, Serviceability of Petroleum, Process, and Power Equipment, ASME, New York, 1992.
[20] E.A. Sticha, “Tubular Stress-Rupture Testing of Chromium-Molybdenum Steels with High-Pressure
Hydrogen,” Journal of Basic Engineering, Vol. 91, ASME, New York, pp. 590–592, December 1969.
[21] E.B. Norris and E.A. Sticha, “Effect of Hydrogen on the Stress-Rupture Strength of 2-1/4Cr-1Mo Steel,” Metal
Properties for the Petroleum and Chemical Industries (ASME G00103/MPC-2), ASME, New York, pp. 590–
592, 1976.
[22] A.R. Ciuffreda, N.B. Heckler, and E.V. Norris, “Stress Rupture Behavior of Cr-Mo Steels in a High Pressure
Hydrogen Environment,” ASME H00227/MPC-18, ASME, New York, 1982.
[23] K.R. Lewis, Shell Global Solutions—International, NACE Refin*Cor, 98C5.14.
[24] Exxon Research & Engineering, private communication to API Subcommittee on Corrosion and Materials,
August 1995.
[25] D.C. Cherrington and A.R. Ciuffreda, “Design of Piping Systems for Hydrogen Service,” 1967 Proceedings,
Division of Refining, Vol. 47, API, New York, pp. 237–252.
[26] T. Ishiguro, K. Kimura, T. Hatakeyama, T. Tahara, and K. Kawano, “Effect of Metallurgical Factors on
Hydrogen Attack Resistance in C-0.5Mo Steel,” presented at the Second International Conference on
Interaction of Steels with Hydrogen in Petroleum Industry Pressure Vessel and Pipeline Service, Materials
Properties Council, Vienna, Austria, Oct. 19–21, 1994.
[27] M.H. Armbruster, “The Solubility of Hydrogen at Low Pressure in Iron, Nickel, and Certain Steels at 400 to
600C,” Journal of the American Chemical Society, Vol. 65, p. 1043, 1943.
[28] W. Geller and T. Sun, “Influence of Alloy Additions on Hydrogen Diffusion in Iron and Contribution to the
System Iron-Hydrogen,” Archiv für das Eisenhüttenwesen, Vol. 21, pp. 423–430, 1950.
[29] T.P. Groeneveld and A.R. Elsea, “Permeation of Hydrogen at Elevated Temperatures and Pressures Through
Stainless Steel-Overlayed 2.25Cr-1Mo Steel,” Proceedings of API, Division of Refining, Vol. 56 (Midyear
Meeting, May 9–12, 1977, Chicago, IL), pp. 7–16. API, Washington, DC, 1977.
[30] “Report on the Effect of Stainless Steel Weld Overlay or Cladding on Hydrogen Attack of Underlying Steel,”
Materials Properties Council, New York, September 1984.
[31] Archakov and Grebeshkova, Reference 105 in Welding Research Council Bulletin 275, “The Use of
Quenched and Tempered 2.25 Cr-1Mo Steel for Thick Wall Reactor Vessels, etc.,” W.E. Erwin and J.C. Kerr,
February 1982.
[32] Exxon Report: “Hydrogen Attack of Gofiner Reactor Inlet Nozzle,” 1988.
[33] G.R. Prescott, “History and Basis of Prediction of Hydrogen Attack of C-0.5Mo Steel,” a state-of-the-art review
presented at Second International Conference on Interaction of Steels with Hydrogen in Petroleum Industry
Pressure Vessel and Pipeline Service, Materials Properties Council, Vienna, Austria, Oct. 19–21,1994.
STEELS FOR HYDROGEN SERVICE AT ELEVATED TEMPERATURES AND PRESSURES IN PETROLEUM REFINERIES AND PETROCHEMICAL PLANTS 45
[34] W.D. Wang, “Inspection of Refinery Vessels For Hydrogen Attack Using Ultrasonic Techniques,” Review of
Progress in Quantitative Nondestructive Evaluation, Vol. 12, edited by D.O. Thompson and D.E. Chement,
Plenum Press, New York.
[35] W.D. Wang, “Ultrasonic Detection of High Temperature Hydrogen Attack,” United States Patent #5,404754,
issued April 11, 1995.
[36] W.D. Wang, “Ultrasonic Detection, Characterization, and Quantification of Localized High Temperature
Hydrogen Attack In Weld Heat Affected Zone,” In Service Experience In Fossil and Nuclear Power Plants,
PVP-Vol. 392, edited by J. Pan, ASME, New York, 1999, pp. 291–298.
[37] W.D. Wang, “Ultrasonic Techniques for Inspection of Weld and Heat-Affected Zone for Localized High
Temperature Hydrogen Attack,” United States Patent #6,125,704, issued Oct. 3, 2000.
[38] R. Bruscato, “Temper Embrittlement and Creep Embrittlement of 2.25Cr-1Mo Shielded Metal-Arc Weld
Deposits,” Welding Journal, Vol. 49, Res. Suppl., pp 148–156, April 1970.
[39] API TR 941, The Technical Basis Document for API RP 941, 2008.
[40] J. McLaughlin, J. Krynicki, and T. Bruno, “Cracking of Non-PWHT’d Carbon Steel Operating at Conditions
Immediately Below the Nelson Curve,” Proceedings of 2010 ASME Pressure Vessels and Piping Conference,
July 2010, Bellevue, Washington, PVP2010-25455.
[41] T. Kushida, NACE Corrosion 1994 Paper No. 67 (Fig. 10).
[42] ASME Boiler and Pressure Vessel Code (BPVC), Section II: Materials; Part A: Ferrous Material Specifications
[43] ASME Boiler and Pressure Vessel Code (BPVC), Section II: Materials; Part D: Properties
[44] ASME Boiler and Pressure Vessel Code (BPVC), Section III: Rules for Construction of Nuclear Power Plant
Components
[45] ASME Boiler and Pressure Vessel Code (BPVC), Section VIII; Division 3: Alternate Rules for Construction of
High Pressure Vessels
[46] ASME/ANSI Code for Pressure Piping B31.12, Hydrogen Piping and Pipelines
[47] ASTM D86, Standard Test Method for Distillation of Petroleum Products at Atmospheric Pressure
[48] ASTM A204, Standard Specification for Pressure Vessel Plates, Alloy Steel, Molybdenum
[49] SAE AMS5046D, Carbon Steel, Sheet, Strip, and Plate (SAE 1020 and 1025), Annealed


Product No. C94108