steeg, s., quinlivan, l., nowland, r., carroll, r., casey ... · priate management of these...
TRANSCRIPT

Steeg, S., Quinlivan, L., Nowland, R., Carroll, R., Casey, D., Clements, C., ...Kapur, N. (2018). Accuracy of risk scales for predicting repeat self-harm andsuicide: a multicentre, population-level cohort study using routine clinicaldata. BMC Psychiatry, 18(1), [113]. https://doi.org/10.1186/s12888-018-1693-z
Publisher's PDF, also known as Version of record
License (if available):CC BY
Link to published version (if available):10.1186/s12888-018-1693-z
Link to publication record in Explore Bristol ResearchPDF-document
University of Bristol - Explore Bristol ResearchGeneral rights
This document is made available in accordance with publisher policies. Please cite only the publishedversion using the reference above. Full terms of use are available:http://www.bristol.ac.uk/pure/about/ebr-terms

RESEARCH ARTICLE Open Access
Accuracy of risk scales for predicting repeatself-harm and suicide: a multicentre,population-level cohort study using routineclinical dataSarah Steeg1* , Leah Quinlivan1, Rebecca Nowland1, Robert Carroll4, Deborah Casey2, Caroline Clements1,Jayne Cooper1, Linda Davies5, Duleeka Knipe4, Jennifer Ness3, Rory C. O’Connor6, Keith Hawton2,David Gunnell4 and Nav Kapur1,7
Abstract
Background: Risk scales are used widely in the management of patients presenting to hospital following self-harm.However, there is evidence that their diagnostic accuracy in predicting repeat self-harm is limited. Their predictiveaccuracy in population settings, and in identifying those at highest risk of suicide is not known.
Method: We compared the predictive accuracy of the Manchester Self-Harm Rule (MSHR), ReACT Self-Harm Rule(ReACT), SAD PERSONS Scale (SPS) and Modified SAD PERSONS Scale (MSPS) in an unselected sample of patientsattending hospital following self-harm. Data on 4000 episodes of self-harm presenting to Emergency Departments(ED) between 2010 and 2012 were obtained from four established monitoring systems in England. Episodes wereassigned a risk category for each scale and followed up for 6 months.
Results: The episode-based repeat rate was 28% (1133/4000) and the incidence of suicide was 0.5% (18/3962). TheMSHR and ReACT performed with high sensitivity (98% and 94% respectively) and low specificity (15% and 23%).The SPS and the MSPS performed with relatively low sensitivity (24–29% and 9–12% respectively) and highspecificity (76–77% and 90%). The area under the curve was 71% for both MSHR and ReACT, 51% for SPS and 49%for MSPS. Differences in predictive accuracy by subgroup were small. The scales were less accurate at predictingsuicide than repeat self-harm.
Conclusions: The scales failed to accurately predict repeat self-harm and suicide. The findings support existingclinical guidance not to use risk classification scales alone to determine treatment or predict future risk.
Keywords: Self-harm, Suicide, Risk factors, Classification, Outcome
BackgroundEmergency Departments (EDs) in England treat over200,000 presentations for self-harm (intentional self-poisoning or self-injury) each year [1], and the appro-priate management of these individuals is important.Clinicians are required to manage a number of riskswhen treating this population. People who have self-harmed are at greater risk of suicide [2], other causes
of premature mortality [3] and comorbid conditionssuch as alcohol misuse [4] compared to the generalpopulation. In efforts to help mental health and non-specialist clinicians manage patients, many hospitalsuse risk scales, which aim to score or classify patientsaccording to their risk of future self-harm or suicidebased on the presence or absence of a specified set ofcharacteristics.Psychosocial assessment by a mental health clinician is a
central component of clinical care and is recommendedfor each episode of self-harm [5]. These in-depth assess-ments help clinicians to formulate decisions about follow-
* Correspondence: [email protected] for Mental Health and Safety, Manchester Academic Health ScienceCentre, University of Manchester, Manchester, EnglandFull list of author information is available at the end of the article
© The Author(s). 2018 Open Access This article is distributed under the terms of the Creative Commons Attribution 4.0International License (http://creativecommons.org/licenses/by/4.0/), which permits unrestricted use, distribution, andreproduction in any medium, provided you give appropriate credit to the original author(s) and the source, provide a link tothe Creative Commons license, and indicate if changes were made. The Creative Commons Public Domain Dedication waiver(http://creativecommons.org/publicdomain/zero/1.0/) applies to the data made available in this article, unless otherwise stated.
Steeg et al. BMC Psychiatry (2018) 18:113 https://doi.org/10.1186/s12888-018-1693-z
up care and reach an informed decision about the risk offurther self-harm. There is also evidence that psychosocialassessment may reduce the risk of a further self-harmepisode [6, 7]. Formal risk scales are used often by ED andpsychiatric clinicians. One study of 32 hospitals acrossEngland found that over 20 different risk scales were beingused with people who presented after self-harm [8]. Thissuggests they are in widespread use, with little consensusabout which should be used or how well they predictfuture risk.A recent systematic review compared the diagnostic
accuracy of predicting repeat self-harm of a number ofscales [9]. There were no scales that performed wellenough to be recommended for use in clinical practice.Another recent meta-analysis pooled positive predictivevalues from 52 studies of psychological scales predictingrepeat self-harm and suicide [10]. The results suggestedhigh-risk classification approaches were unlikely to beclinically useful but also reported high between-studyheterogeneity. Another study measured the accuracy ofthe SAD PERSONS Scale (SPS) for predicting suicidefollowing an emergency department presentation, usingadministrative data to identify suicide deaths [11]. Thestudy found that the predictive accuracy of the SPS wasinadequate to support the use of this risk scale. However,there have been few head-to-head comparisons of riskscales within the same cohort. A comparatively smallstudy (n = 483) found that the levels of diagnostic accur-acy reached by the five scales investigated meant theyhad limited clinical utility [12]. The risk scales alsoperformed worse at predicting repeat self-harm thansimply asking the clinician or patient to rate theirrisk. However, the study only recruited individuals re-ceiving a psychosocial assessment from mental healthclinician (typically only around 55% of all self-harmpatients who present to the ED receive a psychosocialassessment) [6, 13]. This study was too small toconsider the outcome of most concern to clinicians –suicide, or to examine diagnostic accuracy of thescales in different subgroups. In the current study wetherefore aimed to test four of the risk scales testedin previous research, using data from a large unse-lected cohort of people presenting to the ED afterself-harm.
Aims of the studyOur specific objectives were:
– To estimate predictive accuracy of the risk scales,using established cut-off points, for identifying a)repeat self-harm and b) suicide
– To test for differences in the predictive accuracy ofthe scales by groups (age, sex, method of self-harm,
professional background of the assessor and self-harm history)
Our hypothesis was that the poor predictive ability ofrisk scales found in previous smaller studies would holdfor this larger unselected hospital cohort and would bereplicated for suicide as an outcome.
MethodsData sourcesData were obtained from self-harm cohorts in fourseparate centres in England. Each centre has anestablished system to collect data relating to episodesof self-harm presenting to the study EDs. Two of thecentres (Bristol and Oxford) are based in the Southof England, one in the Midlands (Derby) one in theNorth (Manchester). The centres collected data fromone hospital each with the exception of Manchester,which included three hospitals. The EDs in the studyhospitals each had access to psychiatric liaison teamsalongside emergency out-of-hours cover from crisisteams or junior psychiatrists.For all self-harm episodes, basic data were avail-
able on method of self-harm (including drugs takenin self-poisoning), time of presentation, age, genderand initial hospital management (for example,admission to a medical bed, referral for a psychiatricassessment). For individuals who were subsequentlyreferred to liaison psychiatry services for a psycho-social assessment, additional data were availableincluding factors precipitating the self-harm, circum-stances of the act (such as planning and suicidal intent),social circumstances (such as living arrangements andmarital status) and symptoms of depression. For thepresent study, 1000 consecutive episodes of self-harm, in-cluding any repeat episodes by the same individuals, wereextracted from each centre’s cohort. The presentationstook place over different time periods in each centre butall were between 2010 and 2012. Repeat episodes ofself-harm by individuals were included to reflect the real-world ED environment and to be in line with clinical guid-ance that each episode of self-harm should be assessedcomprehensively [5]. In order to preserve theobservational nature of the data, no selection/exclusioncriteria were applied.In addition to information from the study hospitals,
individuals in three of the centres were matched toOffice for National Statistics (ONS) records held by theNational Health Service [https://digital.nhs.uk]. For indi-viduals who died, information about the cause of death,verdict and date of death were available. In one of thecentres, suicide deaths were identified from the localcoroner’s office.
Steeg et al. BMC Psychiatry (2018) 18:113 Page 2 of 11

ScalesWe compared the predictive accuracy of the followingrisk scales: the Manchester Self-Harm Rule (MSHR)[14], the ReACT Self-Harm Rule (ReACT) [15], the SADPERSONS Scale (SPS) [16] and the Modified SADPERSONS Scale (MSPS) [17]. The MSHR and ReACTboth consist of four items, with a ‘yes’ to at least one ofthe items resulting in a high risk categorisation and ‘no’to all items corresponding to low risk. The SPS and theMSPS both include ten items and classify episodes intothree risk categories (low, moderate and high). TheMSPS also weights four of the items, resulting inmaximum score of 14. The items included in each of thesescales and the cut-off points for the risk categories areshown in Additional file 1: Table S1. Scales were selectedbased on an existing systematic review of the diagnosticaccuracy of risk scales for predicting self-harm [9]. We in-cluded scales that could be re-constructed from routinelyrecorded information following a self-harm hospitalpresentation. The scales were also included in a previousstudy that compared their predictive accuracy when ad-ministered by a mental health clinician as part of the psy-chosocial assessment [12].Due to the observational nature of the study, some of
the individual items for the risk scales were derived fromvariables related to the core items of interest. For ex-ample, the item ‘Stated future intent’ from the two SADPERSONS Scales was derived in three centres from theSuicide Intent Scale [18] and in another from a binary‘yes/no’ question about current suicidal plans. In anotherexample, the SPS item ‘Depression or hopelessness’ wasavailable for two of the four sites: in one site it was de-rived from the presence of either one or two of the items‘depression’ and ‘hopelessness’ within a list of eightsymptoms of depression and in another it was derivedfrom the presence of a diagnosis of affective disorder atthe time of presentation.
Outcome measuresRepeat attendance to the study hospitals with an episodeof self-harm within 6 months was our first outcomemeasure. This was selected because it is a marker forcontinued distress and need for ongoing clinical care,and has been an outcome in many previous studies [19].We chose 6 months as the follow-up period as the ma-jority of repeat episodes occur within this time-frame[20]. Our second outcome measure was suicide within6 months of the self-harm episode. Many studies are in-sufficiently powered to examine suicide as an outcome,due to low event numbers, but large observational data-sets are well suited to this purpose. Individuals whocould not be matched to ONS records (n = 38/3157)were excluded from the analyses of suicide. Finally, wewere interested to see if there were differences in the
predictive accuracy of the scales by demographic andclinical sub-groups (age, sex, method of self-harm, self-harm history and according to the professional back-ground of the assessor). These have been identified asfactors which may influence the assessment of risk [21].
Missing dataData were relatively complete (median levels of com-pleteness for variables 69% (IQR 45% to 92%, range 34%to 100%) with lower completeness for certain variables(e.g. future suicidal intent and depression). Data weremore likely to be missing for variables where the individ-ual did not have a psychosocial assessment. For episodeswhere no assessment took place, there was evidence ofbias towards clinicians recording the variable if it was‘present’ and not if it was ‘absent’. In these instances,variables were imputed as absent, prior to multiple im-putation. The potential effect of this would be to under-estimate sensitivity and overestimate specificity (definedin Table 1). This included the following items from theSPS/MSPS: depression or hopelessness, organised or ser-ious attempt and rational thinking loss. This approachhas been taken in a previous study with similar data [7].The remaining missing data were largely missing at ran-dom, with potential predictors of missingness includedin the imputation model. Imputation was conductedusing the ‘chained equations’ approach [22] in Stata togenerate 50 imputations. Analyses were either conductedon all imputed datasets to generate pooled results, or,where multiple imputation was not compatible with theanalytic method, estimates were pooled from m = 1–5using Rubin’s rules [23].In a sensitivity analysis, repeat self-harm outcomes
were also examined using a dataset with missing data forscale items coded as not present. This analysis did notinclude one of the centres due to the unavailability of ascale item used in three of the four scales (living circum-stances) in this centre. We also conducted a ‘completecase’ analysis of the MSHR and ReACT by excludingscale items with missing data. Due to the larger numberof items in the SPS and the MSPS, too many caseswould have been excluded for this approach to be feas-ible for these scales. For example, while 52% of caseshad complete data for at least seven out of ten items onthe SPS, only 2% had complete data for all ten scaleitems. Therefore, excluding all cases with missing datafor any one scale item would result in 98% of cases ex-cluded from the analyses.
Statistical analysesThe predictive accuracy of the scales was examinedusing the following measures: sensitivity (the proportionof people who repeated self-harm and were correctlyidentified by the scale as high risk), specificity (the
Steeg et al. BMC Psychiatry (2018) 18:113 Page 3 of 11
proportion of people who did not repeat self-harm andwere correctly identified by the scale as low risk), posi-tive predictive value (the probability that the personidentified as high risk went on to repeat self-harm),negative predictive value (the probability that the personidentified as low risk did not repeat self-harm), positivelikelihood ratio (the increased likelihood of a high riskscale result in a person who repeated self-harm vs. onewho did not), negative likelihood ratio (the decreasedlikelihood of a low risk scale result in a person who re-peated self-harm vs. one who did not) and diagnosticodds ratio (the odds of a high risk scale result in a per-son who repeated self-harm vs. one who did not).Receiver operator characteristic (ROC) curves, whichshow sensitivity on the y-axis and 1 minus specificity onthe x-axis for all possible scale thresholds were plotted[24]. The area under the curve (AUC), based on thepublished cut-off points for each scale, was also calcu-lated. The AUC represents the overall proportion ofcases correctly predicted by the test; an AUC of 0.5would suggest the test does not perform any better thanchance while an AUC of 1.0 indicates every case is pre-dicted correctly. Chi-square tests were used to examinedifferences in the AUC between subgroups. Stata V.13.1and OpenEpi were used for the analyses.
ResultsCharacteristics of the cohortThe 4000 self-harm presentations involved 3157 individ-uals. 60% (2411) of episodes were by females, 14% (552)by individuals aged 18 or under and 22% (892) aged45 years or over. The majority of episodes involved self-poisoning with drugs or other substances (81%, 3241)and 19% (759) presentations were by individuals whohad self-injured. 55% (2206) of episodes received a psy-chosocial assessment. In 2759 (69%) of the episodes,
individuals had a previous history of self-harm. 28%(1133) of episodes were followed by a repeat episodewithin 6 months. Amongst the 3962 episodes in whichindividuals could be followed up for mortality status, theincidence of suicide was 0.5% (n = 18).
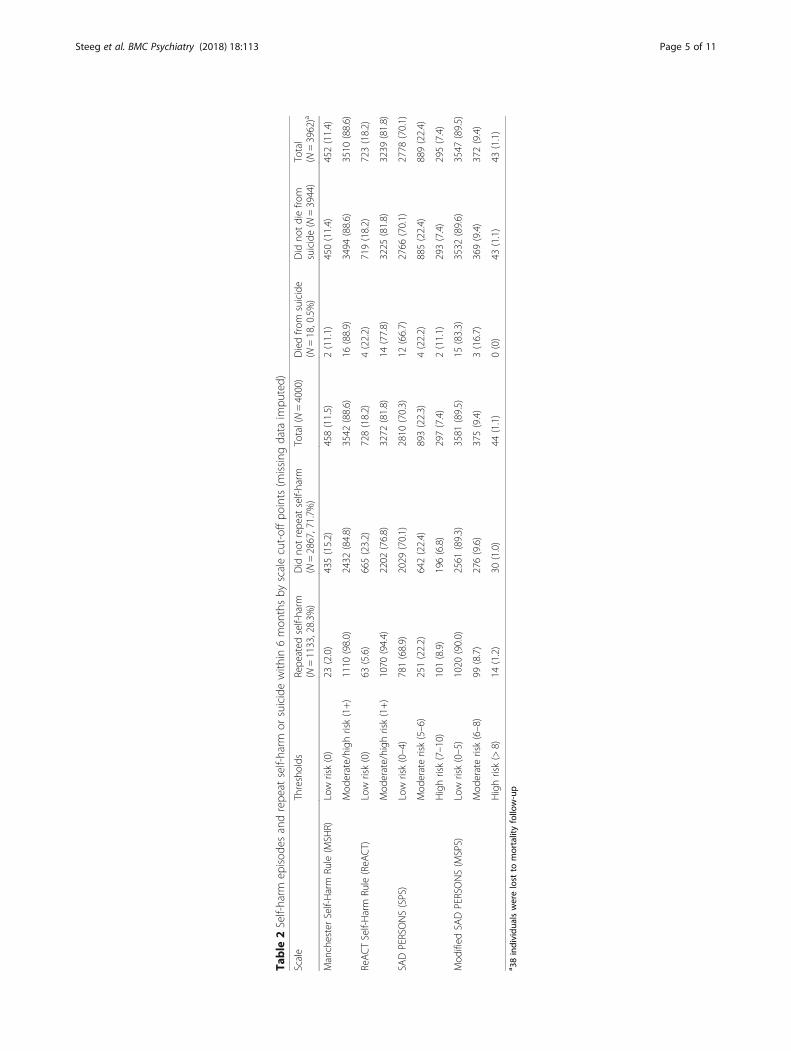
Repeat self-harm within six months by scale cut-offpointsFor the MSHR and ReACT the majority of the episodesthat were followed by a repeat episode in the subsequent6 months were identified as moderate to high risk(Table 2). The MSHR and ReACT both had high sensi-tivity for identifying repeat self-harm (98% and 94%respectively) alongside relatively low specificity for iden-tifying those that did not go on to repeat (15% and 23%respectively) (Table 3). The reverse pattern was seen forthe SPS and the MSPS: relatively low sensitivity withhigh specificity resulted in the correct prediction of themajority of episodes that were not followed by repetitionof self-harm as low risk. Positive predictive values weresimilar across the four scales. The positive likelihood ra-tios for a high risk result on the scales were between 1.2(MSHR) and 1.3 (MSPS). The overall area under thecurve (the proportion of episodes correctly identified bythe scales) was highest for the MSHR and ReACT (both71%) and was approximately equivalent to chance forthe SPS (51%) and the MSPS (49%) (Fig. 1).
Suicide within six months by scale cut-off pointsOnly two people who died by suicide (11% of all suicides)were identified as low risk by the MSHR and four (22%)by ReACT (Table 2). However two thirds of the suicides(12/18) were categorised as low risk by the SPS and over80% (15/18) by the MSPS. There were no suicide deathsidentified as high risk by the MSPS (Table 2). The MSHRand ReACT had relatively high sensitivity for predicting
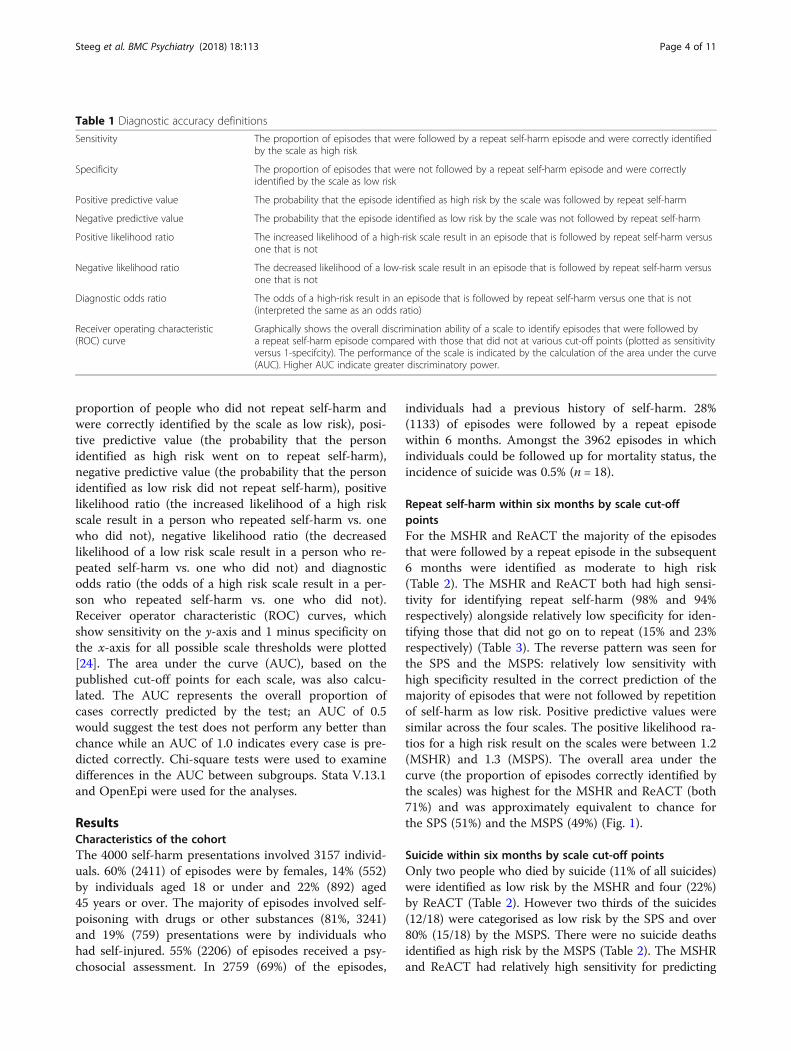
Table 1 Diagnostic accuracy definitions
Sensitivity The proportion of episodes that were followed by a repeat self-harm episode and were correctly identifiedby the scale as high risk
Specificity The proportion of episodes that were not followed by a repeat self-harm episode and were correctlyidentified by the scale as low risk
Positive predictive value The probability that the episode identified as high risk by the scale was followed by repeat self-harm
Negative predictive value The probability that the episode identified as low risk by the scale was not followed by repeat self-harm
Positive likelihood ratio The increased likelihood of a high-risk scale result in an episode that is followed by repeat self-harm versusone that is not
Negative likelihood ratio The decreased likelihood of a low-risk scale result in an episode that is followed by repeat self-harm versusone that is not
Diagnostic odds ratio The odds of a high-risk result in an episode that is followed by repeat self-harm versus one that is not(interpreted the same as an odds ratio)
Receiver operating characteristic(ROC) curve
Graphically shows the overall discrimination ability of a scale to identify episodes that were followed bya repeat self-harm episode compared with those that did not at various cut-off points (plotted as sensitivityversus 1-specifcity). The performance of the scale is indicated by the calculation of the area under the curve(AUC). Higher AUC indicate greater discriminatory power.
Steeg et al. BMC Psychiatry (2018) 18:113 Page 4 of 11
Table
2Self-harm
episod
esandrepe
atself-harm
orsuicidewith
in6mon
thsby
scalecut-offpo
ints(m
issing
data
impu
ted)
Scale
Thresholds
Repe
ated
self-harm
(N=1133,28.3%
)Did
notrepe
atself-harm
(N=2867,71.7%
)Total(N=4000)
Diedfro
msuicide
(N=18,0.5%)
Did
notdiefro
msuicide(N
=3944)
Total
(N=3962)a
ManchesterSelf-Harm
Rule(M
SHR)
Low
risk(0)
23(2.0)
435(15.2)
458(11.5)
2(11.1)
450(11.4)
452(11.4)
Mod
erate/high
risk(1+)
1110
(98.0)
2432
(84.8)
3542
(88.6)
16(88.9)
3494
(88.6)
3510
(88.6)
ReACTSelf-Harm
Rule(ReA
CT)
Low
risk(0)
63(5.6)
665(23.2)
728(18.2)
4(22.2)
719(18.2)
723(18.2)
Mod
erate/high
risk(1+)
1070
(94.4)
2202
(76.8)
3272
(81.8)
14(77.8)
3225
(81.8)
3239
(81.8)
SADPERSONS(SPS)
Low
risk(0–4)
781(68.9)
2029
(70.1)
2810
(70.3)
12(66.7)
2766
(70.1)
2778
(70.1)
Mod
eraterisk(5–6)
251(22.2)
642(22.4)
893(22.3)
4(22.2)
885(22.4)
889(22.4)
Highrisk(7–10)
101(8.9)
196(6.8)
297(7.4)
2(11.1)
293(7.4)
295(7.4)
Mod
ified
SADPERSONS(M
SPS)
Low
risk(0–5)
1020
(90.0)
2561
(89.3)
3581
(89.5)
15(83.3)
3532
(89.6)
3547
(89.5)
Mod
eraterisk(6–8)
99(8.7)
276(9.6)
375(9.4)
3(16.7)
369(9.4)
372(9.4)
Highrisk(>
8)14
(1.2)
30(1.0)
44(1.1)
0(0)
43(1.1)
43(1.1)
a 38individu
alswerelost
tomortalityfollow-up
Steeg et al. BMC Psychiatry (2018) 18:113 Page 5 of 11

Table
3Measuresof
diagno
sticaccuracy
aforrepe
atself-harm
with
95%
confiden
ceintervals,N=4000,m
(missing
data
impu
tatio
n)=1–5
Scale
Thresholds
Sens
%Spec
%PPV%
NPV
%LR+
LR-
DOR
MSH
RLow
risk(0)vs.m
oderate/high
risk(1+)
98(97,99)
15(14,17)
31(30,33)
95(93,97)
1.155(1.154,1.156)
0.13
(0.12,0.15)
8.6(5.6,13.2)
ReACT
Low
risk(0)vs.m
oderate/high
risk(1+)
94(93,96)
23(22,25)
33(31,34)
91(89,93)
1.23
(1.228,1.231)
0.240(0.230,0.250)
5.1(3.9,6.7)
SPS
Low
risk(0–4)vs.m
oderaterisk(5–6)
24(22,27)
76(74,78)
28(25,31)
72(71,74)
1.01
(0.98,1.04)
0.996(0.993,0.999
1.0(0.9,1.2)
Mod
eraterisk(5–6)v
s.high
risk(7–10)
29(24,34)
77(74,79)
34(29,40)
72(69,75)
1.23
(1.16,1.30)
0.931(0.923,0.939)
1.3(1.0,1.7)
MSPS
Low
risk(0–5)vs.m
oderaterisk(6–8)
9(7,11)
90(89,91)
26(22,31)
72(70,73)
0.9(0.7,1.1)
1.01
(1.008,1.012)
0.9(0.7,1.1)
Mod
eraterisk(6–8)v
s.high
risk(>
8)12
(7,20)
90(86,93)
32(19,48)
74(69,78)
1.3(0.4,3.6)
0.97
(0.95,0.99)
1.3(0.7,2.6)
a Senssensitivity,Specspecificity,P
PVpo
sitiv
epred
ictiv
evalue,
NPV
nega
tivepred
ictiv
evalue,
LR+po
sitiv
elikelihoo
dratio
,LR-
nega
tivelikelihoo
dratio
,DORdiag
nosticod
dsratio
Steeg et al. BMC Psychiatry (2018) 18:113 Page 6 of 11

suicide, while the SPS and the MSPS had higher specificity(Table 4).
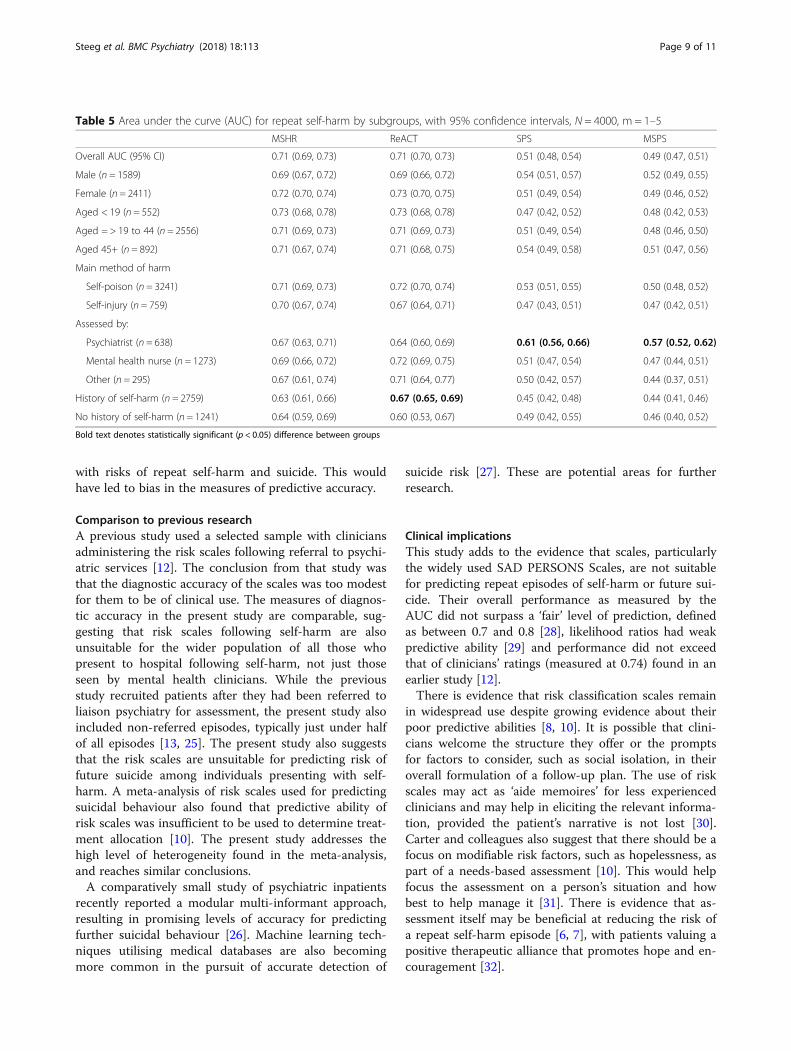
Differences by subgroupsThere were few differences in overall predictive accuracy(AUC) by subgroups (Table 5). There was higher AUC forepisodes assessed by a psychiatrist for both the SPS(area under the curve 0.61, p = 0.003) and the MSPS(0.57, p = 0.001) than those assessed by a mentalhealth nurse, by another profession or not assessed. TheReACT risk scale performed worse amongst episodesinvolving individuals with no prior episode of self-harm(0.60) compared to individuals with a history of self-harm(0.67, p = .0.02). However, the absolute differences be-tween subgroups were small (Table 5).
Sensitivity analysisIn sensitivity analysis with missing items imputed as notpresent, the MSHR and ReACT again performed withrelatively high sensitivity and low specificity, though sen-sitivities were lower and specificities higher, due to moreindividuals being rated as low risk (Additional file 1:Table S2). The measures of predictive accuracy of theSPS and MSPS were broadly similar to those in the mainanalyses. When we included only those cases withcomplete data for all scale items for the MSHR andReACT scales, sensitivity was similar but specificity waslower. For the MSHR, 30.4% (981/3228) of episodeswere followed by repetition of self-harm, sensitivity was99.2% and specificity was 7.4%. For ReACT, the repeatrate was 27.2% (668/2459), sensitivity was 94.3% andspecificity was 20.0%.
DiscussionMain findingsThe MSHR and ReACT performed with high sensitivitybut low specificity for prediction of repeat self-harm.This resulted in a large proportion of episodes that werenot followed by repetition being placed in the higher riskcategory. The overall area under the curve for thesescales was fair. The SPS and the MSPS had lower sensi-tivity and higher specificity, resulting in the majority ofepisodes that resulted in repetition being identified aslow risk. The SPS and the MSPS were no better thanchance in terms of overall predictive accuracy. The SPSand the MSPS identified the majority of suicide deathsas low risk.
Strengths and limitationsSome scale items were not available across all sites. Toavoid over-estimating the prevalence of risk factors, weassumed the item was not present if data were missing.Furthermore, if there was evidence that the prevalenceof a scale item was over-estimated in non-assessed epi-sodes, missing items were imputed as absent for all non-assessed episodes before multiple imputation. The effectof this on the measures of predictive accuracy would beto underestimate sensitivity (due to fewer meeting thecriteria for ‘high risk’) and overestimate specificity (dueto more meeting the criteria for ‘low risk’). When theperformance of the MSHR and the ReACT scales, thetwo best performing scales in this study, was tested oncases with complete data for all scales items, measuresof sensitivity were similar and specificities were lower.This suggests our imputation approach did not lead toover-estimation of the performance of these two scales.The data for this study were obtained from observa-
tional self-harm cohorts with data extracted from hos-pital records and clinical notes. It was necessary to useproxy variables for certain scale items where an exactcorresponding variable was not available, which is a limi-tation of this study. In addition, for some scale items,corresponding variables could be recorded differently ac-cording to the study centre. For example, suicidal intentwas derived from the Suicide Intent Scale in three cen-tres and from a binary variable in another centre. Thiswould have had most impact on the SAD PERSONSScales, due to the higher number of scale items. How-ever, the measures of diagnostic accuracy are in line witha previous study which showed the area under the curveto be no better than chance for the SPS [17]. Further-more, this novel approach resulted in a more representa-tive, real-world sample of self-harm episodes and theirmanagement.A potential source of bias in this study could have
arisen if percieved risk influenced subsequent clinicalmanagement, which in turn may have been associated
Fig. 1 Receiver operator characteristic curves (multiply imputeddata, N = 4000) for the four scales (MSHR: Manchester Self-HarmRule; ReACT: ReACT Self-Harm Rule; SPS: SAD PERSONS Scale;MSPS: Modified SAD PERSONS Scale)
Steeg et al. BMC Psychiatry (2018) 18:113 Page 7 of 11

Table
4Measuresof
diagno
sticaccuracy
aforsuicidewith
95%
confiden
ceintervals,N=3962,m
=1–5
Scale
Thresholds
Sens
%Spec
%PPV%
NPV
%LR+
LR-
DOR
MSH
RLow
risk(0)vs.m
oderate/high
risk(1+)
89(65,99)
11(10,12)
0.5(0.3,0.7)
99.6(98.4,99.9)
1.003(0.99,1.02)
0.97
(0.35,2.68)
1.03
(0.24,4.50)
ReACT
Low
risk(0)vs.m
oderate/high
risk(1+)
78(52,94)
18(17,19)
0.4(0.2,0.7)
99.5(98.6,99.9)
0.95
(0.91,0.99)
1.2(0.74,2.0)
0.8(0.3,2.4)
SPS
Low
risk(0–4)v
s.mod
eraterisk(5–6)
25(7,52)
76(74,77)
0.5(0.1,1.2)
99.6(99.3,99.8)
1.0(0.2,4.5)
1.0(0.8,1.2
1.0(0.4,3.2)
Mod
eraterisk(5–6)vs.highrisk(7–10)
33(4,77)
75(73,78)
0.7(0.1,2.4)
99.6(98.9,99.9)
1.3(0.2,9.6)
0.9(0.5,1.5)
1.5(0.3,8.3)
MSPS
Low
risk(0–5)v
s.mod
eraterisk(6–8)
17(4,41)
91(90,91)
0.8(0.2,2.3)
99.6(99.3,99.8)
1.8(0.1,4.5)
0.9(0.8,1.0)
1.9(0.6,6.6)
Mod
eraterisk(6–8)vs.highrisk(>
8)0(0,71)
90(86,92)
0(0,8)
99.2(97.7,99.8)
-b–
–a Senssensitivity,Specspecificity,P
PVpo
sitiv
epred
ictiv
evalue,
NPV
nega
tivepred
ictiv
evalue,
LR+po
sitiv
elikelihoo
dratio
,LR-
nega
tivelikelihoo
dratio
,DORdiag
nosticod
dsratio
bNosuicides
wereiden
tifiedas
high
riskby
theMSP
S
Steeg et al. BMC Psychiatry (2018) 18:113 Page 8 of 11
with risks of repeat self-harm and suicide. This wouldhave led to bias in the measures of predictive accuracy.
Comparison to previous researchA previous study used a selected sample with cliniciansadministering the risk scales following referral to psychi-atric services [12]. The conclusion from that study wasthat the diagnostic accuracy of the scales was too modestfor them to be of clinical use. The measures of diagnos-tic accuracy in the present study are comparable, sug-gesting that risk scales following self-harm are alsounsuitable for the wider population of all those whopresent to hospital following self-harm, not just thoseseen by mental health clinicians. While the previousstudy recruited patients after they had been referred toliaison psychiatry for assessment, the present study alsoincluded non-referred episodes, typically just under halfof all episodes [13, 25]. The present study also suggeststhat the risk scales are unsuitable for predicting risk offuture suicide among individuals presenting with self-harm. A meta-analysis of risk scales used for predictingsuicidal behaviour also found that predictive ability ofrisk scales was insufficient to be used to determine treat-ment allocation [10]. The present study addresses thehigh level of heterogeneity found in the meta-analysis,and reaches similar conclusions.A comparatively small study of psychiatric inpatients
recently reported a modular multi-informant approach,resulting in promising levels of accuracy for predictingfurther suicidal behaviour [26]. Machine learning tech-niques utilising medical databases are also becomingmore common in the pursuit of accurate detection of
suicide risk [27]. These are potential areas for furtherresearch.
Clinical implicationsThis study adds to the evidence that scales, particularlythe widely used SAD PERSONS Scales, are not suitablefor predicting repeat episodes of self-harm or future sui-cide. Their overall performance as measured by theAUC did not surpass a ‘fair’ level of prediction, definedas between 0.7 and 0.8 [28], likelihood ratios had weakpredictive ability [29] and performance did not exceedthat of clinicians’ ratings (measured at 0.74) found in anearlier study [12].There is evidence that risk classification scales remain
in widespread use despite growing evidence about theirpoor predictive abilities [8, 10]. It is possible that clini-cians welcome the structure they offer or the promptsfor factors to consider, such as social isolation, in theiroverall formulation of a follow-up plan. The use of riskscales may act as ‘aide memoires’ for less experiencedclinicians and may help in eliciting the relevant informa-tion, provided the patient’s narrative is not lost [30].Carter and colleagues also suggest that there should be afocus on modifiable risk factors, such as hopelessness, aspart of a needs-based assessment [10]. This would helpfocus the assessment on a person’s situation and howbest to help manage it [31]. There is evidence that as-sessment itself may be beneficial at reducing the risk ofa repeat self-harm episode [6, 7], with patients valuing apositive therapeutic alliance that promotes hope and en-couragement [32].
Table 5 Area under the curve (AUC) for repeat self-harm by subgroups, with 95% confidence intervals, N = 4000, m = 1–5
MSHR ReACT SPS MSPS
Overall AUC (95% CI) 0.71 (0.69, 0.73) 0.71 (0.70, 0.73) 0.51 (0.48, 0.54) 0.49 (0.47, 0.51)
Male (n = 1589) 0.69 (0.67, 0.72) 0.69 (0.66, 0.72) 0.54 (0.51, 0.57) 0.52 (0.49, 0.55)
Female (n = 2411) 0.72 (0.70, 0.74) 0.73 (0.70, 0.75) 0.51 (0.49, 0.54) 0.49 (0.46, 0.52)
Aged < 19 (n = 552) 0.73 (0.68, 0.78) 0.73 (0.68, 0.78) 0.47 (0.42, 0.52) 0.48 (0.42, 0.53)
Aged = > 19 to 44 (n = 2556) 0.71 (0.69, 0.73) 0.71 (0.69, 0.73) 0.51 (0.49, 0.54) 0.48 (0.46, 0.50)
Aged 45+ (n = 892) 0.71 (0.67, 0.74) 0.71 (0.68, 0.75) 0.54 (0.49, 0.58) 0.51 (0.47, 0.56)
Main method of harm
Self-poison (n = 3241) 0.71 (0.69, 0.73) 0.72 (0.70, 0.74) 0.53 (0.51, 0.55) 0.50 (0.48, 0.52)
Self-injury (n = 759) 0.70 (0.67, 0.74) 0.67 (0.64, 0.71) 0.47 (0.43, 0.51) 0.47 (0.42, 0.51)
Assessed by:
Psychiatrist (n = 638) 0.67 (0.63, 0.71) 0.64 (0.60, 0.69) 0.61 (0.56, 0.66) 0.57 (0.52, 0.62)
Mental health nurse (n = 1273) 0.69 (0.66, 0.72) 0.72 (0.69, 0.75) 0.51 (0.47, 0.54) 0.47 (0.44, 0.51)
Other (n = 295) 0.67 (0.61, 0.74) 0.71 (0.64, 0.77) 0.50 (0.42, 0.57) 0.44 (0.37, 0.51)
History of self-harm (n = 2759) 0.63 (0.61, 0.66) 0.67 (0.65, 0.69) 0.45 (0.42, 0.48) 0.44 (0.41, 0.46)
No history of self-harm (n = 1241) 0.64 (0.59, 0.69) 0.60 (0.53, 0.67) 0.49 (0.42, 0.55) 0.46 (0.40, 0.52)
Bold text denotes statistically significant (p < 0.05) difference between groups
Steeg et al. BMC Psychiatry (2018) 18:113 Page 9 of 11
The SPS and MSPS performed slightly better forepisodes assessed by a psychiatrist, though the per-formance was still below those of the ReACT andMSHR scales. Episodes assessed by a psychiatrist weremore likely to involve individuals with a history ofself-harm but not currently receiving treatment. Theepisodes by individuals assessed by psychiatrists werealso more likely to be rated as moderate or high riskthan low risk on both the SPS and the MSPS com-pared to episodes assessed by mental health nurses.In addition, the overall predictive accuracy of theReACT scale was lower for episodes where individualshad no history of self-harm. These individuals wereless likely to repeat self-harm, and the specificity waslower (16%), suggesting the incorrect identification ofepisodes that did not repeat resulted in reduced over-all performance. However, the difference in predictiveaccuracy between these groups was small and is un-likely to be of major clinical importance.
ConclusionThe findings of this study support existing clinicalguidance, which suggests scales that classify patientsinto risk categories should not be used alone to allo-cate treatment or predict future risk of further self-harm or suicide. There was no evidence to supportthe use of risk scales with particular subgroups of pa-tients. While scales with high sensitivity may havesome clinical use when considered alongside a com-prehensive assessment [15], they are not suitable forthe purpose of prediction. Given that scales continueto be widely used by clinicians, future studies couldconsider if they could be combined with other ap-proaches to increase their effectiveness. For example,randomised controlled trials could combine structuredrisk assessment with other aspects of care, such ascomprehensive follow-up planning or building thera-peutic alliance. A study carried out recently in theUnited States found that screening in the ED com-bined with a brief intervention consisting of a numberof components (including safety planning and follow-up telephone calls), was associated with reductions inrepeat suicide attempts and overall number of repeatattempts [33]. Further studies of this kind could helpto determine aspects of risk scales that might be use-ful in the management of self-harm.
Additional file
Additional file 1: Supplementary tables: additional information aboutthe risk scales and their items. Description of material: Table S1. Riskscales tested in the predicting risk of repeat self-harm cohort study,Table S2. Risk scale items and corresponding variables from the self-harm cohort studies. (DOCX 23 kb)
AbbreviationsAUC: Area under the curve; ED: Emergency Department; MSHR: ManchesterSelf-Harm Rule; MSPS: Modified SAD PERSONS Scale; ONS: Office for NationalStatistics; ReACT: ReACT Self-Harm Rule; ROC: Receiver operatingcharacteristic; SPS: SAD PERSONS Scale
AcknowledgementsThe authors would like to thank Dr. Matthew Carr at the University ofManchester for statistical advice.
FundingThis paper presents independent research funded by the National Instituteof Health Research (NIHR) under its Programme Grants for Applied ResearchProgramme (Grant Reference Number RP-PG-0610-10026). The viewsexpressed are those of the authors and not necessarily those of the NHS, theNIHR or the Department of Health. K.H. and D.G. are NIHR Senior Investigators.K.H. is also supported by the Oxford Health NHS Foundation Trust and N.K. bythe Greater Manchester Mental Health NHS Foundation Trust.
Availability of data and materialsThe datasets used and analysed during the current study are not publicallyavailable. They are subject to strict data confidentiality policies at each siteand only aggregated data is published.
Authors’ contributionsNK, JC, ROC, DG and KH designed the study with input from SS and LQ. SS,LQ, DC, CC, DK, JN and RC extracted and processed the data. SS analysedthe data. All authors interpreted the results and SS wrote the first draft. Allthe authors contributed to subsequent drafts and have approved the finalversion of the manuscript.
Ethics approval and consent to participateThe self-harm monitoring system in Oxford was approved by South Central– Berkshire National Research Ethics Service and Derbyshire Research EthicsCommittee approved the study in Derby. Both were granted ethical approvalto collect data for both local and multicentre projects. South ManchesterResearch Ethics Committee reviewed the project in Manchester. The projectwas deemed not to require approval as the monitoring is conducted as partof a clinical audit system. The Bristol Self-Harm Surveillance Centre receivedethical approval from University Hospitals Bristol NHS Foundation Trust andSouthmead Research Ethics Committee approved the research database. Allcentres have approval under section 251 of the NHS Act (2006) to collectpatient identifiable data without patient consent and Oxford, Derby andManchester have consent to send patient details to the Data LinkageService.
Competing interestsD.G., K.H. and N.K. are members of the Department of Health’s (England)National Suicide Prevention Advisory Group. N.K. chaired the NICE guidelinedevelopment group for the longer-term management of self-harm and theNICE Topic Expert Group (which developed the quality standards for self-harm services). He is currently chair of the updated NICE guideline fordepression. R.O.C. was a member of the NICE guideline development groupfor the longer-term management of self-harm and is a member of theScottish Government’s suicide prevention implementation and monitoringgroup. All other authors declare no conflict of interest.
Publisher’s NoteSpringer Nature remains neutral with regard to jurisdictional claims inpublished maps and institutional affiliations.
Author details1Centre for Mental Health and Safety, Manchester Academic Health ScienceCentre, University of Manchester, Manchester, England. 2Centre for SuicideResearch, University of Oxford Department of Psychiatry, Warneford Hospital,Oxford, England. 3Centre for Self-harm and Suicide Prevention Research,Derbyshire Healthcare NHS Foundation Trust, Derby, England. 4PopulationHealth Sciences, Bristol Medical School, University of Bristol, Bristol, England.5Institute of Population Health, University of Manchester, Manchester,England. 6Suicidal Behaviour Research Laboratory, Institute of Health and
Steeg et al. BMC Psychiatry (2018) 18:113 Page 10 of 11
Wellbeing, University of Glasgow, Glasgow, Scotland. 7Greater ManchesterMental Health NHS Foundation Trust, Manchester, England.
Received: 23 January 2018 Accepted: 16 April 2018
References1. Hawton K, Bergen H, Casey D, Simkin S, Palmer B, Cooper J, Kapur N,
Horrocks J, House A, Lilley R, et al. Self-harm in England: a tale of threecities - multicentre study of self-harm. Soc Psychiatry Psychiatr Epidemiol.2007;42(7):513–21.
2. Carroll R, Metcalfe C, Gunnell D. Hospital presenting self-harm and risk offatal and non-fatal repetition: systematic review and meta-analysis. PLoSOne. 2014;9(2):e89944.
3. Bergen H, Hawton K, Waters K, Ness J, Cooper J, Steeg S, Kapur N.Premature death after self-harm: a multicentre cohort study. Lancet. 2012;380(9853):1568–74.
4. Ness J, Hawton K, Bergen H, Cooper J, Steeg S, Kapur N, Clarke M, Waters K.Alcohol use and misuse, self-harm and subsequent mortality: anepidemiological and longitudinal study from the multicentre study of self-harm in England. Emerg Med J. 2015;32(10):793–9.
5. NICE. The long term care and treatment of self-harm. Clinical guideline 133.London: National Institute of Health and Care Excellence; 2011.
6. Kapur N, Steeg S, Webb R, Haigh M, Bergen H, Hawton K, Ness J, Waters K,Cooper J. Does clinical management improve outcomes following self-harm? Results from the multicentre study of self-harm in England. PLoSOne. 2013;8(8):e70434.
7. Steeg S, Emsley R, Carr M, Cooper J, Kapur N. Routine hospital managementof self-harm and risk of further self-harm: propensity score analysis usingrecord-based cohort data. Psychol Med. 2017;48(2):1–12.
8. Quinlivan L, Cooper J, Steeg S, Davies L, Hawton K, Gunnell D, Kapur N.Scales for predicting risk following self-harm: an observational study in 32hospitals in England. BMJ Open. 2014;4(5):e004732.
9. Quinlivan L, Cooper J, Davies L, Hawton K, Gunnell D, Kapur N. Which arethe most useful scales for predicting repeat self-harm? A systematic reviewevaluating risk scales using measures of diagnostic accuracy. BMJ Open.2016;6(2):e009297.
10. Carter G, Milner A, McGill K, Pirkis J, Kapur N, Spittal MJ. Predicting suicidalbehaviours using clinical instruments: systematic review and meta-analysisof positive predictive values for risk scales. Br J Psychiatry. 2017;210(6):387-+.
11. Katz C, Randall JR, Sareen J, Chateau D, Walld R, Leslie WD, Wang J, BoltonJM. Predicting suicide with the SAD PERSONS scale. Depress Anxiety. 2017;34(9):809–16.
12. Quinlivan L, Cooper J, Meehan D, Longson D, Potokar J, Hulme T, MarsdenJ, Brand F, Lange K, Riseborough E, et al. Predictive accuracy of risk scalesfollowing self-harm: multicentre, prospective cohort study. Br J Psychiatry.2017;210(6):429-+.
13. Cooper J, Steeg S, Bennewith O, Lowe M, Gunnell D, House A, Hawton K,Kapur N. Are hospital services for self-harm getting better? An observationalstudy examining management, service provision and temporal trends inEngland. BMJ Open. 2013;3(11):e003444.
14. Cooper J, Kapur N, Dunning J, Guthrie E, Appleby L, Mackway-Jones K. Aclinical tool for assessing risk after self-harm. Ann Emerg Med. 2006;48(4):459–66.
15. Steeg S, Kapur N, Webb R, Applegate E, Stewart SLK, Hawton K, Bergen H,Waters K, Cooper J. The development of a population-level clinicalscreening tool for self-harm repetition and suicide: the ReACT Self-HarmRule. Psychol Med. 2012;42(11):2383–94.
16. Patterson WM, Dohn HH, Bird J, Patterson GA. Evaluation of suicidal patients- the sad persons scale. Psychosomatics. 1983;24(4):343-&.
17. Bolton J, Rae Spiwak R, Sareen J. Predicting suicide attempts with the sadpersons scale: a longitudinal analysis. J Clin Psychiatry. 2012;73(6):e735–41.
18. Beck RW, Morris JB, Beck AT. Cross-validation of suicidal-intent-scale. PsycholRep. 1974;34(2):445–6.
19. Carroll R, Metcalfe C, Gunnell D. Hospital management of self-harm patientsand risk of repetition: systematic review and meta-analysis. J Affect Disord.2014;168:476–83.
20. Kapur N, Cooper J, King-Hele S, Webb R, Lawlor M, Rodway C, Appleby L.The repetition of suicidal behavior: a multicenter cohort study. J ClinPsychiatry. 2006;67(10):1599–609.
21. Hawton K, Witt KG, Taylor Salisbury TL, Arensman E, Gunnell D, Hazell P,Townsend E, van Heeringen K. Psychosocial interventions for self-harm inadults. Cochrane Database Syst Rev. 2016;5. Art. No.: CD012189. https://doi.org/10.1002/14651858.CD012189.
22. Royston P, White IR. Multiple Imputation by Chained Equations (MICE):implementation in Stata. J Stat Softw. 2011;45(4):1–20.
23. Rubin DB. Multiple imputation for non-response in surveys. New York: JohnWiley & Sons; 1987.
24. Altman DG, Bland JM. Diagnostic-tests-3 - receiver operating characteristicplots .7. Br Med J. 1994;309(6948):188.
25. Kapur N, Murphy E, Cooper J, Bergen H, Hawton K, Simkin S, Casey D,Horrocks J, Lilley R, Noble R, et al. Psychosocial assessment following self-harm: results from the multi-centre monitoring of self-harm project. J AffectDisord. 2008;106(3):285–93.
26. Hawes M, Yaseen Z, Briggs J, Galynker I. The Modular Assessment of Risk forImminent Suicide (MARIS): a proof of concept for a multi-informant tool forevaluation of short-term. Compr Psychiatry. 2017;72:88–96.
27. Walsh CG, Ribeiro JD, Franklin JC. Predicting risk of suicide attempts overtime through machine learning. Clin Psychol Sci. 2017;5(3):457–69.
28. Metz CE. BASIC PRINCIPLES OF ROC ANALYSIS. Semin Nucl Med. 1978;8(4):283–98.
29. Hancock M, Kent P. Interpretation of dichotomous outcomes: risk, odds,risk ratios, odds ratios and number needed to treat. J Physiother. 2016;62(3):172–4.
30. Runeson B, Odeberg J, Pettersson A, Edbom T, Adamsson IJ, Waern M.Instruments for the assessment of suicide risk: a systematic reviewevaluating the certainty of the evidence. PLoS One. 2017;12(7):e0180292.
31. Ryan CJ, Large MM. Suicide risk assessment: where are we now? Med JAust. 2013;198(9):462–3.
32. Hunter C, Chantler K, Kapur N, Cooper J. Service user perspectives onpsychosocial assessment following self-ham and its impact on further help-seeking: a qualitative study. J Affect Disord. 2013;145(3):315–23.
33. Miller IW, Camargo CA Jr, Arias SA, Sullivan AF, Allen MH, Goldstein AB,Manton AP, Espinola JA, Jones R, Hasegawa K, et al. Suicide prevention inan emergency department population the ED-SAFE study. Jama Psychiatry.2017;74(6):563–70.
Steeg et al. BMC Psychiatry (2018) 18:113 Page 11 of 11