steam reforming of ethanol over sol-gel-synthesized...
TRANSCRIPT

STEAM REFORMING OF ETHANOL OVER SOL-GEL-SYNTHESIZED MIXED OXIDE CATALYSTS
A THESIS SUBMITTED TO THE GRADUATE SCHOOL OF NATURAL AND APPLIED SCIENCES
OF MIDDLE EAST TECHNICAL UNIVERSITY
BY
HAKAN ÖNDER OLCAY
IN PARTIAL FULFILLMENT OF THE REQUIREMENTS FOR
THE DEGREE OF MASTER OF SCIENCE IN
CHEMICAL ENGINEERING
JULY 2005
Approval of the Graduate School of Natural and Applied Sciences
Prof. Dr. Canan ÖZGEN
Director I certify that this thesis satisfies all the requirements as a thesis for the degree of Master of Science.
Prof. Dr. Nurcan BAÇ
Head of Department This is to certify that I have read this thesis and that in my opinion it is fully adequate, in scope and quality, as a thesis for the degree of Master of Science
Prof. Dr. Deniz ÜNER
Supervisor
Prof. Dr. Ali ÇULFAZ (METU, ChE) ________________
Prof. Dr. Deniz ÜNER (METU, ChE) ________________
Dr. N. Alper TAPAN (Gazi Univ., ChE) ________________
Kemal DEMİRKOL (TTGV) ________________
Assist. Prof. Dr. Ayşen YILMAZ (METU, Chem) ________________

iii
PLAGIARISM
I hereby declare that all information in this document has been obtained and presented in accordance with academic rules and ethical conduct. I also declare that, as required by these rules and conduct, I have fully cited and referenced all material and results that are not original to this work. Name, Last Name : Hakan Önder OLCAY
Signature :
iv
ABSTRACT
STEAM REFORMING OF ETHANOL OVER SOL-GEL-SYNTHESIZED MIXED OXIDE CATALYSTS
Olcay, Hakan Önder
M.S., Department of Chemical Engineering
Supervisor : Prof. Dr. Deniz Üner
July 2005, 91 pages Depletion in the reserves of fossil fuels, inefficient energy production from these
fuels and the negative effect of their usage on atmosphere, and thereby, on
human health have accelerated researches on clean energy. Hydrogen produced
from ethanol when used in fuel cells not only generates efficient energy but also
creates a closed carbon cycle in nature.
ZnO and Cu/ZnO catalysts are known with their superior performance in alcohol
synthesis. From the principle of microkinetic reversibility they are expected to
be superior catalysts for the steam reforming reaction of ethanol as well. ZnO
catalysts can be modified by precious, Pd, or non-precious, Cu, metals to
enhance hydrogen desorption capability, and dispersed on SiO2 for high surface
areas via sol-gel technique.
Steam reforming tests over ZnO catalysts revealed that they act only as ethanol
dehydrogenation catalysts in the temperature range of 300-500°C. Promotion
with Pd or Cu decreased hydrogen selectivity due most probably to unreachable
closed pores of the catalysts. Autothermal reforming tests over both ZnO/SiO2

v
and Co/SBA-15 catalysts, on the other hand, gave rise to the formation of
several side products.
Keywords: Ethanol Steam Reforming, Palladium, Copper, Zinc Oxide, Cobalt
vi
ÖZ
SOL-JEL İLE HAZIRLANMIŞ KARIŞIK OKSİT KATALİZÖRLER ÜZERİNDE ETANOLÜN BUHAR RİFORMLAMASI
Olcay, Hakan Önder
Yüksek Lisans, Kimya Mühendisliği Bölümü
Tez Yöneticisi : Prof. Dr. Deniz Üner
Temmuz 2005, 91 sayfa
Fosil yakıt yataklarındaki azalma, bu yakıtlardan elde edilen enerjinin verimsiz
oluşu, ve bunların kullanımının atmosfer ve insan sağlığı üzerindeki olumsuz
etkisi temiz enerji konulu araştırmalara ivme kazandırmıştır. Etanolden üretilen
hidrojen yakıt hücrelerinde kullanıldığında hem verimli enerji üretilmekte hem
de doğada kapalı bir karbon çevrimi oluşturulmaktadır.
ZnO ve Cu/ZnO katalizörler alkol sentezlemedeki üstün performanslarıyla
bilinirler. Mikrokinetik tersinirlik prensibine dayanarak bu katalizörlerin etanol
buhar riformlaması tepkimesinde de etkin rol oynayacağı düşünülmektedir. Sol-
jel tekniğiyle ZnO katalizörlerin hidrojen dezorplama yeteneğini artırmak
amacıyla Pd gibi değerli metallerle veya Cu gibi değerli olmayan metallerle
yapısı değiştirilebilir, ve bu katalizörler yüksek yüzey alanı sağlama amacıyla
SiO2 üzerine dağıtılabilir.
ZnO katalizörler üzerinde 300-500°C sıcaklıklarda gerçekleştirilen buhar
riformlaması deneyleri bu katalizörlerin sadece etanolden hidrojen koparmaya
yardımcı olduğunu göstermiştir. Pd veya Cu eklenmiş katalizörlerde yapılarında
bulunan olası kapalı gözeneklerin bir sonucu olarak daha az hidrojen seçiciliği

vii
elde edilmiştir. ZnO/SiO2 ve Co/SBA-15 katalizörler üzerinde oksijen ortamında
gerçekleştirilen düzeltim deneylerinde ise bir dizi yan ürün dağılımı elde
edilmiştir.
Anahtar Kelimeler: Etanol buhar riformlaması, Paladyum, Bakır, Çinko oksit,
Kobalt

viii
To My Grandma
ix
ACKNOWLEDGMENTS
I would like to thank Prof. Dr. Deniz Üner for her guidance, suggestions,
encouragements and valuable comments throughout this study.
I would also like to acknowledge Assist. Prof. Dr. Erol Şeker and Işıl Tezel at
Izmir Institute of Technology, Assist. Prof. Dr. Ayşen Yılmaz at Chemistry
Department, and my friends, Burcu and Mukaddes for synthesizing the catalysts
and carrying out part of their characterization tests.
I want to extend my thanks to Prof. Dr. İnci Eroğlu for lending us their chiller
which is used to provide cold stream to the coolers in the experimental setup,
and Prof. Dr. Timur Doğu for letting us use their GC calibration gas.
I also wish to express my great appreciation to the members of CaCTUS group,
and my friends, Aslı, Belma, Berker, Bilge, Canan, Ela, Hande, Serdar, Sezen
and Zeynep for their irreplaceable encouragement, good humor and partnership.
I must also say a special thank you to my high school friends for their deepest
friendship, and another special thank you to Umut for inciting me to prepare the
thesis format far long time ago.
I also want to express my gratitude to Ms. Gülten Orakçı, Ms. Mihrican
Açıkgöz, Ms. Kerime Güney, and the personnel of machine workshop of
Chemical Engineering Department for their technical assistance.
Finally, I would like to send my greatest gratitudes to my beloved family.
This study was supported by the METU Institute of Natural and Applied
Sciences Grant No: BAP-2004-07-02-00-99, and by TÜBİTAK MİSAG-241.
TÜBİTAK BAYG is kindly appreciated for the M.S. scholarship.
x
TABLE OF CONTENTS
PLAGIARISM..................................................................................................... iii
ABSTRACT ........................................................................................................ iv
ÖZ ........................................................................................................................ vi
ACKNOWLEDGMENTS ................................................................................... ix
TABLE OF CONTENTS ..................................................................................... x
LIST OF TABLES.............................................................................................. xii
LIST OF FIGURES ........................................................................................... xiii
CHAPTER
1. INTRODUCTION ......................................................................................... 1
2. LITERATURE SURVEY.............................................................................. 5
2.1. Lower and Higher Alcohol Synthesis...................................................... 5
2.2. Reaction Thermodynamics of Ethanol-Water Systems ......................... 12
2.3. Steam Reforming ................................................................................... 15
2.3.1. Studies on Supported Cu Catalysts.................................................. 15
2.3.2. Studies on Supported Group VIIIB Metal Catalysts ....................... 18
2.3.3. Comparative Studies ........................................................................ 23
3. EXPERIMENTAL AND METHODOLOGY............................................. 30
3.1. Catalysts Tested ..................................................................................... 30
3.2. Experimental Setup and Activity Measurements .................................. 31
4. RESULTS AND DISCUSSION.................................................................. 39
4.1. Characterization Results ........................................................................ 39
4.2. Reactivity Test Results .......................................................................... 40
4.2.1. Ethanol Steam Reforming................................................................ 40
4.2.2. Autothermal Reforming................................................................... 51
5. SUMMARY AND CONCLUSIONS .......................................................... 57
6. RECOMMENDATIONS............................................................................. 59
REFERENCES ................................................................................................... 61

xi
APPENDICES
A. ECONOMIC ANALYSIS .......................................................................... 64
B. CATALYST PREPARATION AND CHARACTERIZATION ................ 73
C. CALCINATION PROCEDURES AND TGA DATA OF SET I
CATALYSTS.............................................................................................. 76
D. ELEMENTAL CARBON BALANCES IN STEAM REFORMING TESTS
..................................................................................................................... 80
E. AVERAGED CALIBRATION DATA....................................................... 82
F. SAMPLE EXPERIMENTAL PROCEDURE............................................. 87
G. SETUP PICTURES .................................................................................... 88
xii
LIST OF TABLES
TABLES
1. Product distributions obtained for methyl acetate hydrogenolysis over Group
VIIIB metal catalysts of the study by Claus et al. [11] .................................... 7
2. Effects of process parameters in the study of Liguras et al. [33] ................... 21
3. Mechanisms and products in the study of Takezawa and Iwasa [37]............. 25
4. Effect of supports on H2 yield and CO2 selectivity in the study of Aupretre et
al. [4]............................................................................................................... 28
5. Summary of the results of the study by Llorca et al. [39] .............................. 28
6. Compositions of the catalysts tested............................................................... 30
7. GC settings...................................................................................................... 33
8. Flow rates and compositions of liquid and gaseous phases............................ 37
9. BET results ..................................................................................................... 40
A.1. Reaction heat and sensible heats used in the analysis [44]......................... 66
A.2. Typical constants in equation (27) for PEMFC [45] .................................. 67
A.3. Ethanol and electricity costs [46]................................................................ 68
A.4. Amounts used in preparation of Set I catalysts.......................................... 73
A.5. Calcination procedures of Set I catalysts .................................................... 76
A.6. Percent errors in elemental carbon balances............................................... 80
A.7. Sample experimental procedure.................................................................. 87

xiii
LIST OF FIGURES
FIGURES
1. World primary energy consumption by energy source [1,2] ............................ 1
2. World energy-related carbon dioxide emissions by fuel type [1,2].................. 1
3. Closed carbon cycle [8] .................................................................................... 2
4. Dominant mechanisms in higher alcohol synthesis........................................ 10
5. Adsorption of aldehydes on IB (left) and VIIIB metals [37].......................... 26
6. Experimental Setup......................................................................................... 32
7. Manifold used for GC calibration................................................................... 34
8. Heating gun (left) and syringe cleaning equipment........................................ 36
9. Effect of temperature and catalyst on hydrogen flow rate.............................. 41
10. Effect of temperature and catalyst on acetaldehyde flow rate ...................... 42
11. Deactivation in sample 1 .............................................................................. 45
12. Deactivation in sample 6 .............................................................................. 46
13. Effect of calibration data on hydrogen flow rate data .................................. 47
14. Hydrogen flow rates re-plotted using averaged calibration data .................. 48
15. Time-on-stream test of sample 1 at 500°C ................................................... 49
16. Effect of temperature and catalyst on hydrogen flow rate............................ 52
17. Effect of temperature and catalyst on acetaldehyde flow rate ...................... 53
18. Effect of temperature and catalyst on methane flow rate ............................. 54
19. Effect of temperature and catalyst on carbon dioxide flow rate ................... 55
20. Effect of temperature and catalyst on ethylene flow rate ............................. 55
A.1. Proton exchange membrane fuel cell (PEMFC) ......................................... 64
A.2. Enthalpy-temperature diagram ................................................................... 65
A.3. Money flow scheme for a system of an ethanol steam reformer and a small
PEM cell of area 10 cm2 ............................................................................. 70
A.4. Money flow scheme for a system of an ethanol autothermal reformer and a
small PEM cell of area 10 cm2 ................................................................... 71
A.5. TGA of sample 1......................................................................................... 77

xiv
A.6. TGA of sample 3......................................................................................... 78
A.7. TGA of sample 5......................................................................................... 79
A.8. Effect of temperature on quantification of hydrogen via an IS .................. 84
A.9. Effect of temperature on quantification of acetaldehyde via an IS............. 84
A.10. Effect of temperature on quantification of ethanol via an IS.................... 85
A.11. Effect of temperature on quantification of methane via an IS.................. 85
A.12. Effect of temperature on quantification of CO2 via an IS......................... 86
A.13. Effect of temperature on quantification of ethylene via an IS.................. 86
A.14. Gas cylinders and mass flow controllers .................................................. 88
A.15. Feeding unit .............................................................................................. 89
A.16. Reacting unit ............................................................................................. 90
A.17. Analyzing unit (GC) ................................................................................. 90
A.18. Manifold used in gas calibrations ............................................................. 91
1
CHAPTER 1
1. INTRODUCTION1..
World’s energy consumption depends largely on fossil fuels. More than 85% of
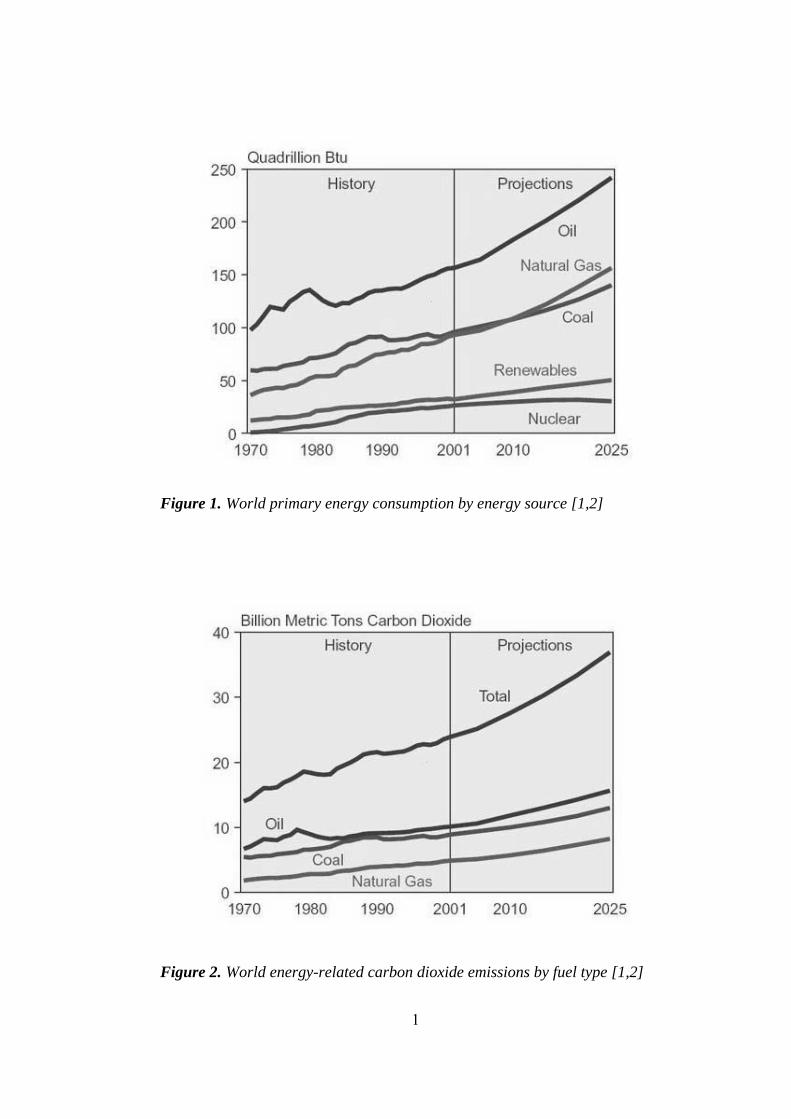
energy consumed in the last decade was obtained from fossil fuels [1]. Figure 1
illustrates the world primary energy consumption by energy source for years
1970-2001 and with predictions up to 2025.
In 1956 M. King Hubbert, a geologist with Shell Oil, observed that unrestrained
extraction of a finite resource rises along a bell-shaped curve which gives peak
when about half the resource is gone. Based on his theory, by 2060s petroleum
will be exhausted [3]. Today there is still an increasing demand for oil the
widespread usage of which in the transportation sector contributes to serious
environmental problems. As an immediate precaution automobile industry has
put into operation the usage of catalytic converters on both gasoline-fueled and
diesel-fueled engines, and particulate filters on diesel-fueled engines which
helped the emission values to decrease in one automobile; however, total
emission values continued to increase upon increasing demand [1,4]. Figure 2
illustrates world energy-related carbon dioxide emissions by fuel type from 1970
to 2001, and also presents predictions until 2025 if no further precautions are
taken. According to Kyoto Protocol signed in 1997 many countries agreed on
reducing their overall emissions of six greenhouse gases (CO2, CH4, N2O, HFCs,
PFCs and SF6) by at least 5% below 1990 levels over the period between 2008
and 2012 [5].
Both decrease in fossil fuel reserves and new regulations on emission control
lead the way to the development of new engines and alternative fuels like
1
Figure 1. World primary energy consumption by energy source [1,2]
Figure 2. World energy-related carbon dioxide emissions by fuel type [1,2]
2
hydrogen. Hydrogen can be derived from carbonaceous materials, e.g.
hydrocarbons, and/or water through electrolysis, steam reforming, thermal
dissociation or partial oxidation [6]. Biomass gasification or reforming arose as
new areas of research.
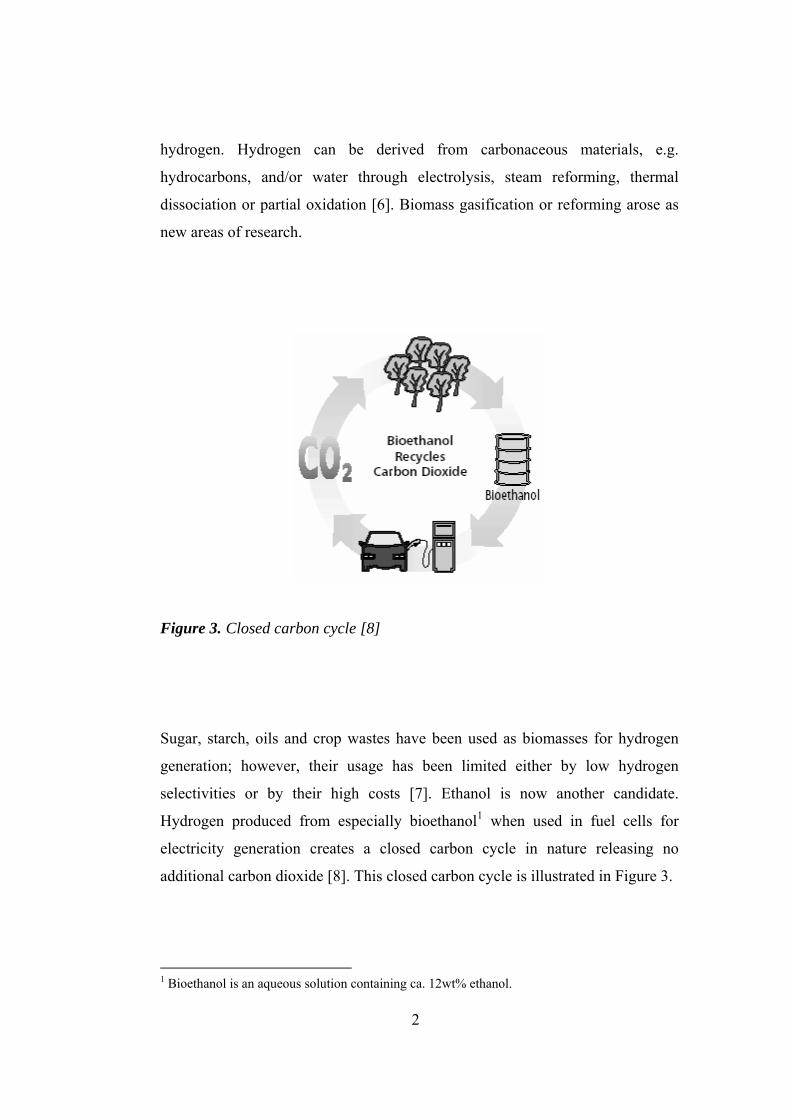
Figure 3. Closed carbon cycle [8]
Sugar, starch, oils and crop wastes have been used as biomasses for hydrogen
generation; however, their usage has been limited either by low hydrogen
selectivities or by their high costs [7]. Ethanol is now another candidate.
Hydrogen produced from especially bioethanol1 when used in fuel cells for
electricity generation creates a closed carbon cycle in nature releasing no
additional carbon dioxide [8]. This closed carbon cycle is illustrated in Figure 3.
1 Bioethanol is an aqueous solution containing ca. 12wt% ethanol.

3
Hydrogen can be produced from ethanol either by steam reforming or by direct
partial oxidation:
molkJHHCOOHOHHC oR 25642 2252 +=∆+↔+ (1)
molkJHHCOOOHHC oR /1432 222
152 +=∆+↔+ (2)
These reactions are followed by water-gas shift reaction:
molkJHHCOOHCO oR 41222 −=∆+↔+ (3)
Heat needs to be supplied either externally or internally to the system as both of
the reactions (1) and (2) are endothermic. Therefore, partial oxidation reaction
cannot take place without some external heat or without some total oxidation:
molkJHOHCOOOHHC oR 1277323 22252 −=∆+↔+ (4)
Heat generated by total oxidation reaction can also be used for steam reforming
case. This time a combination of steam reforming reaction with partial and total
oxidation reactions are under consideration along with the water-gas shift
reaction:
molkJHHCOOOHOHHC oR 68522 2222
1252 −=∆+↔++ (5)
This reaction is named as indirect partial oxidation or autothermal reaction [7,9].
In this study, sol-gel-synthesized supported zinc oxide and cobalt catalysts were
tested for their activities and selectivities towards hydrogen in ethanol steam
reforming and autothermal reforming.
Deluga et al. [7] have presented a simple economic analysis of autothermal
ethanol reforming for producing hydrogen for fuel cells. They considered a
4
totally idealized cycle starting from formation of glucose by photosynthesis and
ending up in a fuel cell through ethanol fermentation from glucose and
autothermal reforming of ethanol. They carried out the analysis taking only the
reaction enthalpies into account. Assuming an ethanol cost of $1 per gallon, they
arrived at a fuel cost of $0.04 per kWh. This value also applies for ethanol steam
reforming as this idealized system consists of same species for both reforming
cases.
An economic analysis similar to that of Deluga et al. [7], however, that rely on a
more realistic model was also carried out in this study. A fuel cost of $0.09 per
kWh was obtained at the end for both steam reforming and autothermal
reforming cases. This value in fact decreases the annual fuel cost of a gasoline
vehicle by more than a factor of two when compared with a hydrogen fuel cell
vehicle [10]. Details of this analysis are given in Appendix A.
The next chapter, Chapter 2, reviews the literature about studies on hydrogen
production from alcohols as well as on alcohol synthesis. Thermodynamics of
alcohol-water systems were also discussed in that chapter. Chapter 3, on the
other hand, describes the details of the experimental work carried out. Results of
this work are given in Chapter 4 along with comments and discussions.
Following two chapters, Chapters 5 and 6, lastly summarizes and arrives at
conclusions, and gives some recommendations, respectively.

5
CHAPTER 2
2. LITERATURE SURVEY2..
Besides being a biomass, ethanol is an alcohol. Reverse of the ethanol steam
reforming reaction (Reaction (1)) is nothing but ethanol synthesis from syngas.
Therefore, starting literature survey with alcohol synthesis studies would be very
well appropriate. In the second part, studies on reaction thermodynamics of
ethanol-water systems will be explained. The rest of this chapter will be on
various papers dealing with steam reforming of ethanol and methanol, and
possible side reactions.
2.1. Lower and Higher Alcohol Synthesis
Catalysts are substances that change the reaction rate by promoting a different
mechanism for the reaction without being consumed in the reaction. As they
decrease the activation energy barrier of the reaction, from the principle of
microkinetic reversibility, they also decrease the activation energy barrier for the
reverse of that reaction. In this respect, it may be expected for a good higher
alcohol synthesis catalyst also to be a good steam reforming catalyst.
Claus et al. [11] listed the routes for ethanol synthesis available in literature.
According to their analysis, there are mainly four economically attractive routes
to ethanol:
1. Ethylene hydration: OHHCOHHC 52242 ↔+
2. Hydrocarbonylation of methanol: 25223 OOHHCOHCOOHCH +↔++
3. Synthesis from syngas: OHCHHCO 322 ↔+

6
4. Hydrogenolysis of acetate
It is known that acetate production takes place in two steps:
• Methanol carbonylation to acetic acid: COOHCHCOOHCH 33 ↔+
• Esterification of acetic acid with methanol or ethanol:
OHCOOCHCHOHCHCOOHCH 23333 +↔+ or,
( ) OHCHOCHOCCHOHCHCHCOOHCH 2323233 +↔+
Claus et al. have studied the selective hydrogenolysis of methyl and ethyl acetate
to ethanol over different copper-based and supported Group VIII metal (Pd, Rh,
Pt, Co, Ni) catalysts (CuO/MgO-SiO2, CuO/ZnO/Fe2O3, CuO/ZnO, CuO/Al2O3-
SiO2, CuO/ZnO/MnO/Al2O3, Co/TiO2, Co-Rh/TiO2, Co-Rh-Fe/TiO2, Co-Rh-
Cu/TiO2, Ni/SiO2, Pd/Al2O3, Zn-Pd/Al2O3, Rh on activated carbon, Rh/Al2O3,
Pt/Al2O3, Co/TiO2, Co-Rh-Cu/TiO2) in the gas phase at 448-623 K and 0.1-6.0
MPa. Over copper catalysts, they proposed the following reaction mechanism to
take place:
I. OHCHOHCHCHHCOOCHCH 323233 2 +↔+
II. OHCHCHCOOCHCHOHCHCHCOOCHCH 33232333 +↔+
III. OHCHCHOHCHCHCOOCHCH 23422323 +↔+
IV. OHCHCHHOHC 23242 ↔+
Product distribution for Cu catalysts contains ethanol, methanol, ethyl acetate
and above 260°C, methane and ethane. It is the CuO/MgO-SiO2 catalyst
showing the best result in ethanol synthesis as the basic MgO helps creation of
electron-rich copper sites.
Addition of Fe and Mn to the catalysts promotes ethanol synthesis changing the
side product distribution a little bit. For instance, over iron-promoted

7
CuO/ZnO/MnO/Al2O3 catalyst, acetaldehyde, 2-butanone, butanal, butanol,
butyl acetate and acetone were obtained.
Bimetallic catalysts and all Cu catalysts except CuO/Al2O3-SiO2, which showed
deactivation above 260°C, exhibit high activity and selectivity (98%). Increase
of temperature and pressure also promoted the ethanol and methanol
selectivities.
From the kinetics point of view, comparison of turnover frequencies showed that
acetaldehyde is more rapidly hydrogenated. Also, hydrogenolysis of ethyl
acetate proceeds faster than that of methyl acetate. It is further shown that over
CuO/MgO-SiO2 catalyst reaction orders with respect to methyl acetate and
hydrogen (Reaction I in the above mechanism), methyl acetate and ethanol (II),
and ethyl acetate and hydrogen (III and IV) are all equal to one.
Product distributions obtained over Group VIIIB metal catalysts are summarized
in Table 1 below.
Table 1. Product distributions obtained for methyl acetate hydrogenolysis over
Group VIIIB metal catalysts of the study by Claus et al. [11]
Catalyst Product Distribution
Ni/SiO2 Methane, ethane, COx, acetic acid
Pd/Al2O3 Ethyl acetate
Zn-Pd/Al2O3 Ethanol
Rh/Activated Carbon Acetic acid, methane, ethane
Rh/Al2O3 Methane, ethane, acetic acid, ethanol, ethyl formate,
diethyl ether
Pt/Al2O3 Ethanol, ethane, diethyl ether

8
No activity was observed on Pd/Al2O3 whereas over monometallic catalysts
comprising Rh, Pt and Ni, the hydrogenolysis of ethyl acetate is a nonselective
reaction. As a note, formation of diethyl ether over alumina supported catalysts
results from alcohol dehydration on acidic alumina.
Finally, Co/TiO2 catalyst exhibited high activity and selectivity towards ethanol.
Addition of Rh decreases selectivity due to formation of oxygenates; however,
further addition of Fe increased ethyl acetate conversion. On the other hand, Co-
Rh-Cu/TiO2 performed poor results.
Nunan et al. [12,13] have investigated the effect of Cs/Cu/ZnO and
Cs/Cu/ZnO/Me2O3 catalysts (Me = Cr, Al, Ga) with different Cs amounts on
higher alcohol synthesis at 583 K, 7.6 MPa and with H2/CO = 0.45 synthesis gas
at GHSV = 5330 liters (STP)/kg cat/h.
Alumina and chromia are commercial supports because all practical industrial
methanol synthesis catalysts are supported with alumina and chromia. They
increase the surface area and stability of the catalyst, and therefore, they are
structural promoters. They also induce the formation of side products like
dimethyl ester (which can also be inhibited by Cs doping) and hydrocarbons.
Addition of cesium promotes methanol synthesis and water-gas shift reaction, as
well as, the formation of ethanol and methyl formate. Alumina causes occlusion
of cesium by burying cesium into bulk so that C-C bonds cannot be made. As a
result over alumina supported cesium catalysts methanol is synthesized as the
only major alcohol. On the other hand, presence of alumina support promotes
total alcohol selectivity (for the case of Cs doped catalysts, in other words,
methanol selectivity). Chromia, alternatively, promotes especially higher alcohol
synthesis bearing no effect on the mechanism. When Cs is doped on the chromia
supported catalyst, selectivities to branched alcohols like 1-propanal, 2-methyl-
1-propanol, 2-methyl-1-butanol are affected.
9
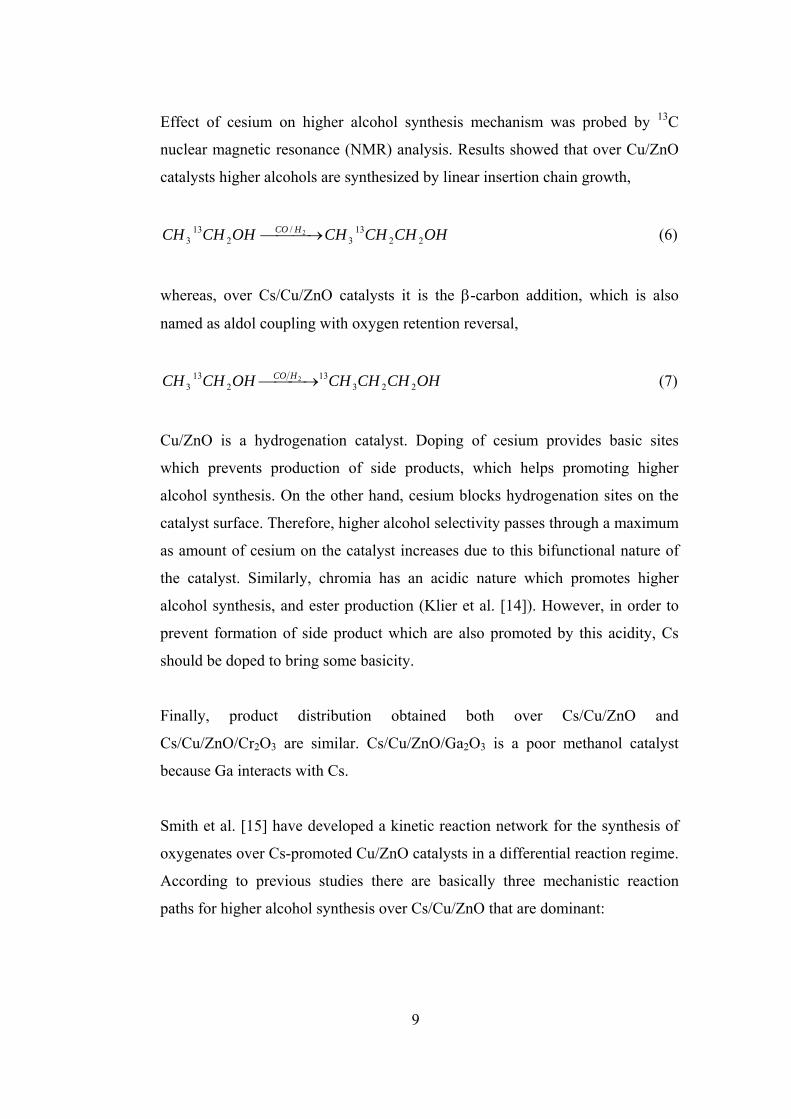
Effect of cesium on higher alcohol synthesis mechanism was probed by 13C
nuclear magnetic resonance (NMR) analysis. Results showed that over Cu/ZnO
catalysts higher alcohols are synthesized by linear insertion chain growth,
OHCHCHCHOHCHCH HCO22
133
/2
133
2⎯⎯ →⎯ (6)
whereas, over Cs/Cu/ZnO catalysts it is the β-carbon addition, which is also
named as aldol coupling with oxygen retention reversal,
OHCHCHCHOHCHCH HCO223
132
133
2⎯⎯ →⎯ (7)
Cu/ZnO is a hydrogenation catalyst. Doping of cesium provides basic sites
which prevents production of side products, which helps promoting higher
alcohol synthesis. On the other hand, cesium blocks hydrogenation sites on the
catalyst surface. Therefore, higher alcohol selectivity passes through a maximum
as amount of cesium on the catalyst increases due to this bifunctional nature of
the catalyst. Similarly, chromia has an acidic nature which promotes higher
alcohol synthesis, and ester production (Klier et al. [14]). However, in order to
prevent formation of side product which are also promoted by this acidity, Cs
should be doped to bring some basicity.
Finally, product distribution obtained both over Cs/Cu/ZnO and
Cs/Cu/ZnO/Cr2O3 are similar. Cs/Cu/ZnO/Ga2O3 is a poor methanol catalyst
because Ga interacts with Cs.
Smith et al. [15] have developed a kinetic reaction network for the synthesis of
oxygenates over Cs-promoted Cu/ZnO catalysts in a differential reaction regime.
According to previous studies there are basically three mechanistic reaction
paths for higher alcohol synthesis over Cs/Cu/ZnO that are dominant:
10
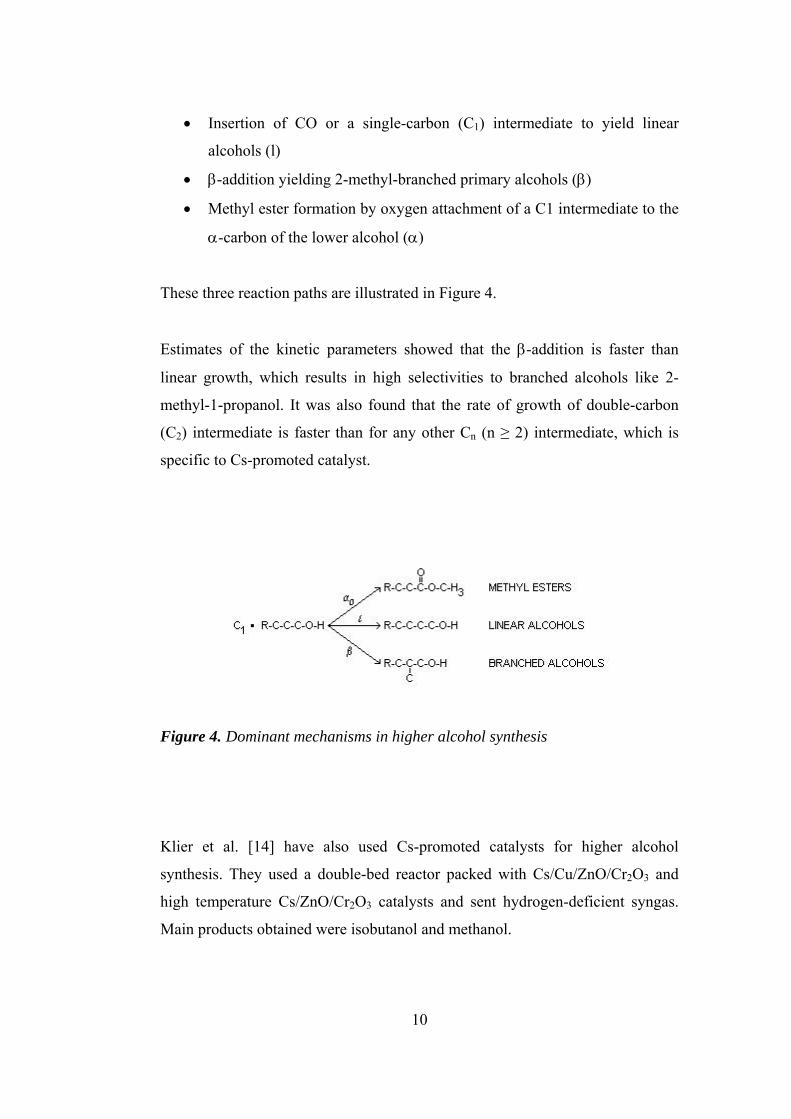
• Insertion of CO or a single-carbon (C1) intermediate to yield linear
alcohols (l)
• β-addition yielding 2-methyl-branched primary alcohols (β)
• Methyl ester formation by oxygen attachment of a C1 intermediate to the
α-carbon of the lower alcohol (α)
These three reaction paths are illustrated in Figure 4.
Estimates of the kinetic parameters showed that the β-addition is faster than
linear growth, which results in high selectivities to branched alcohols like 2-
methyl-1-propanol. It was also found that the rate of growth of double-carbon
(C2) intermediate is faster than for any other Cn (n ≥ 2) intermediate, which is
specific to Cs-promoted catalyst.
Figure 4. Dominant mechanisms in higher alcohol synthesis
Klier et al. [14] have also used Cs-promoted catalysts for higher alcohol
synthesis. They used a double-bed reactor packed with Cs/Cu/ZnO/Cr2O3 and
high temperature Cs/ZnO/Cr2O3 catalysts and sent hydrogen-deficient syngas.
Main products obtained were isobutanol and methanol.
11
They have also tested other catalysts in this dual-bed reactor system. Over SO42-
/ZrO2 and H-mordenite, a product distribution including butane, methyl-isobutyl
ether (MIBE), methyl-tertiarybutyl ether (MTBE) (minor) and dimetyl ether was
obtained. Using Amberlyst-15 instead of H-mordenite resulted in an increase in
the selectivity of MTBE. MTBE is known to be an octane enhancer; whereas,
MIBE is a potential cetane booster.
Ehwald et al. [16] have tested silica supported Rh, Rh-Mn-Li, Rh-Ir-Mn-Li, Rh-
Mn-Li-Cu-Zn and Cu-Zn catalysts, and some mixtures of these catalysts for
ethanol synthesis. It is known that rhodium catalysts especially when promoted
by elements like iron, manganese and molybdenum exhibit high selectivities
towards C2-oxygenates. The reasons of those high selectivities can be attributed
to the promoter’s ability,
• to create new active sites with direct interaction of CO oxygen with the
promoter cation,
• to create new active sites for the activation of hydrogen (as in the case of
Mo),
• to stabilize positive oxidation states of rhodium by electronic interaction.
Previous studies showed that addition of Fe to Rh-Ir/SiO2 catalyst helps
converting the primary product, acetaldehyde, into ethanol.
Copper catalysts are known to be active for hydrogenation of acetaldehyde to
ethanol and for hydrogenolysis of aliphatic acetates to ethanol and their
corresponding alcohols. Rh/SiO2 catalyst produces hydrocarbons, methanol,
ethanol and acetaldehyde. Addition of Mn and Li (over Rh-Mn-Li/SiO2) changes
the product distribution as ethanol, acetaldehyde and acetic acid. Therefore,
further addition of CuO-ZnO-SiO2 as a second component to the promoted Rh
catalyst results in an increase in both activity and ethanol selectivity as in the
other two-component systems.

12
Rh-Mn-Li catalyst shows better results in terms of activity when compared to
Rh-Ir-Mn-Li catalyst. This is because presence of Ir causes formation of a
surface alloy destructing the rhodium ensembles on the surface which are
necessary for hydrocarbon formation. On the other hand, Li reduces the
hydrogenation ability of the catalyst. Yet, compared to these catalysts, poorer
result was obtained with CuO-ZnO catalyst.
Transmission electron micrographs have shown that effects of promoters are not
due to a particle size difference. This is because particle sizes do not differ from
each other much.
Increase in pressure promoted the selectivities for methanol, ethanol and other
oxygenates. Increase in temperature, alternatively, increased methane selectivity.
Rh-Mn-Li-Cu-Zn/SiO2 catalyst was the poorest catalyst among all as Zn was
inhibiting the activity of Rh for CO hydrogenation while Cu was decorating the
active Rh sites.
2.2. Reaction Thermodynamics of Ethanol-Water Systems
The thermodynamic feasibility of ethanol steam reforming has been examined
by various studies [17,18,19]. Effects of operational parameters on equilibrium
composition can be identified either by stoichiometric thermodynamic approach
(STA) or by nonstoichiometric thermodynamic approach (NSTA) [19]. In
NSTA, the equilibrium composition of the system is found by direct
minimization of the Gibbs free energy for a given set of species without
specifying any possible reactions. In STA, on the other hand, the system is
described by a set of stoichiometrically independent reactions. Major drawback
of STA is that such arbitrarily chosen chemical reactions may lead to erroneous
results. To eliminate the potential of arriving at such flawed conclusions, Fishtik
et al. [19] have introduced the concept of what they call as response reactions
(RERs). In their study, they have transformed their arbitrary set of

13
stoichiometrically independent reactions to be used in STA into response
reactions which are unique, and thus, independent of the initial choice of that set
of reactions.
Vasudeva et al. [18] used NSTA considering nine species at equilibrium:
Ethanol, acetaldehyde, methane, carbon monoxide, carbon dioxide, hydrogen,
water, ethylene and elemental carbon. They also carried out calculations
considering six of those species excluding the ones written above in an italic
fashion to be comparable with the work done by Garcia and Laborde [17].
Results showed that hydrogen formation is favored at high temperatures with
low concentrations of water, and at low temperatures with high water
concentrations. On the other hand, they have also observed that high water
amount in the feed reduces both the carbon monoxide amount and the amount of
elemental carbon produced per ethanol. Temperature, however, plays differently,
favoring carbon monoxide at high temperatures, and elemental carbon at low
temperatures.
Fishtik et al. [19] also made use of NSTA and obtained a distribution of species
based on 7 species (ethanol, acetaldehyde, methane, carbon monoxide, carbon
dioxide, hydrogen and water) as a function of temperature at 1 atm for an
equimolar ethanol:water feed. According to their analysis, methane is the
dominant species at low temperatures whereas it is hydrogen at high
temperatures. As mentioned above, they have also used STA for their analysis.
They have predicted the behavior of the system by selecting a particular limited
set of reactions (RERs) whose contribution to the system’s response is the most
significant. As this is the case, here it should be noted that this analysis is limited
to equilibrium systems, and hence, the reactions derived only describes the
system’s response at equilibrium upon changing the operational parameters.
Fishtik et al. [19] finally concluded that at low water concentrations, ethanol
decomposes according to:

14
2452 32 COCHOHHC +↔ and, (8)
2452 HCOCHOHHC ++↔ (9)
Reaction (8) is dominant at lower temperatures, whereas reaction (9) at higher
temperatures. The steam reforming reaction, on the other hand, dominates at
700-800 K and with high water:ethanol ratios which also promotes water-gas
shift reaction and methane steam reforming:
222 HCOOHCO +↔+ (10)
2224 42 HCOOHCH +↔+ (11)
Ioannides [20] has carried out thermodynamic analysis of hydrogen production
from ethanol with respect to solid polymer fuel cell (SPFC, also called as PEM
fuel cell) applications. The system consisted of a high-temperature steam
reforming or partial oxidation (POX) reactor in which ethanol is converted to a
gaseous mixture of H2, CO, CO2 and CH4. This reactor is followed by a low-
temperature water-gas shift reactor where CO reacts with H2O giving H2 and
CO2. As this reaction is equilibrium limited, there is the selective CO oxidation
reactor coming afterwards to lower CO below 10 ppm levels. Effluent of the
selective CO oxidation reactor is sent to solid polymer fuel cell which is
integrated to the system in such a way that when a steam reformer is used, the
effluent of SPFC (especially, non-converted hydrogen) is recycled back to
reformer to obtain higher conversion efficiencies to electrical energy. As a
consequence of this, the system will operate under conditions of incomplete fuel
utilization. Ioannides has concluded that, for the steam reforming case,
employment of feeds with water:ethanol ratios higher than 3 does not offer any
significant advantage as this reduces the overall efficiency as a result of
recycling due to increased enthalpy needs for water evaporation in the reformer.
Even with lower feed ratios, system with POX reactor gave a slightly better
maximum hydrogen yield when compared to the maximum of the system with
steam reformer. Systems of POX need higher volumetric flow rates as hydrogen
15
concentration is lowered due to dilution with nitrogen. However, still they are
simpler in construction and exhibit faster response characteristics under transient
conditions which is necessary especially for vehicle applications.
Tsiakaras and Demin [21] have studied the thermodynamic analysis of a solid
oxide fuel cell system (SOFC) fuelled by ethanol. They fed SOFC with the
products of ethanol steam reforming, ethanol reforming with CO2 and ethanol
partial oxidation with air, being in thermodynamic equilibrium. At T < 950 K
and T > 1100 K products of steam reforming gave the maximum efficiency, and
at intermediate temperatures, it was reforming with CO2 leading to maximum.
Efficiency obtained by ethanol partial oxidation was, on the other hand, about
20% lower than the maximum.
2.3. Steam Reforming
There are many studies dealing with methanol steam reforming in the literature;
however, ethanol steam reforming and hydrogen production from ethanol by
autothermal reforming are new areas of study. This section will divide into
subsections based on the catalysts used in those studies.
2.3.1. Studies on Supported Cu Catalysts
Choi and Stenger [22] presented the results of experiments of the methanol
decomposition reaction catalyzed by a commercial Cu/ZnO/Al2O3 catalyst both
in the absence and presence of water. Tests were performed under catalyst
loading of 0.25 – 1.0 g and GHSV of 1000 – 10000 h-1. It was observed that
water addition to the feed increased the yield of hydrogen and reduced the
formation of by-products like dimethyl ether, methyl formate and methane.
However, Choi and Stenger have also concluded that a good methanol synthesis
catalyst is not always a good decomposition catalyst especially due to rapid
deactivation in the decomposition environment. The causes of this deactivation
were listed as copper sintering, carbon decomposition and change of catalyst

16
structure. For instance, for Cu/ZnO/Al2O3 catalyst, it has been shown by Cheng
[23] that the reduction of ZnO and formation of Cu-Zn alloys cause an initial
and rapid decrease of activity for methanol decomposition. In his study, he
reported that activity over a Cu/ZnO catalyst is less than that over Cu/Cr/Mn
catalyst containing no ZnO.
Choi and Stenger [22] accepted that Cu-O active sites are formed by the
dissociative adsorption of water. Therefore, the source of oxygen for the Cu-O
site was water in the feed, and copper could be oxidized repeatedly by the
following redox mechanism:
**2*2*2 CuOHCuOH −+→++ (12)
** 2 CuCOCuOCO +→−+ (13)
*2*2 2 +→ HH (14)
A fresh catalyst is largely in the form of oxidized copper after calcination. That
is why it should have a higher methanol decomposition rate. If little or no water
is fed, the oxidized copper sites reduce to metallic copper which will result in a
decrease in activity.
Reddy et al. [24] have reported the synthesis of isobutyraldehyde, which is a
very useful chemical feedstock in plastics industry, from methanol and ethanol
in a single step over CuO/ZnO/Al2O3 catalyst. They used ethanol and methanol
as the reactants and obtained the following product distribution:
Isobutyraldehyde, acetaldehyde, formaldehyde, higher hydrocarbons, acrolein
and COx. Isobutyraldehyde production increased in the presence of following
species: Air < air + H2O < N2 < N2 + H2O. CuO/Al2O3 is a ethanol
dehydrogenation catalyst and the basic nature of ZnO promotes this ability.
Ethanol is first converted into acetaldehyde which reacts with methanol to
produce isobutyraldehyde over CuO/ZnO/Al2O3.

17
Catalyst coking and production of by-products like methane, acetaldehyde and
diethyl ether, arise as the major problems faced in the studies of ethanol steam
reforming. Formation of ethylene during steam reforming leads to catalyst
coking [26]. Starting from this, Freni et al. [25] have proposed a two-layer fixed-
bed catalytic reactor for ethanol steam reforming reaction. They first converted
ethanol into acetaldehyde over Cu/SiO2 catalyst under low temperature, and then
converted acetaldehyde into syngas over Ni/MgO catalyst. They carried out the
tests with a total gas flow rate of 218 cm3/min at GHSV of 109000 h-1, and using
a feed of 8.2:1 water to ethanol ratio. Individual runs either with Cu/SiO2 or with
Ni/MgO catalyst only were also performed. The former one resulted in the
formation of only acetaldehyde and hydrogen with 100% ethanol conversion up
to 500°C. Above this temperature, ethylene formation and catalyst coking, and
hence, catalyst deactivation were observed. The latter one, on the other hand,
showed a low coking resistance, yet gave high acetaldehyde selectivity.
Conversely, the two-layer system produced a species distribution consisting of
only hydrogen, carbon dioxide and carbon monoxide (and traces of methane and
acetaldehyde) with 100% of ethanol being converted. Match of the exit
compositions with the compositions obtained by a simple equilibrium
calculation revealed that the following reactions dominate in the overall and
reach equilibrium under operating conditions:
2252 42 HCOOHOHHC +↔+ (15)
222 COHOHCO +↔+ (16)
OHCHHCO 2423 +↔+ (17)
Mariño et al. [27] examined the effect of copper loading and calcination
temperature on the structure and performance of Cu-Ni-K/γ-Al2O3 catalyst.
Copper size increases with copper loading and calcination temperature. At low
Cu loading and low calcination temperatures low Cu size was obtained which
gave high dispersion values. Although also affected by the nature of the active
sites, high TOF values were obtained under high dispersions. Thus, they
18
concluded that ethanol steam reforming reaction is in fact a structure sensitive
reaction. Apart from the structure of the catalyst, Cu is an active agent, and Ni
promotes C-C bond rupture and increases hydrogen selectivity, and potassium
neutralizes the acidic sites of γ alumina which improves the performance of the
catalyst.
The above discussion was argued lately again by Mariño et al. [28]. They have
re-stated the followings: Metallic copper produces a fast ethanol
dehydrogenation to acetaldehyde. Nickel favors the C-C bond rupture of
acetaldehyde to produce methane and carbon monoxide. Potassium, on the other
hand, prevents dehydration reaction to form ethylene or diethylether by
neutralizing the acidic sites of the support.
They further reported that increase in the calcination temperature results in a
strong interaction between nickel and aluminum which decreases reducibility of
nickel, and along with this, decreases the selectivity towards C1 compounds.
This is in agreement with what had been proposed by Mariño et al. earlier [27].
2.3.2. Studies on Supported Group VIIIB Metal Catalysts
Galvita et al. [29] have used the two-layer fixed-bed catalytic reactor of their
previous study (§2.3.1) [25] to test, this time, a palladium-based catalyst and
again a nickel-based catalyst in a similar manner. They carried out the
experiments by supplying water-ethanol solutions of 8.1:1 and 1.04:1 mol ratios
as feed and at WHSV of 1600-2200 cm3/h-g catalyst. Again, first of all, they
tested the catalysts individually. Over Pd catalyst supported on Sibunit2 only
hydrogen, methane, carbon monoxide and carbon dioxide were produced in a
range of 210-380°C. It was shown that the following two reactions were taking
place:
2 A special porous carbonaceous material.

19
2452 HCOCHOHHC ++↔ (18)
222 HCOOHCO +↔+ (19)
As water amount in the feed decreased, water-gas shift reaction became less
important as it can easily be deduced from Le Châtelier’s principle. This shifts
the minimum temperature at which 100% ethanol conversion is attainable
(330°C) to a slightly higher value (360°C). On the other hand, over the industrial
Ni-containing GIAP-16 catalyst, acetaldehyde, methane, hydrogen and carbon
oxides were produced. Substantial amounts of coke were also observed.
Alternatively, in the two-layer system, hydrogen, carbon oxides and methane
were detected as the products with methane in trace amounts. Temperature of the
Pd layer was kept at 335°C, and that of Ni layer was varied between 650 and
800°C. Methane steam reforming reaction took place along with Reaction (18)
and Reaction (19) in the overall, all being in equilibrium:
224 3 HCOOHCH +↔+ (20)
In a later study of Galvita et al. [30] characteristics of the Pd catalyst and its
catalytic performance in ethanol decomposition in steam were discussed in more
detail. TEM micrographs and XP spectra of both fresh and sent catalysts showed
no difference. In order to identify the intermediate species, the mechanism of the
overall reaction taking place, and the fast and slow steps in the reaction pathway,
WHSV was increased from 2200 to 33000 cm3/h-g catalyst. At the end the
following mechanism was proposed:
)(2352 slowestHCHOCHOHHC +↔ (21)
)(43 fastCOCHCHOCH +→ (22)
)(222 slowHCOOHCO +↔+ (23)

20
Freni [31] has tested Rh/Al2O3 catalyst and the alumina support for ethanol
steam reforming reaction for molten carbonate fuel cell applications. He showed
that alumina results in dehydration of ethanol forming ethylene and water at
temperatures higher than 600 K for a feed consisting 90% water. He further
showed that water content of the feed does not influence the ethylene formation.
Rh/Al2O3 catalyst, on the other hand, produced carbon monoxide and methane
below 730 K (with ethanol dehydrogenation into ethoxide as the intermediate
step), and above this temperature ethanol steam reforming prevailed with 100%
ethanol conversion and no yield of C2H4 or CH3CHO. The time-on-stream data
showed no selectivity changes; however, ethanol conversion decreased with
time. This is attributed to the loss of the catalyst dispersion degree as a result of
a size modification of the catalyst particles under thermal effect of the reaction
temperature which caused catalyst grains to grow.
Fatsikostas et al. [32] presented the results of the experiments done on Ni/La2O3,
and reported that this catalyst shows high activity, high hydrogen selectivity, as
well as good long term stability. They conducted the tests in a temperature range
of 300-800°C sending a feed of 3:1 water-ethanol ratio at a space time (W/F)
range of 0.01 to 0.23 g catalyst.s/cm3. Tests carried out at very high space time
(0.0375 g catalyst.s/cm3) showed that ethanol steam reforming takes place to a
significant extent above 400°C. 100% ethanol conversion was achieved only at
about 700°C. Furthermore, it is the ethanol dehydrogenation that is the dominant
reaction at low temperatures which becomes less important above 500°C as
acetaldehyde begins to reform. As La2O3 does not have an acidic nature no
ethylene is produced. At high temperatures the only reaction products were
carbon monoxide and hydrogen, with carbon dioxide (from water-gas shift
reaction) and methane (from methanation reaction3) as being the by-products.
Tests on different space velocities also revealed that at contact times higher than
0.1 g catalyst.s/cm3 (at 750°C) it is possible to achieve 100% ethanol conversion
and hydrogen selectivities higher than 95%. Time-on-stream data, on the other
3 24222 COCHHCO +↔+

21
hand, proved the stability of the catalyst only with a little deactivation as a result
of decrease in ethanol conversion, although no significant change in hydrogen
selectivity was observed.
Table 2. Effects of process parameters in the study of Liguras et al. [33]
Parameters Effect on/of Observation
XC2H5OH Rh >> Pt > Pd > Ru
SH2, SCO Rh >> Pt > Ru = Pd
SCO2 All but especially Pt,
Rh
SCH3CHO, SC2H4 All but especially Rh
Metallic Phase
1% Me/γ-Al2O3
SCH4 None. Rh, a little
Increase in Rh amount
T100% conv, SH2, SCO2↑
SCO →
Sbyprod ↓
Metal Loading
0.5-2% Rh/γ-Al2O3
1-5% Ru/γ-Al2O3 Increase in Ru amount
SH2, SCO2, SCO↑
T100% conv, Sbyprod ↓
5% Ru/Support XC2H5OH, Sprod, Sbyprod Al2O3 > MgO > TiO2
Space velocity (W/F) 0.018-
0.105 g catalyst.s/cm3 Increase in W/F
XC2H5OH, SH2, SCO↑
SCO2, Sbyprod↓
Liguras et al. [33] have investigated the effect of Rh, Ru, Pt and Pd catalysts
supported on Al2O3, MgO and TiO2 and the effect of metal loading on the
catalytic performance towards ethanol steam reforming. They performed the
experiments feeding ethanol and water in stoichiometric ratios with respect to
ethanol steam reforming reaction giving CO2. They worked under W/F range of

22
0.018 to 0.105 g catalyst.s/cm3, and at a temperature range of 600-850°C.
Complete conversion was obtained at 800°C under severe conditions over 1%
Rh/Al2O3 catalyst. Acetaldehyde, ethylene (over acidic alumina) and methane
(from hydrogenation of carbon oxides) were formed as by-products, yet with
low selectivities. At temperatures near 800°C, selectivity of ethylene decreased
to zero (as that of acetaldehyde) due to steam reforming of ethylene. Effects of
all process parameters are summarized in Table 2 for this study. Finally, long-
term stability test was also carried out for 5% Ru/Al2O3 catalyst and the results
were similar to what has been reported by previous studies [31,32]: No change
in hydrogen selectivity (and selectivity to methane, acetaldehyde and ethylene),
decrease in ethanol conversion.
Cavallaro et al. [34] also studied the ethanol steam reforming on Rh/Al2O3
catalyst, and investigated the influence of reaction temperature (550-650°C),
water:ethanol ratio (4.4-12.4), space velocity (5000-30000 h-1) and oxygen in the
reacting medium. Results of the experiments showed that high temperatures and
low space velocities are necessary to optimize hydrogen production. Runs
performed at different GHSV values revealed that ethanol first dehydrogenates
into acetaldehyde which either decomposes into methane or reforms with steam
into hydrogen. Methane further undergoes steam reforming. Steam reforming of
methane occurs with a lower rate respect to water-gas shift reaction. On the
other hand, acetaldehyde decomposition is faster compared to ethanol
dehydrogenation. Furthermore, catalyst deactivation caused by metal sintering
and coke formation was registered. Addition of oxygen, alternatively, promoted
not only metal sintering as a result of hot spot phenomena but also the ethanol
conversion through oxidative dehydrogenation:
OHCHOCHOOHHC 23221
52 +↔+ (24)
Deluga et al. [7] have also studied hydrogen production from ethanol and
ethanol-water mixtures over rhodium catalyst, however, supported on ceria.

23
Alternatively they have studied autothermal reforming, and obtained 100%
hydrogen selectivity with more than 95% ethanol conversion under as high a
space velocity as 360000 h-1, and even under higher velocities than this one.
They carried out the runs at 140°C. Yet the catalyst temperature reached about
700°C as oxidation reaction was also taking place. They have also performed a
simple economic analysis considering an ethanol cycle starting from
photosynthesis and ending in a perfect fuel cell. They concluded that under such
a hypothetic, completely reversible, ideal system the fuel cost (cost of ethanol to
generate electricity) would be about $0.04 per kWh. They finally suggested that
it may be possible to capture more than 50% of the energy from photosynthesis
as electricity.
Llorca et al. [35] have studied the effect of supports of cobalt catalysts on
ethanol steam reforming under a mixture of 1:13:70 ethanol:water:argon (molar
ratio) in a temperature range of 300-450°C and at 5000 h-1 GHSV. Supports
tested are the following: MgO, γ-Al2O3, SiO2, TiO2, V2O5, ZnO, La2O3, CeO2
and Sm2O3. Ethanol steam reforming occurred to a large extent over ZnO-,
La2O3-, Sm2O3-, and CeO2-supported catalysts. Different GHSV values and/or
different Ar to ethanol and water ratios were also studied over Co/ZnO catalyst
which showed the best result in terms of 74% hydrogen selectivity under 100%
ethanol conversion. These experiments revealed that as GHSV increases
decomposition of ethanol to acetone decreases while the extent of the steam
reforming reaction increases. Further increase of GHSV increased the selectivity
to acetaldehyde which proved ethanol dehydration to be an intermediate step in
ethanol steam reforming.
2.3.3. Comparative Studies
This subsection includes studies comparing Group VIIIB metal catalysts both
among each other and with other catalysts, and different oxide catalysts.
24
Cavallaro and Freni [36] tested several catalysts for ethanol steam reforming to
be used indirectly in molten carbonate fuel cells (MCFCs). As the operating
temperature of MCFC is above 900 K, the results of the experiments carried out
at atmospheric pressure were extrapolated to temperatures 800-900 K and
pressures up to 100 bar by using a mathematical model. Experiments done at
high temperatures (630-750 K) showed no trace of intermediate oxidation
products like acetaldehyde, acetic acid or ethyl acetate the production of which
are more important on copper catalysts. For temperatures lower than 600 K,
however, the selectivity to carbon dioxide and hydrogen decreases due to higher
oxygenate formation. It was observed that acetic acid selectivity is directly
related to the water:ethanol ratio, whereas ethyl acetate selectivity seems to be
related to conversion and temperature. Runs with different space velocities
revealed that acetaldehyde is produced as the first step which is followed by an
oxidative step to ester (under slightly excess water) or to acetic acid (under
excess water). All catalysts tested shifted the system towards equilibrium above
630 K. CuO/ZnO/Al2O3 and NiO/CuO/SiO2 catalysts do not produce coke
and/or oxygenated side-products even with water:ethanol ratio lower than 3
although some catalysts require ratios higher than 4. Noble metal (Pt, Rh) and
W-based catalysts showed almost the same activity as CuO/ZnO/Al2O3. Finally,
mathematical model showed that it is possible to obtain good hydrogen yields of
30-50% even at high pressures (which thermodynamically reduce hydrogen
selectivity) in MCFC separated from the reformer side by a membrane.
Takezawa and Iwasa [37] argue that the differences in catalytic performances of
copper and Group VIIIB metals in methanol steam reforming and methanol
dehydrogenation are due to the differences in the reactivity of HCHO
intermediate involved. In the beginning of their study, they summarize all
information available in the previous studies on copper and Group VIIIB metal
catalysts. Firstly, over copper and Pd/ZnO catalysts, methanol dehydrogenates
into acetic acid; whereas over other Group VIIIB metals syngas is formed from
methanol as shown below, respectively:

25
Table 3. Mechanisms and products in the study of Takezawa and Iwasa [37]
Feed Catalyst Reaction Mechanisms and/or
Product Distributions
VIIIB
metal/SiO2
Methanol decomposition (main)
23 2 HCOOHCH +→
Steam Reforming
222322 HCOHCOOHCH OH +⎯⎯→⎯+→
CH3CHO/
H2O
Cu, Cu/SiO2
Steam Reforming ( )
( ) 22
322
HCOHCOOorHCOOHHCHOOHCH HOorOHH
+→−⎯⎯⎯⎯ →⎯⎯⎯→⎯ −−
Cu, Cu/SiO2 Acetic acid formation
( )33
33 HCOOCHHCHOOHCH OHCHorOHCH ⎯⎯⎯⎯⎯⎯ →⎯→ −
HCHO/
CH3OH Pt/SiO2,
Pd/SiO2
Formaldehyde decomposition (main)
2HCOHCHO +→
Methanol decomposition
23 2 HCOOHCH +→
C2H5OH/
H2O Cu/SiO2
Products: CH3COOH (main), CH3CHO, H2, C4-
species
CH3CHO/
H2O Cu/SiO2
Products: CH3COOH, H2
(Also: Butyraldehyde, ethanol)
Steam reforming of acetaldehyde (main)
2323 HCOOHCHOHCHOCH +→+
Hydrogenation of acetaldehyde
OHHCHCHOCH 5223 →+
C2H5OH Pd, Pt, Ni
Products: CH4, CO, H2, CH3CHO
Dehydrogenation of ethanol
2352 HCHOCHOHHC +→
Decomposition of acetaldehyde
COCHCHOCH +→ 43
26
• 233 22 HHCOOCHOHCH +↔ (25)
• 23 2 HCOOHCH +↔ (26)
On the other hand, copper and Pd/ZnO catalysts hydrogenate unsaturated
aldehydes/ketones to unsaturated alcohols while other Group VIIIB metal
catalysts to saturated aldehydes/ketones. Also, hydrogenation of esters and
carboxylic acids to alcohols which is dominant over Pd/ZnO catalyst occurs
more over Cu catalysts when compared to other Group VIIIB metal catalysts.
In this study, Takezawa and Iwasa further tested Cu, Ni, Rh, Pd and Pt catalysts
supported on various oxides (MgO, La2O3, Nd2O3, MnO2, Cr2O3, HfO2, Na2O5,
Al2O3, SiO2, ZnO) feeding different mixtures to the reactor to understand the
reaction mechanisms taking place. Reactions taken place and product
distributions obtained are summarized in Table 3 for various mixtures fed to the
system.
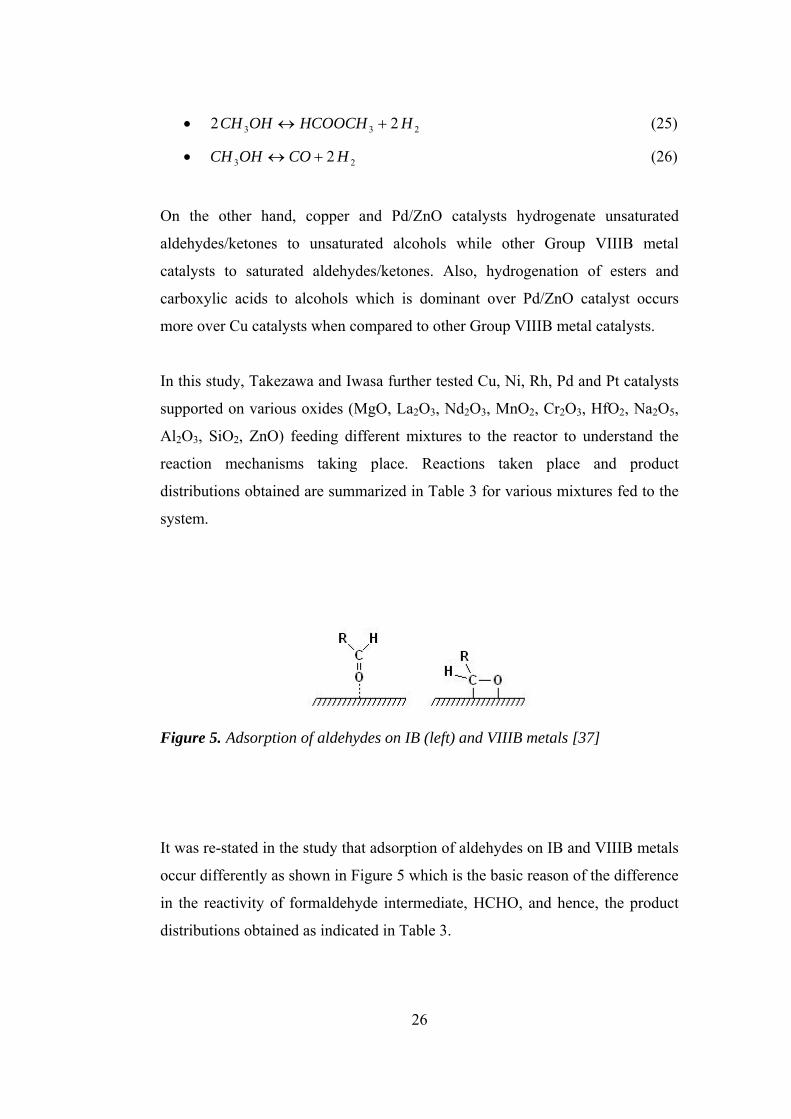
Figure 5. Adsorption of aldehydes on IB (left) and VIIIB metals [37]
It was re-stated in the study that adsorption of aldehydes on IB and VIIIB metals
occur differently as shown in Figure 5 which is the basic reason of the difference
in the reactivity of formaldehyde intermediate, HCHO, and hence, the product
distributions obtained as indicated in Table 3.

27
As mentioned above, catalytic activity of Pd/ZnO catalyst is similar to that of
copper catalysts. This is because formaldehyde adsorbs on positively charged Pd
sites of the PdZn alloy formed. On the other hand, the highest selectivity for
steam reforming was obtained over Pd catalysts which increased with increase in
temperature. Best performance was obtained at 30wt% Pd loading.
In a later study, Iwasa et al. [38] have produced acetaldehyde at low conversion
levels and at high space times over Pd-Zn, Pd-Ga and Pd-In alloys of Pd
catalysts as also produced over Cu/ZnO catalyst. At higher temperatures and
lower space times, formation of ethyl acetate was observed with some decrease
in acetaldehyde selectivity suggesting that ethyl acetate was produced through
acetaldehyde. Over metallic Pd, however, decomposition of ethanol to CO and
CH4 took place. Iwasa et al. have also pointed out the effects of different catalyst
preparation methods on activity tests of the same catalyst.
Aupretre et al. [4] investigated the nature of metals and oxides to maximize
hydrogen production while minimizing carbon monoxide formation. They used a
feed of (12.8 vol% ethanol + 38.4% water + 48.8% N2) to reach a total flow rate
of 100 cm3/min. They carried out the experiments at 500-800°C. They proposed
a mechanism such that ethanol is to be activated on the metal and water on the
support. Based on this mechanism, Rh, Pt, Pd, Ru, Ni, Cu, Zn and Fe were tested
along with Al2O3, CeO2-Al2O3, CeO2, CeO2-ZrO2 and ZrO2 as the oxide
supports. Results of the experiments showed that carbon dioxide is produced in
ethanol steam reforming; therefore, metals to be used in active and selective
catalysts for ethanol steam reforming should be highly active in steam
reforming, and poorly efficient in water-gas shift reaction. To improve
performances of the catalyst in steam reforming ceria-containing supports were
used which enable enhanced OH surface mobility, and promote water-gas shift
reaction. Rh and Ni catalysts are active for steam reforming and not for water-
gas shift reaction. Table 4 summarizes the results obtained over those catalysts.
As a final note, Pt, Cu, Zn and Fe catalysts supported on γ-Al2O3 was highly
28
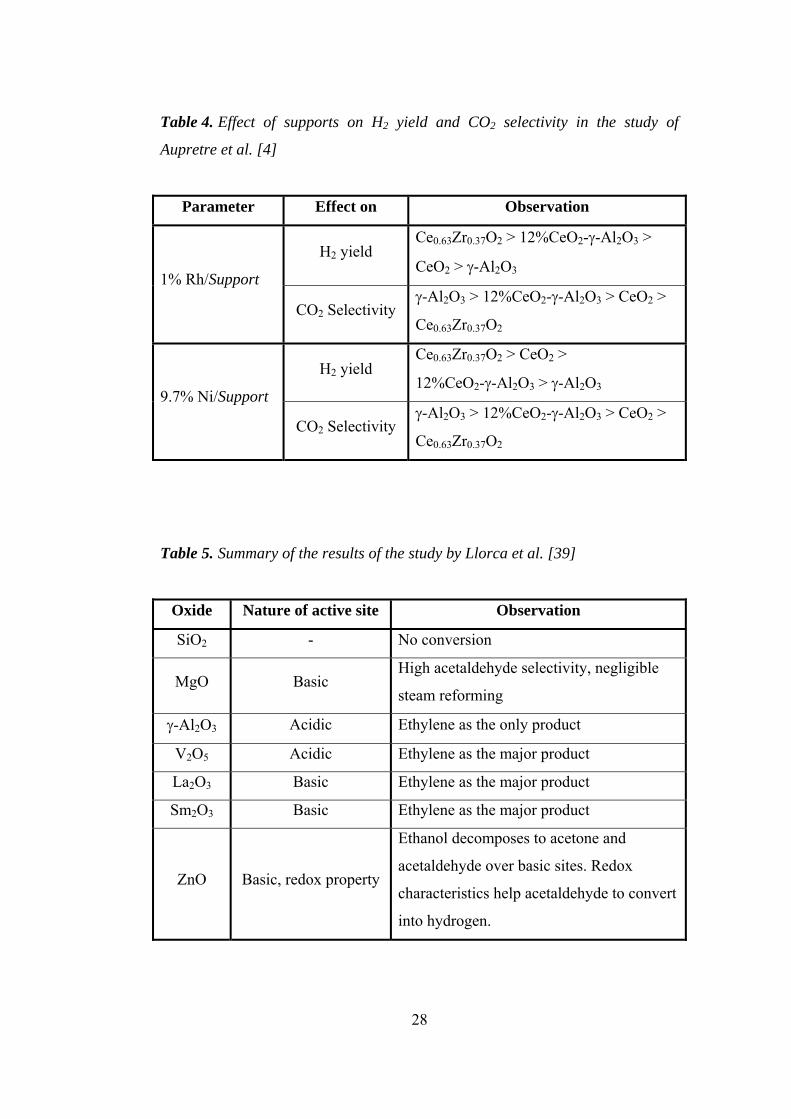
Table 4. Effect of supports on H2 yield and CO2 selectivity in the study of
Aupretre et al. [4]
Parameter Effect on Observation
H2 yield Ce0.63Zr0.37O2 > 12%CeO2-γ-Al2O3 >
CeO2 > γ-Al2O3 1% Rh/Support
CO2 Selectivity γ-Al2O3 > 12%CeO2-γ-Al2O3 > CeO2 >
Ce0.63Zr0.37O2
H2 yield Ce0.63Zr0.37O2 > CeO2 >
12%CeO2-γ-Al2O3 > γ-Al2O3 9.7% Ni/Support
CO2 Selectivity γ-Al2O3 > 12%CeO2-γ-Al2O3 > CeO2 >
Ce0.63Zr0.37O2
Table 5. Summary of the results of the study by Llorca et al. [39]
Oxide Nature of active site Observation
SiO2 - No conversion
MgO Basic High acetaldehyde selectivity, negligible
steam reforming
γ-Al2O3 Acidic Ethylene as the only product
V2O5 Acidic Ethylene as the major product
La2O3 Basic Ethylene as the major product
Sm2O3 Basic Ethylene as the major product
ZnO Basic, redox property
Ethanol decomposes to acetone and
acetaldehyde over basic sites. Redox
characteristics help acetaldehyde to convert
into hydrogen.

29
active for water-gas shift reaction although they showed moderate activity for
steam reforming.
Llorca et al. [39] tested various oxides for steam reforming reaction at 300-
450°C. Results of this study are listed in Table 5. Best performance was obtained
by ZnO which gave highly effective production of CO-free hydrogen with 100%
ethanol conversion.
30
CHAPTER 3
3. EXPERIMENTAL AND METHODOLOGY3..
In this study, ZnO/SiO2 catalysts with different copper and palladium loadings,
and Co doped SBA-15 catalyst were prepared by different sol-gel techniques,
characterized to some extent by Thermal Gravimetric Analysis (TGA), and
Brunauer-Emmett-Teller (BET) techniques, and tested for their activity and
selectivity in ethanol steam reforming in a packed-bed reactor.
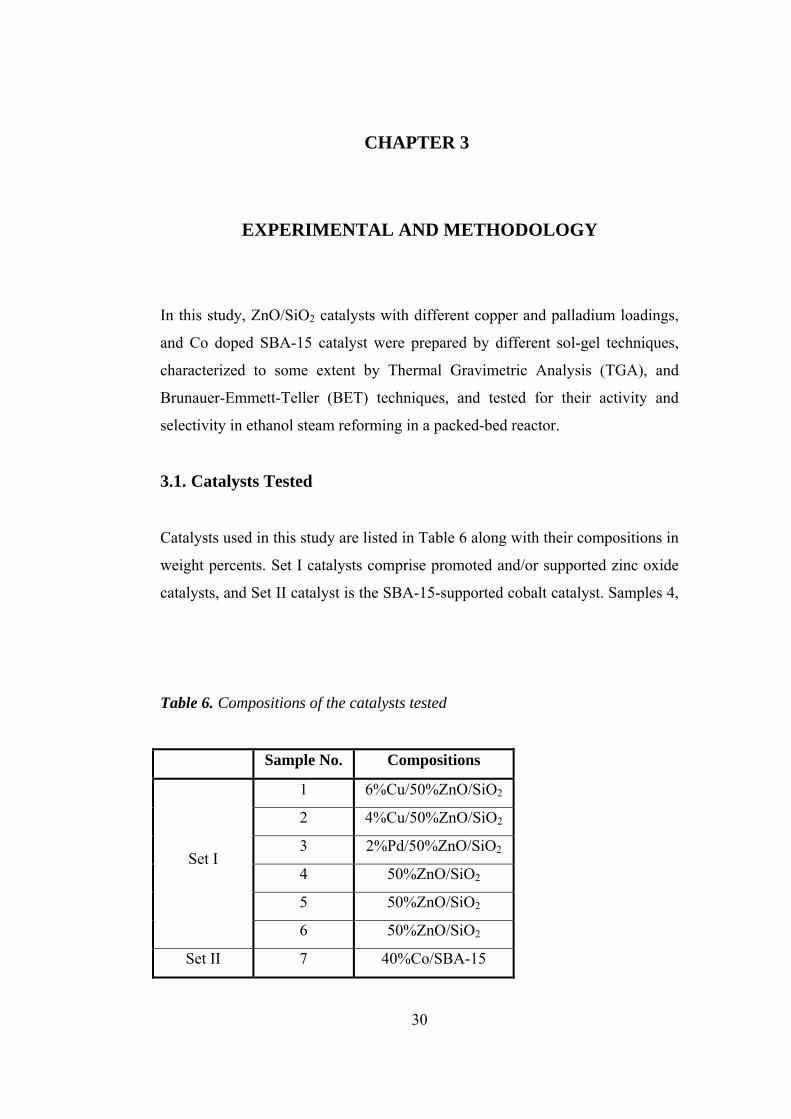
3.1. Catalysts Tested
Catalysts used in this study are listed in Table 6 along with their compositions in
weight percents. Set I catalysts comprise promoted and/or supported zinc oxide
catalysts, and Set II catalyst is the SBA-15-supported cobalt catalyst. Samples 4,
Table 6. Compositions of the catalysts tested
Sample No. Compositions
1 6%Cu/50%ZnO/SiO2
2 4%Cu/50%ZnO/SiO2
3 2%Pd/50%ZnO/SiO2
4 50%ZnO/SiO2
5 50%ZnO/SiO2
Set I
6 50%ZnO/SiO2
Set II 7 40%Co/SBA-15
31
5 and 6 differ from each other by different water amounts used during
preparation.
Set I catalysts were prepared at Izmir Institute of Technology and Set II catalyst
was prepared in the Department of Chemistry at METU. Further information on
the preparation and characterization of these catalysts is given in Appendices B
and C.
3.2. Experimental Setup and Activity Measurements
Systems of liquids and gases can become much more complicated, and hence,
challenging than it can ever be imagined. A huge portion of this study was spent
on establishing a proper experimental setup and especially on finding an answer
to how to feed the liquid to the system. After many systems designed, many
unsuccessful experiments performed, and many modifications made the setup
shown in Figure 6 was put into operation. Below is an explanation on the
experimental setup and how activity measurements are carried out.
Ethanol and water mixtures are prepared in ratios according to the stoichiometry
of the steam reforming of ethanol to carbon dioxide and hydrogen: 25 mol% (46
wt%) ethanol. The liquid mixture is then injected into a cooler of 25 cm3 kept at
3°C to minimize vaporization effects as the level decreases in the cooler during
experiments. A peristaltic pump is used to feed this liquid to the system shown
in Figure 6 at an average flow rate of 0.047 cm3/min. The liquid is firstly sent to
a bulb of 250 cm3 kept at 160°C by means of heating tapes. Collected in the bulb
the vaporized liquids are then directed to the inlet of the reactor and carried into
the reactor under a nitrogen and argon flow of 45 cm3/min and ca. 4 cm3/min,
respectively, as shown in the enlarged view in Figure 6.
A packed-bed reactor having an inner diameter of 3.8 mm is used for reactivity
tests. 0.1 g catalyst is used in each experiment, and the catalyst bed is supported

32
Figure 6. Experimental Setup

33
by quartz wool at both ends. A tubular furnace is used to keep the temperature of
the reactor constant at desired values.
Product stream exiting the reactor then flow into a “sampling vessel” which is
also heated by heating tapes and kept at 175°C. Sampling vessel has an opening,
other than its two ends, which is closed by a septum. Samples are taken into
heated gas syringes through this septum to be analyzed. Species which are in
liquid phase under room temperature were condensed next in a condenser kept at
3°C. Gaseous species are discharged into atmosphere through fume hoods while
liquefied species are collected in bottles for proper disposal.
Analyses were carried out in a gas chromatograph (GC) (HP 4890A) equipped
with a Thermal Conductivity Detector (TCD) which uses nitrogen as reference
gas. Species are separated in a GasChrom MP-1 packed column (30 ft). Table 7
lists the values of GC settings used during analyses. A long column, low flow
rates and a temperature ramp in the oven are necessary for such a system
containing components like hydrogen which rapidly adsorbs and desorbs in
every column, and components like ethanol which is just the opposite. For this
reason, analysis of one sample takes about 1 hour.
Table 7. GC settings
GC Settings Values
Injection port temperature 220°C
Oven temperature 75°C (9 min) [4°C/min] 200°C (9.5 min)
Detector temperature 250°C
Reference flow 9-10 cm3/min
Column flow 13-15.5 cm3/min
34
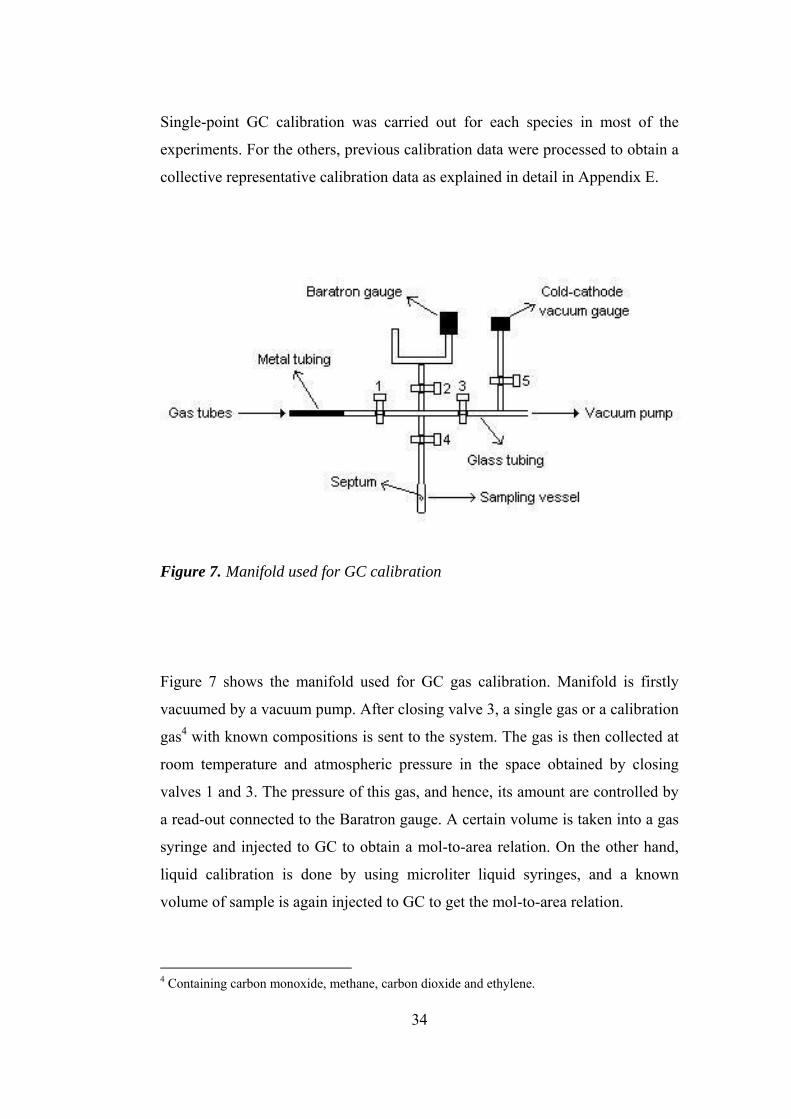
Single-point GC calibration was carried out for each species in most of the
experiments. For the others, previous calibration data were processed to obtain a
collective representative calibration data as explained in detail in Appendix E.
Figure 7. Manifold used for GC calibration
Figure 7 shows the manifold used for GC gas calibration. Manifold is firstly
vacuumed by a vacuum pump. After closing valve 3, a single gas or a calibration
gas4 with known compositions is sent to the system. The gas is then collected at
room temperature and atmospheric pressure in the space obtained by closing
valves 1 and 3. The pressure of this gas, and hence, its amount are controlled by
a read-out connected to the Baratron gauge. A certain volume is taken into a gas
syringe and injected to GC to obtain a mol-to-area relation. On the other hand,
liquid calibration is done by using microliter liquid syringes, and a known
volume of sample is again injected to GC to get the mol-to-area relation.
4 Containing carbon monoxide, methane, carbon dioxide and ethylene.

35
Experiments are carried out at temperatures between 300 and 500°C at intervals
of 50°C. Before each experiment the system is heated up under the flow of
nitrogen and argon. As the system reaches thermal equilibrium, liquid starts to
be fed at which point the valve in the liquid line is opened and the valve in the
gas line is closed (Figure 6). Previous experiments showed that no reaction takes
place below 300°C. As this is the case, one additional set is performed also at
either 200 or 250°C to obtain ethanol and water amounts sent to the system in
gaseous phase. Although these values could as well be obtained from liquid
pumping flow rate (as already done), as will be discussed in the following
chapter, most of the time those values do not come out to be near. Some
experiments were carried out starting from 200 or 250°C, and by increasing the
reactor temperature to 300°C, and then to 350°C and so on. As heating of the
furnace is rather rapid compared to its cooling additional time is allowed for the
system to re-establish steady state at each temperature. Some experiments, on
the other hand, were done starting at 500°C and by letting the furnace cool down
which is already a time-consuming process, and the system remains in steady
state at each cooling step so no additional time is waited. A sample time
schedule of one full experiment is given in Appendix F. At each set, or reactor
temperature; one, two or three samples are taken and analyzed in GC
sequentially. Before each injection, syringe is heated by a heating gun, and after
each injection, syringe is cleaned by a syringe cleaning equipment as shown in
Figure 8. Other pictures of the setup are given in Appendix G.
As the total flow rate of the “heated” gaseous mixture at the reactor exit is to be
known to do the necessary calculations, which cannot easily be measured by
means like soap bubble flow meter, the flow rate is calculated indirectly from a
known constant flow rate of a known inert gas component also sent to the
system. Nitrogen, the carrier, could have been used for such a purpose; however,
it would be impossible to obtain a nitrogen peak in the chromatogram as the
reference gas to the GC is already nitrogen. So, argon was used and sent with
nitrogen to the system as mentioned above. Use of argon alone both as the

36
carrier and the internal standard would also be of no use as the GC column
would saturate with argon which would result in a faulty argon area.
Figure 8. Heating gun (left) and syringe cleaning equipment
Few experiments were conducted also under air flow to realize some ethanol
oxidation along with ethanol steam reforming, or in other words autothermal
reaction. Argon could not be used in these experiments as oxygen in air could
not be separated from argon in the column. So, no calibration was done in these
experiments as the total flow rate was not known, and instead, the collective
calibration data were used to carry out the calculations. Table 8 summarizes the

37
Table 8. Flow rates and compositions of liquid and gaseous phases
Unit 5 Total Ethanol Water Nitrogen Oxygen
cm3/min 0.047 0.012 0.035 - -
g/min 0.043 0.020 0.023 - -
mol/min 0.0017 0.00044 0.0013 - -
mol%
or vol% 100 25 75 - -
Liquid
phase
wt% 100 46 54 - -
S 86 10 31 45 0
H 86 10 31 36 9.4 cm3/min
L 51 10 31 0 9.4
S 0.096 0.020 0.023 0.053 0
H 0.091 0.020 0.023 0.042 0.0064 g/min
L 0.049 0.020 0.023 0 0.0064
S 0.0036 0.00044 0.0013 0.0019 0
H 0.0037 0.00044 0.00131 0.0015 0.00040mol/min
L 0.0021 0.00044 0.0013 0 0.00040
S 100 12 36 52 0
H 100 12 36 41 11 mol%
or vol% L 100 20 61 0 19
S 100 21 24 55 0
H 100 22 25 46 7.0
Gaseous
phase
wt%
L 100 40 47 0 13
5 Steam reforming: S. Autothermal reforming: H (High space velocity), L (Low space velocity)

38
compositions and flow rates of both the liquid phase and the gaseous phase
applied in experiments.
Parameters changed in experiments include catalysts, temperature and space
velocity. Following chapter presents the results of these tests along with
comments and discussions.

39
CHAPTER 4
4. RESULTS AND DISCUSSION4...
4.1. Characterization Results
BET results of both Set I and Set II catalysts (except Sample 5) are shown in
Table 9. For Set I catalysts, as seen in the table, as the amount of metal used in
the catalyst increases, BET surface area decreases while average pore diameter
also increases.
Cannas et al. [40] have also come up with a similar situation. They observed
crystallite phases in XRD patterns and a decrease in BET surface areas as they
impregnated more ZnO on silica. They attributed this to the involvement of
larger areas of support as the dispersing phase (ZnO) is in higher amount. This
way, the dispersing phase is spread over the surface in a homogeneous way.
Increase in the amount of metal used in the catalysts may have resulted in
formation of larger and denser silica suspensions which end up with having such
BET areas as explained by Cannas et al. [40].
Cannas et al. also presented the results of XRD patterns of their ZnO/SiO2
catalysts as the calcination temperature increases. According to their data, ZnO
zincite phases were observed in catalysts calcined at temperatures between 500
and 700°C. So, it is very likely to have zincite phases in our catalysts. Above
800°C, however, a solid state reaction between zinc oxide and the silica matrix
was detected by Cannas et al. which resulted in the formation of zinc silicates
like β-Zn2SiO4. Such zinc silicate formations might have also occurred as a
result of a probable catalytic effect of palladium and/or copper to lower the

40
necessary reaction temperature from 800°C to our calcination temperature,
500°C.
Table 9. BET results
Catalyst
BET
Surface
Area (m2/g)
BJH Desorption
Average Pore Diameter
(nm)
1 6%Cu/50%ZnO/SiO2 94 7.7
2 4%Cu/50%ZnO/SiO2 144 7.6
3 2%Pd/50%ZnO/SiO2 77 6.6
4 50%ZnO/SiO2 170 3.3
Set I
6 50%ZnO/SiO2 181 3.7
Set II 7 40%Co/SBA-15 747 3.5
4.2. Reactivity Test Results
Results of ethanol steam reforming tests both in the absence and presence of
oxygen or air over all catalysts except sample 5 are given below.
4.2.1. Ethanol Steam Reforming
Steam reforming tests were carried out over Set I catalysts. Table 8 summarizes
flow rates and compositions of both liquid and gaseous mixtures sent to the
system. This way, for all experiments space velocities were kept around 54000
cm3/h-g catalyst using 0.1 g of catalyst (corresponding to 81000 h-1, or space
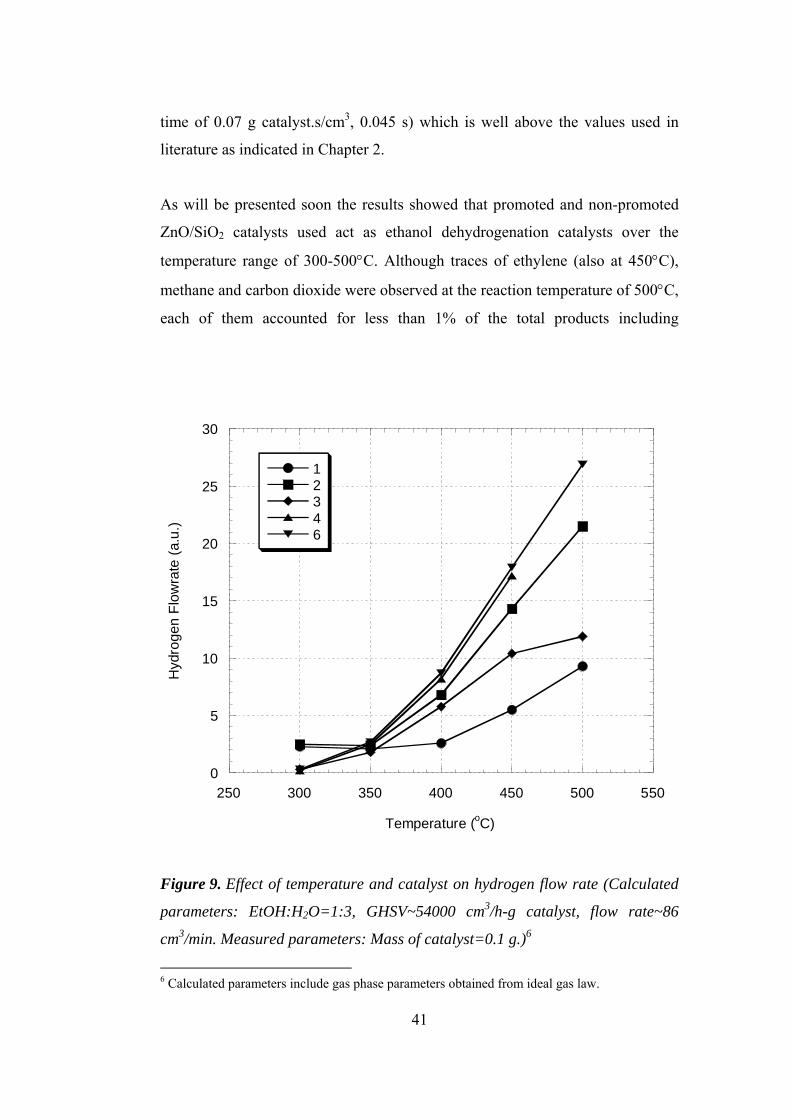
41
time of 0.07 g catalyst.s/cm3, 0.045 s) which is well above the values used in
literature as indicated in Chapter 2.
As will be presented soon the results showed that promoted and non-promoted
ZnO/SiO2 catalysts used act as ethanol dehydrogenation catalysts over the
temperature range of 300-500°C. Although traces of ethylene (also at 450°C),
methane and carbon dioxide were observed at the reaction temperature of 500°C,
each of them accounted for less than 1% of the total products including
0
5
10
15
20
25
30
250 300 350 400 450 500 550
12346
Hyd
roge
n Fl
owra
te (a
.u.)
Temperature (oC)
Figure 9. Effect of temperature and catalyst on hydrogen flow rate (Calculated
parameters: EtOH:H2O=1:3, GHSV~54000 cm3/h-g catalyst, flow rate~86
cm3/min. Measured parameters: Mass of catalyst=0.1 g.)6
6 Calculated parameters include gas phase parameters obtained from ideal gas law.
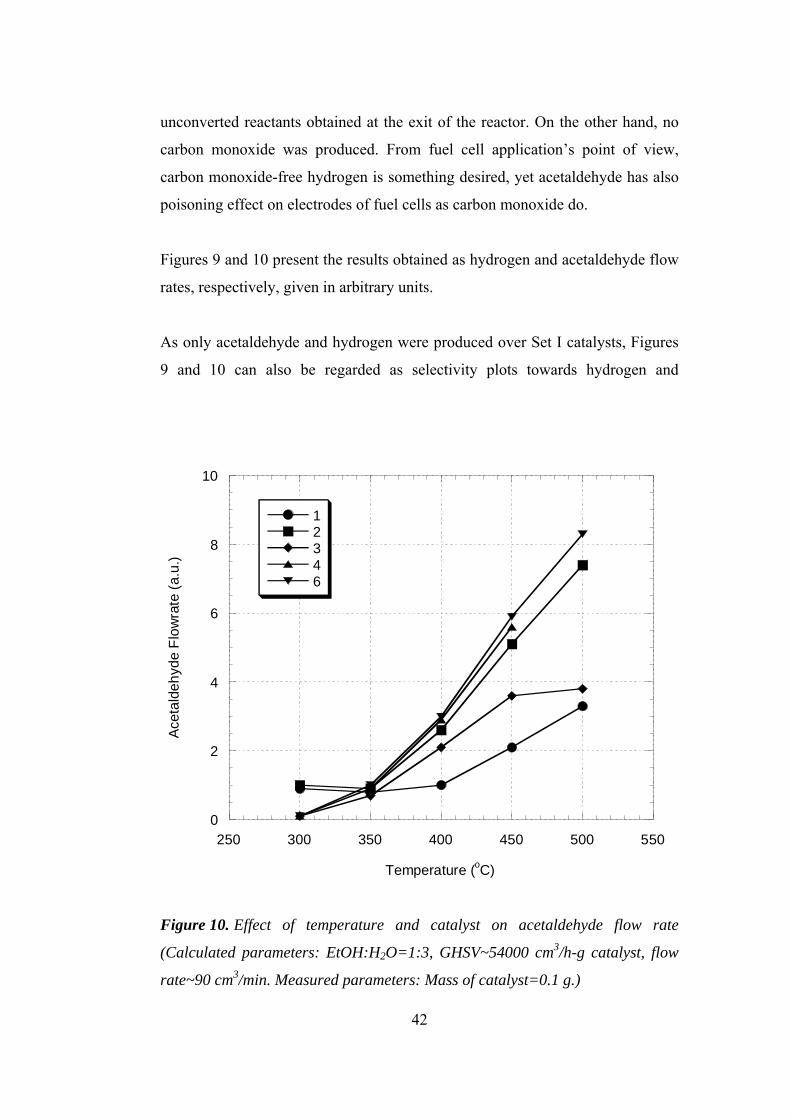
42
unconverted reactants obtained at the exit of the reactor. On the other hand, no
carbon monoxide was produced. From fuel cell application’s point of view,
carbon monoxide-free hydrogen is something desired, yet acetaldehyde has also
poisoning effect on electrodes of fuel cells as carbon monoxide do.
Figures 9 and 10 present the results obtained as hydrogen and acetaldehyde flow
rates, respectively, given in arbitrary units.
As only acetaldehyde and hydrogen were produced over Set I catalysts, Figures
9 and 10 can also be regarded as selectivity plots towards hydrogen and
0
2
4
6
8
10
250 300 350 400 450 500 550
12346
Acet
alde
hyde
Flo
wra
te (a
.u.)
Temperature (oC)
Figure 10. Effect of temperature and catalyst on acetaldehyde flow rate
(Calculated parameters: EtOH:H2O=1:3, GHSV~54000 cm3/h-g catalyst, flow
rate~90 cm3/min. Measured parameters: Mass of catalyst=0.1 g.)
43
acetaldehyde, respectively, and even as ethanol conversion plots, each of which
having appropriate units of scale. Although not explicitly calculated and plotted,
hydrogen selectivity can be defined as the ratio of the produced moles of
hydrogen to the moles of hydrogen equivalent to the consumed moles of ethanol.
As seen in Figure 9, below 350°C copper-promoted catalysts (1 and 2) showed
better selectivity to hydrogen. At 400°C and above this temperature, on the other
hand, non-promoted catalysts appear to be superior to other catalysts in ethanol
dehydrogenation. In this temperature range, 4%Cu-promoted catalyst (2) showed
better results compared to Pd-promoted catalyst (3). 6%Cu-promoted catalyst
(1), however, came into view with the poorest performance.
Trends in acetaldehyde flow rate, as seen in Figure 10, are very similar to those
observed for hydrogen in Figure 9. This was in fact an expected result as nothing
other than ethanol dehydrogenation is taking place over the catalysts:
Multiplication of each and every point having arbitrary unit in Figure 10 by an
average factor of 2.8 gives the data of Figure 9. This calculation also shows the
consistency of the analyses carried out by GC since both hydrogen and
acetaldehyde flow rates should be equal as they were produced equimolar by the
only reaction, ethanol dehydrogenation.
ZnO/SiO2 mixed oxide shows both acidic (Lewis acid) and basic properties [41].
Ethanol dehydrogenation occurs over basic sites of the catalyst which are
capable of dissociating H-H and C-H bonds of ethanol [24,39,42]. Ethanol
dehydration to ethylene, on the other hand, takes place over acidic sites
[11,28,32,33,39,42]. As none of the catalysts has produced some remarkable
amount of ethylene, it can be said that all Set I catalysts act as bases under
reaction conditions. However, basicity of the catalysts decreases upon metal
promotion.
Cu catalysts, especially Cu/ZnO, are known as active catalysts for acetaldehyde
hydrogenation [12,13,16]. It has also been shown that over metallic copper, and

44
alumina-, silica- and zinc oxide-supported copper catalysts acetaldehyde and
hydrogen can be produced with almost 100% ethanol conversion
[24,25,27,28,38]. On the other hand, it has also been demonstrated that over
some Pd catalysts again acetaldehyde and hydrogen were obtained as the only
products [29]. Pd-Zn alloys formed during the preparation of Pd/ZnO catalysts
help them exhibit similar catalytic activities with copper catalysts [37].
Acetaldehyde was also produced over Pd-Zn alloys of Pd/ZnO catalysts [38].
As such studies are available in literature it was no surprise to obtain such a
product distribution over Set I catalysts. Yet, it is interesting to get poorer results
with metal promoted ones. From above discussion, it can be deduced that
dehydrogenation of ethanol took place over Pd/Zn alloys in sample 3. And, poor
activities compared to non-promoted catalysts can be attributed to the presence
of zinc silicates and metal zincates (like Pd/Zn) in pores, closed at the ends,
which are, therefore, not accessible to reacting molecules. This may also explain
the reason in the decrease of basic strength with metal addition.
GasChrom MP-1 used to separate analytes has low affinity to water. For this,
only low levels of water in organic solvents or organics in water can be analyzed
by GasChrom MP-1 [43]. The latter one applies here, and due to huge
fluctuations in the areas of water peaks results of water analyses were not taken
into account. As only ethanol dehydrogenation is occurring in the reactor, what
comes in as water should leave without being consumed. On the other hand,
ethanol and water are sent in a 1:3 mole ratio as liquid to the system. Analyses of
the gaseous phase obtained at “no reaction” temperature of 200°C for all
catalysts showed that this ratio was in fact smaller. This can be attributed to the
erroneous water peaks and it can be assumed that the mole ratio in the liquid
phase was retained also in the gaseous phase.
No reproducibility experiments were carried out with fresh catalysts. However,
used samples 1 and 6 were tested once again in the setup. Again only

45
acetaldehyde and hydrogen constituted the product distribution. As seen in
Figures 11 and 12 there observed deactivation in both catalysts.
0
2
4
6
8
10
0
0.5
1
1.5
2
2.5
3
3.5
250 300 350 400 450 500 550
Fresh (H2)Used (H2)
Fresh (C2H4O)Used (C2H4O)
Hyd
roge
n Fl
owra
te (a
.u.)
Acetaldehyde Flow
rate (a.u.)
Temperature (oC)
Figure 11. Deactivation in sample 1 (EtOH:H2O=1:3, GHSV~54000 cm3/h-g
catalyst, flow rate~90 cm3/min. Mass of catalyst=0.1 g.)
Figures 9-12 were drawn without using any calibration data. They were simply
plotted considering hydrogen and acetaldehyde peak areas obtained in the
analyses of the gas syringe samples, and processing those data with the argon
areas to take the effect of the change in the flow rate, as reaction temperature
increases, into account. This way, separate scales of arbitrary units were
obtained for each species. When the data were to be further processed with the

46
0
5
10
15
20
25
30
0
2
4
6
8
10
250 300 350 400 450 500 550
Fresh (H2)Used (H2)
Fresh (C2H4O)Used (C2H4O)
Hyd
roge
n Fl
owra
te (a
.u.)
Acetaldehyde Flow
rate (a.u.)
Temperature (oC)
Figure 12. Deactivation in sample 6 (EtOH:H2O=1:3, GHSV~54000 cm3/h-g
catalyst, flow rate~90 cm3/min. Mass of catalyst=0.1 g.)
calibration data, however, somewhat mistaken results would arise. Calibrations
of gases, H2, CH4, CO2 and C2H4 were done using another setup by gas syringes,
and of C2H4O, C2H6O and H2O, by liquid syringes of microliters. It is, therefore,
very probable to arrive in incorrect figures after calculations using all calibration
data together. Nevertheless, hydrogen flow rates of Figure 9 were re-plotted also
using such calibration data as seen in Figure 13. Figure 13 is different from
Figure 9. This shows that calibration appears as one of the major contributors, if
there is any other, to the erroneous results. That is why, no completely-processed
counterparts of Figures 9-12 will be given here.
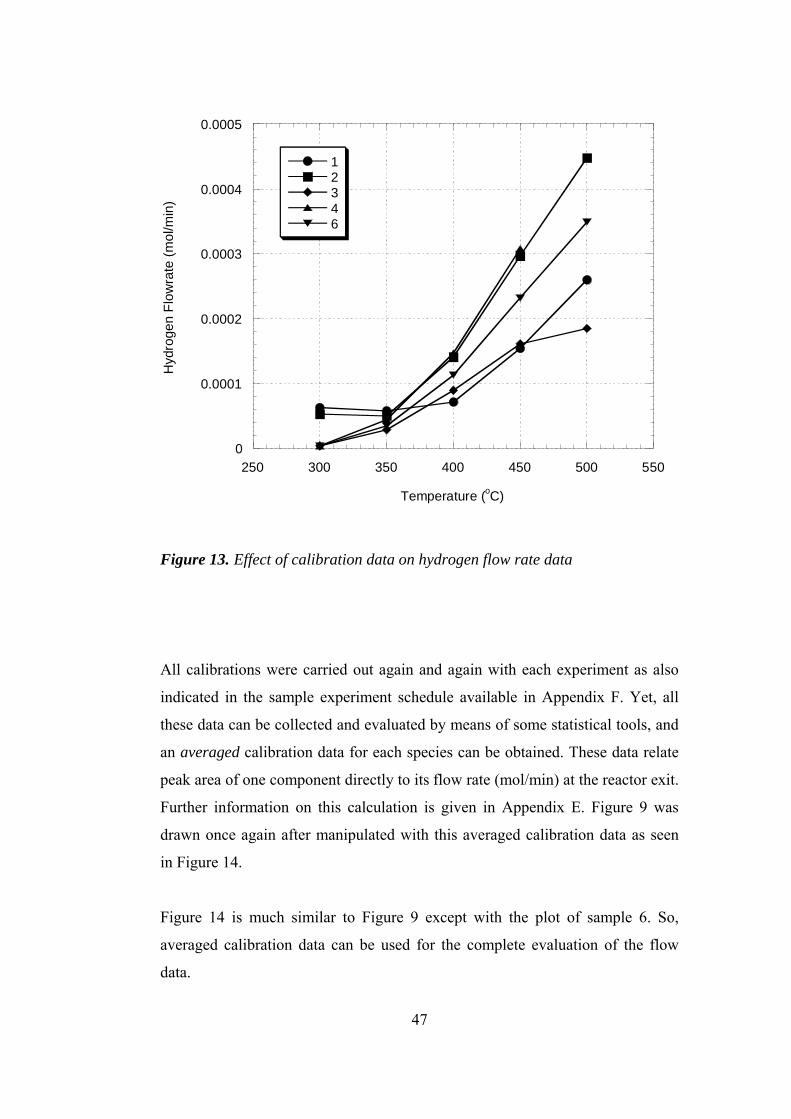
47
0
0.0001
0.0002
0.0003
0.0004
0.0005
250 300 350 400 450 500 550
12346
Hyd
roge
n Fl
owra
te (m
ol/m
in)
Temperature (oC)
Figure 13. Effect of calibration data on hydrogen flow rate data
All calibrations were carried out again and again with each experiment as also
indicated in the sample experiment schedule available in Appendix F. Yet, all
these data can be collected and evaluated by means of some statistical tools, and
an averaged calibration data for each species can be obtained. These data relate
peak area of one component directly to its flow rate (mol/min) at the reactor exit.
Further information on this calculation is given in Appendix E. Figure 9 was
drawn once again after manipulated with this averaged calibration data as seen
in Figure 14.
Figure 14 is much similar to Figure 9 except with the plot of sample 6. So,
averaged calibration data can be used for the complete evaluation of the flow
data.

48
0
0.0001
0.0002
0.0003
0.0004
0.0005
250 300 350 400 450 500 550
12346
Hyd
roge
n Fl
owra
te (m
ol/m
in)
Temperature (oC)
Figure 14. Hydrogen flow rates re-plotted using averaged calibration data
Figure 15 shows the results of the time-on-stream test carried out for sample 1 at
500°C for about 48 hours, which were evaluated by averaged calibration data.
As seen in Figure 15 there is a continuous decrease in ethanol flow rate. While
this experiment was running it was also observed that the decrease in the
ethanol-water level in the cooler of the feeding unit (Figure 6) was decreasing by
time. These two observations indicate that the peristaltic pump cannot pump the
same amount of liquid as time passes which is most probably due to continuous
treading of the rollers on the capillary tubing. Yet, as also seen in Figure 15, this
does not have much significant effect on the flow rates of hydrogen,
acetaldehyde, methane and ethylene as long as there still exist some ethanol in
the reacting stream. Several studies in the literature [31-33] have reported a
decrease in ethanol conversion which did not affect the selectivities of

49
0
5 10-5
0.0001
0.00015
0.0002
0.00025
0.0003
0.00035
0 10 20 30 40 50
H2CH4C2H4C2H4OC2H6O
Flow
rate
(mol
/min
)
Time (h)
Figure 15. Time-on-stream test of sample 1 at 500°C (Lines shown are linear
curve fits.)
the products during time-on-stream tests of different catalysts. The situation here
is not fully same with what has been described in those studies. Firstly, a
decrease in ethanol conversion means an increase in its exit flow rate, and here,
it is just the opposite. Secondly, unaffected selectivities do not always mean that
the total flow rate of the products keeps constant. Decrease in the flow rates of
the reactants decreases productivity, but at the same time, this also decreases the
space velocity which promotes productivity. Therefore, unaffected flow rates or
selectivities of hydrogen, acetaldehyde, and other minor products in the time-on-
stream test can be attributed to this cancellation effect. On the other hand, almost
constant flow rates of Figure 15 indicate that, contrary to what has been
discussed on Figures 11 and 12, there is no catalyst deactivation on-stream.

50
Assuming similar behavior in the pumping of the liquid feed to the system in
every experiment, the data of the previous experiments are still comparable. This
can be seen in the hydrogen and acetaldehyde flow rates obtained by samples 4
and 6, which are almost equal at each temperature, as seen in Figures 9 and 10,
respectively. This was an expected result as the compositions of those catalysts
do not differ from each other. Decrease in the ethanol-water amount fed to the
system, however, indicates a decrease in the space velocities as mentioned
above. So, calculated space velocities were not, or at least, might not be what
were obtained at the end of the experiments. It is expected to gain a higher
selectivity towards hydrogen under lower space velocities; therefore, flow rates
of the products at higher temperatures shown in the previous figure may appear
to be higher than what should be under calculated space velocities7.
Due to the discussion above no explicit ethanol conversion plots and no explicit
hydrogen selectivity plots were given here, as Figures 9 and 10 already give an
insight to them.
Elemental carbon balance was also carried out for all experiments done using
both same-day calibration data and averaged calibration data. Carbon in the
carbon-containing species at the reactor exit at every temperature is compared
with the carbon in the ethanol exiting the reactor at 200°C, the no-reaction
temperature. Percent errors in carbon balances are given in Table A.6 in
Appendix D. A positive figure can be expressed as a “carbon consumption or
accumulation,” and a negative figure as a “carbon generation.”
More positive values at higher temperatures would befit to the previous
discussions as ethanol pumping rate is known to decrease with time (or, here,
temperature) and as a possible coking action would result in a carbon
accumulation. However, Table A.6 presents a set of data which is just the
opposite. One reason of this can be a possible distillation effect in the bulb of the
7 All steam reforming tests were done by increasing the reactor temperature after completing analyses in one temperature.

51
feeding unit which causes more water to go into reactor at the beginning of the
experiments. Yet, this was proved to be irrelevant by the ethanol decrease of
Figure 158. As it was also observed almost equal hydrogen and acetaldehyde
flow rates in the time-on-stream test, the only reason left can then be the
incorrect calibrations of ethanol, which is one of the two major carbon-
containing species other than acetaldehyde, done by using liquid syringes of
microliters.
4.2.2. Autothermal Reforming
Autothermal reforming experiments were done with samples 2 and 3 of Set I,
and with the Set II catalyst, sample 7. Again, flow rates and compositions of
both liquid and gaseous phases of the reacting medium are given in Table 8.
Again, 0.1 g catalysts were used in the experiments. Calculated space velocities
for Set I catalyst tests remained the same as given in §4.2.1. For sample 7,
however, two different tests were performed, one with high space velocity, and
one with low space velocity. For the former test, space velocity was kept almost
same with all previous experiments, 52000 cm3/h-g catalyst which corresponds,
however, to 20000 h-1 due to high packing volume9. Low space velocity, on the
other hand, equals to 31000 cm3/h-g catalyst (12000 h-1)10. These are all
calculated values, and as shown in the previous section, they do not remain same
throughout the whole experiment and, unfortunately, decrease.
Results showed that presence of oxygen in the reacting stream changed the
product distribution a little bit by adding three more products. Analyses of the
condensates collected in the condenser for disposal purposes showed that two of
those species are in liquid phase under room temperature. Unfortunately, those
species could not be identified. On the other hand, traces of species like diethyl
8 So, the assumption of same gaseous composition with that in liquid is still valid. 9 Corresponding to space time of 0.07 g catalyst.s/cm3 or 0.18 s. 10 Corresponding to space time of 0.12 g catalyst.s/cm3 or 0.3 s.

52
0
0.0001
0.0002
0.0003
0.0004
0.0005
250 300 350 400 450 500 550
2 (AR)2 (SR)3 (AR)3 (SR)7 (HSV)7 (LSV)
Hyd
roge
n Fl
owra
te (m
ol/m
in)
Temperature (oC)
Figure 16. Effect of temperature and catalyst on hydrogen flow rate (AR:
Autothermal Reforming. SR: Steam Reforming. HSV: AR with high space
velocity. LSV: AR with low space velocity. Calculated parameters:
EtOH:H2O=1:3; GHSV~54000 cm3/h-g catalyst (SR, AR, HSV) ~31000 cm3/h-g
catalyst (LSV); flow rate~90 cm3/min (SR) ~86 cm3/min (AR, HSV) ~51 cm3/min
(LSV). Measured parameters: Mass of catalyst=0.1 g.)
ether, ethyl acetate, ethane, acetic acid, acetone or formaldehyde reported in the
literature were not observed.
As there were some major unidentified peaks in the analyses, it would be
appropriate to present the results of the experiments in a fashion done in the
previous section. Figures 16 to 20 illustrate the exit flow rates of hydrogen,
acetaldehyde, methane, carbon dioxide and ethylene, respectively, obtained over
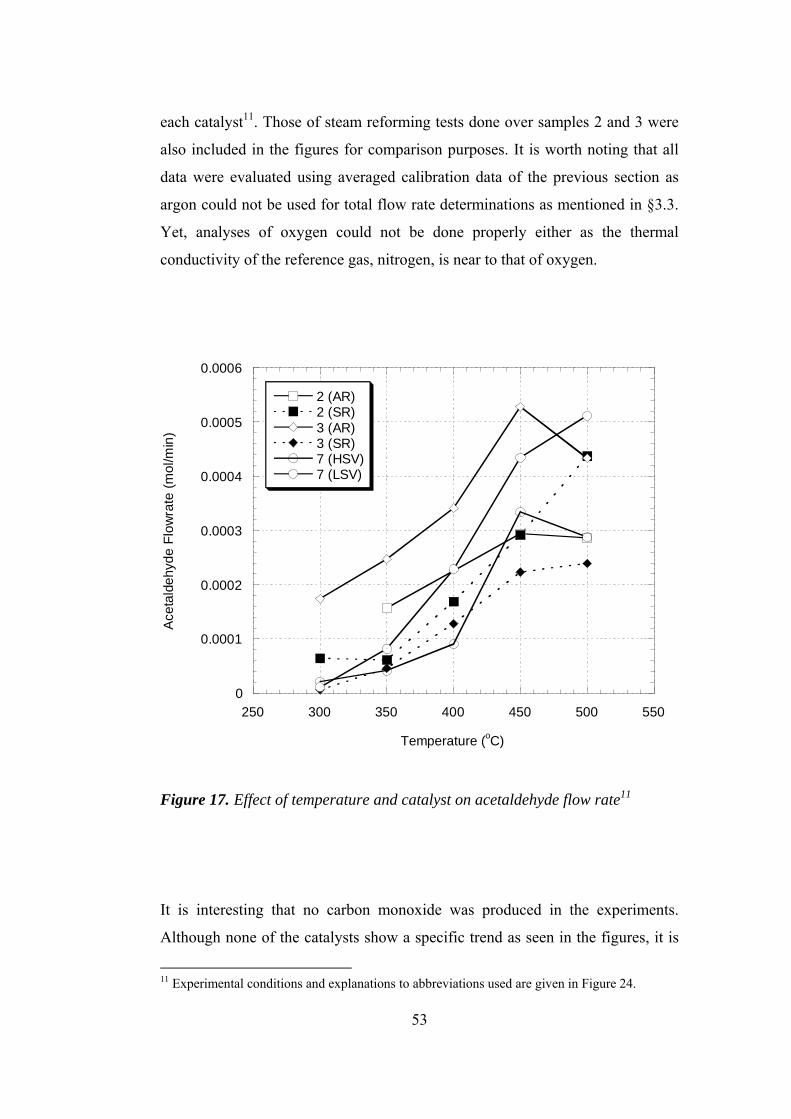
53
each catalyst11. Those of steam reforming tests done over samples 2 and 3 were
also included in the figures for comparison purposes. It is worth noting that all
data were evaluated using averaged calibration data of the previous section as
argon could not be used for total flow rate determinations as mentioned in §3.3.
Yet, analyses of oxygen could not be done properly either as the thermal
conductivity of the reference gas, nitrogen, is near to that of oxygen.
0
0.0001
0.0002
0.0003
0.0004
0.0005
0.0006
250 300 350 400 450 500 550
2 (AR)2 (SR)3 (AR)3 (SR)7 (HSV)7 (LSV)
Acet
alde
hyde
Flo
wra
te (m
ol/m
in)
Temperature (oC)
Figure 17. Effect of temperature and catalyst on acetaldehyde flow rate11
It is interesting that no carbon monoxide was produced in the experiments.
Although none of the catalysts show a specific trend as seen in the figures, it is
11 Experimental conditions and explanations to abbreviations used are given in Figure 24.

54
also strange enough to observe higher acetaldehyde flow rates compared to
hydrogen. Acetaldehyde flow rates would be expected to be lower since
acetaldehyde usually acts as an intermediate in the production of hydrogen. This
is most probably a consequence of evaluation of raw data with the averaged
calibration data as it is very unlikely for hydrogen to take place in the formation
of larger molecules, maybe one or more of those unidentified species. As no
carbon monoxide was also produced effect of water-gas shift reaction is
eliminated. Therefore, it is reasonable to compare the catalysts on the basis of
each species produced as done in Figures 16-20.
As seen in Figure 16, steam reforming over samples 2 and 3 still gives higher
hydrogen productivity except for authermal reforming of sample 2 which seems
to be better. Both high space velocity and low space velocity experiments of
0
5 10-5
0.0001
0.00015
0.0002
250 300 350 400 450 500 550
2 (AR)2 (SR)3 (AR)3 (SR)7 (HSV)7 (LSV)
Met
hane
Flo
wra
te (m
ol/m
in)
Temperature (oC)
Figure 18. Effect of temperature and catalyst on methane flow rate11
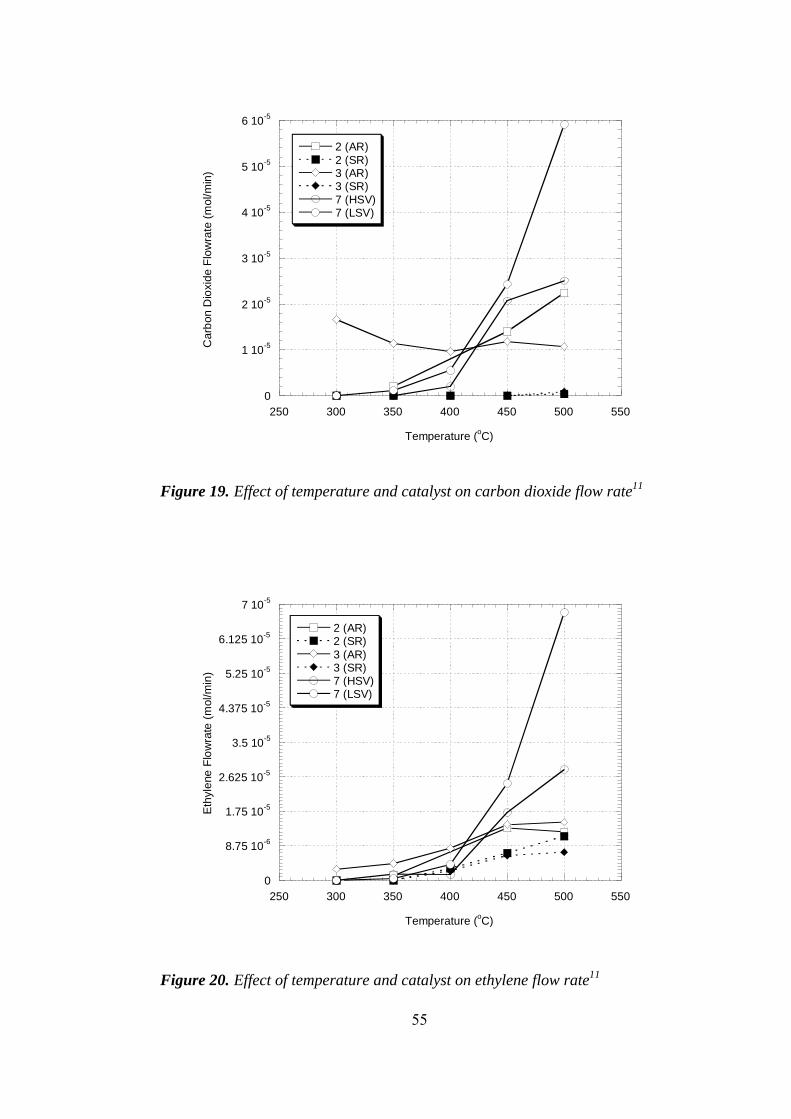
55
0
1 10-5
2 10-5
3 10-5
4 10-5
5 10-5
6 10-5
250 300 350 400 450 500 550
2 (AR)2 (SR)3 (AR)3 (SR)7 (HSV)7 (LSV)
Car
bon
Dio
xide
Flo
wra
te (m
ol/m
in)
Temperature (oC)
Figure 19. Effect of temperature and catalyst on carbon dioxide flow rate11
0
8.75 10-6
1.75 10-5
2.625 10-5
3.5 10-5
4.375 10-5
5.25 10-5
6.125 10-5
7 10-5
250 300 350 400 450 500 550
2 (AR)2 (SR)3 (AR)3 (SR)7 (HSV)7 (LSV)
Ethy
lene
Flo
wra
te (m
ol/m
in)
Temperature (oC)
Figure 20. Effect of temperature and catalyst on ethylene flow rate11

56
cobalt catalyst, however, showed the poorest selectivity towards hydrogen. Yet,
higher hydrogen flow rates were obtained when running with low space velocity.
On the other hand, formation of ethylene, methane and carbon dioxide increased
with the presence of oxygen. Cobalt catalyst showed higher productivity towards
ethylene and carbon dioxide. Moreover, by decreasing the space velocity higher
flow rates for all products were obtained over the cobalt catalyst. Here, it is
worth noting that experiment for low space velocity cobalt testing was started at
500°C and ended up at 200°C.
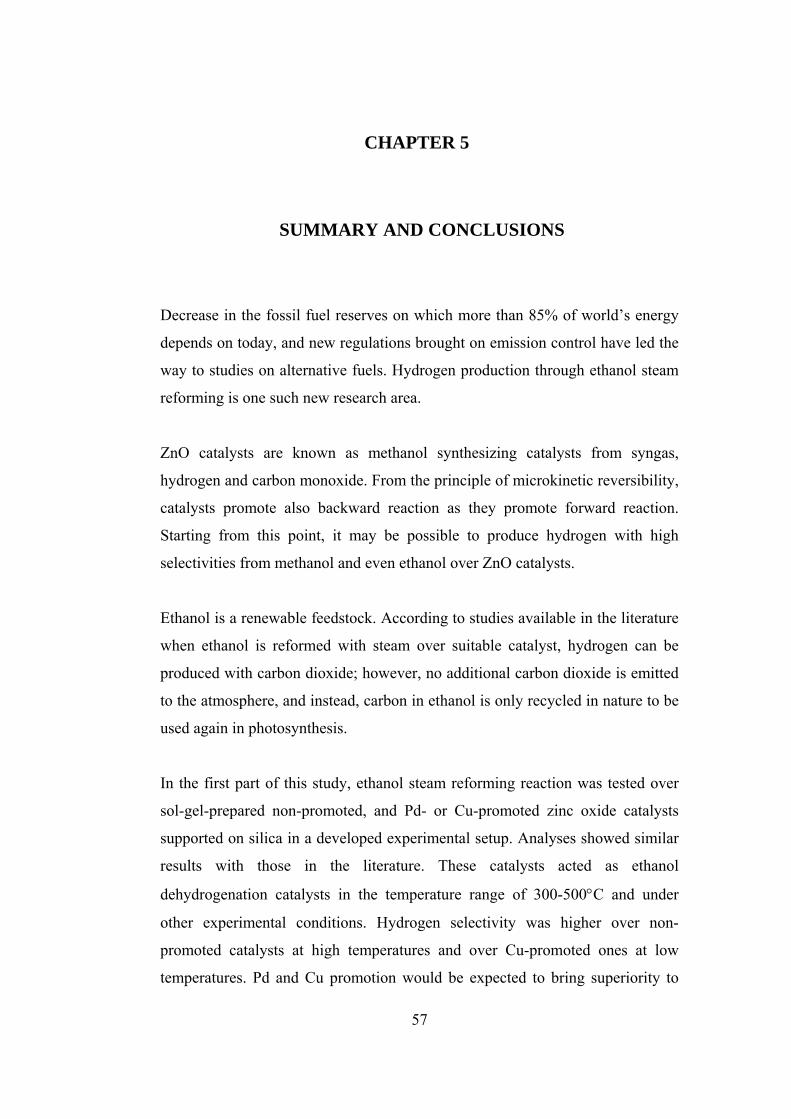
57
CHAPTER 5
5. SUMMARY AND CONCLUSIONS5.
Decrease in the fossil fuel reserves on which more than 85% of world’s energy
depends on today, and new regulations brought on emission control have led the
way to studies on alternative fuels. Hydrogen production through ethanol steam
reforming is one such new research area.
ZnO catalysts are known as methanol synthesizing catalysts from syngas,
hydrogen and carbon monoxide. From the principle of microkinetic reversibility,
catalysts promote also backward reaction as they promote forward reaction.
Starting from this point, it may be possible to produce hydrogen with high
selectivities from methanol and even ethanol over ZnO catalysts.
Ethanol is a renewable feedstock. According to studies available in the literature
when ethanol is reformed with steam over suitable catalyst, hydrogen can be
produced with carbon dioxide; however, no additional carbon dioxide is emitted
to the atmosphere, and instead, carbon in ethanol is only recycled in nature to be
used again in photosynthesis.
In the first part of this study, ethanol steam reforming reaction was tested over
sol-gel-prepared non-promoted, and Pd- or Cu-promoted zinc oxide catalysts
supported on silica in a developed experimental setup. Analyses showed similar
results with those in the literature. These catalysts acted as ethanol
dehydrogenation catalysts in the temperature range of 300-500°C and under
other experimental conditions. Hydrogen selectivity was higher over non-
promoted catalysts at high temperatures and over Cu-promoted ones at low
temperatures. Pd and Cu promotion would be expected to bring superiority to

58
ZnO catalysts; however, it didn’t come out to be so. The reason of this can be
attributed to the presence of possible zinc silicates and metal zincates enclosed
in closed pores which are not reachable to adsorbed gas molecules. These closed
pores can also be the reason in the decrease in BET surface area and basic
strength with metal addition to the catalyst.
Deactivation due to air contact was observed when used catalysts were tested
once again later in the setup. On the other hand, there was no deactivation on-
stream.
It was further detected that selectivities were not affected much by the decrease
in ethanol and water amount in the reacting medium as long as there exist some.
In the second part of the study, steam reforming experiments were carried out
this time with the presence of oxygen or air over those promoted zinc oxide
catalysts and over SBA-15-supported cobalt catalyst. These autothermal
reforming tests showed similar hydrogen selectivities over promoted zinc oxide
catalysts when compared with their steam reforming results. On the other hand,
hydrogen selectivities were lower over the cobalt catalyst. Formation of side
products like methane, carbon dioxide, ethylene, and three more species which
could not be identified increased in autothermal reforming experiments.
Formation of carbon monoxide was not seen in any of the experiments.
59
CHAPTER 6
6. RECOMMENDATIONS6.
As mentioned previously, setting up a proper feeding unit and trying to establish
a working experimental system took about three fourth of the time spent on this
study as dealing with three-phase systems is not an easy task. Still, results of the
experiments revealed the problems existing with the feeding unit due to
changing pumping rate of the peristaltic pump. A syringe pump could have been
used instead of a peristaltic pump in the setup to obtain a steady feeding.
On the other hand, carrying the analytes to GC in a gas syringe was not an easy
task either. First of all, before taking samples from sampling vessel into the
syringe, syringe was heated by a heating gun not to let any condensation to
happen within the syringe. This was something reducing the lifespan of the
syringe as heating may harm the Teflon structures. So, one should be as quick as
possible not to lose time while taking the sample and injecting it to GC.
Secondly, the injection port of the GC was equipped with a septum as the
sampling vessel, and septum particles were, most of the time, blocking the
needles of the syringes. Trying to take those particles out of the needle was
something annoying and time consuming as it was causing termination of the
experiment to delay. For this, analytes should have been sent to GC on-line
instead of by using syringes. However, this time the line from the reactor to the
injection port of the GC would need to be surrounded by a longer heating tape or
by extra heating tapes which was not possible due to unavailability.
A longer column had to be used, and low flow rates along with a temperature
ramp had to be applied in GC in order to separate species like hydrogen, carbon
monoxide, methane and carbon dioxide which come out of the column rather
60
quickly while trying to decrease the retention time of the final component,
ethanol, as much as possible. As a result of this, one analysis lasted for about 1
hour. For this, analysis time was the major reason in having long experiments
usually lasting for more than one day. Incorrect injections due to condensation in
the syringe or plugged syringe needle also caused additional delays.
On the other hand, the most unpleasant situations occurred when the electricity
was cut. Many analyses and experiments were terminated as a result of
electricity cuts. For this, laboratories should be equipped with generators as
sudden voltage changes not only terminate the experiments but also give harm to
expensive equipments like GCs.
Analyses of autothermal reforming experiments could not be carried out
completely as argon used as the total flow determinant could not be separated
from oxygen in the column. Sending helium instead of argon would not solve
the problem either as this time helium, hydrogen and carbon monoxide would
not be separated. Changing the reference gas of the GC to helium and using
nitrogen in the setup both as the carrier gas and the internal standard would not
be effective also since hydrogen would not be analyzed properly due to very
near thermal conductivities with the reference gas, helium. The only solution
could be a concurrent analysis in another GC.
Finally, a more practical method needed to be used for calibration as the major
contributor to erroneous results was shown to be the calibration data. For
instance, a volumetric calibration of feed and products could have been carried
out in which volumetric decrease in the ethanol-water solution of the cooler with
time could have been recorded, and several sets at the “no-reaction” temperature
could have been carried out. This way, ethanol could have been more accurately
calibrated.
61
REFERENCES
1. Energy Information Administration (EIA), International Energy Annual 2001, Washington, D.C. (2003)
2. Energy Information Administration (EIA), System for the Analysis of Global
Energy Markets (2004) 3. Campbell, C.J. and Laherrere, J.H., “The End of Cheap Oil,” Scientific
American, 78 (March 1998) 4. Aupretre, F., Descorme, C., Duprez, D., Catalysis Communications, 3, 263
(2002) 5. The Cooperative Research Centre for Greenhouse Accounting, “About
Greenhouse,” http://www.greenhouse.crc.org.au/crc/ecarbon/history.htm (Last accessed: June 2005)
6. Austin, G.T., Shreve’s Chemical Process Industries, 5th Ed., Ch. 7, 101,
McGraw-Hill (1984) 7. Deluga, G.A., Salge, J.R., Schmidt, L.D., Verykios, X.E., Science, 303, 993
(2004) 8. Bioethanol – the Climate-Cool Fuel: Biofuels for the Global Environmental
Fact Sheet, National Renewable Energy Laboratory, Golden, CO, US (1997) 9. Trimm, D.L. and Önsan, Z.I., Catalysis Reviews, 43, 1&2, 31 (2001) 10. The Clean Cities Alternative Fuel Price Report, U.S. Department of Energy
(November 26, 2004) 11. Claus, P., Lucas, M., Lücke, B., Applied Catalysis A: General, 79, 1 (1991) 12. Nunan, J.G., Bogdan, C.E., Klier, K., Smith, K.J., Young, C.W., Herman,
R.G., Journal of Catalysis, 113, 410 (1988) 13. Nunan, J.G., Herman, R.G., Klier, K., Journal of Catalysis, 116, 222 (1989) 14. Klier, K., Beretta, A., Sun, Q., Feeley, O.C., Herman, R.G., Catalysis Today,
36, 3 (1997) 15. Smith, K.J., Young, C.W., Herman, R.G., Klier, K., Industrial &
Engineering Chemistry Research, 30, 61 (1991)

62
16. Ehwald, H., Ewald, H., Gutschick, D., Hermann, M., Miessner, H., Öhlmann, G., Schierborn, E., Applied Catalysis, 76, 153 (1991)
17. Garcia, E.Y. and Laborde, M.A., International Journal of Hydrogen Energy,
16, 5, 307 (1991) 18. Vasudeva, K., Mitra, N., Umasankar, P., Dhingra, S.C., International
Journal of Hydrogen Energy, 21, 1, 13 (1996) 19. Fishtik, I., Alexander, A., Datta, R., Geana, D., International Journal of
Hydrogen Energy, 25, 31 (2000) 20. Ioannides, T., Journal of Power Sources, 92, 17 (2001) 21. Tsiakaras, P. and Demin, A., Journal of Power Sources, 102, 210 (2001) 22. Choi, Y. and Stenger, H.G., Applied Catalysis B: Environmental, 38, 259
(2002) 23. Cheng, W.H., Applied Catalysis A: General, 130, 13 (1995) 24. Reddy, B.M., Reddy, E.P., Manohar, B., Journal of the Chemical Society-
Chemical Communications, 14 (1992) 25. Freni, S., Mondello, N., Cavallaro, S., Cacciola, G., Parmon, V.N.,
Sobyanin, V.A., Reaction Kinetics and Catalysis Letters, 71, 1, 143 (2000) 26. Rostrup-Nielsen, J.R., Catalysis, Science and Technology, 5, Ch. 1, Berlin
(1984) 27. Mariño, F.J., Cerrella, E.G., Duhalde, S., Jobbagy, M., Laborde, M.A.,
International Journal of Hydrogen Energy, 23, 12, 1095 (1998) 28. Mariño, F., Baronetti, G., Jobbagy, M., Laborde, M., Applied Catalysis A:
General, 238, 41 (2003) 29. Galvita, V.V., Semin, G.L., Belyaev, V.D., Semikolenov, V.A., Tsiakaras,
P., Sobyanin, V.A., Applied Catalysis A: General, 220, 123 (2001) 30. Galvita, V.V., Belyaev, V.D., Semikolenov, V.A., Tsiakaras, P., Frumin, A.,
Sobyanin, V.A., Reaction Kinetics and Catalysis Letters, 76, 2, 343 (2002) 31. Freni, S., Journal of Power Sources, 94, 14 (2001) 32. Fatsikostas, A.N., Kondarides, D.I., Verykios, X.E., Chemical
Communications, 9, 851 (2001)
63
33. Liguras, D.K., Kondarides, D.I., Verykios, X.E., Applied Catalysis B: Environmental, 43, 345 (2003)
34. Cavallaro, S., Chido, V., Freni, S., Mondello, N., Frusteri, F., Applied
Catalysis A: General, 249, 119 (2003) 35. Llorca, J., Homs, N., Sales, J., Ramirez de la Piscina, P., Journal of
Catalysis, 209, 306 (2002) 36. Cavallaro, S. and Freni, S., International Journal of Hydrogen Energy, 21, 6,
465 (1996) 37. Takezawa, N. and Iwasa, N., Catalysis Today, 36, 45 (1997) 38. Iwasa, N., Yamamoto, O., Tamura, R., Nishikubo, M., Takezawa, N.,
Catalysis Letters, 62, 179 (1999) 39. Llorca, J., Ramirez de la Piscina, P., Sales, J., Homs, N., Chemical
Communications, 7, 641 (2001) 40. Cannas, C., Mainas, M., Musinu, A., Piccaluga, G., Composites Science and
Technology, 63, 8, 1187 (2003) 41. Tanabe, K., Misono, M., Ono, Y., Hattori, H., Studies in Surface Science and
Catalysis, 51, 27 (1989) 42. Tanabe, K., Misono, M., Ono, Y., Hattori, H., Studies in Surface Science and
Catalysis, 51, 215 (1989) 43. Chromatography Catalog 450, 173, Alltech (1999) 44. Sandler, S.I., Chemical and Engineering Thermodynamics, 3rd Ed., 744,
Wiley (1999) 45. Larminie, J. and Dicks, A., Fuel Cell Systems Explained, Ch. 3, 37, Wiley
(2000) 46. Peters, M.S. and Timmerhaus, K.D., Plant Design and Economics for
Chemical Engineers, 4th Ed., 800, McGraw-Hill (1991) 47. Brinker, C.J., Keefer, K.D., Schaefer, D.W., Assink, R.A., Kay, B.D.,
Ashley, C.S., Journal of Non-Crystalline Solids, 63, 45 (1984)
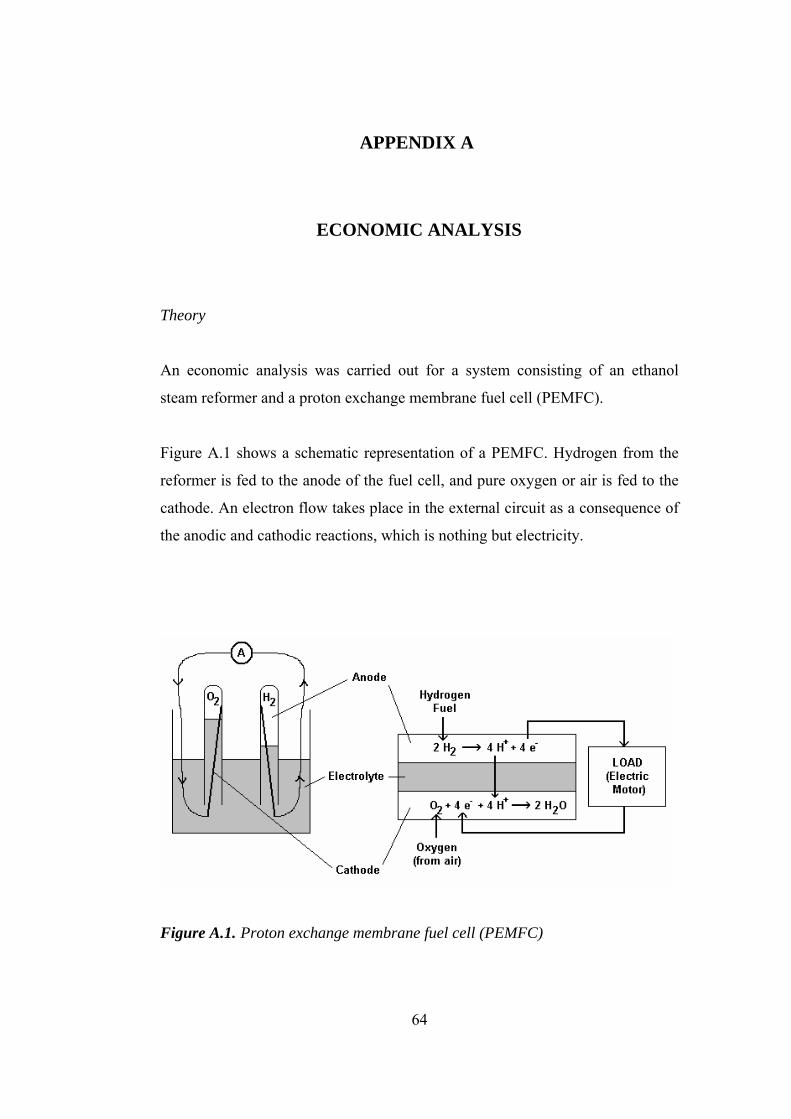
64
APPENDIX A
A. ECONOMIC ANALYSIS
Theory
An economic analysis was carried out for a system consisting of an ethanol
steam reformer and a proton exchange membrane fuel cell (PEMFC).
Figure A.1 shows a schematic representation of a PEMFC. Hydrogen from the
reformer is fed to the anode of the fuel cell, and pure oxygen or air is fed to the
cathode. An electron flow takes place in the external circuit as a consequence of
the anodic and cathodic reactions, which is nothing but electricity.
Figure A.1. Proton exchange membrane fuel cell (PEMFC)

65
Studies available in the literature have shown that it is possible to obtain almost
complete conversions in ethanol steam reforming with very high hydrogen
selectivities at elevated temperatures. Therefore, at the very beginning of the
analysis it was assumed that complete reaction to carbon dioxide and hydrogen
was taking place in the reformer of the system. Reactants, ethanol and water of
the reformer, and air of the fuel cell, were then assumed to be fed to the system
at room temperature. Operating temperature of PEMFC was further assumed to
be 75°C which is a typical value. Temperature of the effluent from the reformer
leaving at a high reforming temperature should then be lowered to 75°C.
Therefore, it is reasonable to assume for the steam reforming as taking place at
75°C since heat necessary to increase the temperature of ethanol and water in the
reformer high above 75°C would well be gained back while lowering the
temperature of carbon dioxide and hydrogen to 75°C.
Figure A.2. Enthalpy-temperature diagram
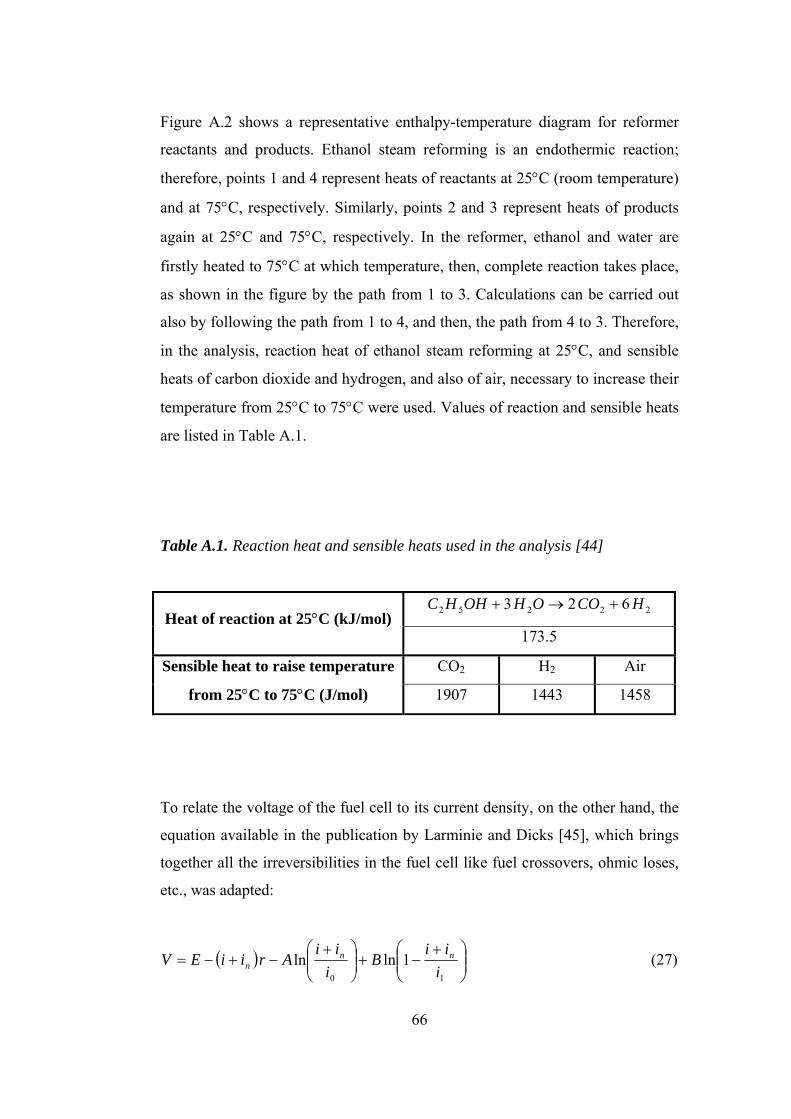
66
Figure A.2 shows a representative enthalpy-temperature diagram for reformer
reactants and products. Ethanol steam reforming is an endothermic reaction;
therefore, points 1 and 4 represent heats of reactants at 25°C (room temperature)
and at 75°C, respectively. Similarly, points 2 and 3 represent heats of products
again at 25°C and 75°C, respectively. In the reformer, ethanol and water are
firstly heated to 75°C at which temperature, then, complete reaction takes place,
as shown in the figure by the path from 1 to 3. Calculations can be carried out
also by following the path from 1 to 4, and then, the path from 4 to 3. Therefore,
in the analysis, reaction heat of ethanol steam reforming at 25°C, and sensible
heats of carbon dioxide and hydrogen, and also of air, necessary to increase their
temperature from 25°C to 75°C were used. Values of reaction and sensible heats
are listed in Table A.1.
Table A.1. Reaction heat and sensible heats used in the analysis [44]
22252 623 HCOOHOHHC +→+ Heat of reaction at 25°C (kJ/mol)
173.5
CO2 H2 Air Sensible heat to raise temperature
from 25°C to 75°C (J/mol) 1907 1443 1458
To relate the voltage of the fuel cell to its current density, on the other hand, the
equation available in the publication by Larminie and Dicks [45], which brings
together all the irreversibilities in the fuel cell like fuel crossovers, ohmic loses,
etc., was adapted:
( ) ⎟⎟⎠
⎞⎜⎜⎝
⎛ +−+⎟⎟
⎠
⎞⎜⎜⎝
⎛ +−+−=
10
1lnlni
iiB
iii
AriiEV nnn (27)

67
where, E: reversible open circuit voltage,
in: internal and fuel crossover equivalent current density,
A: slope of the Tafel line,
i0: either exchange current density at the cathode if the cathodic
overvoltage is much greater than the anodic, or a function of both
exchange current densities,
B: constant related to mass transfer overvoltage,
il: limiting current density at the electrode which has the lowest current
density,
r: area specific resistance.
Typical values for the constants of this equation were also taken from the same
source as listed in Table A.2.
Table A.2. Typical constants in equation (27) for PEMFC [45]
Constant Typical value for PEMFC
E (volt) 1.2
in (mA/cm2) 2
R (kΩ/cm2) 30×10-6
i0 (mA/cm2) 0.067
A (volt) 0.06
B (volt) 0.05
i1 (mA/cm2) 900
Ethanol and electricity costs were taken from Peters and Timmerhaus [46].
Table A.3 lists the values of them. On the other hand, heat is always generated in
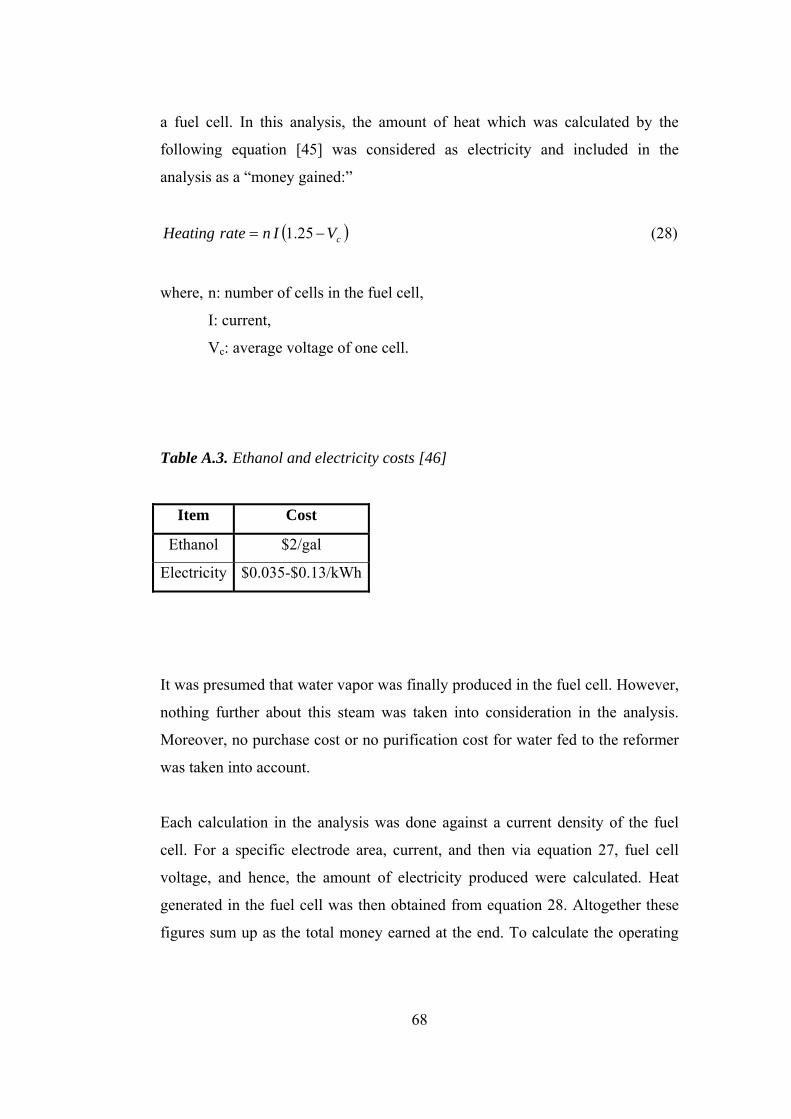
68
a fuel cell. In this analysis, the amount of heat which was calculated by the
following equation [45] was considered as electricity and included in the
analysis as a “money gained:”
( )cVInrateHeating −= 25.1 (28)
where, n: number of cells in the fuel cell,
I: current,
Vc: average voltage of one cell.
Table A.3. Ethanol and electricity costs [46]
Item Cost
Ethanol $2/gal
Electricity $0.035-$0.13/kWh
It was presumed that water vapor was finally produced in the fuel cell. However,
nothing further about this steam was taken into consideration in the analysis.
Moreover, no purchase cost or no purification cost for water fed to the reformer
was taken into account.
Each calculation in the analysis was done against a current density of the fuel
cell. For a specific electrode area, current, and then via equation 27, fuel cell
voltage, and hence, the amount of electricity produced were calculated. Heat
generated in the fuel cell was then obtained from equation 28. Altogether these
figures sum up as the total money earned at the end. To calculate the operating

69
cost, or in other words, the total money spent, hydrogen fuel usage was
calculated using the following formula:
FIusageHydrogen
2= (29)
where, I: current,
F: Faraday constant.
From this value, amounts of ethanol and air used in the system were obtained
through reaction stoichiometries. Finally, ethanol cost together with sensible
heat costs and reaction heat cost gave the operating cost.
Same analysis was also carried out for ethanol autothermal reforming. Again
complete conversion was assumed to carbon dioxide and hydrogen. Different
from steam reforming case, autothermal reforming also uses oxygen in the
reformer. So, it was assumed that air was also fed to the reformer as the oxygen
source. However, then, sensible heat change of nitrogen in the reformer was
included in the calculations as well.
Results
Deluga et al. [7] made use of a perfect fuel cell assuming that hydrogen fed to
the fuel cell is totally converted into steam and the exothermic heat of this
process is totally converted into electricity in their economic analysis. Although
there are studies reporting more than 95% ethanol conversion with very high
hydrogen selectivity in a reformer as also taken to be so in the study of Deluga et
al., there is no such perfect fuel cell. So, a more realistic analysis was carried out
for ethanol steam reforming.
Figures A.3 and A.4 illustrate the results of the economic analysis carried out for
one-hour operation of a reformer-fuel cell system equipped with a small
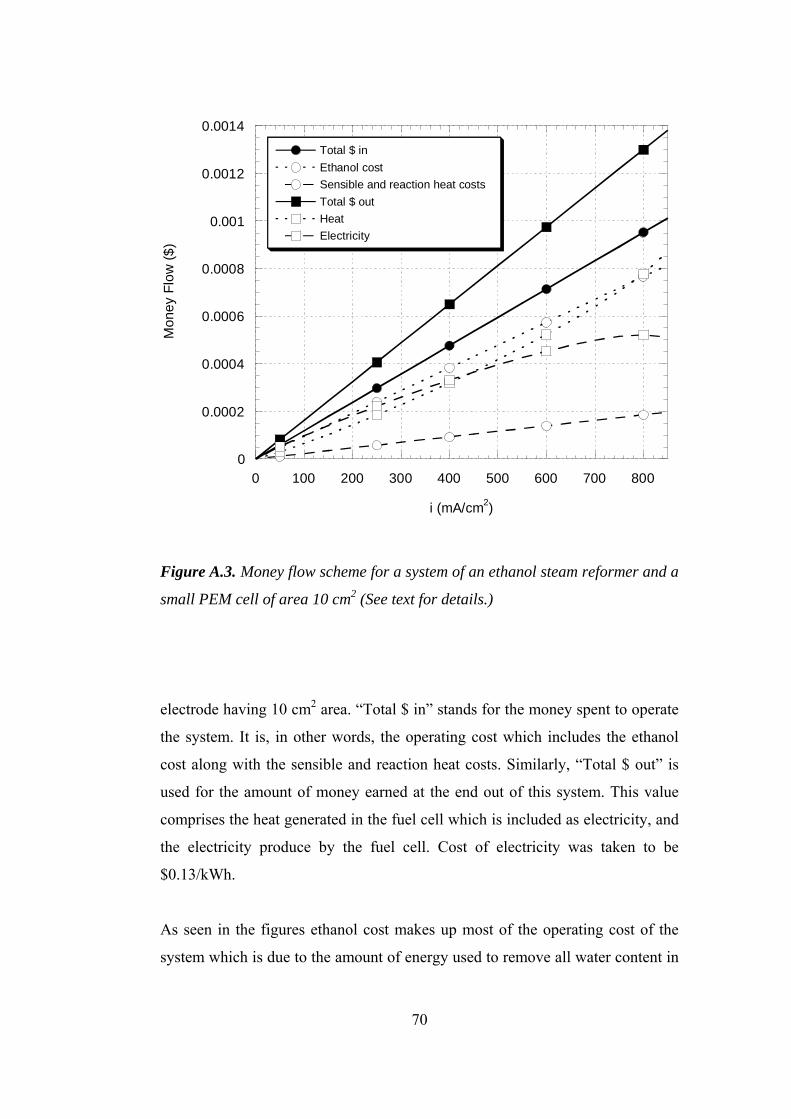
70
0
0.0002
0.0004
0.0006
0.0008
0.001
0.0012
0.0014
0 100 200 300 400 500 600 700 800
Total $ inEthanol costSensible and reaction heat costsTotal $ outHeatElectricity
Mon
ey F
low
($)
i (mA/cm2)
Figure A.3. Money flow scheme for a system of an ethanol steam reformer and a
small PEM cell of area 10 cm2 (See text for details.)
electrode having 10 cm2 area. “Total $ in” stands for the money spent to operate
the system. It is, in other words, the operating cost which includes the ethanol
cost along with the sensible and reaction heat costs. Similarly, “Total $ out” is
used for the amount of money earned at the end out of this system. This value
comprises the heat generated in the fuel cell which is included as electricity, and
the electricity produce by the fuel cell. Cost of electricity was taken to be
$0.13/kWh.
As seen in the figures ethanol cost makes up most of the operating cost of the
system which is due to the amount of energy used to remove all water content in
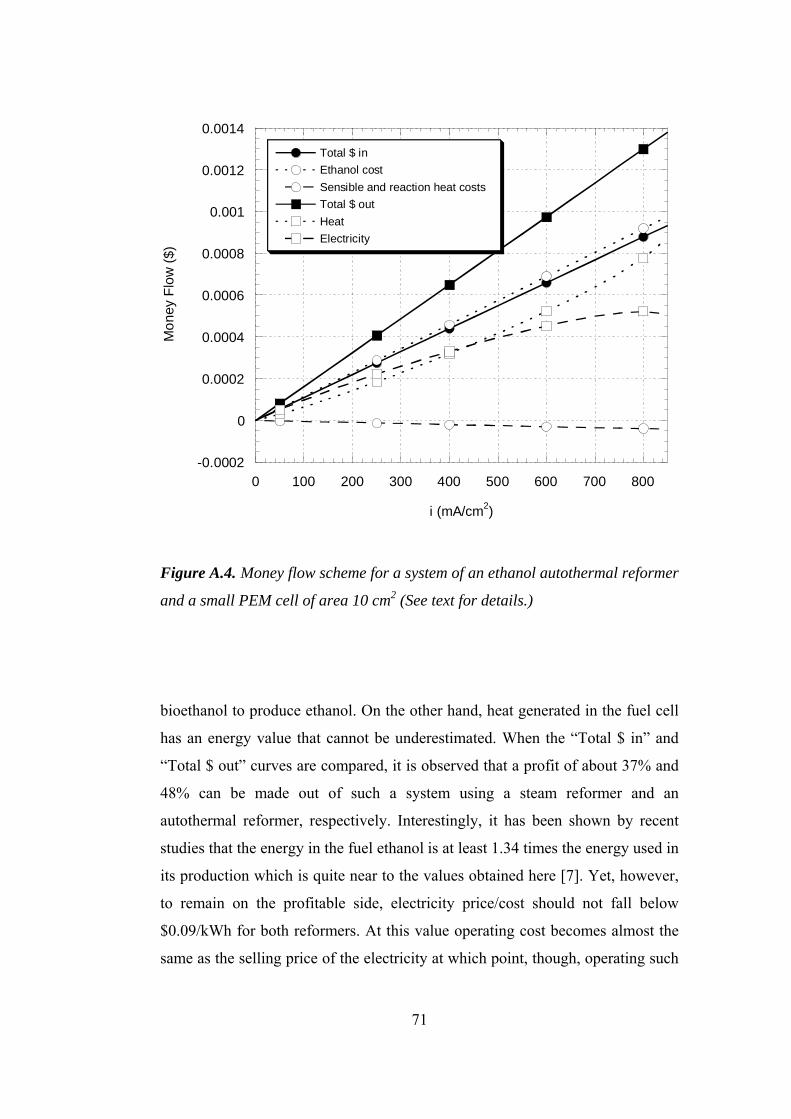
71
-0.0002
0
0.0002
0.0004
0.0006
0.0008
0.001
0.0012
0.0014
0 100 200 300 400 500 600 700 800
Total $ inEthanol costSensible and reaction heat costsTotal $ outHeatElectricity
Mon
ey F
low
($)
i (mA/cm2)
Figure A.4. Money flow scheme for a system of an ethanol autothermal reformer
and a small PEM cell of area 10 cm2 (See text for details.)
bioethanol to produce ethanol. On the other hand, heat generated in the fuel cell
has an energy value that cannot be underestimated. When the “Total $ in” and
“Total $ out” curves are compared, it is observed that a profit of about 37% and
48% can be made out of such a system using a steam reformer and an
autothermal reformer, respectively. Interestingly, it has been shown by recent
studies that the energy in the fuel ethanol is at least 1.34 times the energy used in
its production which is quite near to the values obtained here [7]. Yet, however,
to remain on the profitable side, electricity price/cost should not fall below
$0.09/kWh for both reformers. At this value operating cost becomes almost the
same as the selling price of the electricity at which point, though, operating such
72
a system would be meaningless. Therefore, the fuel cost at the end of this
analysis came out to be $0.09/kWh which is more than twice of the fuel cost
estimated by Deluga et al. [7]. Still, this value will decrease if bioethanol can be
used instead of pure ethanol which can supply even more than the amount of
water necessary to drive the steam reforming reaction.
One more point should be made clear: Figures A.3 and A.4 show the results for a
cell of 10 cm2 electrode. Increase or decrease in this value only shifts the curves
up or down, respectively, unchanging the profit ratio since all calculations are
linear multiplication of data.
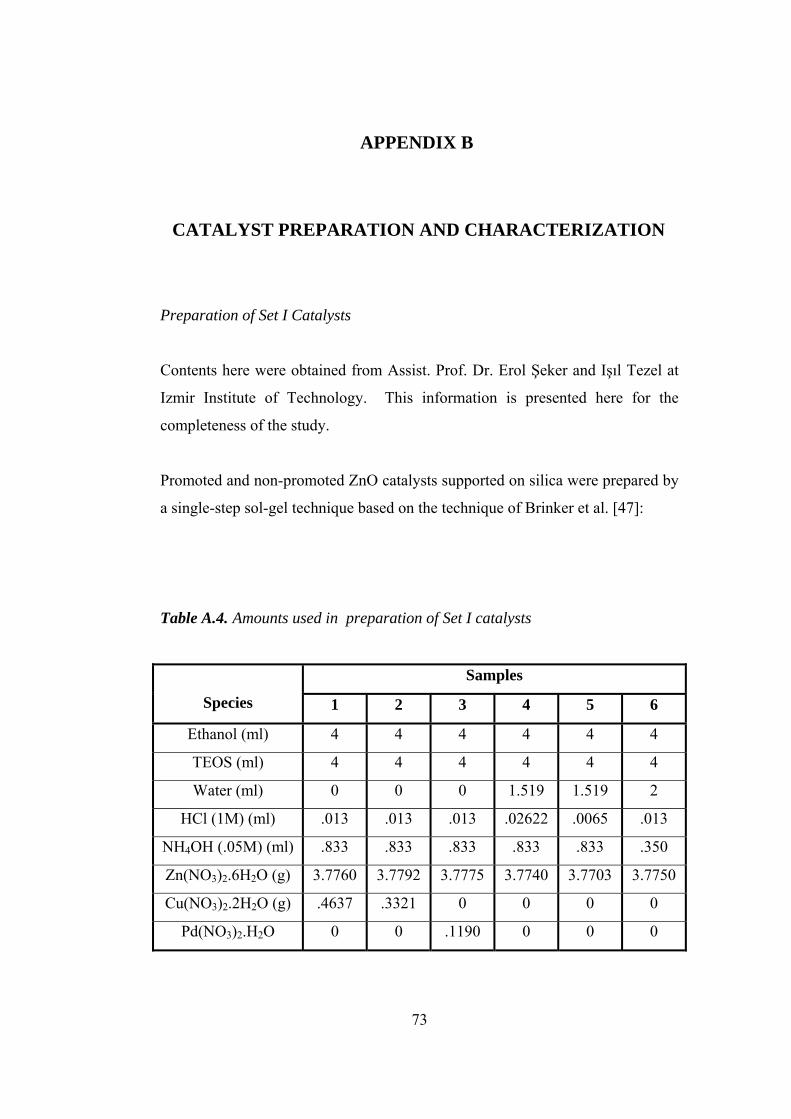
73
APPENDIX B
B. CATALYST PREPARATION AND CHARACTERIZATION
Preparation of Set I Catalysts
Contents here were obtained from Assist. Prof. Dr. Erol Şeker and Işıl Tezel at
Izmir Institute of Technology. This information is presented here for the
completeness of the study.
Promoted and non-promoted ZnO catalysts supported on silica were prepared by
a single-step sol-gel technique based on the technique of Brinker et al. [47]:
Table A.4. Amounts used in preparation of Set I catalysts
Samples
Species 1 2 3 4 5 6
Ethanol (ml) 4 4 4 4 4 4
TEOS (ml) 4 4 4 4 4 4
Water (ml) 0 0 0 1.519 1.519 2
HCl (1M) (ml) .013 .013 .013 .02622 .0065 .013
NH4OH (.05M) (ml) .833 .833 .833 .833 .833 .350
Zn(NO3)2.6H2O (g) 3.7760 3.7792 3.7775 3.7740 3.7703 3.7750
Cu(NO3)2.2H2O (g) .4637 .3321 0 0 0 0
Pd(NO3)2.H2O 0 0 .1190 0 0 0

74
Tetraethylorthosilicate (TEOS) was firstly dissolved in ethanol. Temperature of
the resulting solution was raised to 65°C, and diluted hydrochloric acid was
added into the solution. Stirred continuously by a magnetic stirrer this solution
was kept at 65°C in a vessel equipped with a total reflux for 3 hours. Meanwhile
for the preparation of non-promoted catalysts, Zn(NO3)2.6H2O was dissolved in
NH4OH at 65°C. This basic solution was added into previously prepared acidic
solution and stirred continuously at 65°C until gel formation was observed. In a
similar manner, for the preparation of Cu and Pd promoted catalysts
Zn(NO3)2.6H2O was dissolved in Cu(NO3)2.2H2O and Pd(NO3)2.H2O,
respectively, to prepare the basic solution which was then added into acidic
solution until the formation of gel. Table A.4 summarizes the amounts used
during preparation. Gels were then dried under vacuum for three days.
Preparation of Set II Catalyst
Set II catalysts were prepared at Chemistry Department of METU under the
supervision of Assist. Prof. Dr. Ayşen Yılmaz. Information here was obtained
from Burcu Akça and given here for the completeness of the study.
A triblock co-polymer, P123 (EO20PO70EO20)12, was dissolved in hydrochloric
acid under continuous stirring by magnetic stirrer at room temperature for one
hour. TEOS, as the silica source, and CoCl2.6H2O, as the cobalt source, were
added into the mixture at 40°C. The resulting solution was again stirred
continuously for about 20 hours until gel formation was observed. Then gels
were dried overnight at 90-100°C, and filtered afterwards.
Catalyst Characterization
Calcination procedure of Set I catalysts was determined by means of TGA
technique (DuPont 2000) in Chemical Engineering Department at METU.
12 Triblock poly(ethyleneoxide)-poly(propeleneoxide)-poly(ethyleneoxide) co-polymer

75
Appendix C presents TGA data for samples 1, 3 and 5, and the calcination
procedure performed for each Set I catalyst.
After calcination of Set I catalysts they were ground in mortar to 60 mesh size.
On the other hand, Set II catalyst was calcined directly at 500°C for two hours
and used without grinding.
BET surface areas and average pore diameters of some of SET I catalysts and
Set II catalyst were determined by nitrogen adsorption in Coulter Omnisorp 100
at Izmir Institute of Technology and in Micromeritics ASAP 2000 at METU,
respectively.

76
APPENDIX C
C. CALCINATION PROCEDURES AND TGA DATA OF SET I
CATALYSTS
Table A.5. Calcination procedures of Set I catalysts
Sample Calcination Procedure
1, 2, 4, 5, 6 RT [10°C/min] 150°C (1h) [10°C/min] 350°C (1h)
[3°C/min] 450°C (1h) [10°C/min] 500°C (1h+3h13)
3 RT [10°C/min] 150°C (1h) [3°C/min] 200°C (1h)
[10°C/min] 350°C (1h) [10°C/min] 500°C (1h+3h13)
13 After one hour at 500°C, samples were weighed and kept for another 3 hours at 500°C after which samples were weighed once again. As there were no significant weight differences calcination of samples was completed.

77
Figure A.5. TGA of sample 1 (RT [10°C/min] 700°C. Air flow: 75 cm3/min.)
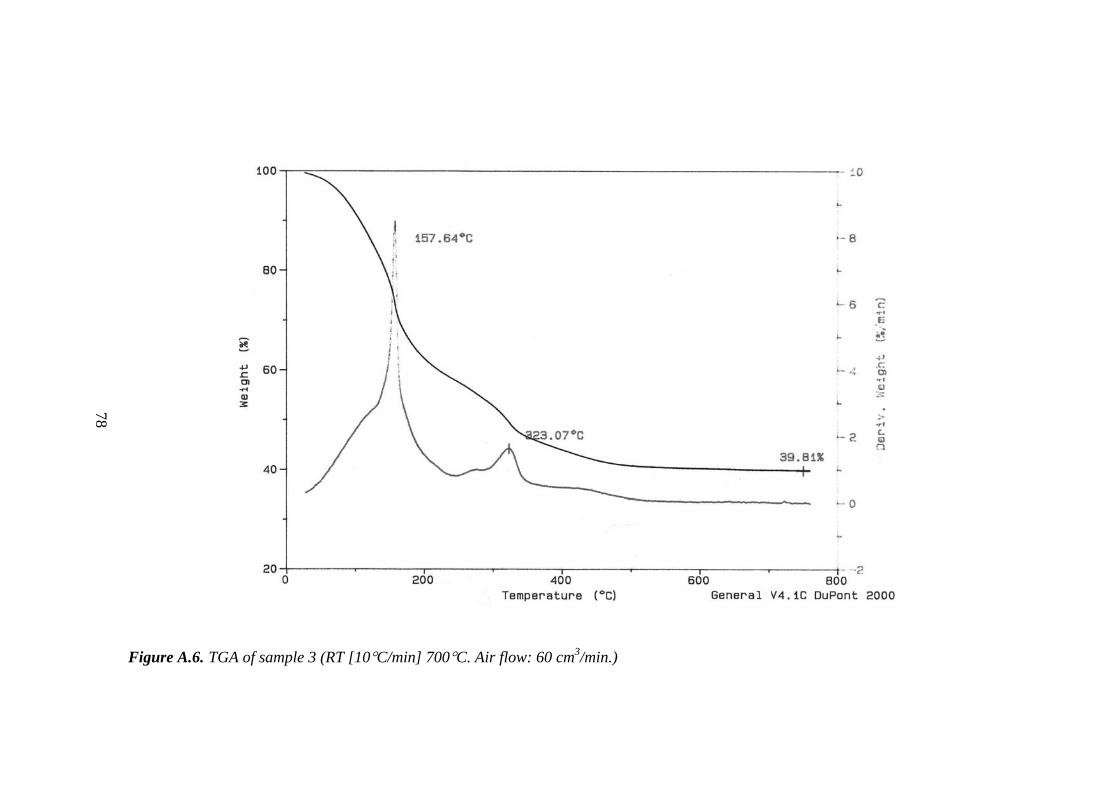
78
Figure A.6. TGA of sample 3 (RT [10°C/min] 700°C. Air flow: 60 cm3/min.)
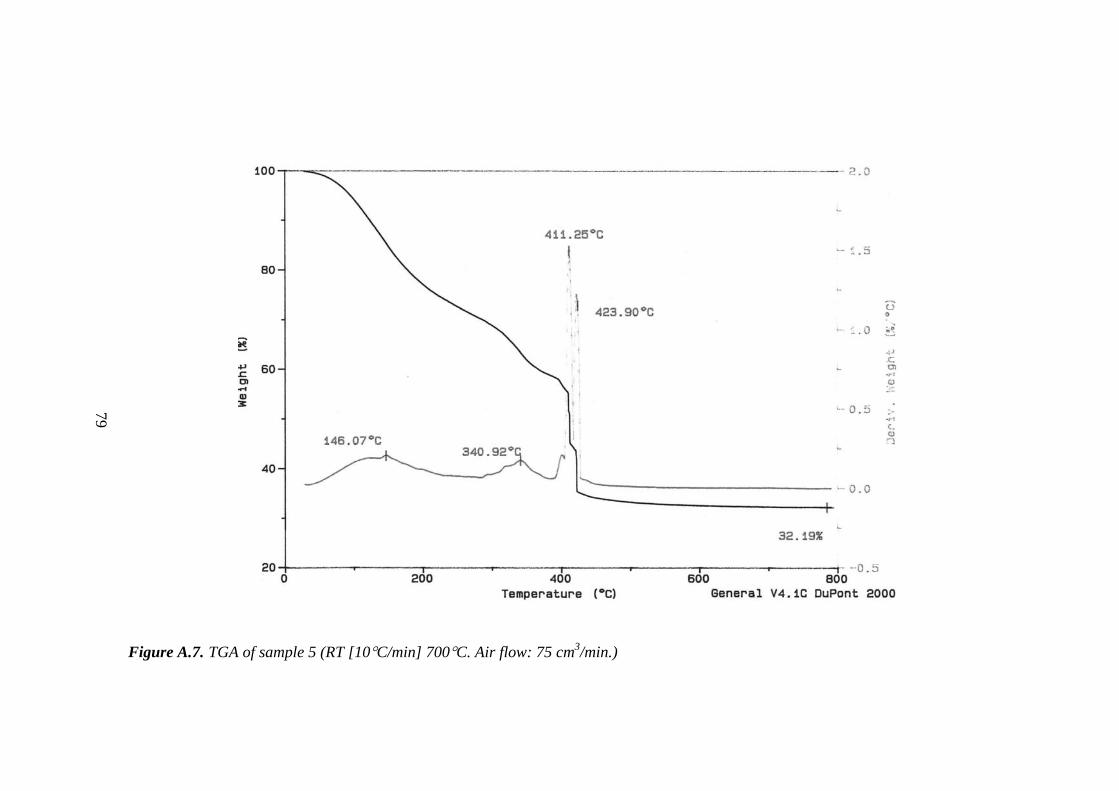
79
Figure A.7. TGA of sample 5 (RT [10°C/min] 700°C. Air flow: 75 cm3/min.)

80
APPENDIX D
D. ELEMENTAL CARBON BALANCES IN STEAM
REFORMING TESTS
Acetaldehyde and ethanol are the only carbon-containing species encountered in
ethanol steam reforming experiments. Amount of ethanol, and thus that of
elemental carbon, fed to the system was obtained from the analysis of the
effluent obtained at the “no reaction” temperature, 200°C. This value was then
compared with the amount of elemental carbon in other reaction temperatures.
Table A.6. Percent errors in elemental carbon balances (Fresh catalysts. S:
Same-day calibration data. A: Averaged calibration data.)
Sample T (°C) 300 350 400 450 500
S +5.9 +9.0 -11.5 -1.7 -3.9 1
A -9.3 +6.8 -25.1 -21.3 -22.8
S +9.3 +15.7 -6.1 -10.1 -18.6 2
A +2.1 +7.1 -24.5 -27.1 -51.0
S +12.4 +6.8 +14.0 +22.3 +32.5 3
A +12.4 +6.0 +11.5 +11.1 +19.5
S -0.2 +0.4 -11.1 -5.1 N/A 4
A +27.9 +17.0 -15.8 -3.2 N/A
S 0 -10.0 -51.1 -89.0 -120.5 6
A -11.9 -15.4 -52.6 -49.2 -45.6

81
Results are summarized in Table A.6. A positive figure can be expressed as a
“carbon consumption or accumulation,” and a negative figure as a “carbon
generation.”
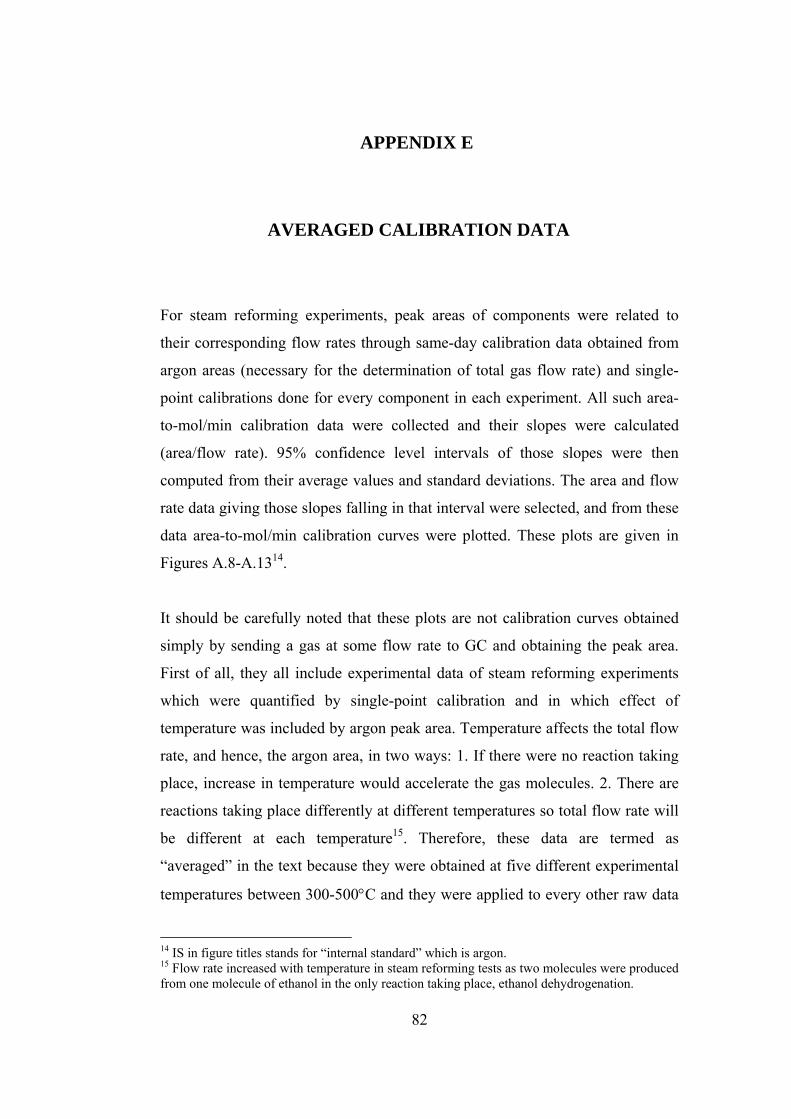
82
APPENDIX E
E. AVERAGED CALIBRATION DATA
For steam reforming experiments, peak areas of components were related to
their corresponding flow rates through same-day calibration data obtained from
argon areas (necessary for the determination of total gas flow rate) and single-
point calibrations done for every component in each experiment. All such area-
to-mol/min calibration data were collected and their slopes were calculated
(area/flow rate). 95% confidence level intervals of those slopes were then
computed from their average values and standard deviations. The area and flow
rate data giving those slopes falling in that interval were selected, and from these
data area-to-mol/min calibration curves were plotted. These plots are given in
Figures A.8-A.1314.
It should be carefully noted that these plots are not calibration curves obtained
simply by sending a gas at some flow rate to GC and obtaining the peak area.
First of all, they all include experimental data of steam reforming experiments
which were quantified by single-point calibration and in which effect of
temperature was included by argon peak area. Temperature affects the total flow
rate, and hence, the argon area, in two ways: 1. If there were no reaction taking
place, increase in temperature would accelerate the gas molecules. 2. There are
reactions taking place differently at different temperatures so total flow rate will
be different at each temperature15. Therefore, these data are termed as
“averaged” in the text because they were obtained at five different experimental
temperatures between 300-500°C and they were applied to every other raw data
14 IS in figure titles stands for “internal standard” which is argon. 15 Flow rate increased with temperature in steam reforming tests as two molecules were produced from one molecule of ethanol in the only reaction taking place, ethanol dehydrogenation.

83
(peak areas) which have no argon data disregarding the temperature. These plots
are, thus, temperature-corrected calibration curves.

84
0
0.0001
0.0002
0.0003
0.0004
0.0005
0 500 1000 1500 2000 2500 3000 3500 4000
y = 1.1252e-07x R2= 0.99575
H2 F
low
rate
(mol
/min
)
Area H2
Figure A.8. Effect of temperature on quantification of hydrogen via an IS14
0
5 10-5
0.0001
0.00015
0.0002
0.00025
0.0003
0 100 200 300 400 500 600 700 800
y = 3.2465e-07x R2= 0.98905
C2H
4O F
low
rate
(mol
/min
)
Area C2H
4O
Figure A.9. Effect of temperature on quantification of acetaldehyde via an IS14
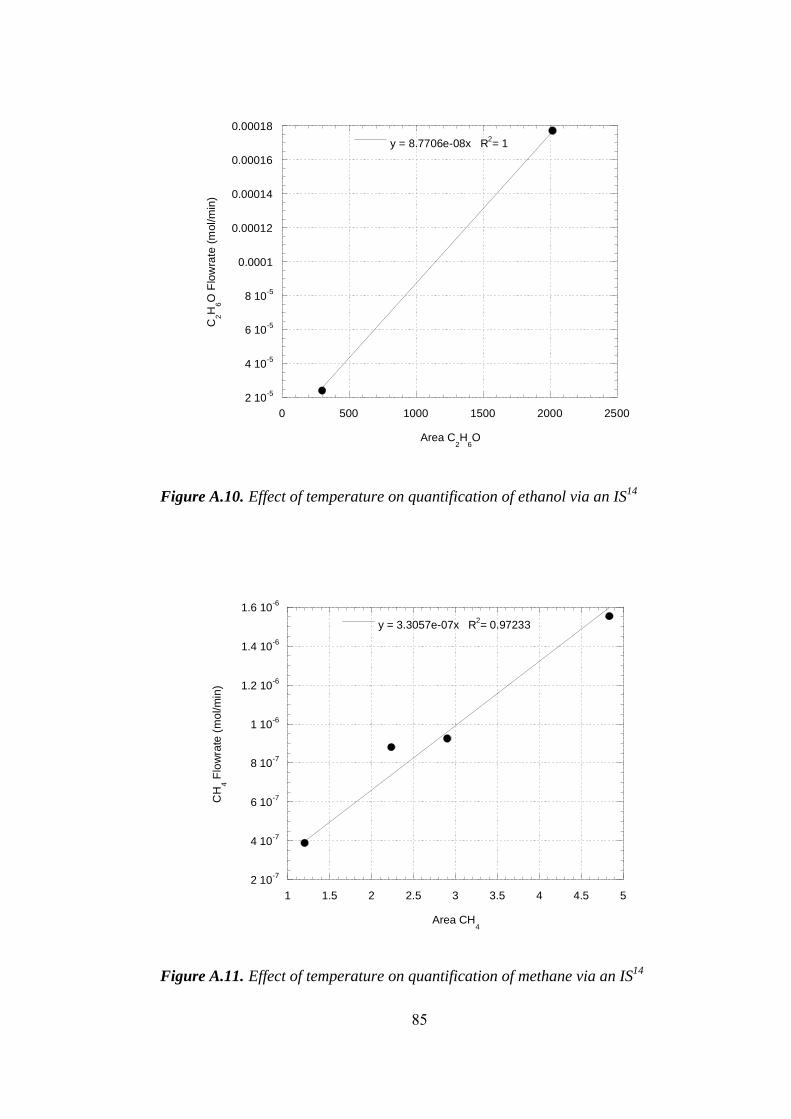
85
2 10-5
4 10-5
6 10-5
8 10-5
0.0001
0.00012
0.00014
0.00016
0.00018
0 500 1000 1500 2000 2500
y = 8.7706e-08x R2= 1
C2H
6O F
low
rate
(mol
/min
)
Area C2H
6O
Figure A.10. Effect of temperature on quantification of ethanol via an IS14
2 10-7
4 10-7
6 10-7
8 10-7
1 10-6
1.2 10-6
1.4 10-6
1.6 10-6
1 1.5 2 2.5 3 3.5 4 4.5 5
y = 3.3057e-07x R2= 0.97233
CH
4 Flo
wra
te (m
ol/m
in)
Area CH4
Figure A.11. Effect of temperature on quantification of methane via an IS14
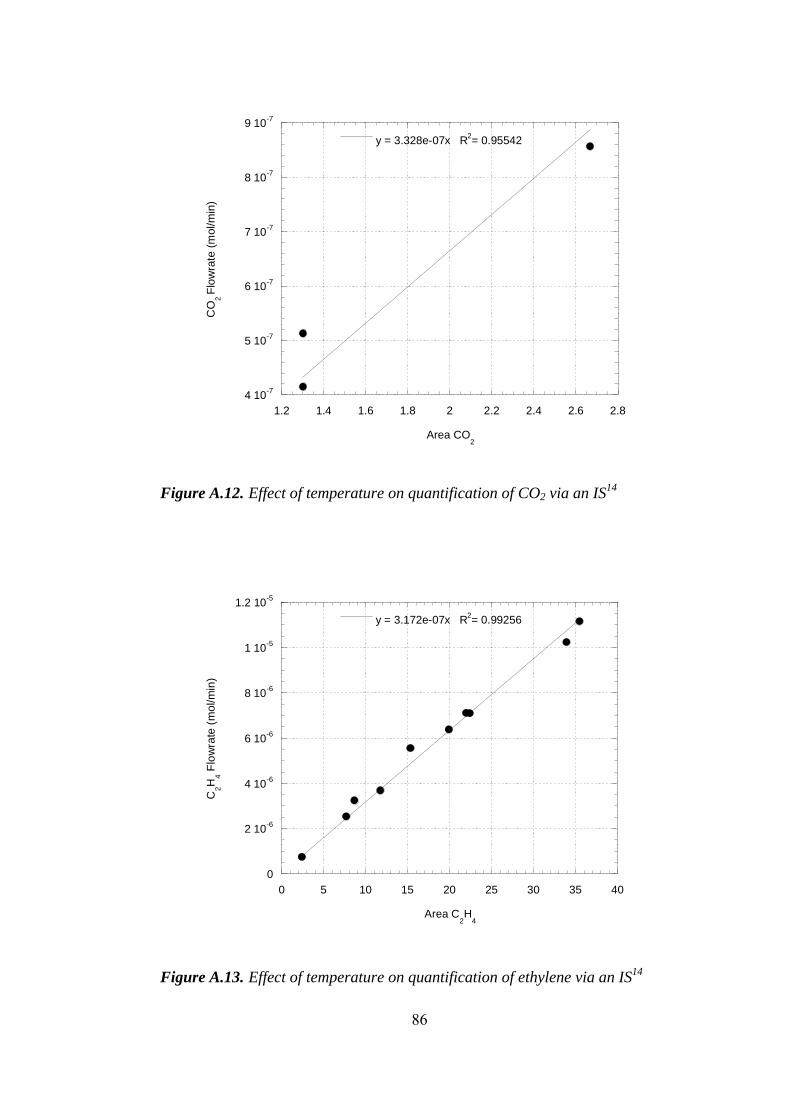
86
4 10-7
5 10-7
6 10-7
7 10-7
8 10-7
9 10-7
1.2 1.4 1.6 1.8 2 2.2 2.4 2.6 2.8
y = 3.328e-07x R2= 0.95542
CO
2 Fl
owra
te (m
ol/m
in)
Area CO2
Figure A.12. Effect of temperature on quantification of CO2 via an IS14
0
2 10-6
4 10-6
6 10-6
8 10-6
1 10-5
1.2 10-5
0 5 10 15 20 25 30 35 40
y = 3.172e-07x R2= 0.99256
C2H
4 Flo
wra
te (m
ol/m
in)
Area C2H
4
Figure A.13. Effect of temperature on quantification of ethylene via an IS14

87
APPENDIX F
F. SAMPLE EXPERIMENTAL PROCEDURE
Table A.7. Sample experimental procedure
Reactor Temperature (oC) GC Analysis Duration (min) Time 8:30 200 (No liquid feed) Steady state in GC 120 10:30 200 (No liquid feed) Ar calibration 40 11:10
200 Ar calibration 15 11:25 200 C2H4O calibration 55 12:20
200 C2H6O-H2O calibration 60 13:20
200 C2H4O calibration 55 14:15 200 Effluent for 200oC 60 15:15 200 Effluent for 200oC 60 16:15 300 Effluent for 200oC 60 17:15 300 H2 calibration 60 18:15 300 Effluent for 300oC 60 19:15 300 Effluent for 300oC 60 20:15 350 Effluent for 300oC 60 21:15
350 C2H6O-H2O calibration 60 22:15
350 Effluent for 350oC 60 23:15 350 Effluent for 350oC 60 0:15 400 Effluent for 350oC 60 1:15 400 Effluent for 400oC 60 2:15 400 Effluent for 400oC 60 3:15 450 Effluent for 400oC 60 4:15 450 Effluent for 450oC 60 5:15 450 Effluent for 450oC 60 6:15 500 Effluent for 450oC 60 7:15 500 Effluent for 500oC 60 8:15 500 Effluent for 500oC 60 9:15
Shutting down Effluent for 500oC 60 10:15 Shutting down Calibration gas 55 11:10 Shutting down Shutting down 60 12:10
Total Time 1660 min (27.7 h)

88
APPENDIX G
G. SETUP PICTURES
Figure A.14. Gas cylinders and mass flow controllers

89
Figure A.15. Feeding unit
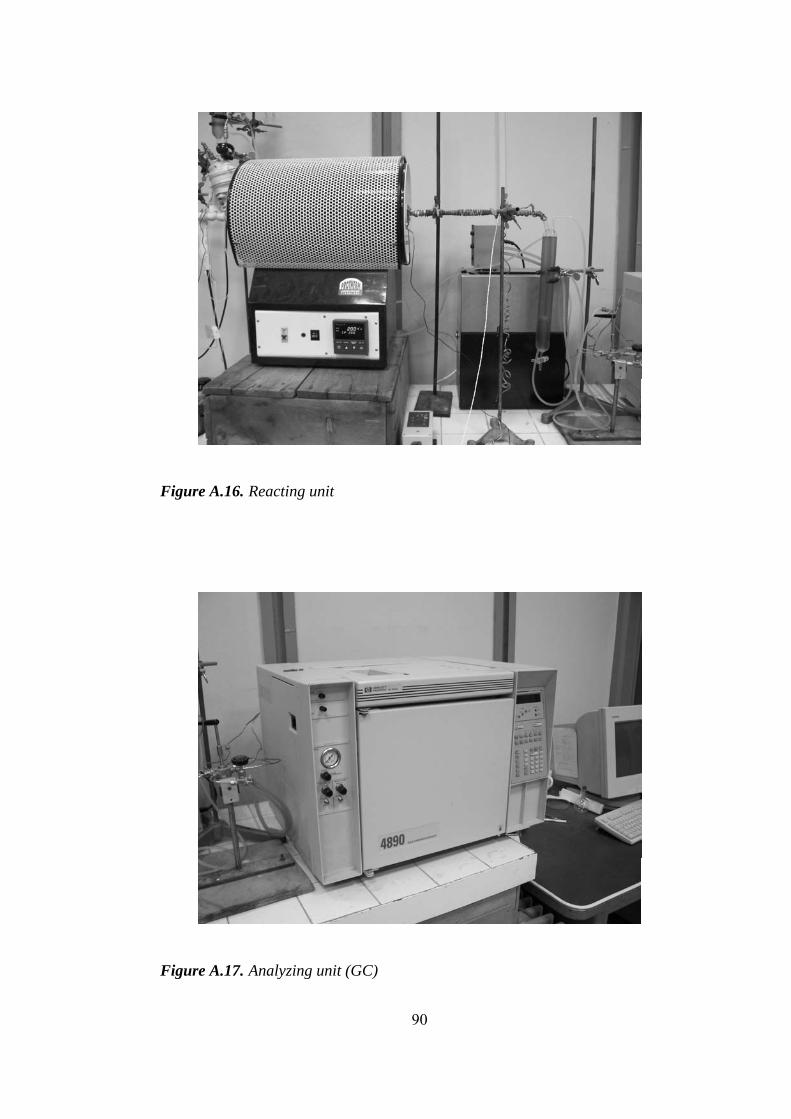
90
Figure A.16. Reacting unit
Figure A.17. Analyzing unit (GC)
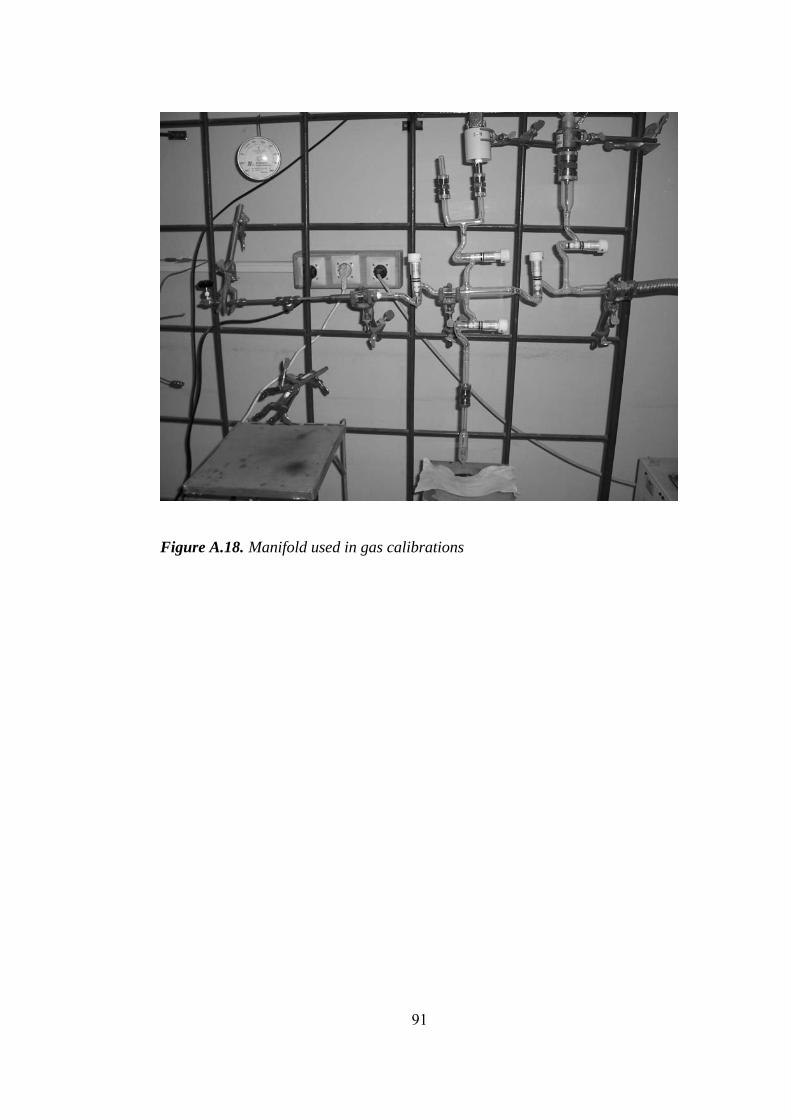
91
Figure A.18. Manifold used in gas calibrations