steady-state simulation of the counter current liquid
TRANSCRIPT

doi.org/10.26434/chemrxiv.9542042.v1
Steady-State Simulation of the Counter Current Liquid-LiquidEx-Traction: Trimetozine Synthesis as a Case StudyZied Hosni, Ian Houson, Brahim Benyahia, Alastair Florence
Submitted date: 17/08/2019 • Posted date: 19/08/2019Licence: CC BY-NC-ND 4.0Citation information: Hosni, Zied; Houson, Ian; Benyahia, Brahim; Florence, Alastair (2019): Steady-StateSimulation of the Counter Current Liquid-Liquid Ex-Traction: Trimetozine Synthesis as a Case Study.ChemRxiv. Preprint.
The countercurrent liquid-liquid extraction is a crucial step in industrial process to purify and extract acompound of inter-ests for its impurities. This step requires generally challenging and time-consumingoptimisation of numerous factors that affect the overall yield of extraction and the energy needed. Thesimulation of this process has been investigated in this pa-per using a Non-Random Two Liquid modelimplemented as a thermodynamic method in Aspen. The outcome of this model enables the evaluation of thepartition coefficients of the different analytes of a mixtures at the different compart-ments of extractionplatform. In addition, this steady-state model allows a more straightforward optimisation of the factors thatdrive the performance of extraction.
File list (2)
download fileview on ChemRxivLiq-liq extraction in Aspen v2.docx (4.59 MiB)
download fileview on ChemRxivLiq-liq extraction in Aspen v2.pdf (838.75 KiB)

Steady-state simulation of the counter current liquid-liquid extraction: Trimetozine synthesis as a case studyZied Hosni,a Ian Houson,a Brahim BenYahia,b Alastair Florencea
a EPSRC Centre for Innovative Manufacturing in Continuous Manufacturing and Crystallisation, Department of Chemical and Process Engineering, University of Strathclyde, James Weir Building, 75 Montrose Street, Glasgow G1 1XJ, United Kingdomb Loughborough University, Loughborough, United Kingdom
KEYWORDS Liquid-liquid extraction, impurities rejection, Aspen simulation, Automation, feedback control
ABSTRACT: The countercurrent liquid-liquid extraction is a crucial step in industrial process to purifyand extract a compound of interests for its impurities. This step requires generally challenging and time-consuming optimisation of numerous factors that affect the overall yield of extraction and the energyneeded. The simulation of this process has been investigated in this paper using a Non-Random TwoLiquid model implemented as a thermodynamic method in Aspen. The outcome of this model enablesthe evaluation of the partition coefficients of the different analytes of a mixtures at the differentcompartments of extraction platform. In addition, this steady-state model allows a more straightforwardoptimisation of the factors that drive the performance of extraction.
1. Introduction
Liquid-liquid extraction is a major task in thechemical engineering field.1 It requires usually atypical ternary system process: solute, diluent, andextractant. Solute, which is dissolved in diluent, isextracted from the diluent and dissolved intoanother solvent, the extractant.2 It separateschemicals from one solution to another based on thedifferent solubility of the solute in two solvents. It isconsidered as a pre-treatment in many analyticalapplications in order to pre-concentration and/orseparation of multiple analytes such as ultra-tracemetal and metalloid species,3 phenoliccompounds,4,5 surfactants,6 pharmaceuticals,7 etc.Despite its importance, LLE is a limiting step toachieve the desired analytical efficiency. It increasesthe selectivity by concentrating the analyte from alarge sample volume and promote its isolation frommatrix-interfering species. This traditional techniquestill suffers from several disadvantages because it islabour-intensive and time-consuming, which leads toa significant need for large amount of chemicals thatcan be harmful, expensive and environmentallyhazardous and can form eventually emulsionsdifficult to separate under certain conditions.8 Thedistribution D of the solute to be extracted amongthe extracting solvent and the diluent can bedescribed as follows:
D=Se
Sd
where Se: solute concentration in extractant (mol/L),Sd: solute concentration in diluent (mol/L).
In the Anticó group, Supported Liquid Membrane(SLM) was used to investigate the transport ofarsenic species. They built a thermodynamic modelthat corresponds to the extraction for both As(V) andAs(III) species by employing data generated fromthe variation of the conditions that affect theextraction such as the organic solvents and pH ofthe aqueous phase. The SLM enabled the separationof As(V) and As(III) species based on their differentkinetic behaviors. Taking into account the goodresults obtained in liquid-liquid experiments, aSupported Liquid Membrane (SLM) system wasdeveloped based on the best separation conditions.9
In order to assess molecules lipophilicity, Alimuddinand co-workers determined the octanol-waterdistribution coefficient log D at pH 7.4 for 26compounds in an automated microfluidic liquid-liquid extraction and compared to the resultsobtained from shake-flask methods. Excellentcorrelation between the values obtained via bothmethods was achieved (R2 = 0.994). The authorsclaimed that this technique based on a PTFEmembrane extraction is amenable to automation,enabling high-throughput determination of largecompound collections.10
Artificial Neural Networks were applied to build amodel that translates the physicochemical

behaviour of a pulsed liquid-liquid extractioncolumn. A pulsed liquid-liquid extraction columnfor the separation of oxalic acid from aqueoussolutions using a mixture of tributylphosphate anddodecane as a selective solvent were employed.The training of the Neural Network was carried outoffline with the utilisation of the cross-validation inorder to achieve a better system representation ofnoisy data. 6000 different patterns of inputs-outputs were employed for the training and 2992other patterns were used as a test dataset. Theinputs of the algorithm represented the past andthe present collected data (pH, conductivity, theconcentration) and the outputs represented thefuture estimated measured pH and conductivityonly.11
Binous implemented in Mathematica® a newapproach to solve liquid-liquid extractionproblems. He considered a ternary mixture ofethanol-water and benzene at 25ºC and heemployed the software to solve the system of thenonlinear algebraic equations that represent theequilibrium relation between the two liquidphases. He studied also the separation of aceticacid from water using isopropyl ether in single-feed counter current extractor and two feedextraction columns. In addition, he used theHunter-Nash method to determine the number ofequilibrium stages needed to achieve a particularraffinate specifications. Finally, the McCabe-Thielediagram was used to compare the previouslyobtained results.12
In the Rajagopalan group, differentthermodynamic models were used for therecovery of 2,3-Butanediol (BDO) fromfermentation by liquid-liquid extraction.Experimental results of the distributioncoefficients (Kd) were compared with the datagenerated from two theoretical models:Conductor-like Screening Model-Real Solvents(COSMO-RS) and Universal Functional groupActivity Coefficient model (UNIFAC-LL). Thesemodels permitted to calculate the activitycoefficients (γ∞) of BDO in various solvents. Theauthors claimed that both models providedqualitative trends of the prediction and theranking of the solvents according to theexperimental references. Among the twoquantum-based thermodynamic models, UNIFAC-LL13 outperformed the COSMO-RS14. It was alsohighlighted that the integration of the updatedparameters from the UNIFAC model in the UNIFAC-LL calculated provided better results, much closerto the experimental values. The (Kd) values werealso calculated in Aspen Plus software.15
Thermodynamic-based modelling was alsoinvestigated to predict the liquid-liquid equilibriaof the (aromatic + aliphatic + ionic liquid) ternarysystems. COSMO-SAC is a variant of the COSMO-RS model and can predict thermodynamicequilibria without any group contributionparameters or experimental data. Only quantumchemical calculations are required, followed by
the application of a thermodynamic model. It canalso handle variation in concentration andtemperature.16
Maurer designed a model of the liquid-liquidequilibrium for the recovery of carboxylic acidsfrom aqueous solutions. The separation is drivenby the affinity to the organic phase of the weakcomplex formed between a carboxylic acid and anamine. The author chose a framework based onthe equilibrium between citric acid tri,n-octylamine and toluene. The model wasconstituted of a chemical (the chemical reactionequilibrium) and a physical (the excess Gibbsenergy) contribution. In addition, the modelallowed the evaluation of the influence of strongelectrolyte (salts) on the phase equilibrium.17
The purification of an organic molecule from itsby-products within the crude of the synthesis is acrucial step before the crystallisation processbecause the presence of impurities has a crucialimpact on the polymorphism of the solid state.The Schotten-Baumann synthesis wasinvestigated heavily as it is providing the amidefunction from an amine and acid chloride.18 Thisreaction has the particularity to use twoimmiscible solvent, usually water as the aqueousphase and a polar non-protic organic solvent asthe organic phase. The utilisation of the aqueousphase assists the elimination of the acid that isproduced in the organic phase. The addition ofbase such as the sodium Carbonate inhibits alsothe protonation of the amine by the generatedacid and prevents the reduction of thenucleophilicity of the nitrogen in the aminefunction. The Trimetozine synthesis is a popularexample of this reaction as illustrated in Graph1.19
Graph 1. Synthesis of Trimetozine in Me-THF inpresence of sodium carbonate.
This commercialised sedative is produced in thepresence of three main impurities: unreactedmorpholine and trimethoxybenzoyl chloride, andthe hydrolysis of the acid chloride giving thetrimethoxybenzoic acid. In the present paper, weapplied different thermodynamic modelsimplemented in Aspen to simulate the partition ofthe Trimetozine and its corresponding impuritiesbetween the organic and the aqueous phase. Weoptimised the parameters of three differentmodels: the Non-Random-Two Liquid model,20 theUNIversal QUAsiChemical (UNIQUAC)21 and theUNIQUAC Functional-group Activity Coefficients(UNIFAC)22 models. These three models wereexploited to drive a global optimisation in order tofind the optimum process conditions to achievethe highest yield of Trimetozine extraction at the

desired purity level using a simulated three-stagescountercurrent liquid-liquid extraction.
2. Experiments
2.1. Materials and reagents
The chemicals employed for the synthesis oftrimetozine were obtained from Sigma Aldrich(UK). Morpholine was provided by Santa Cruz (US)and the trimethoxybenzoic acid was purchasedfrom Alfa Aeser (UK). Sodium carbonate andbutanol were supplied by VWR (UK). HPLC gradeacetonitrile, water, methanol were provided byVWR (UK). D2O and deuterated chloroform werepurchased from Sigma-Aldrich (UK).
2.2. Trimetozine synthesis
To a mixture of morpholine (87.1 mg, 1 mmol)dissolved Me-THF (25 mL) was added a mixture ofsodium carbonate (48.1mg, 2 mmol), and theresultant mixture was stirred at room temperaturefor 15 min and then trimethoxybenzoyl chloride(230.6mg, 1 mmol) was added. The mixture wasstirred for 48 h. On completion, the solid wasfiltered with a sintered glass funnel. The filtratewas evaporated on a rotary evaporator, theresidue was dried on a two-stage pump (highvacuum) and the resultant product wasrecrystallized and dried in a desiccator, while theliquid products were purified by vacuumdistillation.23,24 1H NMR (300 MHz, CDCl3) δ 6.61 (s,2H, Ar-H), 3.86 (s, 6H, 2×OCH3), 3.85 (s, 3H,OCH3), 3.69 (br, s, 8H, 4×CH2).
2.2.1. Nuclear magnetic resonancespectroscopy (NMR)
1H and 13C NMR experiments were performed on aBruker 400 MHz NMR spectrometer (Bruker,Falladon, Switzerland) using deuteratedchloroform (CDCl3) as a solvent andtetramethylsilane (TMS) as an internal standard.The 1H chemical shift values were reported on δscale in parts per million (ppm), relative to TMS(δ= 0.00 ppm) and the 13C chemical shift valueswere reported relative to CDCl3 (δ = 77 ppm).
2.2.2. Fourier transform infraredspectroscopy (FT-IR)
The infrared spectroscopy data of all startingmaterials were recorded on a Tensor II FT-IRspectrophotometer (Bruker Optik GmbH) over therange of 4000–400 cm−1 by pressed pellet method
using diamond. The spectra were acquired by theaccumulation of 256 scans with 4 cm−1 resolutionvia Opus 7.5 software. The absorption values wererepresented in cm−1.
2.2.3. HPLC
The chromatographic experiments were carriedout on Nexera-X2 model ultra-high-performanceliquid chromatography technique (UHPLC) (AgilentTechnology 1290 Infinity, Japan) equipped with aphotodiode array detector (DAD). The AgilentSoftware was utilized for monitoring the process,data acquisition and system control. The testsample solutions were prepared in diluent, amixture of methanol (MeOH)-water (20:80, v/v).The analysed substances were carried out on areverse phase Poroshell 120, EC-C8 (4.6mm x150mm, 2.7um) column (Agilent Technologies, CA,USA) by maintaining column temperature at 30°C. Mobile phase A was pure HPLC water, andmethanol was used as mobile phase B. Theinjection volume and wavelength were fixed at 5μL and 254 nm, respectively, and the data wereacquired by using gradient elution system at aflow rate of 1.0 mL/min. The separation wasaccomplished by employing a linear gradientprogramme as tmin/A:B: t=3min/70:30,t=6min/50:50, t=11min/50:50, andt=12min/70:30 with an equilibration time of 1.0min.
2.2.4. Implementation of NRTL model
Reliable thermodynamic methods are extremelyimportant for process simulation and design ofthis extraction process. This LLE experimentaldata was used to assess the LLE predictivecapability of some liquid-phase models. Themathematical models used in this study wereNRTL. Both models were used as programmed intothe Aspen Plus simulator. The Non-Random-Two-Liquid (NRTL) model (GMRENON) calculated liquidactivity coefficients. It is recommended for highlynon-ideal chemical systems and can be used forVLE and LLE applications. The design of anidentical platform was conducted in Aspen Plusv10 as described in Scheme 2. The binaryinteraction parameters of NRTL models wereobtained using the data regression of the AspenPlus simulator. These binary interactionparameters were determined by minimizing thedeviation between the experimental data andmodel-calculated values. The equation for theNRTL model is:
ln γ i=∑
j
x j τ ji G ji
∑k
n
xk Gki
+∑j
n x jGij
∑k
n
xkG kj (τ ij−∑m
n
xm τmjGmj
∑k
n
xk Gkj )forT lower≤T ≤Tupper
where

Gij=exp(−α ij τ ij )
τ ij=aij+bij
Te ij lnT+ f ijT
α ij=c ij+d ij(T−273.15 K)
τ ii=0
Gii=1
aij, bij, eij, and fij are unsymmetrical. That is,aij may not be equal to aji, etc.
3. Results and discussion
3.1.Partition coefficients
Partition coefficients of the 4 molecules ofinterest were measured experimentally andpredicted computationally via different methodssuch as the HPLC and the slice-selective NMR.Experimental measurements were obtained byconducting shaking flasks experiments wherebiphasic samples were prepared, shaken, then leftto settle. Finally, each phase was extracted andanalysed separately with HPLC or NMR. Tocalculate the extraction coefficient: the formulabelow was applied
K(ext )=C Extract
CResidue
The experimental measurements of partitioncoefficients of the analytes of interest wereimportant to build a robust NRTL method capableof simulating the liquid-liquid extraction in the realworld and also to search reliably for the globalsolution to achieve the optimum extraction. Fromthe HPLC chromatograms, the samples extractedfrom the aqueous and organic phases gave anaverage of 1.20 for the partition coefficient. Withslice-selective NMR, this value was estimated to1.30. It was also possible to assess the partitioncoefficients for the morpholine (0.029) and thetrimethoxybenzoic acid (0.09).
When the NRTL method was adjusted withthe regression binary parameters, it was possibleto get indirectly the partition coefficient byestimating the composition of each stream in theplatform.
EXTRACTFEED
RESID
UE S2 S3 S4 S5 S6 S9S10
WATER
0.00E+00
2.00E-01
4.00E-01
6.00E-01
8.00E-01
1.00E+00
1.20E+00
TRIMETOZ MORPH-01 AC.CHLOR 2-MET-01 WATER
Mo
le f
ow (
kmo
l/h
)
Graph 2. Flow rates of the differentcomponents of the extraction mixtures at allthe streams of the LLE platform.
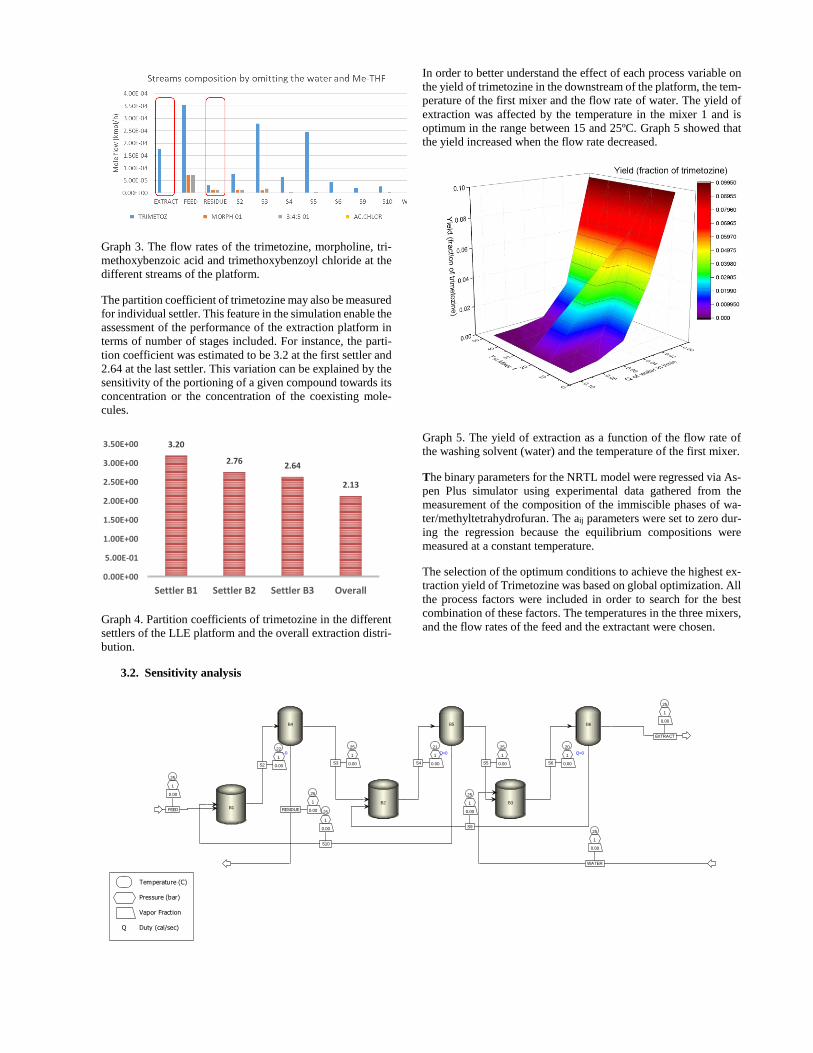
The partitioning of the analytes between theorganic and aqueous phases were illustratedin Graph 2. It is clear that the dominantconcentrations of water and methyltetrahydrofuran were hiding a more relevantinformation about the analyte. For the sake ofclarity, the concentration of the solvents wasomitted in Graph 3.
The simulated platform was initially fed witha same amount of trimethoxybenzoic acidand morpholine (7.10-3 kmol/h). The residuestream was practically pure from these twoimpurities after three stages of extraction. Itis noteworthy that the concentration oftrimetozine decreased in the downstream ofthe platform due to the expected partitioningof this molecules in the differentcompartment of the platform. The extractoutlet was rich in trimetozine with a flow rateof 1.7.10-4 kmol/h).
Graph 3. The flow rates of the trimetozine,morpholine, trimethoxybenzoic acid andtrimethoxybenzoyl chloride at the differentstreams of the platform.
The partition coefficient of trimetozine mayalso be measured for individual settler. Thisfeature in the simulation enable the
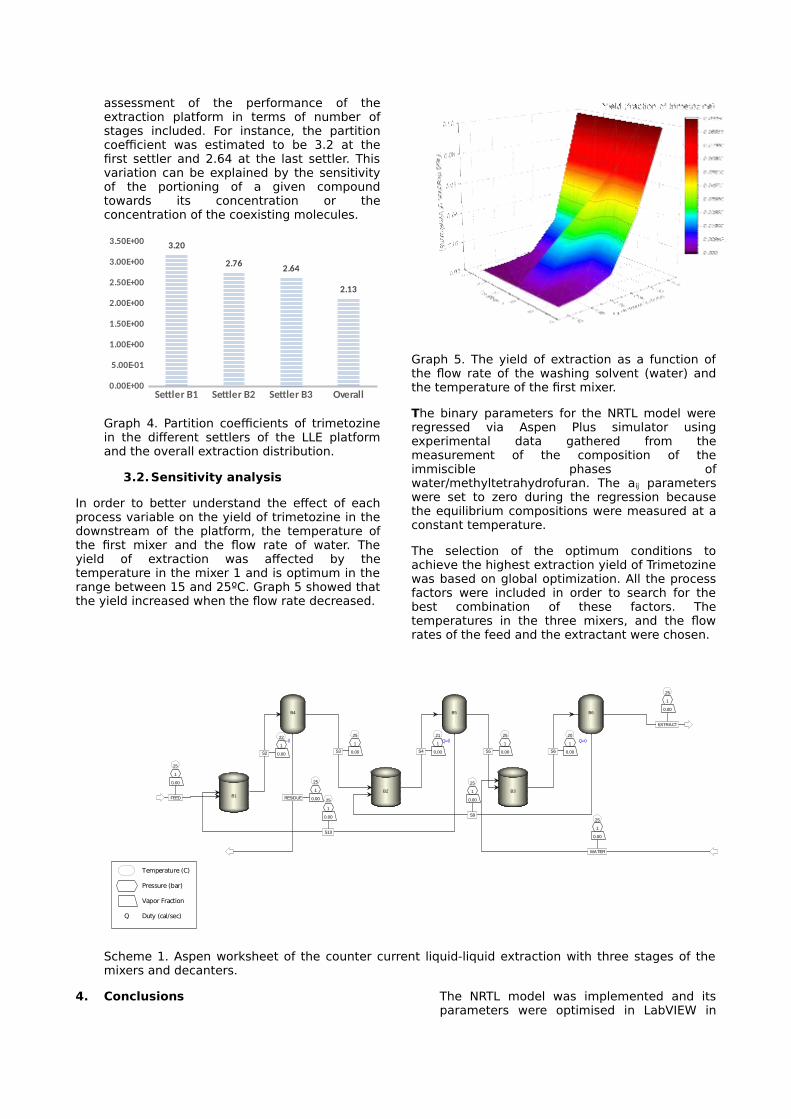
assessment of the performance of theextraction platform in terms of number ofstages included. For instance, the partitioncoefficient was estimated to be 3.2 at thefirst settler and 2.64 at the last settler. Thisvariation can be explained by the sensitivityof the portioning of a given compoundtowards its concentration or theconcentration of the coexisting molecules.
Settler B1 Settler B2 Settler B3 Overall0.00E+00
5.00E-01
1.00E+00
1.50E+00
2.00E+00
2.50E+00
3.00E+00
3.50E+00 3.20
2.762.64
2.13
Graph 4. Partition coefficients of trimetozinein the different settlers of the LLE platformand the overall extraction distribution.
3.2.Sensitivity analysis
In order to better understand the effect of eachprocess variable on the yield of trimetozine in thedownstream of the platform, the temperature ofthe first mixer and the flow rate of water. Theyield of extraction was affected by thetemperature in the mixer 1 and is optimum in therange between 15 and 25ºC. Graph 5 showed thatthe yield increased when the flow rate decreased.
Graph 5. The yield of extraction as a function ofthe flow rate of the washing solvent (water) andthe temperature of the first mixer.
The binary parameters for the NRTL model wereregressed via Aspen Plus simulator usingexperimental data gathered from themeasurement of the composition of theimmiscible phases ofwater/methyltetrahydrofuran. The aij parameterswere set to zero during the regression becausethe equilibrium compositions were measured at aconstant temperature.
The selection of the optimum conditions toachieve the highest extraction yield of Trimetozinewas based on global optimization. All the processfactors were included in order to search for thebest combination of these factors. Thetemperatures in the three mixers, and the flowrates of the feed and the extractant were chosen.
B1B2 B3
B4
Q=-0
B5
Q=0
B6
Q=0
25
1
0.00
FEED
22
1
0.00S2
25
1
0.00S3
21
1
0.00S4
25
1
0.00S5
20
1
0.00S6
25
1
0.00
EXTRACT
25
1
0.00
WATER
25
1
0.00
S9
25
1
0.00
S10
25
1
0.00RESIDUE
Temperature (C)
Pressure (bar)
Vapor Fraction
Q Duty (cal/sec)
Scheme 1. Aspen worksheet of the counter current liquid-liquid extraction with three stages of themixers and decanters.
4. Conclusions The NRTL model was implemented and itsparameters were optimised in LabVIEW in

order to simulate a 3-stages countercurrentliq-liq extraction. The partition coefficients ofthe different analytes were estimated withdifferent techniques experimentally and insilico. HPLC and slice-selective NMR wereexploited to evaluate the partition oftrimetozine between the organic and theaqueous phase. Aspen sensitivity analysiswas also conducted on the optimised NRTLmodel to assess the effect of certain processvariable on the yield of extract.
AUTHOR INFORMATION
Corresponding Author* (Word Style “FA_Corresponding_Author_Footnote”). Give contact information for the author(s) to whomcorrespondence should be addressed.
Present Addresses†If an author’s address is different than the one given in the affiliation line, this information may be included here.
Author ContributionsThe manuscript was written through contributions of all authors. / All authors havegiven approval to the final version of the manuscript. / ‡These authors contributed equally. (match statement to author names with a symbol)
Funding SourcesAny funds used to support the research of themanuscript should be placed here (per journal style).NotesAny additional relevant notes should be placed here.
ACKNOWLEDGMENT (Word Style "TD_Acknowledgments").Generally, the last paragraph of the paper isthe place to acknowledge people(dedications), places, and financing (you maystate grant numbers and sponsors here).Follow the journal’s guidelines on what toinclude in the Acknowledgement section.
ABBREVIATIONSCCR2, CC chemokine receptor 2; CCL2, CCchemokine ligand 2; CCR5, CC chemokinereceptor 5; TLC, thin layer chromatography.
REFERENCES
1. Albright’s chemical engineering handbook. Choice Rev.Online (2013). doi:10.5860/choice.46-4467
2. Zhang, J. & Hu, B. Liquid-Liquid Extraction (LLE). inSeparation and Purification Technologies inBiorefineries 61–78 (John Wiley & Sons, Ltd, 2013).doi:10.1002/9781118493441.ch3
3. Wei, W. et al. Selective recovery of Au(III), Pt(IV), andPd(II) from aqueous solutions by liquid-liquid extraction
using ionic liquid Aliquat-336. J. Mol. Liq. (2016).doi:10.1016/j.molliq.2016.01.016
4. Jiao, T. et al. The new liquid-liquid extraction method forseparation of phenolic compounds from coal tar. Chem.Eng. J. (2015). doi:10.1016/j.cej.2014.12.071
5. Sas, O. G., Domínguez, I., González, B. & Domínguez, Á.Liquid-liquid extraction of phenolic compounds fromwater using ionic liquids: Literature review and newexperimental data using [C2mim]FSI. J. Environ.Manage. (2018). doi:10.1016/j.jenvman.2018.09.042
6. Maruyama, T., Ishizu, N., Eguchi, Y., Hosogi, T. & Goto,M. Liquid-liquid extraction of enzymatically synthesizedfunctional RNA oligonucleotides using reverse micelleswith a DNA-surfactant. Chem. Commun. (2016).doi:10.1039/c6cc06985a
7. Rezaee, M., Yamini, Y. & Faraji, M. Evolution ofdispersive liquid-liquid microextraction method. Journalof Chromatography A (2010).doi:10.1016/j.chroma.2009.11.088
8. Silvestre, C. I. C., Santos, J. L. M., Lima, J. L. F. C. &Zagatto, E. A. G. Liquid–liquid extraction in flowanalysis: A critical review. Anal. Chim. Acta 652, 54–65(2009).
9. Güell, R., Fontàs, C., Salvadó, V. & Anticó, E. Modellingof liquid-liquid extraction and liquid membraneseparation of arsenic species in environmentalmatrices. Sep. Purif. Technol. 72, 319–325 (2010).
10. Alimuddin, M. et al. Determination of log D viaautomated microfluidic liquid-liquid extraction. J. Med.Chem. 51, 5140–5142 (2008).
11. Chouai, a., Cabassud, M., Le Lann, M. V., Gourdon, C. &Casamatta, G. Use of neural networks for liquid–liquidextraction column modelling: an experimental study.Chem. Eng. Process. Process Intensif. 39, 171–180(2000).
12. Binous, H. Liquid-liquid equilibrium and extraction usingMathematica?? Comput. Educ. J. 16, 78–81 (2006).
13. Homrich, P. O. B., Dias, L. G., Mariutti, L. R. B.,Bragagnolo, N. & Ceriani, R. Liquid-liquid equilibria anddensity data for pseudoternary systems of refinedsoybean oil + (hexanal, or heptanal, or butyric acid, orvaleric acid, or caproic acid, or caprylic acid) + dimethylsulfoxide at 298.15 K. J. Chem. Thermodyn. (2019).doi:10.1016/j.jct.2018.10.030
14. Gouveia, A. S. L., Oliveira, F. S., Kurnia, K. A. &Marrucho, I. M. Deep Eutectic Solvents as AzeotropeBreakers: Liquid-Liquid Extraction and COSMO-RSPrediction. ACS Sustain. Chem. Eng. (2016).doi:10.1021/acssuschemeng.6b01542
15. Birajdar, S. D., Padmanabhan, S. & Rajagopalan, S.Rapid solvent screening using thermodynamic modelsfor recovery of 2,3-butanediol from fermentation byliquid-liquid extraction. J. Chem. Eng. Data 59, 2456–2463 (2014).
16. Shah, M. R. & Yadav, G. D. Prediction of liquid−liquidequilibria of (aromatic+aliphatic+ionic liquid) systemsusing the Cosmo-SAC model. J. Chem. Thermodyn. 49,62–69 (2012).
17. Maurer, G. Modeling the liquid–liquid equilibrium for therecovery of carboxylic acids from aqueous solutions.Fluid Phase Equilib. 241, 86–95 (2006).
18. White, T. D. et al. Development of a continuousSchotten-Baumann route to an acyl sulfonamide. Org.Process Res. Dev. 16, 939–957 (2012).
19. Kawahara, K. & Ofuji, T. Simultaneous determination ofglucuronides of trimetozine in human urine by gaschromatography. J. Chromatogr. B Biomed. Sci. Appl.

(1982). doi:10.1016/S0378-4347(00)81858-7
20. Vanderveen, J. R. et al. Non-random two-liquidmodelling of switchable-hydrophilicity solvent systems:N,N-Dimethylcyclohexanamine, water, and toluene.Fluid Phase Equilib. (2016).doi:10.1016/j.fluid.2015.09.032
21. Thomsen, K. Modeling electrolyte solutions with theextended universal quasichemical (UNIQUAC) model.Pure Appl. Chem. (2005).doi:10.1351/pac200577030531
22. Do Carmo, F. R., Evangelista, N. S., De Santiago-Aguiar,R. S., Fernandes, F. A. N. & De Sant’Ana, H. B.
Evaluation of optimal activity coefficient models formodeling and simulation of liquid-liquid equilibrium ofbiodiesel + glycerol + alcohol systems. Fuel (2014).doi:10.1016/j.fuel.2014.01.108
23. Yang, X. D. et al. Silica gel-mediated amide bondformation: An environmentally benign method forliquid-phase synthesis and cytotoxic activities ofamides. J. Comb. Chem. (2010). doi:10.1021/cc900135f
24. Khan, K. M. et al. Leishmanicidal potential of N-substituted morpholine derivatives: Synthesis andstructure-activity relationships. Nat. Prod. Res. 23, 479–484 (2009).

8

download fileview on ChemRxivLiq-liq extraction in Aspen v2.docx (4.59 MiB)

Steady-state simulation of the counter current liquid-liquid extrac-tion: Trimetozine synthesis as a case study
Zied Hosni,a Ian Houson,a Brahim BenYahia,b Alastair Florencea
a EPSRC Centre for Innovative Manufacturing in Continuous Manufacturing and Crystallisation, Department of Chemical
and Process Engineering, University of Strathclyde, James Weir Building, 75 Montrose Street, Glasgow G1 1XJ, United
Kingdom b Loughborough University, Loughborough, United Kingdom
KEYWORDS Liquid-liquid extraction, impurities rejection, Aspen simulation, Automation, feedback control
ABSTRACT: The countercurrent liquid-liquid extraction is a crucial step in industrial process to purify and extract a compound of
interests for its impurities. This step requires generally challenging and time-consuming optimisation of numerous factors that affect
the overall yield of extraction and the energy needed. The simulation of this process has been investigated in this paper using a Non-
Random Two Liquid model implemented as a thermodynamic method in Aspen. The outcome of this model enables the evaluation
of the partition coefficients of the different analytes of a mixtures at the different compartments of extraction platform. In addition,
this steady-state model allows a more straightforward optimisation of the factors that drive the performance of extraction.
1. Introduction
Liquid-liquid extraction is a major task in the chemical engineering
field.1 It requires usually a typical ternary system process: solute,
diluent, and extractant. Solute, which is dissolved in diluent, is ex-
tracted from the diluent and dissolved into another solvent, the ex-
tractant.2 It separates chemicals from one solution to another based
on the different solubility of the solute in two solvents. It is consid-
ered as a pre-treatment in many analytical applications in order to
pre-concentration and/or separation of multiple analytes such as ul-
tra-trace metal and metalloid species,3 phenolic compounds,4,5 sur-
factants,6 pharmaceuticals,7 etc. Despite its importance, LLE is a
limiting step to achieve the desired analytical efficiency. It in-
creases the selectivity by concentrating the analyte from a large
sample volume and promote its isolation from matrix-interfering
species. This traditional technique still suffers from several disad-
vantages because it is labour-intensive and time-consuming, which
leads to a significant need for large amount of chemicals that can
be harmful, expensive and environmentally hazardous and can
form eventually emulsions difficult to separate under certain con-
ditions.8 The distribution D of the solute to be extracted among the
extracting solvent and the diluent can be described as follows:
𝐷 =𝑆𝑒
Sd
where Se: solute concentration in extractant (mol/L), Sd: solute con-
centration in diluent (mol/L).
In the Anticó group, Supported Liquid Membrane (SLM) was
used to investigate the transport of arsenic species. They built a
thermodynamic model that corresponds to the extraction for both
As(V) and As(III) species by employing data generated from the
variation of the conditions that affect the extraction such as the or-
ganic solvents and pH of the aqueous phase. The SLM enabled the
separation of As(V) and As(III) species based on their different ki-
netic behaviors. Taking into account the good results obtained in
liquid-liquid experiments, a Supported Liquid Membrane (SLM)
system was developed based on the best separation conditions.9
In order to assess molecules lipophilicity, Alimuddin and co-work-
ers determined the octanol-water distribution coefficient log D at
pH 7.4 for 26 compounds in an automated microfluidic liquid-liq-
uid extraction and compared to the results obtained from shake-
flask methods. Excellent correlation between the values obtained
via both methods was achieved (R2 = 0.994). The authors claimed
that this technique based on a PTFE membrane extraction is ame-
nable to automation, enabling high-throughput determination of
large compound collections.10
Artificial Neural Networks were applied to build a model that
translates the physicochemical behaviour of a pulsed liquid-liquid
extraction column. A pulsed liquid-liquid extraction column for the
separation of oxalic acid from aqueous solutions using a mixture of
tributylphosphate and dodecane as a selective solvent were em-
ployed. The training of the Neural Network was carried out offline
with the utilisation of the cross-validation in order to achieve a bet-
ter system representation of noisy data. 6000 different patterns of
inputs-outputs were employed for the training and 2992 other pat-
terns were used as a test dataset. The inputs of the algorithm repre-
sented the past and the present collected data (pH, conductivity, the
concentration) and the outputs represented the future estimated
measured pH and conductivity only.11
Binous implemented in Mathematica® a new approach to solve liq-
uid-liquid extraction problems. He considered a ternary mixture of
ethanol-water and benzene at 25ºC and he employed the software
to solve the system of the nonlinear algebraic equations that repre-
sent the equilibrium relation between the two liquid phases. He
studied also the separation of acetic acid from water using isopro-
pyl ether in single-feed counter current extractor and two feed ex-
traction columns. In addition, he used the Hunter-Nash method to
determine the number of equilibrium stages needed to achieve a
particular raffinate specifications. Finally, the McCabe-Thiele dia-
gram was used to compare the previously obtained results.12
In the Rajagopalan group, different thermodynamic models were
used for the recovery of 2,3-Butanediol (BDO) from fermentation
by liquid-liquid extraction. Experimental results of the distribution
coefficients (Kd) were compared with the data generated from two

theoretical models: Conductor-like Screening Model-Real Solvents
(COSMO-RS) and Universal Functional group Activity Coefficient
model (UNIFAC-LL). These models permitted to calculate the ac-
tivity coefficients (γ∞) of BDO in various solvents. The authors
claimed that both models provided qualitative trends of the predic-
tion and the ranking of the solvents according to the experimental
references. Among the two quantum-based thermodynamic mod-
els, UNIFAC-LL13 outperformed the COSMO-RS14. It was also
highlighted that the integration of the updated parameters from the
UNIFAC model in the UNIFAC-LL calculated provided better re-
sults, much closer to the experimental values. The (Kd) values were
also calculated in Aspen Plus software.15
Thermodynamic-based modelling was also investigated to predict
the liquid-liquid equilibria of the (aromatic + aliphatic + ionic liq-
uid) ternary systems. COSMO-SAC is a variant of the COSMO-RS
model and can predict thermodynamic equilibria without any group
contribution parameters or experimental data. Only quantum chem-
ical calculations are required, followed by the application of a ther-
modynamic model. It can also handle variation in concentration
and temperature.16
Maurer designed a model of the liquid-liquid equilibrium for the
recovery of carboxylic acids from aqueous solutions. The separa-
tion is driven by the affinity to the organic phase of the weak com-
plex formed between a carboxylic acid and an amine. The author
chose a framework based on the equilibrium between citric acid
tri,n-octylamine and toluene. The model was constituted of a chem-
ical (the chemical reaction equilibrium) and a physical (the excess
Gibbs energy) contribution. In addition, the model allowed the
evaluation of the influence of strong electrolyte (salts) on the phase
equilibrium.17
The purification of an organic molecule from its by-products within
the crude of the synthesis is a crucial step before the crystallisation
process because the presence of impurities has a crucial impact on
the polymorphism of the solid state. The Schotten-Baumann syn-
thesis was investigated heavily as it is providing the amide function
from an amine and acid chloride.18 This reaction has the particular-
ity to use two immiscible solvent, usually water as the aqueous
phase and a polar non-protic organic solvent as the organic phase.
The utilisation of the aqueous phase assists the elimination of the
acid that is produced in the organic phase. The addition of base such
as the sodium Carbonate inhibits also the protonation of the amine
by the generated acid and prevents the reduction of the nucleo-
philicity of the nitrogen in the amine function. The Trimetozine
synthesis is a popular example of this reaction as illustrated in
Graph 1.19
Graph 1. Synthesis of Trimetozine in Me-THF in presence of so-
dium carbonate.
This commercialised sedative is produced in the presence of three
main impurities: unreacted morpholine and trimethoxybenzoyl
chloride, and the hydrolysis of the acid chloride giving the tri-
methoxybenzoic acid. In the present paper, we applied different
thermodynamic models implemented in Aspen to simulate the par-
tition of the Trimetozine and its corresponding impurities between
the organic and the aqueous phase. We optimised the parameters of
three different models: the Non-Random-Two Liquid model,20 the
UNIversal QUAsiChemical (UNIQUAC)21 and the UNIQUAC
Functional-group Activity Coefficients (UNIFAC)22 models. These
three models were exploited to drive a global optimisation in order
to find the optimum process conditions to achieve the highest yield
of Trimetozine extraction at the desired purity level using a simu-
lated three-stages countercurrent liquid-liquid extraction.
2. Experiments
2.1. Materials and reagents
The chemicals employed for the synthesis of trimetozine were ob-
tained from Sigma Aldrich (UK). Morpholine was provided by
Santa Cruz (US) and the trimethoxybenzoic acid was purchased
from Alfa Aeser (UK). Sodium carbonate and butanol were sup-
plied by VWR (UK). HPLC grade acetonitrile, water, methanol
were provided by VWR (UK). D2O and deuterated chloroform
were purchased from Sigma-Aldrich (UK).
2.2. Trimetozine synthesis
To a mixture of morpholine (87.1 mg, 1 mmol) dissolved Me-THF
(25 mL) was added a mixture of sodium carbonate (48.1mg, 2
mmol), and the resultant mixture was stirred at room temperature
for 15 min and then trimethoxybenzoyl chloride (230.6mg, 1
mmol) was added. The mixture was stirred for 48 h. On completion,
the solid was filtered with a sintered glass funnel. The filtrate was
evaporated on a rotary evaporator, the residue was dried on a two-
stage pump (high vacuum) and the resultant product was recrystal-
lized and dried in a desiccator, while the liquid products were puri-
fied by vacuum distillation.23,24 1H NMR (300 MHz, CDCl3) δ 6.61
(s, 2H, Ar-H), 3.86 (s, 6H, 2×OCH3), 3.85 (s, 3H, OCH3), 3.69 (br,
s, 8H, 4×CH2).
2.2.1. Nuclear magnetic resonance spectroscopy (NMR)
1H and 13C NMR experiments were performed on a Bruker 400
MHz NMR spectrometer (Bruker, Falladon, Switzerland) using
deuterated chloroform (CDCl3) as a solvent and tetramethylsilane
(TMS) as an internal standard. The 1H chemical shift values were
reported on δ scale in parts per million (ppm), relative to TMS (δ=
0.00 ppm) and the 13C chemical shift values were reported relative
to CDCl3 (δ = 77 ppm).
2.2.2. Fourier transform infrared spectroscopy (FT-IR)
The infrared spectroscopy data of all starting materials were rec-
orded on a Tensor II FT-IR spectrophotometer (Bruker Optik
GmbH) over the range of 4000–400 cm−1 by pressed pellet method
using diamond. The spectra were acquired by the accumulation of
256 scans with 4 cm−1 resolution via Opus 7.5 software. The ab-
sorption values were represented in cm−1.
2.2.3. HPLC
The chromatographic experiments were carried out on Nexera-X2
model ultra-high-performance liquid chromatography technique
(UHPLC) (Agilent Technology 1290 Infinity, Japan) equipped
with a photodiode array detector (DAD). The Agilent Software was
utilized for monitoring the process, data acquisition and system
control. The test sample solutions were prepared in diluent, a mix-
ture of methanol (MeOH)-water (20:80, v/v). The analysed sub-
stances were carried out on a reverse phase Poroshell 120, EC-C8
(4.6mm x 150mm, 2.7um) column (Agilent Technologies, CA,
USA) by maintaining column temperature at 30 °C. Mobile phase
A was pure HPLC water, and methanol was used as mobile phase
B. The injection volume and wavelength were fixed at 5 μL and

254 nm, respectively, and the data were acquired by using gradient
elution system at a flow rate of 1.0 mL/min. The separation was
accomplished by employing a linear gradient programme as
tmin/A:B: t=3min/70:30, t=6min/50:50, t=11min/50:50, and
t=12min/70:30 with an equilibration time of 1.0 min.
2.2.4. Implementation of NRTL model
Reliable thermodynamic methods are extremely important for pro-
cess simulation and design of this extraction process. This LLE ex-
perimental data was used to assess the LLE predictive capability of
some liquid-phase models. The mathematical models used in this
study were NRTL. Both models were used as programmed into the
Aspen Plus simulator. The Non-Random-Two-Liquid (NRTL)
model (GMRENON) calculated liquid activity coefficients. It is
recommended for highly non-ideal chemical systems and can be
used for VLE and LLE applications. The design of an identical plat-
form was conducted in Aspen Plus v10 as described in Scheme 2.
The binary interaction parameters of NRTL models were obtained
using the data regression of the Aspen Plus simulator. These binary
interaction parameters were determined by minimizing the devia-
tion between the experimental data and model-calculated values.
The equation for the NRTL model is:
𝒍𝒏𝜸𝒊 = ∑ 𝒙𝒋 𝝉𝒋𝒊 𝑮𝒋𝒊𝒋
∑ 𝒙𝒌 𝑮𝒌𝒊𝒏𝒌
+ ∑𝒙𝒋 𝑮𝒊𝒋
∑ 𝒙𝒌 𝑮𝒌𝒋𝒏𝒌
(𝝉𝒊𝒋 − ∑ 𝒙𝒎 𝝉𝒎𝒋 𝑮𝒎𝒋
𝒏𝒎
∑ 𝒙𝒌 𝑮𝒌𝒋𝒏𝒌
)𝒇𝒐𝒓 𝑻𝒍𝒐𝒘𝒆𝒓 ≤𝑻 ≤𝑻𝒖𝒑𝒑𝒆𝒓
𝒏
𝒋
where
𝑮𝒊𝒋 = 𝒆𝒙𝒑(−𝜶𝒊𝒋 𝝉𝒊𝒋)
𝝉𝒊𝒋 = 𝒂𝒊𝒋 + 𝒃𝒊𝒋
𝑻 𝒆𝒊𝒋 𝒍𝒏𝑻 + 𝒇𝒊𝒋𝑻
𝜶𝒊𝒋 = 𝒄𝒊𝒋 + 𝒅𝒊𝒋(𝑻 − 𝟐𝟕𝟑. 𝟏𝟓𝑲)
𝝉𝒊𝒊 = 𝟎
𝑮𝒊𝒊 = 𝟏
aij, bij, eij, and fij are unsymmetrical. That is, aij may not be
equal to aji, etc.
3. Results and discussion
3.1. Partition coefficients
Partition coefficients of the 4 molecules of interest were
measured experimentally and predicted computationally via differ-
ent methods such as the HPLC and the slice-selective NMR. Ex-
perimental measurements were obtained by conducting shaking
flasks experiments where biphasic samples were prepared, shaken,
then left to settle. Finally, each phase was extracted and analysed
separately with HPLC or NMR. To calculate the extraction coeffi-
cient: the formula below was applied
K(ext) =𝑪𝑬𝒙𝒕𝒓𝒂𝒄𝒕
𝑪𝑹𝒆𝒔𝒊𝒅𝒖𝒆
The experimental measurements of partition coefficients of
the analytes of interest were important to build a robust NRTL
method capable of simulating the liquid-liquid extraction in the real
world and also to search reliably for the global solution to achieve
the optimum extraction. From the HPLC chromatograms, the sam-
ples extracted from the aqueous and organic phases gave an aver-
age of 1.20 for the partition coefficient. With slice-selective NMR,
this value was estimated to 1.30. It was also possible to assess the
partition coefficients for the morpholine (0.029) and the trimethox-
ybenzoic acid (0.09).
When the NRTL method was adjusted with the regression bi-
nary parameters, it was possible to get indirectly the partition coef-
ficient by estimating the composition of each stream in the plat-
form.
Graph 2. Flow rates of the different components of the ex-
traction mixtures at all the streams of the LLE platform.
The partitioning of the analytes between the organic and
aqueous phases were illustrated in Graph 2. It is clear that the
dominant concentrations of water and methyl tetrahydrofuran
were hiding a more relevant information about the analyte.
For the sake of clarity, the concentration of the solvents was
omitted in Graph 3.
The simulated platform was initially fed with a same amount
of trimethoxybenzoic acid and morpholine (7.10-3 kmol/h).
The residue stream was practically pure from these two im-
purities after three stages of extraction. It is noteworthy that
the concentration of trimetozine decreased in the downstream
of the platform due to the expected partitioning of this mole-
cules in the different compartment of the platform. The ex-
tract outlet was rich in trimetozine with a flow rate of 1.7.10-
4 kmol/h).
0.00E+00
2.00E-01
4.00E-01
6.00E-01
8.00E-01
1.00E+00
1.20E+00
EXTR
AC
T
FEED
RES
IDU
E S2 S3 S4 S5 S6 S9
S10
WA
TER
Mo
le f
low
(km
ol/
h)
TRIMETOZ MORPH-01 3:4:5-01 AC.CHLOR 2-MET-01 WATER
Graph 3. The flow rates of the trimetozine, morpholine, tri-
methoxybenzoic acid and trimethoxybenzoyl chloride at the
different streams of the platform.
The partition coefficient of trimetozine may also be measured
for individual settler. This feature in the simulation enable the
assessment of the performance of the extraction platform in
terms of number of stages included. For instance, the parti-
tion coefficient was estimated to be 3.2 at the first settler and
2.64 at the last settler. This variation can be explained by the
sensitivity of the portioning of a given compound towards its
concentration or the concentration of the coexisting mole-
cules.
Graph 4. Partition coefficients of trimetozine in the different
settlers of the LLE platform and the overall extraction distri-
bution.
3.2. Sensitivity analysis
In order to better understand the effect of each process variable on
the yield of trimetozine in the downstream of the platform, the tem-
perature of the first mixer and the flow rate of water. The yield of
extraction was affected by the temperature in the mixer 1 and is
optimum in the range between 15 and 25ºC. Graph 5 showed that
the yield increased when the flow rate decreased.
Graph 5. The yield of extraction as a function of the flow rate of
the washing solvent (water) and the temperature of the first mixer.
The binary parameters for the NRTL model were regressed via As-
pen Plus simulator using experimental data gathered from the
measurement of the composition of the immiscible phases of wa-
ter/methyltetrahydrofuran. The aij parameters were set to zero dur-
ing the regression because the equilibrium compositions were
measured at a constant temperature.
The selection of the optimum conditions to achieve the highest ex-
traction yield of Trimetozine was based on global optimization. All
the process factors were included in order to search for the best
combination of these factors. The temperatures in the three mixers,
and the flow rates of the feed and the extractant were chosen.
3.20
2.762.64
2.13
0.00E+00
5.00E-01
1.00E+00
1.50E+00
2.00E+00
2.50E+00
3.00E+00
3.50E+00
Settler B1 Settler B2 Settler B3 Overall
B1B2 B3
B4
Q=-0
B5
Q=0
B6
Q=0
25
1
0.00
FEED
22
1
0.00S2
25
1
0.00S3
21
1
0.00S4
25
1
0.00S5
20
1
0.00S6
25
1
0.00
EXTRACT
25
1
0.00
WATER
25
1
0.00
S9
25
1
0.00
S10
25
1
0.00RESIDUE
Temperature (C)
Pressure (bar)
Vapor Fraction
Q Duty (cal/sec)

Scheme 1. Aspen worksheet of the counter current liquid-liquid extraction with three stages of the mixers and decanters.
4. Conclusions
The NRTL model was implemented and its parameters were
optimised in LabVIEW in order to simulate a 3-stages coun-
tercurrent liq-liq extraction. The partition coefficients of the
different analytes were estimated with different techniques
experimentally and in silico. HPLC and slice-selective NMR
were exploited to evaluate the partition of trimetozine be-
tween the organic and the aqueous phase. Aspen sensitivity
analysis was also conducted on the optimised NRTL model
to assess the effect of certain process variable on the yield of
extract.
AUTHOR INFORMATION
Corresponding Author
* (Word Style “FA_Corresponding_Author_Footnote”).
Give contact information for the author(s) to whom corre-
spondence should be addressed.
Present Addresses
†If an author’s address is different than the one given in the
affiliation line, this information may be included here.
Author Contributions
The manuscript was written through contributions of all au-
thors. / All authors have given approval to the final version
of the manuscript. / ‡These authors contributed equally.
(match statement to author names with a symbol)
Funding Sources
Any funds used to support the research of the manuscript
should be placed here (per journal style).
Notes Any additional relevant notes should be placed here.
ACKNOWLEDGMENT
(Word Style "TD_Acknowledgments"). Generally, the last
paragraph of the paper is the place to acknowledge people
(dedications), places, and financing (you may state grant
numbers and sponsors here). Follow the journal’s guidelines
on what to include in the Acknowledgement section.
ABBREVIATIONS
CCR2, CC chemokine receptor 2; CCL2, CC chemokine lig-
and 2; CCR5, CC chemokine receptor 5; TLC, thin layer
chromatography.
REFERENCES 1. Albright’s chemical engineering handbook. Choice Rev. Online (2013).
doi:10.5860/choice.46-4467
2. Zhang, J. & Hu, B. Liquid-Liquid Extraction (LLE). in Separation and
Purification Technologies in Biorefineries 61–78 (John Wiley & Sons, Ltd,
2013). doi:10.1002/9781118493441.ch3
3. Wei, W. et al. Selective recovery of Au(III), Pt(IV), and Pd(II) from
aqueous solutions by liquid-liquid extraction using ionic liquid Aliquat-
336. J. Mol. Liq. (2016). doi:10.1016/j.molliq.2016.01.016
4. Jiao, T. et al. The new liquid-liquid extraction method for separation of
phenolic compounds from coal tar. Chem. Eng. J. (2015).
doi:10.1016/j.cej.2014.12.071
5. Sas, O. G., Domínguez, I., González, B. & Domínguez, Á. Liquid-liquid
extraction of phenolic compounds from water using ionic liquids:
Literature review and new experimental data using [C2mim]FSI. J.
Environ. Manage. (2018). doi:10.1016/j.jenvman.2018.09.042
6. Maruyama, T., Ishizu, N., Eguchi, Y., Hosogi, T. & Goto, M. Liquid-liquid
extraction of enzymatically synthesized functional RNA oligonucleotides
using reverse micelles with a DNA-surfactant. Chem. Commun. (2016).
doi:10.1039/c6cc06985a
7. Rezaee, M., Yamini, Y. & Faraji, M. Evolution of dispersive liquid-liquid
microextraction method. Journal of Chromatography A (2010).
doi:10.1016/j.chroma.2009.11.088
8. Silvestre, C. I. C., Santos, J. L. M., Lima, J. L. F. C. & Zagatto, E. A. G.
Liquid–liquid extraction in flow analysis: A critical review. Anal. Chim.
Acta 652, 54–65 (2009).
9. Güell, R., Fontàs, C., Salvadó, V. & Anticó, E. Modelling of liquid-liquid
extraction and liquid membrane separation of arsenic species in
environmental matrices. Sep. Purif. Technol. 72, 319–325 (2010).
10. Alimuddin, M. et al. Determination of log D via automated microfluidic
liquid-liquid extraction. J. Med. Chem. 51, 5140–5142 (2008).
11. Chouai, a., Cabassud, M., Le Lann, M. V., Gourdon, C. & Casamatta, G.
Use of neural networks for liquid–liquid extraction column modelling: an
experimental study. Chem. Eng. Process. Process Intensif. 39, 171–180
(2000).
12. Binous, H. Liquid-liquid equilibrium and extraction using Mathematica??
Comput. Educ. J. 16, 78–81 (2006).
13. Homrich, P. O. B., Dias, L. G., Mariutti, L. R. B., Bragagnolo, N. &
Ceriani, R. Liquid-liquid equilibria and density data for pseudoternary
systems of refined soybean oil + (hexanal, or heptanal, or butyric acid, or
valeric acid, or caproic acid, or caprylic acid) + dimethyl sulfoxide at
298.15 K. J. Chem. Thermodyn. (2019). doi:10.1016/j.jct.2018.10.030
14. Gouveia, A. S. L., Oliveira, F. S., Kurnia, K. A. & Marrucho, I. M. Deep
Eutectic Solvents as Azeotrope Breakers: Liquid-Liquid Extraction and
COSMO-RS Prediction. ACS Sustain. Chem. Eng. (2016).
doi:10.1021/acssuschemeng.6b01542
15. Birajdar, S. D., Padmanabhan, S. & Rajagopalan, S. Rapid solvent
screening using thermodynamic models for recovery of 2,3-butanediol
from fermentation by liquid-liquid extraction. J. Chem. Eng. Data 59,
2456–2463 (2014).
16. Shah, M. R. & Yadav, G. D. Prediction of liquid−liquid equilibria of
(aromatic+aliphatic+ionic liquid) systems using the Cosmo-SAC model. J.
Chem. Thermodyn. 49, 62–69 (2012).
17. Maurer, G. Modeling the liquid–liquid equilibrium for the recovery of
carboxylic acids from aqueous solutions. Fluid Phase Equilib. 241, 86–95
(2006).
18. White, T. D. et al. Development of a continuous Schotten-Baumann route
to an acyl sulfonamide. Org. Process Res. Dev. 16, 939–957 (2012).
19. Kawahara, K. & Ofuji, T. Simultaneous determination of glucuronides of
trimetozine in human urine by gas chromatography. J. Chromatogr. B
Biomed. Sci. Appl. (1982). doi:10.1016/S0378-4347(00)81858-7
20. Vanderveen, J. R. et al. Non-random two-liquid modelling of switchable-
hydrophilicity solvent systems: N,N-Dimethylcyclohexanamine, water,
and toluene. Fluid Phase Equilib. (2016). doi:10.1016/j.fluid.2015.09.032
21. Thomsen, K. Modeling electrolyte solutions with the extended universal
quasichemical (UNIQUAC) model. Pure Appl. Chem. (2005).
doi:10.1351/pac200577030531
22. Do Carmo, F. R., Evangelista, N. S., De Santiago-Aguiar, R. S., Fernandes,
F. A. N. & De Sant’Ana, H. B. Evaluation of optimal activity coefficient
models for modeling and simulation of liquid-liquid equilibrium of
biodiesel + glycerol + alcohol systems. Fuel (2014).
doi:10.1016/j.fuel.2014.01.108
23. Yang, X. D. et al. Silica gel-mediated amide bond formation: An
environmentally benign method for liquid-phase synthesis and cytotoxic
activities of amides. J. Comb. Chem. (2010). doi:10.1021/cc900135f
24. Khan, K. M. et al. Leishmanicidal potential of N-substituted morpholine
derivatives: Synthesis and structure-activity relationships. Nat. Prod. Res.
23, 479–484 (2009).

download fileview on ChemRxivLiq-liq extraction in Aspen v2.pdf (838.75 KiB)