stay connected and keep motivated: modeling activity level
TRANSCRIPT

Stay Connected and Keep Motivated:Modeling Activity Level of Exercisein an Online Fitness Community
Li Zeng1(B), Zack W. Almquist2, and Emma S. Spiro3
1 Information School, University of Washington, Seattle, [email protected]
2 Departments of Sociology, School of Statistics, and Minnesota Population Center,University of Minnesota, Minneapolis, USA
[email protected] Information School, Department of Sociology,
Center for Statistics and the Social Sciences,University of Washington, Seattle, USA
Abstract. Recent years have witnessed a growing popularity of activitytracking applications. Previously work has focused on three major typesof social interaction features in such applications: cooperation, competi-tion and community. Such features motivate users to be more active inexercise and stay within the track of positive behavior change. Onlinefitness communities such as Strava encourage users to connect to peersand provide a rich set of social interaction features. Utilizing a large-scalebehavioral trace data set, this work aims to analyze the dynamics ofonline fitness behaviors and network subscription as well as the relation-ship between them. Our results indicate that activeness of fitness behav-iors not only has seasonal variations, but also vary by user group and howwell users are connected in an online fitness community. These resultsprovide important implications for studies on network-based health anddesign of application features for health promotion.
Keywords: Fitness behaviors · Social interactionEvent history analysis · Online fitness communities · Social mediaBehavioral traces
1 Introduction
Peer influence and social interaction have been found to have positive health-related effects, such as helping people lose weight and increasing physical activi-ties [1–5]. Recently, increased attention has been paid to promoting health habitsthrough online social interaction in online fitness communities (e.g., running orcycling online groups) [6,7]. Studies show that social interaction features suchas cooperation and competition provide participants with a group of peers andc© Springer International Publishing AG, part of Springer Nature 2018G. Meiselwitz (Ed.): SCSM 2018, LNCS 10914, pp. 137–147, 2018.https://doi.org/10.1007/978-3-319-91485-5_10
138 L. Zeng et al.
help motivate them to reach their fitness or health goals [2,8]. In this work, westudy the relationship between fitness behaviors and online social behavior viaa subscription service where users can post and follow peers’ activity feeds.
Traditionally, studies on physical activity and social interaction have reliedon information that is self-reported (e.g., diary studies) or measured via (expen-sive) wearable sensors, which have been limited in terms of scale, granularity ofactivity and duration of observation period [9,10]. Recent developments in smartphone GPS tracking and accessibility has provided for an increasing large adop-tion of mobile devices which track everyday physical activities. These resultantbehavioral trace data allow for precise measurement of individual’s activities andonline social action in scale and cost that traditional survey-based methods forcollecting data on physical activities cannot match, and provide a good alterna-tive to classic sensor studies [11,12]. Our work leverages these new data sources(e.g., behavioral trace data) to explore the relationship between fitness behav-iors and online social interaction over time. We employ this novel data set alongwith event history methods to understand the relationship between online socialinteraction and activity levels within one of these app-based activity communi-ties. Specifically, we focus on the large app-based community known as Stravawhere users have covered over 12 billion miles worldwide [13]. In this work wefocus on two comparable major metropolitan areas in the US.
This work analyzes the dynamics of online fitness behaviors and networksubscription as well as the relationship between them. We ask the followingresearch questions: (1) how do users’ activity levels of exercise change over time?(2) how do exercise activeness and network subscription vary among users? (3)how subscription magnitude is associated with activity occurrence? We find clearseasonal patterns of users’ fitness behaviors and discuss the implications forfitness application designs and health prevention. We also show that paid-planusers exercise more actively and attract more followers than free-plan users.Last, our analysis shows a positive relationship between social subscription andphysical activities, supporting the claim –“stay connected, keep motivated”.
The remainder of this paper is organized as follows. We start by reviewingexisting studies on online fitness communities and roles of social interaction inphysical activities in online fitness communities. Next, we describe the behavioraltrace data collected from Strava for this work. We then describe the method-ology for this work, describing our analysis on activity levels and online socialinteraction via network subscription, as well as the methodology used to modelphysical activities given user characteristics and network subscription. We finallydiscuss and summarize our findings.
2 Related Work
With advances in pervasive technologies, activity tracking applications andonline fitness communities such as Strava, RunKeeper, MapMyRun, etc. areattracting more and more users around the world. Online fitness communi-ties usually have features of both activity logging and social networking [9].

Modeling Activity Level of Exercise in an Online Fitness Community 139
Online fitness communities log activity-related data and help users analyze theirperformance. Online fitness communities also serve as an activity-based networkthat connect users and provide users with a series of social interactions fea-tures meant to encourage behavioral change and healthy life-style promotion.For example, on Strava, users can follow both recreational and professional ath-letes, view their activities and interact with them by making comments, givingkudos, etc.
Behavioral trace data archived by online fitness communities record largeamount of data that is generated by users throughout their physical activity (e.g.,running/cycling) and through their social interaction online. One can compare thisdata to the more often collected self-report surveys which acquire individual’s per-ception of their workout routine and social engagement, rather than the behavioraltrace data which records their exact physical activity, timing, distance, etc. andprecise social interaction (e.g., running in groups or liking someones run activity).This data source also shows advantages in terms of scale, granularity and observa-tion duration against data collected via expensive sensors [10]. Thus, it providesresearchers with new opportunities for understanding the relationship between fit-ness behavior and social interaction.
Online fitness communities are increasingly attracting researchers from avariety of disciplines. Some studies revolve around incentives and interventions.For example, studying potential of health devices and applications for health-related behavioral change [2,14,15]. Another major body of work focuses on thetechnical potential of wearable sensors and human-computer interaction aspectsof these technologies. For example, examining specific features in designs of fit-ness applications [16–18]. However, there are few studies on how online socialnetwork structure influence activity engagement, leaving a gap in our currentunderstanding of the social dynamics in these settings.
Recent work have studied the relationship between social interaction andphysical activity using fitness applications. Social interaction in online fitnesscommunities may include cooperation and competition and sharing physicalactivities. Studies by [2,19–21] suggest that social interaction is essential tomotivate users to perform physical activities. As mentioned above, online fit-ness communities enable users to connect and interact with a group of peersonline. In the case of Strava, users can follow other athletes, view their profileand activities, and receive activity feed once their peer post a completed activ-ity. They may also compare workout and network-based stats with each other,“like” others’ posted activities and make comments under posts. The work by[9] examines how Strava users’ social motives predict perceived usefulness ofthe platform based on survey responses collected from 394 Strava users. Threeaspects of social motives are considered: staying informed on friends’ activities,viewing progress made by friends, and receiving support from others via kudosand comments. The results show that social motives influence habitual Stravause directly, and when compared to novice users social motives are more impor-tant for experienced users.

140 L. Zeng et al.
3 Data
This work utilizes behavioral trace data collected from the activity-based net-work, Strava. Strava sits at the intersection of social media and activity trackingapplications and is known colloquially as the “Facebook” of activity-based apps;users have the ability to not only track and log their activities, but also connectto and interact with a group of peers online. The platform continues to grow inpopularity among cyclists and runners in recent years around the world.
In this work, we study 2,605,147 cycling and running activities from 11,245anonymized users from an activity-based tracking platform known as Strava.Our data includes but is not limit to the following three main components: (1)user profile information, including gender, date of birth, location, user accountstatus (e.g. free or paid plan), sign-up date, etc.; (2) logs of posted activityfor users in the sample over time, including activity timestamp, location, type,performance stats, etc.; and (3) social subscription: who followed whom and thecorresponding timestamp.
We focus on two major metro areas within the continental US, which havea large active set of Strava users. We have chosen to focus on San FranciscoCity/County, CA which is where Strava started and continues to be head-quartered, and Boston/Suffolk County, MA. Both cities represent similar sizemetropolitan areas within the US. Boston metro is ranked 10th with about 4.8million residents, and San Francisco metro is ranked 11th with about 4.7 mil-lion residents. Thus, these two areas represent comparable cities on the coastswithin the US context, but with wildly different weather patterns. For example,Boston has an average high of 36◦ Fahrenheit in January, and San Franciscohas an average high of 58◦ Fahrenheit in same month. Our analysis examines
Table 1. Data summary
San Francisco County Suffolk County
# of Activities 2312669 292478
# of Users 9831 1414
Gender Proportion
- Male 0.777 0.760
- Female 0.223 0.240
User Type Proportion
- Cyclist 0.695 0.623
- Runner 0.305 0.377
Age Proportion
- 0–17 0.005 0.008
- 18–35 0.524 0.590
- 36–49 0.380 0.303
- 50+ 0.091 0.099
Modeling Activity Level of Exercise in an Online Fitness Community 141
and compares fitness behaviors and social subscription behaviors of users fromthese two counties. The key difference in these two areas is their weather pat-terns, and so we expect differences in community activities to stem from theseseasonal differences.
Table 1 presents the summary of our data in terms of user group and activ-ities. Male users are proportionally greater than female users in San Franciscoand Suffolk County, and gender proportion is relatively similar in both locations.There exist more cyclists than runners in both groups – this is to be expected asStrava was originally developed by a group of cyclists. San Francisco users have69.5% of self-reported cyclists and 30.5% of runners, while the proportion ofcyclists and runners of Suffolk County users are 62.3% and 37.7%, respectively.Lastly, we observe that the major age group of users is between 18 and 35 forboth locations, and the second majority age group is between 36–49.
4 Methods
First, we examine seasonal patterns of workouts done by users in our sample.Specifically, we look at total numbers of posted activities across all users rangingfrom September, 2009 to April, 2017. Theoretically, seasonality of physical activ-ities may vary by activity type and location. Hence, this analysis focuses on thetwo major activity types - cycling and running, which accounts for 53% and 40%of total activities, respectively. Moreover, we do so for users from San FranciscoCounty and Suffolk County separately in order to have a simple control settingfor weather in the analysis.
As we are interested in the relationship between fitness behaviors and onlinesocial interaction over time, we examine users’ activity level and network sub-scription by different user groups. We begin with a simple metric activity levelmeasuring to what extent a user engages Strava to track/log exercise actively:
Activity level =#of activities by a user
#of days a user in Strava service
We focus on how users’ activity level and number of their followers variesby gender, age group, training plan enrolled (i.e. free or paid plan) and athletetype (i.e. cyclist or runner). For gender differences in physical activity, priorwork argues that physical inactivity is more prevalent among female. Indeed,male users are proportionally greater than female users in Strava. However, weare also interested in exploring gender differences in activeness in the onlinefitness community. Next, we observe a disproportionate distribution of users agein our sample data (i.e., the majority of Strava users aged between 18 and 49).Therefore, we want to examine how actively each user age group engages theseactivities. Further, we are interested in finding whether users from paid planworkout more than free-plan users. We are also interested understanding howworkout activity differ by athlete type.
Last, we model user workout frequency over time with a particular interest inexamining whether a user who is followed by more peers tend to exercise more.

142 L. Zeng et al.
In this work, we perform an event history analysis in order to characterize theoccurrence of the repeated events - physical activities given a time-dependentvariable - follower count along with time-independent variables - gender, age,training plan enrolled and athlete type (i.e. cyclist or runner). To control forseasonality of location we include a dummy variable to indicate whether a usercomes from San Francisco County (indicator = 0) or Suffolk County (indicator =1). We use the popular cox proportional hazards model where the unique effectof a unit increase in a covariate is multiplicative with respect to the hazard rate.In this model, the dependent variable is h(t) - the hazard of an event at time t.Roughly speaking, h(t) can be interpreted as the instantaneous probability thatan event will occur at time t. The hazard function follows the form:
λ(t|Xi) = λ0(t)exp(β1Xi1 + · · · + βpXip + βp+1Zi(t))
where Xip, ...,Xip are the 1st to the pth time-independent covariate and Zi(t) isthe time-dependent covariate at time t for the observation i. Users who churnedthe Strava service and hence deleted the account are censored in this analysis.
5 Results
5.1 Seasonality of Physical Activity
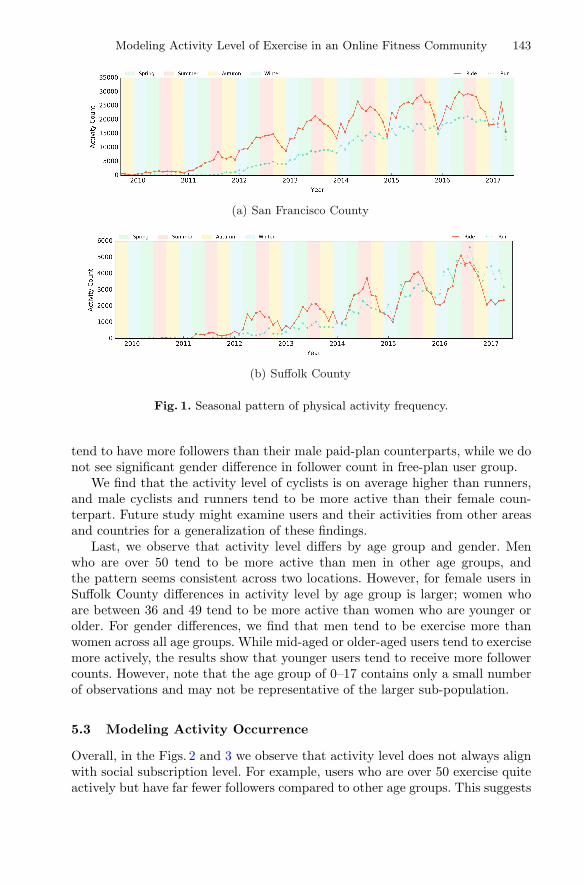
Figure 1 shows a time series of activity frequency in Strava ranging from 2009to 2017. For both runs and rides, we first observe a clear seasonal pattern forboth locations; number of activities done per year usually peak at late springor summer and then drop to the local lowest point at winter. When comparingbetween the two locations, we observe Suffolk users’ activity behaviors are moregreatly influenced by the time of year. Unsurprisingly, this indicates that weatheris indeed a great factor for exercise activeness especially for outdoor exercise.Further, it is interesting to notice that cycling is more subject to seasonal changewith larger difference in frequency during different seasons when compared torunning. Moreover, it is important to note an overall increasing trend for bothrunning and cycling, which indicates an increasing popularity of exercise withinthe Strava app over time. This analysis suggests that it is important to considertemporal dimension in the analysis and modeling of user fitness behaviors.
5.2 Exercise Activeness and Network Subscription
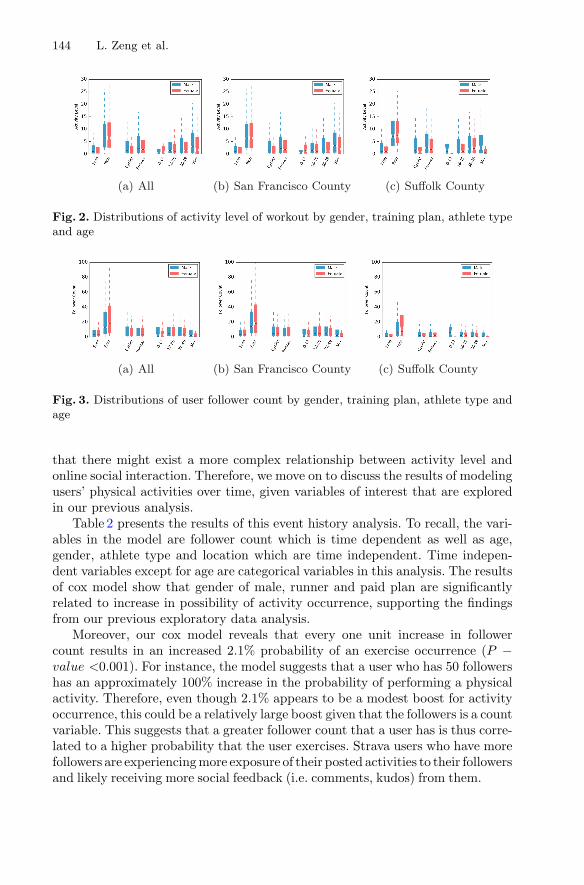
Figures 2 and 3 show how users’ activity level and follower count vary in termsof gender, training plan, athlete type and age. We compare the two locationswith the entire set to see if there is any spatial difference. Overall, we find thatdistributions of activity level and follower count follow similar patterns for bothlocations.
One significant difference is between users with free plan and users with paidplan. We observe that paid-plan users tend to exercise more actively and havemore followers. It is worth pointing out that on average female paid-plan users
Modeling Activity Level of Exercise in an Online Fitness Community 143
(a) San Francisco County
(b) Suffolk County
Fig. 1. Seasonal pattern of physical activity frequency.
tend to have more followers than their male paid-plan counterparts, while we donot see significant gender difference in follower count in free-plan user group.
We find that the activity level of cyclists is on average higher than runners,and male cyclists and runners tend to be more active than their female coun-terpart. Future study might examine users and their activities from other areasand countries for a generalization of these findings.
Last, we observe that activity level differs by age group and gender. Menwho are over 50 tend to be more active than men in other age groups, andthe pattern seems consistent across two locations. However, for female users inSuffolk County differences in activity level by age group is larger; women whoare between 36 and 49 tend to be more active than women who are younger orolder. For gender differences, we find that men tend to be exercise more thanwomen across all age groups. While mid-aged or older-aged users tend to exercisemore actively, the results show that younger users tend to receive more followercounts. However, note that the age group of 0–17 contains only a small numberof observations and may not be representative of the larger sub-population.
5.3 Modeling Activity Occurrence
Overall, in the Figs. 2 and 3 we observe that activity level does not always alignwith social subscription level. For example, users who are over 50 exercise quiteactively but have far fewer followers compared to other age groups. This suggests
144 L. Zeng et al.
(a) All (b) San Francisco County (c) Suffolk County
Fig. 2. Distributions of activity level of workout by gender, training plan, athlete typeand age
(a) All (b) San Francisco County (c) Suffolk County
Fig. 3. Distributions of user follower count by gender, training plan, athlete type andage
that there might exist a more complex relationship between activity level andonline social interaction. Therefore, we move on to discuss the results of modelingusers’ physical activities over time, given variables of interest that are exploredin our previous analysis.
Table 2 presents the results of this event history analysis. To recall, the vari-ables in the model are follower count which is time dependent as well as age,gender, athlete type and location which are time independent. Time indepen-dent variables except for age are categorical variables in this analysis. The resultsof cox model show that gender of male, runner and paid plan are significantlyrelated to increase in possibility of activity occurrence, supporting the findingsfrom our previous exploratory data analysis.
Moreover, our cox model reveals that every one unit increase in followercount results in an increased 2.1% probability of an exercise occurrence (P −value <0.001). For instance, the model suggests that a user who has 50 followershas an approximately 100% increase in the probability of performing a physicalactivity. Therefore, even though 2.1% appears to be a modest boost for activityoccurrence, this could be a relatively large boost given that the followers is a countvariable. This suggests that a greater follower count that a user has is thus corre-lated to a higher probability that the user exercises. Strava users who have morefollowers are experiencingmore exposure of their posted activities to their followersand likely receiving more social feedback (i.e. comments, kudos) from them.

Modeling Activity Level of Exercise in an Online Fitness Community 145
Table 2. Modeling activities using cox hazard models
Variable Exponential p-value
Age 1.014 <0.001
Gender (Male) 1.407 <0.001
Athlete Type (Runner) 1.807 <0.001
Plan (Paid) 4.345 <0.001
Follower count 1.021 <0.001
Location (San Francisco) 1.217 0.038
6 Discussion
In online fitness community such as Strava, a rich set of social interaction fea-tures starts with following other athletes and hence building users’ activity-basedsocial network. Therefore, our work aims to analyze the dynamics of online fitnessbehaviors and network subscription as well as the relationship between them.Specifically, we ask how users’ activity levels of exercise change over time, howexercise activeness and network subscription vary among users, and how sub-scription magnitude is associated with activity occurrence. We utilize behavioraltrace data from the online community Strava to answer these research questions.Data focus on two major U.S. metro areas that have a large number of activeStrava users - San Francisco, CA and Suffolk, MA; data contain profile informa-tion of sampled users, user activity logs as well as network subscription logs.
We find that users’ fitness behaviors display clear seasonal patterns. In gen-eral, late spring and summer are more attractive seasons for rides and runs,whereas winter appears to be less attractive. We also observe that comparedto running, cycling is more sensitive to seasonality. Although strong seasonalpatterns of physical activities (especially outdoors activities) are unsurprisingin human behavior, results demonstrate that individual physical inactivity islikely to be aligned with seasonality in a systematic way. For designers of fitnessapplications, an implication of the analysis may be to take into account bothindividual exercise preference and optimal seasons for certain activity types. Forexample, Strava supports a great variety of activity type, but current practices inusing and advertising the application are limited to outdoors activities, (mostlycycling and running).
Paid-plan users exercise more actively and attract more followers than free-plan users. We also observe significant gender differences in follower countsamong paid-plan users; while activity levels of paid-plan users do not vary muchby gender, active female users tend to have more followers than male users do.However, reasons behind the findings require a further investigation. It could bethat active female users tend to connect to more users and hence receive morefollowers in return. Future work might also examine gender differences in theway that networks are structured in terms of symmetric and asymmetric ties forfree-plan and paid-plan users.

146 L. Zeng et al.
The results demonstrate a positive relationship between social subscriptionand activity occurrence. Modeling individual activity occurrence using event his-tory analysis enables us to quantify the “power” of gaining one follower for usersto exercise more. In this work, we focus on characteristics of egos (eg. gender,training plan, age group, etc.). One analysis that may be worth to perform nextis to take into account nodal covariates for both egos and alters. For example,users who have many active followers versus users who have many inactive fol-lowers; or users who are mostly followed by the same gender versus users whoare mostly followed by users whose gender differs from them. Also, built uponthe findings of this work, future work may further compare one-way connec-tions with mutual connections to see which type of connections has a strongerassociation with user activity levels of exercise.
7 Conclusion
Our work analyzes the dynamics of online fitness behaviors and network subscrip-tion as well as the relationship between them. We utilize a large-scale behavioraltrace data set from an online fitness community Strava. Our results indicatethat fitness activity levels not only has seasonal variations, but also vary by usergroup. The results of event history analysis suggest that individual activity levelsare significantly associated with how well users are connected in an online fitnesscommunity. The implications of these results for studies on network-based healthand design of application features for health promotion are also discussed.
Acknowledgement. This material is based upon work supported by an InformationSchool Strategic Research Award, University of Washington and the Office of the VicePresident for Research, University of Minnesota.
References
1. Ahtinen, A., Isomursu, M., Mukhtar, M., Mantyjarvi, J., Hakkila, J., Blom, J.:Designing social features for mobile and ubiquitous wellness applications. In: Pro-ceedings of the 8th International Conference on Mobile and Ubiquitous Multimedia,p. 12. ACM (2009)
2. Chen, Y., Pu, P.: Healthytogether: exploring social incentives for mobile fitnessapplications. In: Proceedings of the Second International Symposium of ChineseCHI, pp. 25–34. ACM (2014)
3. Wing, R.R., Jeffery, R.W.: Benefits of recruiting participants with friends andincreasing social support for weight loss and maintenance. J. Consult. Clin. Psy-chol. 67(1), 132 (1999)
4. Kulik, J.A., Mahler, H.I.: Social support and recovery from surgery. Health Psychol.8(2), 221 (1989)
5. Dishman, R.K., Sallis, J.F., Orenstein, D.R.: The determinants of physical activityand exercise. Public Health Rep. 100(2), 158 (1985)
6. Centola, D., van de Rijt, A.: Choosing your network: social preferences in an onlinehealth community. Soc. Sci. Med. 125, 19–31 (2015)

Modeling Activity Level of Exercise in an Online Fitness Community 147
7. King, A.C., Glanz, K., Patrick, K.: Technologies to measure and modify physicalactivity and eating environments. Am. J. Prev. Med. 48(5), 630–638 (2015)
8. Hamari, J., Koivisto, J.: “working out for likes”: an empirical study on socialinfluence in exercise gamification. Comput. Hum. Behav. 50, 333–347 (2015)
9. Stragier, J., Abeele, M.V., Mechant, P., De Marez, L.: Understanding persistencein the use of online fitness communities: comparing novice and experienced users.Comput. Hum. Behav. 64, 34–42 (2016)
10. Althoff, T.: Population-scale pervasive health. IEEE Pervasive Comput. 16(4),75–79 (2017)
11. Prince, S.A., Adamo, K.B., Hamel, M.E., Hardt, J., Gorber, S.C., Tremblay, M.:A comparison of direct versus self-report measures for assessing physical activityin adults: a systematic review. Int. J. Behav. Nutr. Phys. Act. 5(1), 56 (2008)
12. Bernard, H.R., Killworth, P., Kronenfeld, D., Sailer, L.: The problem of informantaccuracy: the validity of retrospective data. Ann. Rev. Anthropol. 13, 495–517(1984)
13. Strava, Strava just hit a huge activity milestone (2017). http://womensrunning.competitor.com/2017/05/news/strava-one-billion-activities 75359
14. Foster, D., Linehan, C., Kirman, B., Lawson, S., James, G.: Motivating physicalactivity at work: using persuasive social media for competitive step counting. In:Proceedings of the 14th International Academic MindTrek Conference: EnvisioningFuture Media Environments, pp. 111–116. ACM (2010)
15. Cavallo, D.N., Tate, D.F., Ries, A.V., Brown, J.D., DeVellis, R.F., Ammerman,A.S.: A social media-based physical activity intervention: a randomized controlledtrial. Am. J. Prev. Med. 43(5), 527–532 (2012)
16. Consolvo, S., McDonald, D.W., Toscos, T., Chen, M.Y., Froehlich, J., Harrison,B., Klasnja, P., LaMarca, A., LeGrand, L., Libby, R., et al.: Activity sensing inthe wild: a field trial of ubifit garden. In: Proceedings of the SIGCHI Conferenceon Human Factors in Computing Systems, pp. 1797–1806. ACM (2008)
17. Lister, C., West, J.H., Cannon, B., Sax, T., Brodegard, D.: Just a fad? gamificationin health and fitness apps. JMIR Serious Games 2(2)
18. West, J.H., Hall, P.C., Hanson, C.L., Barnes, M.D., Giraud-Carrier, C., Barrett,J.: There’s an app for that: content analysis of paid health and fitness apps. J.Med. Int. Res. 14(3)
19. Campbell, T., Ngo, B., Fogarty, J.: Game design principles in everyday fitnessapplications. In: Proceedings of the 2008 ACM Conference on Computer SupportedCooperative Work, pp. 249–252. ACM (2008)
20. Choi, G., Chung, H.: Applying the technology acceptance model to social network-ing sites (sns): impact of subjective norm and social capital on the acceptance ofsns. Int. J. Hum.-Comput. Interact. 29(10), 619–628 (2013)
21. Consolvo, S., Everitt, K., Smith, I., Landay, J.A.: Design requirements for technolo-gies that encourage physical activity. In: Proceedings of the SIGCHI Conferenceon Human Factors in Computing Systems, pp. 457–466. ACM (2006)