statutory claims impacts - actuaries institute lisa.pdf · what does acdc have to do with the...
TRANSCRIPT

Statutory Claims impacts
Lisa Simpson, Partner PwC

What does ACDC have to do with the global economy?

14 of 16 album releases have either preceded or coincided with
downturns in the US economy
US Real GDP & AC\DC Album Release Datesannualised % change in US Real GDP
-10
-5
0
5
10
15
20
De
c-7
2
De
c-7
4
De
c-7
6
De
c-7
8
De
c-8
0
De
c-8
2
De
c-8
4
De
c-8
6
De
c-8
8
De
c-9
0
De
c-9
2
De
c-9
4
De
c-9
6
De
c-9
8
De
c-0
0
De
c-0
2
De
c-0
4
De
c-0
6
De
c-0
8
Quarter
%
High
Voltage
Highway
to Hell
Back in
Black
Black
Ice
Analysis courtesy of Alexis Petridis at The Guardian (UK)
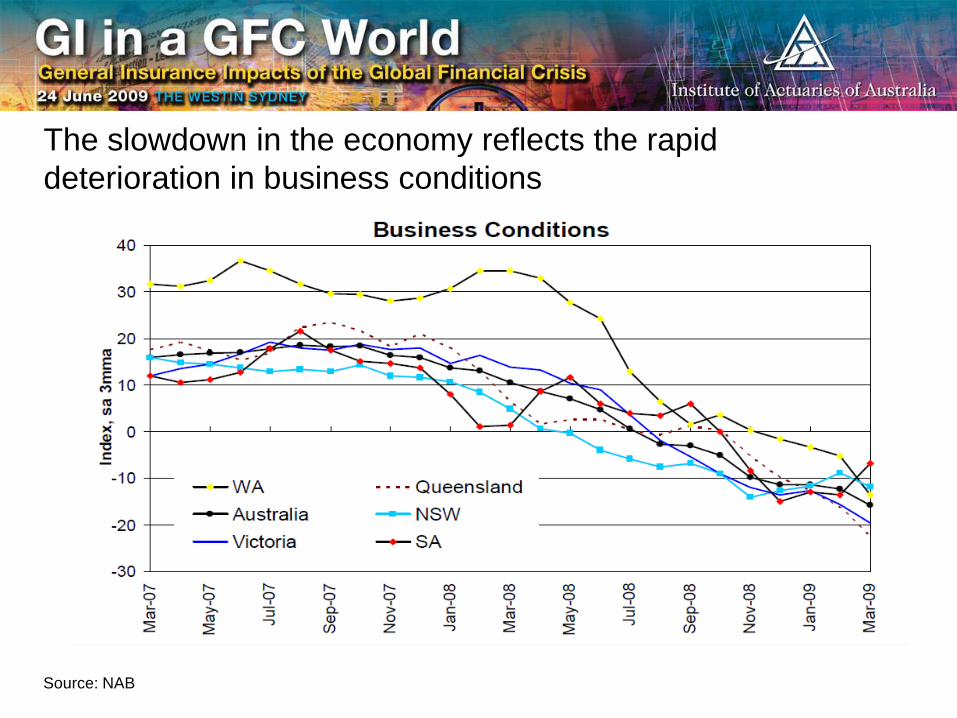
The slowdown in the economy reflects the rapid
deterioration in business conditions
Source: NAB
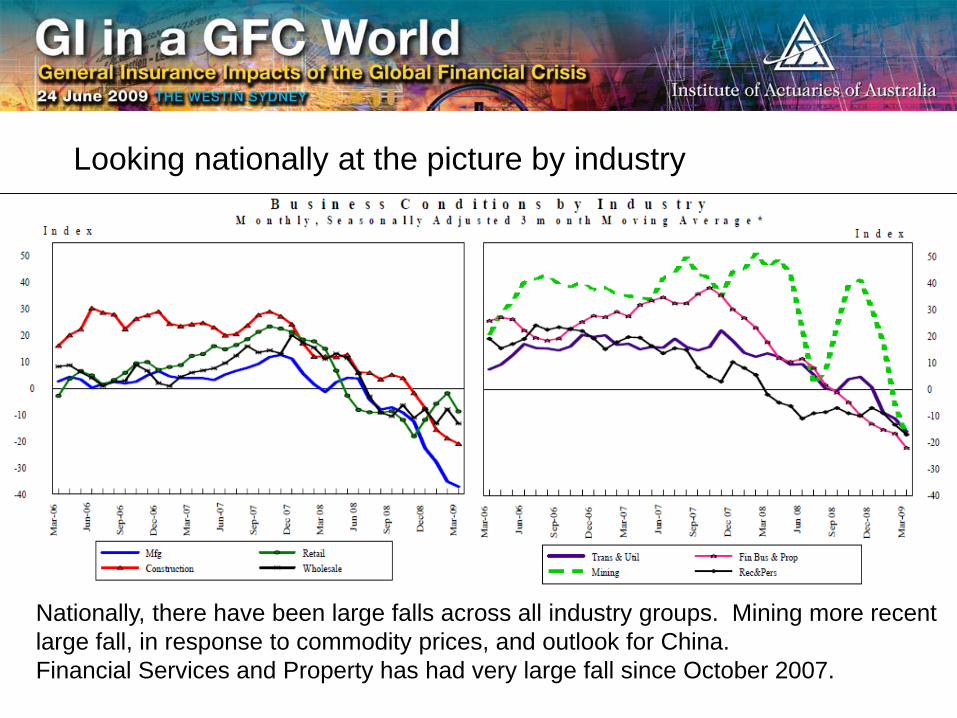
Looking nationally at the picture by industry
Nationally, there have been large falls across all industry groups. Mining more recent
large fall, in response to commodity prices, and outlook for China.
Financial Services and Property has had very large fall since October 2007.
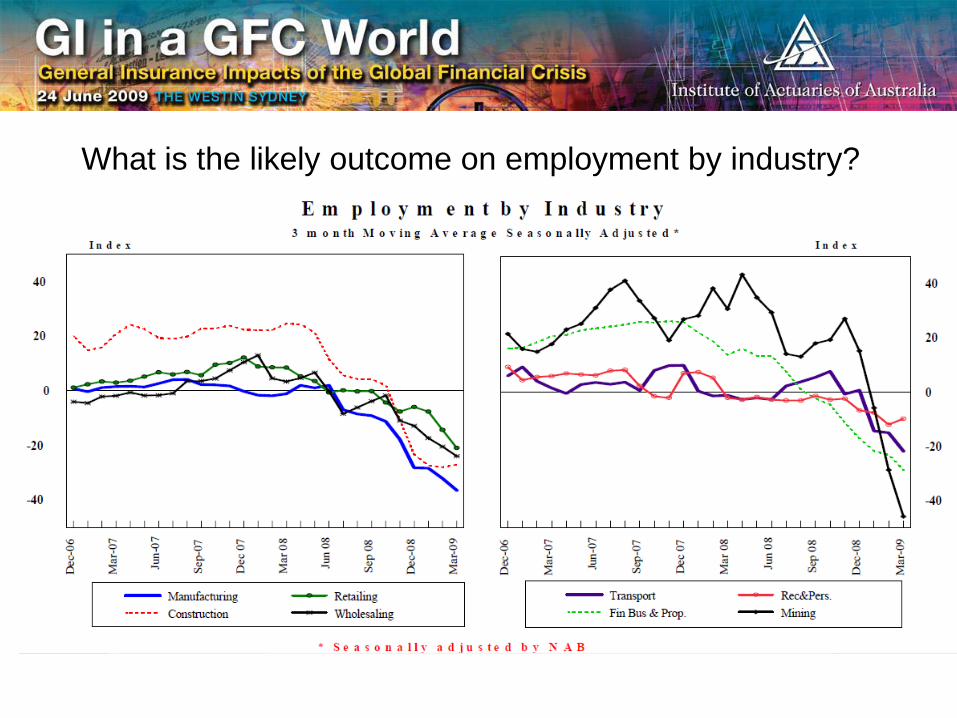
What is the likely outcome on employment by industry?

What is the likely outcome on employment by state?
Compares to 6.7% unemployment in NSW and
6.3% in Victoria, 5.4% in Queensland and
6.5% in SA, 6% overall across Australia, as at
March 2009.
In other words, the privately underwritten
workers’ compensation states have the lowest
unemployment to date.
Nationally employment is forecast to reach
above 8% by the end of 2010.
NT 4.1%
WA 4.8%
Tas 5%
ACT 2.4%

Comments from Workers compensation
• Fewer statutory claims expected overall
• Expect longer weekly benefit durations, especially for stress
• Less opportunities for part-time and other modified duties
• If extended recession, could see pressure on conciliation results due to decreased
job availability at suitable duties
• Auto industry a particular concern
• From past experience, independent assessors quite aware of claimants’ psycho-
social situation, may subconsciously respond esp. for hearing loss & gradual onset.
• Impairment assessors may find more injuries in addition to main injury, increasing
overall WPI
• Bigger worry is increase in number of new lump sum impairment lodgements
• Expect more gradual process / “discretionary” injuries
• Already seeing much more aggressive advertising from law firms & specialist clinics
– potential increase in common law

WA Workers compensation industry claims reported
Early evidence of higher PPCI, and slightly lower rates of finalisation.

WA Workers compensation industry claims reported
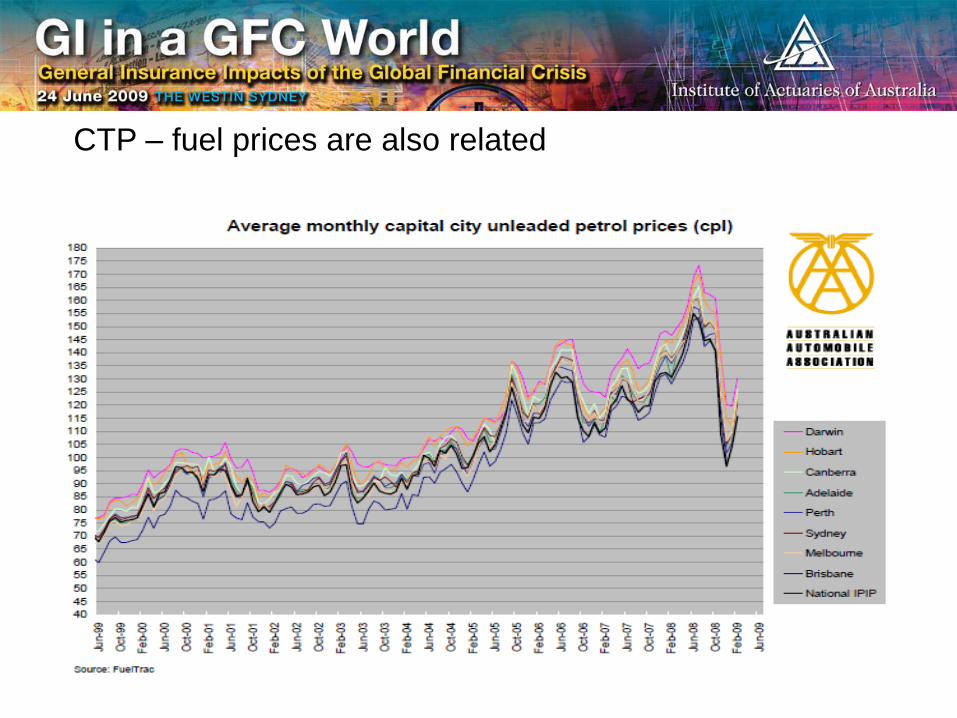
CTP – fuel prices are also related
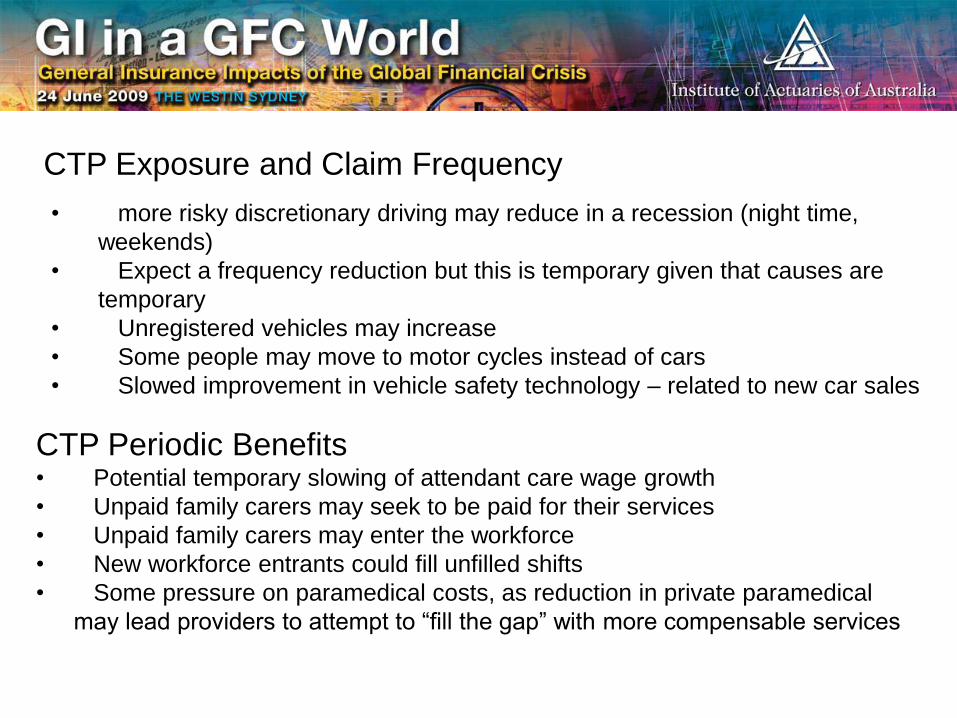
CTP Exposure and Claim Frequency
• more risky discretionary driving may reduce in a recession (night time,
weekends)
• Expect a frequency reduction but this is temporary given that causes are
temporary
• Unregistered vehicles may increase
• Some people may move to motor cycles instead of cars
• Slowed improvement in vehicle safety technology – related to new car sales
CTP Periodic Benefits• Potential temporary slowing of attendant care wage growth
• Unpaid family carers may seek to be paid for their services
• Unpaid family carers may enter the workforce
• New workforce entrants could fill unfilled shifts
• Some pressure on paramedical costs, as reduction in private paramedical
may lead providers to attempt to “fill the gap” with more compensable services
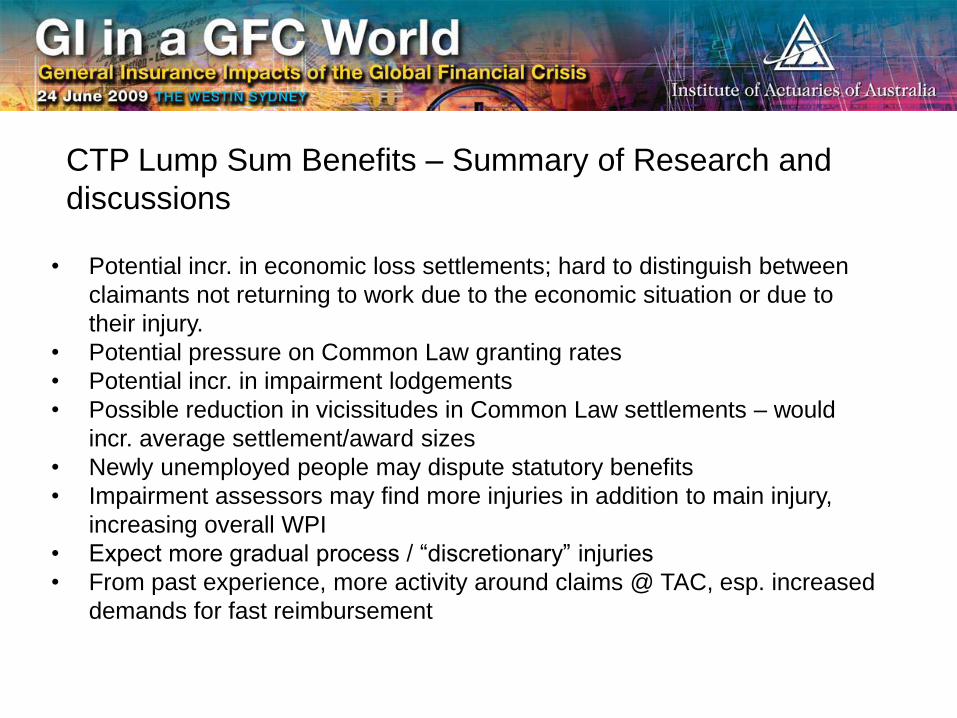
CTP Lump Sum Benefits – Summary of Research and
discussions
• Potential incr. in economic loss settlements; hard to distinguish between
claimants not returning to work due to the economic situation or due to
their injury.
• Potential pressure on Common Law granting rates
• Potential incr. in impairment lodgements
• Possible reduction in vicissitudes in Common Law settlements – would
incr. average settlement/award sizes
• Newly unemployed people may dispute statutory benefits
• Impairment assessors may find more injuries in addition to main injury,
increasing overall WPI
• Expect more gradual process / “discretionary” injuries
• From past experience, more activity around claims @ TAC, esp. increased
demands for fast reimbursement

NSW CTP Claimant Frequency experience to date
Claimant Frequency
0.0
0.0
0.0
0.0
0.0
0.0
0.0
0.0
Jul-
04
Oct
-04
Jan
-05
Ap
r-0
5
Jul-
05
Oct
-05
Jan
-06
Ap
r-0
6
Jul-
06
Oct
-06
Jan
-07
Ap
r-0
7
Jul-
07
Oct
-07
Jan
-08
Ap
r-0
8
Jul-
08
Oct
-08
Jan
-09
Ap
r-0
9
Accident Month
0
20
40
60
80
100
120
140
160
180
Claimant Frequency
12 month moving average
Average Sydney Metro Fuel