status of the trmm 2a12 land precipitation algorithm
TRANSCRIPT
Status of the TRMM 2A12 Land Precipitation Algorithm
KAUSHIK GOPALAN AND NAI-YU WANG
Earth System Science Interdisciplinary Center, University of Maryland, College Park, College Park, Maryland
RALPH FERRARO
NOAA/NESDIS/Center for Satellite Applications and Research (STAR)/SCSB, Camp Springs, and Cooperative
Institute of Climate Studies, ESSIC, University of Maryland, College Park, College Park, Maryland
CHUNTAO LIU
Department of Atmospheric Sciences, University of Utah, Salt Lake City, Utah
(Manuscript received 2 February 2010, in final form 8 April 2010)
ABSTRACT
This paper describes improvements to the Tropical Rainfall Measurement Mission (TRMM) Microwave
Imager (TMI) land rainfall algorithm in version 7 (v7) of the TRMM data products. The correlations between
rain rates and TMI 85-GHz brightness temperatures (Tb) for convective and stratiform rain are generated
using 7 years of collocated TMI and TRMM precipitation radar (PR) data. The TMI algorithm for estimating
the convective ratio of rainfall is also modified. This paper highlights both the improvements in the v7 al-
gorithm and the continuing problems with the land rainfall retrievals. It is demonstrated that the proposed
changes to the algorithm significantly lower the overestimation by TMI globally and over large sections of
central Africa and South America. Also highlighted are the problems with the 2A12 land algorithm that have
not been addressed in the version 7 algorithm, such as large regional and seasonal dependence of biases in the
TMI rain estimates, and potential changes to the algorithm to resolve these problems are discussed.
1. Introduction
The Tropical Rainfall Measurement Mission (TRMM)
Microwave Imager (TMI), a nine-channel (10–85 GHz)
dual-polarized microwave radiometer, is one of five in-
struments aboard the TRMM spacecraft and is used to
provide rainfall estimates over the tropics. The TRMM
2A12 data product, which contains instantaneous rain-
fall estimates from TMI, uses separate algorithms for
land, ocean, and coastal regions. Separate algorithms are
required for these three cases because of the major dif-
ferences in the microwave emission characteristics of each
surface type. The ocean surface is radiometrically cold
and strongly polarized at microwave frequencies at low
and moderate wind speeds; hence, the warm, randomly
polarized emission from rainfall can be easily distin-
guished from the ocean surface emission. In contrast, land
surfaces are radiometrically warm and highly unpolarized;
therefore, the depression in the 85-GHz brightness tem-
perature (Tb) from ice scattering is primarily used to
estimate rainfall over land. Further, land surfaces are
typically highly nonhomogeneous and can have extremely
variable surface emissivities. Thus, the TMI land rainfall
algorithm has traditionally been implemented through
empirically derived Tb–rain-rate relationships, rather than
relying on the physically based radiative transfer modeling
of rainfall (as is the case with the TMI ocean algorithm).
This paper details the improvements made to the TMI
land rainfall algorithm in preparation for version 7 of the
TRMM 2A12 data product, which were developed based
on empirical analysis of a multiyear global set of collo-
cations between TMI and the precipitation radar (PR).
However, there are ongoing efforts in the satellite re-
trieval community aiming to characterize the land surface
emissivity, and it is expected that future versions of the
TMI land algorithm will be more physically based.
Corresponding author address: Kaushik Gopalan, Earth System
Science Interdisciplinary Center, University of Maryland, College
Park, 5825 University Research Ct. Ste. 4001, College Park, MD
20740.
E-mail: [email protected]
AUGUST 2010 G O P A L A N E T A L . 1343
DOI: 10.1175/2010JTECHA1454.1
� 2010 American Meteorological Society
The TMI land rainfall algorithm was originally devel-
oped for the Special Sensor Microwave Imager (SSM/I)
and was based on an empirically derived scattering in-
dex using the 19-, 22-, and 85-GHz vertically polarized
channels (Grody 1991). The version 5 algorithm esti-
mated the surface rainfall as a function of the scattering
index; this function was derived using SSM/I collocations
with ground radar over the United States, the United
Kingdom, and Japan (Ferraro and Marks 1995). The TMI
algorithm was then significantly restructured in version 6
(v6) of the TMI rain product. The near-surface rain rates
(RRs) were estimated as a function of the 85-GHz ver-
tically polarized Tb values (85V Tb), as described by
McCollum and Ferraro (2003). The 85V Tb–RR rela-
tionship was derived empirically by using collocations
between TMI and the PR over Africa and South America
from October and November 2000. Separate Tb–RR re-
lationships were derived for different storm types; that is,
for stratiform and convective storms. These Tb–RR re-
lationships were incorporated into the Goddard profiling
(GPROF) framework (Kummerow et al. 2001) by ex-
tracting a set of profiles that follow the empirically de-
rived 85V Tb–RR relationships and using these profiles
to estimate near-surface rain rates from Tb observations
using a Bayesian framework. The RR estimates for strat-
iform and convective storms are combined for each pixel
using a convective probability indicator using the follow-
ing equation:
RR 5 RRconv
P(C) 1 RRstrat
[1� P(C)], (1)
where RR is the TMI v6 rain-rate estimate, RRconv is the
RR estimated from the convective profiles, RRstrat is the
RR estimated from the stratiform profiles, and P(C)
is the TMI estimate of the convective probability (ratio)
of the observed rainfall. Here, P(C) is estimated using
a linear combination of the following seven predictors
(McCollum and Ferraro 2003): the vertically polarized
brightness temperatures from 10-, 37-, and 85-GHz chan-
nels; the spatial standard deviation of the 85V Tb over a
40 km 3 40 km area (from Grecu and Anagnostou 2001);
the brightness temperature minima as developed by
Prabhakara et al. (2000); and, last, the polarization dif-
ference and the normalized polarization difference at
85 GHz (from Olson et al. 2001).
Comparisons of the TMI v6 land rainfall estimates
with rain-rate estimates from other sources have revealed
some significant anomalies in these estimates. The TMI
estimates were found to be higher than rain estimates
from both PR and the Global Precipitation Climatology
Project (GPCP), as described by Wang et al. (2009). This
overestimation of rainfall by TMI is most prominent
over central Africa and Tibet. TMI is also known to
underestimate ‘‘warm’’ rainfall over land (Liu and Zipser
2009) because of the lack of significant ice scattering in
such rainfall. Further, the RR biases between TMI and
both PR and GPCP were observed to have strong seasonal
variations. These inconsistencies in the TMI land retrievals
are a serious concern to the users of these retrievals.
The work described in this paper focuses on reducing
the overestimation of the global mean rainfall over land
by TMI by developing a more robust model of the TMI
RR–85V Tb relationship. This is accomplished by using
a more comprehensive training set of collocations be-
tween TMI and PR than that of v6, which was trained
using TMI–PR collocations from October and Novem-
ber 2000. In this work we use TMI–PR land collocations
extending globally (excluding the higher latitudes that
are not covered by TRMM) from 2002 to 2008, that is,
almost the entire duration of the TRMM mission since
the orbit boost in late 2001. The TMI–PR collocations
were obtained from the University of Utah TRMM pre-
cipitation and cloud feature database (Liu et al. 2008).
Similar modeling of the TMI land rain rates, assum-
ing polynomial RR–Tb relationships, was performed
by Dinku and Anagnostou (2005), who performed their
analysis on four regions (central Africa, the Amazon,
the U.S. southern plains, and the Ganga–Brahmaputra–
Meghna River basin) for the summer seasons in 2000–02.
PR rain rates from specific regions and limited time pe-
riods have also been used as a training set by McCollum
and Ferraro (2003) and Grecu and Anagnostou (2001).
This paper builds on the previous work by McCollum and
Ferraro (2003) by taking advantage of the vastly expanded
training set of TMI–PR collocations that has become
available since the release of the TMI v6 algorithm, and
using them to significantly reduce the biases in the global
TMI rainfall estimates.
2. Methodology
The University of Utah level 1 Precipitation Feature
(PF) database provides collocations between TMI and
PR pixels for every TRMM orbit for the 7-yr period
from January 2002 to December 2008. The PF database
assigns a TMI pixel at the 85-GHz resolution as the
‘‘nearest neighbor’’ for every PR pixel in an orbit. Be-
cause of the finer sampling in PR as compared to TMI,
there are typically from three to four PR pixels assigned
as the nearest neighbor to every TMI pixel within the
PR swath. To generate the training dataset, the PR near-
surface rain rates (Iguchi et al. 2000) of all of the pixels
corresponding to a given TMI pixel were averaged to
give the ‘‘apparent’’ RR for that given pixel. This RR
estimate was stored along with all of the TMI Tb mea-
surements for every TMI high-resolution (85 GHz) pixel.
1344 J O U R N A L O F A T M O S P H E R I C A N D O C E A N I C T E C H N O L O G Y VOLUME 27

The sampling rates for the TMI 10–37-GHz channels are
half that of the 85-GHz channels in the along-scan direc-
tion; thus, these low-resolution Tb values are interpolated
appropriately to align them with the TMI 85-GHz mea-
surements. The PR classification of the storm type from
the TRMM 2A23 data product was also included in this
dataset. This training dataset was then filtered to only
include those TMI pixels that are tagged as ‘‘land’’ pixels
in the 2A12 data product (pixels tagged as ‘‘coast’’ are
also excluded).
The PF database corrects for the difference in the view
angles of PR and TMI by implementing a parallax cor-
rection that consists of shifting the TMI observations
back (forward) by one scan for the forward 08 (1808) yaw
orientation for TMI. This correction is optimized for deep
convective clouds; it is not suited for the most shallow
storms, which constitute a large fraction of the precipi-
tation observed by TRMM. Therefore, this correction
was canceled for the purpose of this work by shifting the
TMI observations in the PF database back to their orig-
inal locations. Section 2a describes the procedure used to
generate the PR RR–TMI 85V Tb relationships using the
modified collocations from the PF database.
a. Generation of PR RR–TMI 85V Tb relationshipsfor convective and stratiform storms
The first step of our empirical analysis was to examine
the RR–85V Tb relationships of convective and stratiform
rainfall separately. The PR 2A23 rain-type flag (Awaka
et al. 1998) was used for this purpose. Those TMI pixels
for which 75% or greater of the associated PR pixels
were tagged as ‘‘convective certain’’ were used to generate
the RR–Tb curve for convective rain, and a similar pro-
cedure was used for stratiform rain. When the mean PR
RR of a bin size of 10 K from 85V Tb in the range of 120–
270 K for both convective and stratiform storms from
January 2002–December 2008 were calculated, a clear
distinction was observed between the RR–Tb relation-
ships for convective and stratiform storms, as was ex-
pected. Further, the data were separated into four seasons
(spring, summer, fall, and winter) and two latitude bins,
the tropics (between 208N and 208S) and the subtropics
(north of 208N and south of 208S), in order to observe the
regional and seasonal variations in the TMI Tb–RR re-
lationships. Significant differences were observed in the
Tb–RR relationships of the seasonal/latitude regimes, as
shown in Fig. 1. The RRs for each Tb bin were found to
be generally higher in the subtropics than in the tropics
for all seasons. The differences in the Tb–RR relationships
for different seasons were relatively small in the tropics,
while they were significantly larger (up to ’5 mm h21 for
each Tb bin) in the subtropics, which have more seasonal
variability in storm types than the tropics.
These significant differences in the Tb–RR relation-
ships for the different seasonal/latitude regimes seemed
to be a promising indicator that our approach would help
reduce the seasonal and geographic variability of the TMI
RR biases. However, the maximum mean RR for con-
vective storms saturated at approximately 20 mm h21 for
all of the seasonal and latitude regimes. Such a low value
of the maximum estimated rainfall is extremely unreal-
istic and would render the TMI RR product unusable for
many applications. It was also observed that the mini-
mum mean RR for stratiform storms was ’1.5 mm h21.
FIG. 1. Mean PR RR for 10-K TMI 85V Tb bins for different seasons and latitude ranges for (a) convective and
(b) stratiform pixels. There are significant differences in the RR–Tb relationships in the tropics and the subtropics.
The RR–Tb relationships for different seasons are also significantly different in the subtropics.
AUGUST 2010 G O P A L A N E T A L . 1345
These problems were addressed using the filtering mech-
anism described in section 2b.
b. Filtering the TMI–PR dataset
To understand the saturation of the mean RRs at the
high end for convective pixels and the low end for strat-
iform, the distribution of the apparent PR RRs for the
different Tb bins were analyzed closely. For convective
storms, it was discovered that a significant fraction of the
low Tb pixels in the TMI–PR collocation set had a very
low value of the ‘‘apparent’’ RR estimated by PR. There
is strong 85V Tb depression in these pixels that is appar-
ently not caused by rain, but perhaps by surface scattering
(over snow-covered and arid lands). These pixels cannot
be accurately represented by the current TMI land al-
gorithm, whose accuracy depends greatly on the assumed
relationship between the negative ‘‘ice scattering’’ signal
observed in the 85V channel Tb and surface RR, because
the assumed 85V Tb–RR correlation is clearly not true
for these pixels. These anomalous points cause the satu-
ration of the maximum estimated RR at an unrealistically
low value for convective pixels. Conversely, for some
stratiform pixels, there is no discernible 85V Tb de-
pression even though the PR apparent RR is significantly
high. These occurrences are likely during ‘‘warm rain,’’
where there is not sufficient ice in the atmosphere to
cause a Tb depression in the 85V channel.
To combat the challenges described above, a filtering
method was designed to remove pixels with significant
surface scattering signatures from the convective train-
ing set, and to remove pixels with warm rainfall that is
undetectable by the current TMI algorithm from the
stratiform training set. A heuristic method based on the
PR and TMI v6 rain rates was used to filter the training
dataset. It was assumed that gross errors between TMI
v6 and PR RRs are caused by fundamental limitations
in the TMI algorithm that cannot be solved simply by
developing a more robust estimate of the TMI RR–Tb
relationship and would require more fundamental changes
in the algorithm structure. Thus, pixels that exhibited such
gross errors were treated as ‘‘outliers’’ and excluded from
the training dataset. The pixels where the TMI v6 RR was
higher than the PR RR by 50% or more were excluded
from the convective training set and the pixels where the
TMI v6 RR was lower than the PR RR by 50% or more
were excluded from the stratiform training set.
The threshold of 50% was determined experimentally
and was chosen to provide a reasonable balance between
discarding the minimum number of points (which requires
the threshold to be as high as possible) and minimizing the
effect of the ‘‘outliers’’ on the Tb–RR regressions (which
requires the threshold to be low). Using this method, ap-
proximately 30% of the points in the convective dataset
and 5% of the points in the stratiform dataset were ex-
cluded. The geographic distribution of the discarded pixels
for the June–August (JJA) and December–February
(DJF) seasons for both the convective and stratiform
storms is shown in Fig. 2. In JJA, the majority of dis-
carded convective pixels are concentrated around the
semiarid regions and grasslands in Africa, the mountain-
ous regions of southeast and central Asia, and the south-
ern United States. It is likely that TMI overestimates RR
in semiarid regions because of surface scattering. Some
of the excluded pixels are over the center of deep con-
vective cores with large ice scattering and extremely
cold Tb, but the PR near-surface reflectivity values over
these pixels are not as high, possibly resulting from at-
tenuation. Subcloud evaporation of rain is also a likely
cause of the RR overestimation by TMI over semiarid
regions. In this case, the liquid hydrometeors evaporate
before reaching the surface and do not contribute to the
near-surface precipitation. Additionally, the differences
in the TMI and PR observations may also be caused by
the large difference in the viewing angle of the two in-
struments. These differences are especially significant
for deep convective rainfall, which makes up the bulk
of the excluded pixels. Over the mountainous regions
in Asia, the Appalachian Mountains, the Rocky Moun-
tains, and the Sierra Nevada, neither TMI nor PR are
likely to be completely accurate. In DJF, there is a high
percentage of discarded pixels in southern Africa and
South America. Much of the precipitation in these
areas comes from storms with deep convective cores,
over which both TMI and PR have occasional problems
obtaining accurate rain estimates. The collocation of
TMI and PR RR estimates is also problematic over
such deep convection. Thus, these pixels are excluded
from the training dataset used to generate the TMI Tb–
RR relationship.
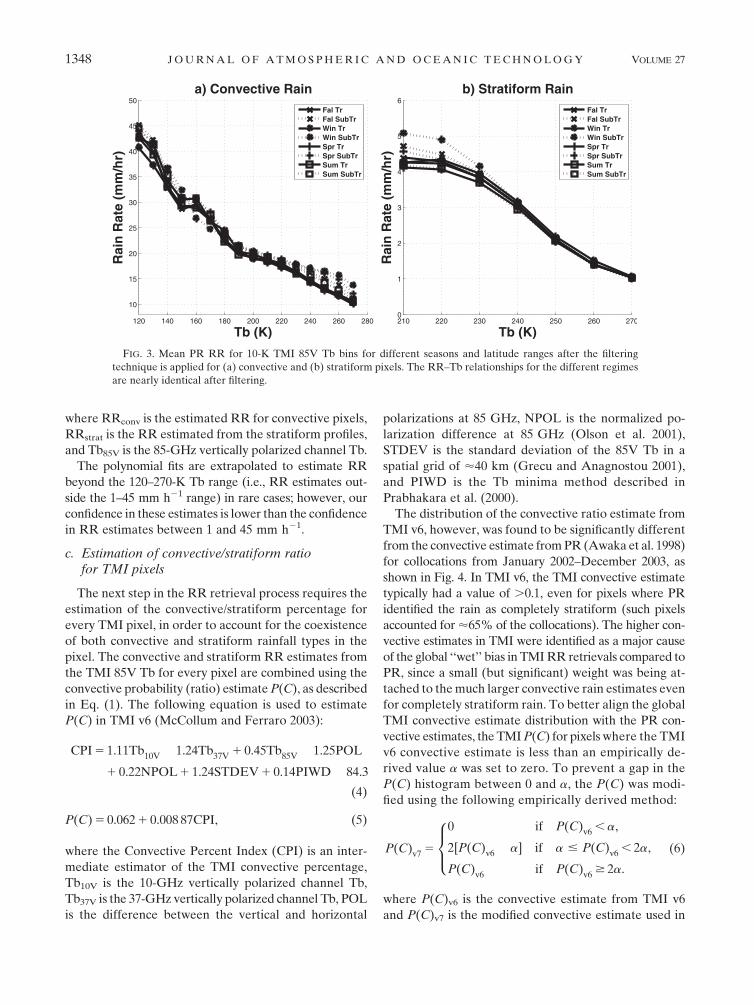
After filtering the dataset, the convective RR–Tb curve
(estimated using mean PR RRs for 10-K 85V Tb bins) no
longer saturates at the lower Tb values and the mean PR
RR continues to increase beyond ’45 mm h21 when
the 85V Tb goes below 120 K (see Fig. 3a). The mini-
mum PR RR for the stratiform curves also goes down
to ’1 mm h21 after filtering, as is shown in Fig. 3b. The
filtering technique also removes the differences between
the different seasonal/latitude bins; the differences be-
tween the Tb and RR relationships for the eight differ-
ent regimes are negligibly small. This implies that the
main regional and seasonal Tb–RR differences shown
in Fig. 1 are due to warm rainfall, the extreme deep con-
vective core, and surface emission contamination. Without
considering these situations, a general Tb–RR relationship
may apply well to most precipitation systems in different
seasons and over various regions.
1346 J O U R N A L O F A T M O S P H E R I C A N D O C E A N I C T E C H N O L O G Y VOLUME 27
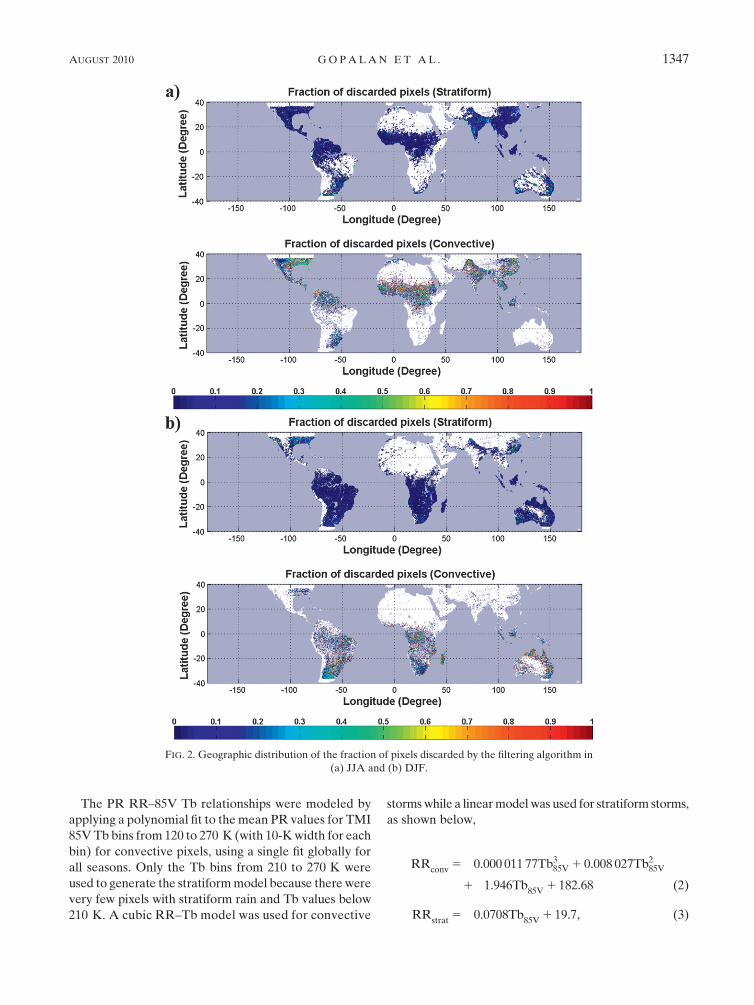
The PR RR–85V Tb relationships were modeled by
applying a polynomial fit to the mean PR values for TMI
85V Tb bins from 120 to 270 K (with 10-K width for each
bin) for convective pixels, using a single fit globally for
all seasons. Only the Tb bins from 210 to 270 K were
used to generate the stratiform model because there were
very few pixels with stratiform rain and Tb values below
210 K. A cubic RR–Tb model was used for convective
storms while a linear model was used for stratiform storms,
as shown below,
RRconv
5�0.000 011 77Tb385V 1 0.008 027Tb2
85V
1�1.946Tb85V
1 182.68 (2)
RRstrat
5�0.0708Tb85V
1 19.7, (3)
FIG. 2. Geographic distribution of the fraction of pixels discarded by the filtering algorithm in
(a) JJA and (b) DJF.
AUGUST 2010 G O P A L A N E T A L . 1347
where RRconv is the estimated RR for convective pixels,
RRstrat is the RR estimated from the stratiform profiles,
and Tb85V is the 85-GHz vertically polarized channel Tb.
The polynomial fits are extrapolated to estimate RR
beyond the 120–270-K Tb range (i.e., RR estimates out-
side the 1–45 mm h21 range) in rare cases; however, our
confidence in these estimates is lower than the confidence
in RR estimates between 1 and 45 mm h21.
c. Estimation of convective/stratiform ratiofor TMI pixels
The next step in the RR retrieval process requires the
estimation of the convective/stratiform percentage for
every TMI pixel, in order to account for the coexistence
of both convective and stratiform rainfall types in the
pixel. The convective and stratiform RR estimates from
the TMI 85V Tb for every pixel are combined using the
convective probability (ratio) estimate P(C), as described
in Eq. (1). The following equation is used to estimate
P(C) in TMI v6 (McCollum and Ferraro 2003):
CPI 5 1.11Tb10V� 1.24Tb
37V1 0.45Tb
85V� 1.25POL
1 0.22NPOL 1 1.24STDEV 1 0.14PIWD� 84.3
(4)
P(C) 5 0.062 1 0.008 87CPI, (5)
where the Convective Percent Index (CPI) is an inter-
mediate estimator of the TMI convective percentage,
Tb10V is the 10-GHz vertically polarized channel Tb,
Tb37V is the 37-GHz vertically polarized channel Tb, POL
is the difference between the vertical and horizontal
polarizations at 85 GHz, NPOL is the normalized po-
larization difference at 85 GHz (Olson et al. 2001),
STDEV is the standard deviation of the 85V Tb in a
spatial grid of ’40 km (Grecu and Anagnostou 2001),
and PIWD is the Tb minima method described in
Prabhakara et al. (2000).
The distribution of the convective ratio estimate from
TMI v6, however, was found to be significantly different
from the convective estimate from PR (Awaka et al. 1998)
for collocations from January 2002–December 2003, as
shown in Fig. 4. In TMI v6, the TMI convective estimate
typically had a value of .0.1, even for pixels where PR
identified the rain as completely stratiform (such pixels
accounted for ’65% of the collocations). The higher con-
vective estimates in TMI were identified as a major cause
of the global ‘‘wet’’ bias in TMI RR retrievals compared to
PR, since a small (but significant) weight was being at-
tached to the much larger convective rain estimates even
for completely stratiform rain. To better align the global
TMI convective estimate distribution with the PR con-
vective estimates, the TMI P(C) for pixels where the TMI
v6 convective estimate is less than an empirically de-
rived value a was set to zero. To prevent a gap in the
P(C) histogram between 0 and a, the P(C) was modi-
fied using the following empirically derived method:
P(C)v7
5
0 if P(C)v6
, a,
2[P(C)v6� a] if a # P(C)
v6, 2a,
P(C)v6
if P(C)v6
$ 2a.
8><>:
(6)
where P(C)v6 is the convective estimate from TMI v6
and P(C)v7 is the modified convective estimate used in
FIG. 3. Mean PR RR for 10-K TMI 85V Tb bins for different seasons and latitude ranges after the filtering
technique is applied for (a) convective and (b) stratiform pixels. The RR–Tb relationships for the different regimes
are nearly identical after filtering.
1348 J O U R N A L O F A T M O S P H E R I C A N D O C E A N I C T E C H N O L O G Y VOLUME 27
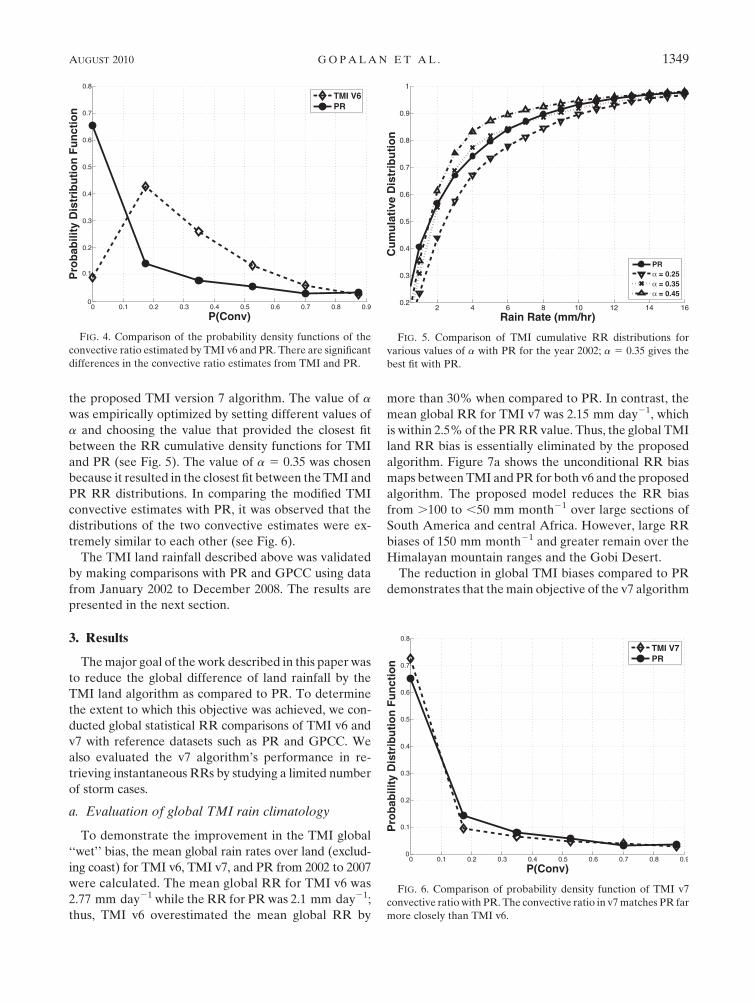
the proposed TMI version 7 algorithm. The value of a
was empirically optimized by setting different values of
a and choosing the value that provided the closest fit
between the RR cumulative density functions for TMI
and PR (see Fig. 5). The value of a 5 0.35 was chosen
because it resulted in the closest fit between the TMI and
PR RR distributions. In comparing the modified TMI
convective estimates with PR, it was observed that the
distributions of the two convective estimates were ex-
tremely similar to each other (see Fig. 6).
The TMI land rainfall described above was validated
by making comparisons with PR and GPCC using data
from January 2002 to December 2008. The results are
presented in the next section.
3. Results
The major goal of the work described in this paper was
to reduce the global difference of land rainfall by the
TMI land algorithm as compared to PR. To determine
the extent to which this objective was achieved, we con-
ducted global statistical RR comparisons of TMI v6 and
v7 with reference datasets such as PR and GPCC. We
also evaluated the v7 algorithm’s performance in re-
trieving instantaneous RRs by studying a limited number
of storm cases.
a. Evaluation of global TMI rain climatology
To demonstrate the improvement in the TMI global
‘‘wet’’ bias, the mean global rain rates over land (exclud-
ing coast) for TMI v6, TMI v7, and PR from 2002 to 2007
were calculated. The mean global RR for TMI v6 was
2.77 mm day21 while the RR for PR was 2.1 mm day21;
thus, TMI v6 overestimated the mean global RR by
more than 30% when compared to PR. In contrast, the
mean global RR for TMI v7 was 2.15 mm day21, which
is within 2.5% of the PR RR value. Thus, the global TMI
land RR bias is essentially eliminated by the proposed
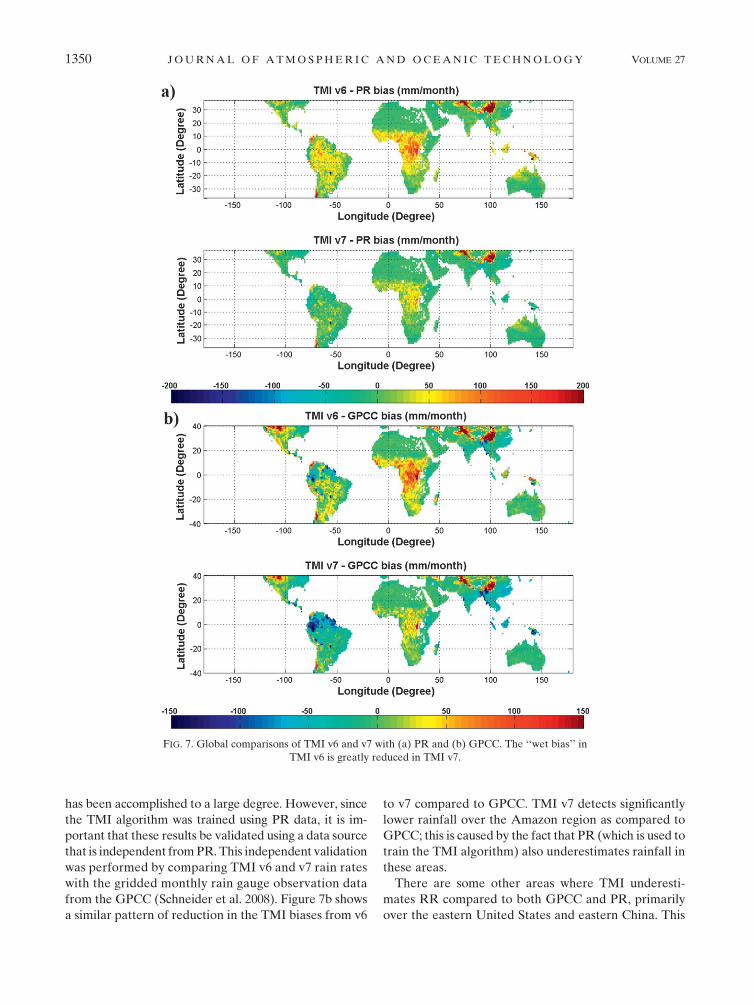
algorithm. Figure 7a shows the unconditional RR bias
maps between TMI and PR for both v6 and the proposed
algorithm. The proposed model reduces the RR bias
from .100 to ,50 mm month21 over large sections of
South America and central Africa. However, large RR
biases of 150 mm month21 and greater remain over the
Himalayan mountain ranges and the Gobi Desert.
The reduction in global TMI biases compared to PR
demonstrates that the main objective of the v7 algorithm
FIG. 4. Comparison of the probability density functions of the
convective ratio estimated by TMI v6 and PR. There are significant
differences in the convective ratio estimates from TMI and PR.
FIG. 5. Comparison of TMI cumulative RR distributions for
various values of a with PR for the year 2002; a 5 0.35 gives the
best fit with PR.
FIG. 6. Comparison of probability density function of TMI v7
convective ratio with PR. The convective ratio in v7 matches PR far
more closely than TMI v6.
AUGUST 2010 G O P A L A N E T A L . 1349
has been accomplished to a large degree. However, since
the TMI algorithm was trained using PR data, it is im-
portant that these results be validated using a data source
that is independent from PR. This independent validation
was performed by comparing TMI v6 and v7 rain rates
with the gridded monthly rain gauge observation data
from the GPCC (Schneider et al. 2008). Figure 7b shows
a similar pattern of reduction in the TMI biases from v6
to v7 compared to GPCC. TMI v7 detects significantly
lower rainfall over the Amazon region as compared to
GPCC; this is caused by the fact that PR (which is used to
train the TMI algorithm) also underestimates rainfall in
these areas.
There are some other areas where TMI underesti-
mates RR compared to both GPCC and PR, primarily
over the eastern United States and eastern China. This
FIG. 7. Global comparisons of TMI v6 and v7 with (a) PR and (b) GPCC. The ‘‘wet bias’’ in
TMI v6 is greatly reduced in TMI v7.
1350 J O U R N A L O F A T M O S P H E R I C A N D O C E A N I C T E C H N O L O G Y VOLUME 27
negative RR bias is caused primarily by imperfections in
the rain/no-rain detection and surface screening proce-
dure in the algorithm (both are unchanged in the new
algorithm), which screens the land surfaces such as snow,
ice, and desert that exhibit similar scattering signals as
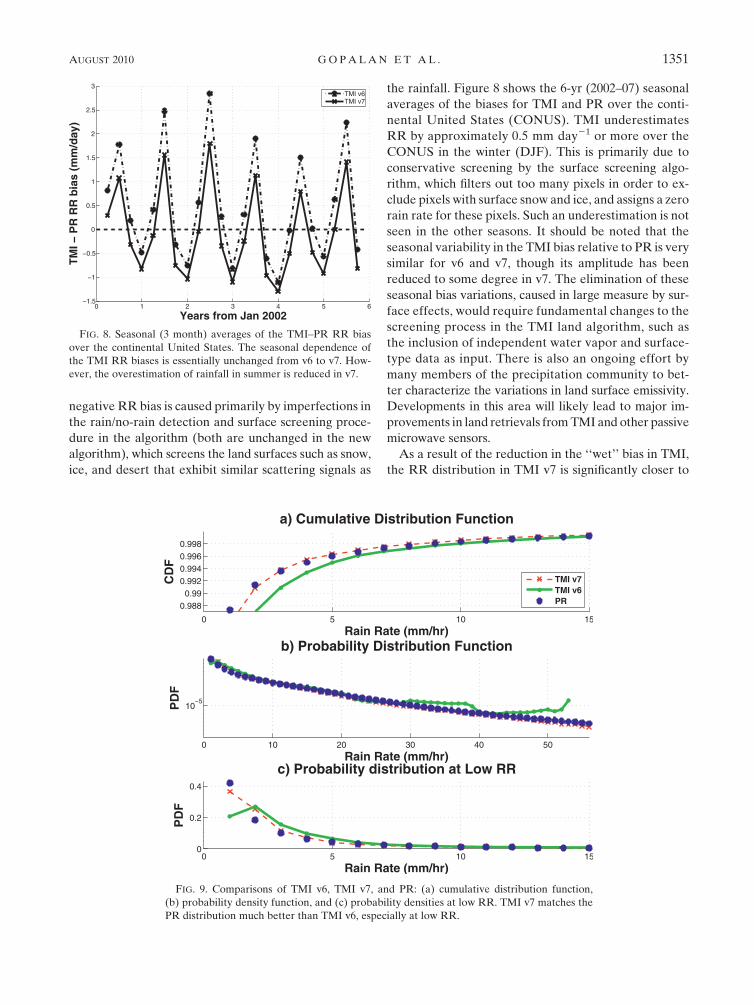
the rainfall. Figure 8 shows the 6-yr (2002–07) seasonal
averages of the biases for TMI and PR over the conti-
nental United States (CONUS). TMI underestimates
RR by approximately 0.5 mm day21 or more over the
CONUS in the winter (DJF). This is primarily due to
conservative screening by the surface screening algo-
rithm, which filters out too many pixels in order to ex-
clude pixels with surface snow and ice, and assigns a zero
rain rate for these pixels. Such an underestimation is not
seen in the other seasons. It should be noted that the
seasonal variability in the TMI bias relative to PR is very
similar for v6 and v7, though its amplitude has been
reduced to some degree in v7. The elimination of these
seasonal bias variations, caused in large measure by sur-
face effects, would require fundamental changes to the
screening process in the TMI land algorithm, such as
the inclusion of independent water vapor and surface-
type data as input. There is also an ongoing effort by
many members of the precipitation community to bet-
ter characterize the variations in land surface emissivity.
Developments in this area will likely lead to major im-
provements in land retrievals from TMI and other passive
microwave sensors.
As a result of the reduction in the ‘‘wet’’ bias in TMI,
the RR distribution in TMI v7 is significantly closer to
FIG. 8. Seasonal (3 month) averages of the TMI–PR RR bias
over the continental United States. The seasonal dependence of
the TMI RR biases is essentially unchanged from v6 to v7. How-
ever, the overestimation of rainfall in summer is reduced in v7.
FIG. 9. Comparisons of TMI v6, TMI v7, and PR: (a) cumulative distribution function,
(b) probability density function, and (c) probability densities at low RR. TMI v7 matches the
PR distribution much better than TMI v6, especially at low RR.
AUGUST 2010 G O P A L A N E T A L . 1351
the PR RR distribution than the previous 2A12, land
algorithm, as is shown in Fig. 9. In addition, the non-
physical variability in the TMI v6 probability distribution
function caused by sampling problems in the Bayesian
retrieval that have been eliminated in v7 (see Fig. 9b).
The estimates at the low rain rates, which are grossly
underestimated by TMI v6, are improved in the new al-
gorithm (see Fig. 9c).
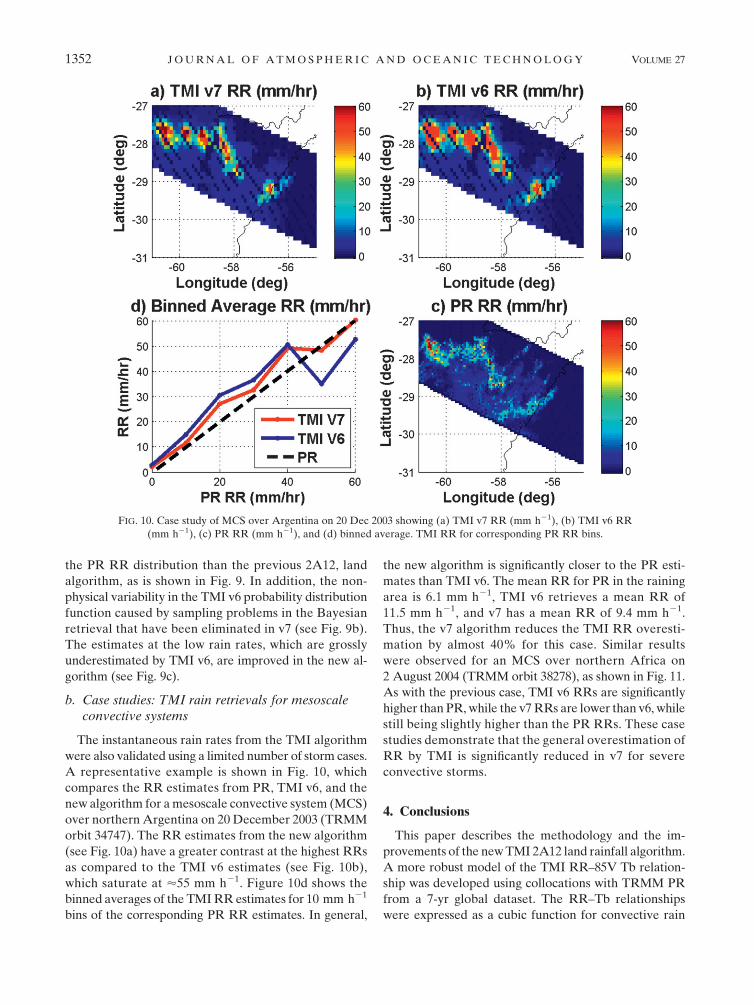
b. Case studies: TMI rain retrievals for mesoscaleconvective systems
The instantaneous rain rates from the TMI algorithm
were also validated using a limited number of storm cases.
A representative example is shown in Fig. 10, which
compares the RR estimates from PR, TMI v6, and the
new algorithm for a mesoscale convective system (MCS)
over northern Argentina on 20 December 2003 (TRMM
orbit 34747). The RR estimates from the new algorithm
(see Fig. 10a) have a greater contrast at the highest RRs
as compared to the TMI v6 estimates (see Fig. 10b),
which saturate at ’55 mm h21. Figure 10d shows the
binned averages of the TMI RR estimates for 10 mm h21
bins of the corresponding PR RR estimates. In general,
the new algorithm is significantly closer to the PR esti-
mates than TMI v6. The mean RR for PR in the raining
area is 6.1 mm h21, TMI v6 retrieves a mean RR of
11.5 mm h21, and v7 has a mean RR of 9.4 mm h21.
Thus, the v7 algorithm reduces the TMI RR overesti-
mation by almost 40% for this case. Similar results
were observed for an MCS over northern Africa on
2 August 2004 (TRMM orbit 38278), as shown in Fig. 11.
As with the previous case, TMI v6 RRs are significantly
higher than PR, while the v7 RRs are lower than v6, while
still being slightly higher than the PR RRs. These case
studies demonstrate that the general overestimation of
RR by TMI is significantly reduced in v7 for severe
convective storms.
4. Conclusions
This paper describes the methodology and the im-
provements of the new TMI 2A12 land rainfall algorithm.
A more robust model of the TMI RR–85V Tb relation-
ship was developed using collocations with TRMM PR
from a 7-yr global dataset. The RR–Tb relationships
were expressed as a cubic function for convective rain
FIG. 10. Case study of MCS over Argentina on 20 Dec 2003 showing (a) TMI v7 RR (mm h21), (b) TMI v6 RR
(mm h21), (c) PR RR (mm h21), and (d) binned average. TMI RR for corresponding PR RR bins.
1352 J O U R N A L O F A T M O S P H E R I C A N D O C E A N I C T E C H N O L O G Y VOLUME 27

and a linear function for stratiform rain. Furthermore,
the TMI v6 convective fraction estimate was also mod-
ified in order to align its distribution more closely with
the distribution of the PR convective fraction estimates,
which are more reliable. The proposed algorithm results
in a drastic reduction in the TMI–PR global mean RR
bias. The overestimation of rainfall over central Africa
and South America by TMI over PR is also significantly
reduced in the new algorithm. The proposed algorithm
was also validated using a number of cases, highlighted
by observations from a MCS over Argentina, and was
found to be closer to the PR RR estimates than TMI v6.
Similar results were also observed from an MCS over
northern Africa. Additional validation efforts are cur-
rently ongoing to validate the performance of the pro-
posed algorithm over different regions and for selected
storm cases. The proposed algorithm does not reduce
the regional and seasonal dependence of RR biases in
TMI estimates, because these dependencies are primarily
driven by surface screening, emissivity, warm rainfall, and
deep convection. To resolve these issues, we anticipate
a thorough review of the TMI land rain detection and
screening algorithm. Separate treatments on the deep
convection and warm rain cases may be necessary. The
collocation technique used to match up TMI and PR
pixels will be improved, so that it accounts for the dif-
ference in view geometry between TMI and PR, espe-
cially for deep convective rainfall. It is also likely that
the inclusion of additional rain predictors in addition to
the ice scattering signal will be needed. Such an exercise
is beyond the scope of this work, and will be undertaken
in the near future.
Acknowledgments. The authors would like to ac-
knowledge Professor Ed Zipser at the University of Utah
for the use of the precipitation feature data base and the
reviewers for making important criticisms and sugges-
tions We are also grateful for the support from NASA
(R. Kakar) and NOAA (C. Miller and J. Pereira). This
work was partially supported through a grant between
NOAA and the University of Maryland/Cooperative
Institute for Climate Studies.
REFERENCES
Awaka, J., T. Iguchi, and K. Okamoto, 1998: Early results on rain
type classification by the Tropical Rainfall Measuring Mission
FIG. 11. Case study of MCS over northern Africa on 2 Aug 2004 showing (a) TMI v7 RR (mm h21), (b) TMI v6 RR
(mm h21), (c) PR RR (mm h21), and (d) binned average. TMI RR for corresponding PR RR bins.
AUGUST 2010 G O P A L A N E T A L . 1353
(TRMM) precipitation radar. Proc. Eighth URSI Commission
F Open Symp., Aveiro, Portugal, URSI, 143–146.
Dinku, T., and E. Anagnostou, 2005: Regional differences in over-
land rainfall estimation from PR-calibrated TMI algorithm.
J. Appl. Meteor., 44, 189–205.
Ferraro, R., and G. Marks, 1995: The development of SSM/I rain-
rate retrieval algorithms using ground-based radar measure-
ments. J. Atmos. Oceanic Technol., 12, 755–770.
Grecu, M., and E. Anagnostou, 2001: Overland precipitation esti-
mation from TRMM passive microwave observations. J. Appl.
Meteor., 40, 1367–1380.
Grody, N., 1991: Classification of snow cover and precipitation
using the Special Sensor Microwave Imager. J. Geophys. Res.,
96, 7423–7435.
Iguchi, T., T. Kozu, R. Meneghini, J. Awaka, and K. Okamoto,
2000: Rain-profiling algorithm for the TRMM Precipitation
Radar. J. Appl. Meteor., 39, 2038–2052.
Kummerow, C., and Coauthors, 2001: The evolution of the God-
dard Profiling Algorithm (GPROF) for rainfall estimation
from passive microwave sensors. J. Appl. Meteor., 40, 1801–
1820.
Liu, C., and E. Zipser, 2009: ‘‘Warm rain’’ in the tropics: Seasonal
and regional distributions based on 9 yr of TRMM data.
J. Climate, 22, 767–779.
——, ——, D. Cecil, S. Nesbitt, and S. Sherwood, 2008: A cloud and
precipitation feature database from nine years of TRMM
observations. J. Appl. Meteor. Climatol., 47, 2712–2728.
McCollum, J., and R. Ferraro, 2003: Next generation of NOAA/
NESDIS TMI, SSM/I, and AMSR-E microwave land rain-
fall algorithms. J. Geophys. Res., 108, 8382, doi:10.1029/
2001JD001512.
Olson, W. S., Y. Hong, C. D. Kummerow, and J. Turk, 2001: A texture-
polarization method for estimating convective–stratiform pre-
cipitation area coverage from passive microwave radiometer
data. J. Appl. Meteor., 40, 1577–1591.
Prabhakara, C., R. Icovazzi Jr., J. A. Weinman, and G. Dalu, 2000:
A TRMM microwave radiometer rain rate estimation method
with convective and stratiform discrimination. J. Meteor. Soc.
Japan, 78, 241–258.
Schneider, U., T. Fuchs, A. Meyer-Christoffer, and B. Rudolf, 2008:
Global Precipitation Analysis Products of the GPCC. Global
Precipitation Climatology Centre, DWD, 12 pp. [Available
online at ftp://ftp-anon.dwd.de/pub/data/gpcc/PDF/GPCC_intro_
products_2008.pdf.]
Wang, N.-Y., C. Liu, R. Ferraro, D. Wolff, E. Zipser, and
C. Kummerow, 2009: TRMM 2A12 land precipitation
product—Status and future plans. J. Meteor. Soc. Japan, 87A,237–253.
1354 J O U R N A L O F A T M O S P H E R I C A N D O C E A N I C T E C H N O L O G Y VOLUME 27