status of surface water quality - alberta...south saskatchewan region status of surface water...
TRANSCRIPT
South Saskatchewan Region Status of Surface Water Quality
April 2016 – March 2017 Reporting on the Surface Water Quality Management Framework Alberta Environment and Parks Environmental Monitoring and Science Division Jason Kerr, PhD; Natalie Kromrey, MSc; and Soroush Abbasi, MSc ISBN 978-1-4601-3583-9
Environmental Monitoring and Science Division
Status of Ambient Environmental condition Page 2 of 40 Ambient Water Quality Management Framework South Saskatchewan Region
Status of Surface Water Quality, South Saskatchewan Region, Alberta for April 2016 – March 2017
Statistical analysis provided by Natalie Kromrey and Soroush Abbasi Technical writing provided by Jason Kerr This publication is part of the Status of Ambient Environmental Condition series. Any comments, questions, or suggestions regarding the content of this document may be directed to: Environmental Monitoring and Science Division Alberta Environment and Parks 10th Floor, 9888 Jasper Avenue NW Edmonton, Alberta T5J 5C6 Tel: 780-229-7200 Toll Free: 1-844-323-6372 Fax: 780-702-0169 Email: [email protected] Media Inquiries: [email protected] Website: http://environmentalmonitoring.alberta.ca/ Recommended citation: Kerr, J., Kromrey, N., and Abbasi, S. 2018. Status of Surface Water Quality, South Saskatchewan Region, Alberta for April 2016 – March 2017. Government of Alberta, Environment and Parks., ISBN 978-1-4601-3583-9. Available at: https://open.alberta.ca/publications/9781460135839. This publication is issued under the Open Government Licence – Alberta (http://open.alberta.ca/licence) This publication can be found at: https://open.alberta.ca/publications/9781460135839. © Her Majesty the Queen in Right of Alberta, as represented by the Minister of Alberta Environment and Parks, 2018. April 2018 ISBN 978-1-4601-3583-9

Environmental Monitoring and Science Division
Status of Ambient Environmental condition Page 3 of 40 Ambient Water Quality Management Framework South Saskatchewan Region
Table of Contents
About EMSD ................................................................................................................................... 4
Executive Summary ........................................................................................................................ 5
Background ........................................................................................................................ 5
Methodology ...................................................................................................................... 5
2016–2017 (April 1–March 31) Results ................................................................................ 5
South Saskatchewan Regional Plan .............................................................................................. 6
Monitoring Stations ......................................................................................................................... 7
Water Quality Indicators, Triggers and Limits ................................................................................. 8
Water Quality Indicators ....................................................................................................... 8
Water Quality Triggers ......................................................................................................... 8
Water Quality Limits ........................................................................................................... 9
Statistically Significant Exceedances of Water Quality Triggers, 2016–2017 ................................ 10
Exceedances of Water Quality Limits, 2016–2017 ........................................................................ 11
Secondary Indicators, 2016–2017 .............................................................................................. 11
References ................................................................................................................................... 12
Appendix A. Descriptive Statistics for the Nine Long Term River Network Stations ...................... 13

Environmental Monitoring and Science Division
Status of Ambient Environmental condition Page 4 of 40 Ambient Water Quality Management Framework South Saskatchewan Region
About EMSD
The Environmental Monitoring and Science Division (EMSD) is responsible for monitoring,
evaluating and reporting on key air, water, land and biodiversity indicators. The division’s
mandate is to provide open and transparent access to scientific data and information on the
condition of Alberta’s environment, including specific indicators as well as cumulative effects,
both provincially and in specific locations.
EMSD provides provincial environmental monitoring, evaluation and reporting:
• Based on sound science and evidence.
• Presented in a timely, open and transparent manner.
• That respects and incorporates community and Traditional Ecological Knowledge (TEK)
from First Nations and Métis people.
This includes providing the information necessary to understand cumulative effects, and to
inform the public, policy makers, regulators, planners, researchers, communities, and industry.
The role of environmental monitoring and science is to provide proactive, objective reporting of
scientific data and information on the condition of Alberta’s environment, including:
• Baseline environmental monitoring.
• Cumulative effects monitoring.
• Data evaluation and management.
• On-going condition of environment reporting in all regions of Alberta.
• Credible data, evaluation, knowledge and reporting to inform policy and regulatory decision-
making.
Learn more at http://environmentalmonitoring.alberta.ca

Environmental Monitoring and Science Division
Status of Ambient Environmental condition Page 5 of 40 Ambient Water Quality Management Framework South Saskatchewan Region
Executive Summary
Background This report was prepared by the Environmental Monitoring and Science Division (EMSD) to fulfill
reporting requirements mandated by the South Saskatchewan Region Surface Water Quality
Management Framework, which supports the South Saskatchewan Regional Plan (SSRP).
Reporting requirements for the SSRP are determined by the Government of Alberta and EMSD
has a responsibility for monitoring, evaluation and reporting under the Environmental
Management Frameworks, including the Surface Water Quality Management Framework. This
is a report that communicates whether water quality triggers or limits were exceeded in 2016 –
2017.
Methodology All statistical methods used in this report are described in the South Saskatchewan Region
Surface Water Quality Management Framework: Statistical Methods Final Report (2011).
The Surface Water Quality Management Framework includes 15 primary indicators and six
secondary indicators. In 2016–2017 (April 1–March 31), these water quality indicators were
measured monthly at nine water quality monitoring stations. Using methodology described in
the South Saskatchewan Region (SSR) Surface Water Quality Management Framework
(SWQMF), the resulting data for the 15 primary indicators were compared to the historic record
(1999–2009) to determine if median and 90th percentile concentrations deviated in an
undesirable direction from the historic median or peak trigger values. Those values that deviated
from historic triggers in an undesirable direction were statistically assessed for changes in the
central tendency or peak concentration. In addition, the 2016–2017 data were compared to
water quality limits as defined in the SSR SWQMF. 2016–2017 data for each primary indicator
at each station were compared to historic data for both the open water (April–October) and
winter (November-March) seasons. Finally, median values for each of the 6 secondary
indicators, for each season, were calculated and compared to existing Alberta surface water
quality guidelines.
2016–2017 (April 1–March 31) Results A significant exceedance of the following trigger values occurred:
• The peak sulphate trigger at Bow River (Carseland) during the open water and winter seasons
• The median total dissolved solids trigger at Bow River (Cluny) during the open water and winter
seasons
• The peak sulphate trigger at Bow River (Cochrane) during the open water and winter seasons
As defined in the SSR SWQMF, total dissolved solids at Milk River Hwy 880 exceeded water
quality limits during the 2016-17 winter season.

Environmental Monitoring and Science Division
Status of Ambient Environmental condition Page 6 of 40 Ambient Water Quality Management Framework South Saskatchewan Region
South Saskatchewan Regional Plan
The South Saskatchewan Regional Plan (SSRP) applies to the South Saskatchewan Region, an
area approximately 83,764 square kilometres in size located in southern Alberta (see the South
Saskatchewan Regional Plan). The SSRP is a regional plan developed by the Government of
Alberta under the Land Use Framework. The plan sets outcomes that describe what the
Government of Alberta wants to accomplish at a regional level, and is given legislative authority
under the Alberta Land Stewardship Act. EMSD is responsible for monitoring, assessing and
reporting on the condition of the environment in the South Saskatchewan Region, while the
Government of Alberta is responsible for management of activities and resources in response
to environmental conditions.
Figure 1: Land Use Frameworks in Alberta

Environmental Monitoring and Science Division
Status of Ambient Environmental condition Page 7 of 40 Ambient Water Quality Management Framework South Saskatchewan Region
Monitoring Stations
In this report, water quality in the South Saskatchewan Region is assessed based on data
derived from monthly water quality sampling at nine Long-Term River Network (LTRN) stations
within the South Saskatchewan Region (Fig 2). The nine LTRN stations are located within four
major river systems:
• The Bow River – Bow River at Cochrane, Bow River at Carseland, Bow River at Cluny and
Bow River at Ronalane
• The Milk River – Milk River at Hwy 880
• The Oldman River – Oldman River at Brocket, Old Man River at Hwy 3 in Lethbridge and
Oldman River at Hwy 36
• The South Saskatchewan River – South Saskatchewan River at Medicine Hat-Hwy 1
Additional details on the four major river basins and the nine LTRN stations are given in the
South Saskatchewan Region: Surface Water Quality Management Framework (SSR SWQMF).
Figure 2: Location of water quality stations in the South Saskatchewan Region

Environmental Monitoring and Science Division
Status of Ambient Environmental condition Page 8 of 40 Ambient Water Quality Management Framework South Saskatchewan Region
Water Quality Indicators, Triggers
and Limits
Water Quality Indicators Twenty-one water quality parameters measured at the LTRN stations are indicators in the SSR
SWQMF. Fifteen primary indicators (Table 1) and six secondary indicators (Table 2) were used to
assess 2016–2017 water quality at the nine LTRN stations. Justification for indicator selection is
given in the SSR SWQMF.
Table 1: List of primary indicators for the SSR: SWQMF
Total Ammonia Specific Conductance
Chloride Total Dissolved Solids
Nitrate Total Organic Carbon
Total Nitrogen Total Suspended Solids
Total Dissolved Phosphorus Turbidity
Total Phosphorus pH
Sulphate Escherichia coli
Sodium Adsorption Ratio (SAR)
Table 2: List of secondary indicators for the SSRP: SWQMF
Mercury Dicamba
Selenium Methylchlorophenoxyacetic acid (MCPA)
2,4-Dichlorophenoxyacetic acid (2,4-D) Mecoprop (MCPP)
Water Quality Triggers Median and 90th percentile values from the historic record (1999–20091) are the “median
triggers” and “peak triggers” in the SSR SWQMF. Exceedances of peak triggers reflect changes
in the frequency of observed extreme values in relation to historic data while exceedances in
median triggers are used to identify shifts in the central tendency of annual data relative to the
historic record. Both are intended to act as early warning systems of potential changes in surface
water quality and a signal to do statistical assessments. In this report, seasonal 2016–2017
medians and 90th percentiles were first compared with historic trigger values to determine if
they deviated from the triggers in an undesirable direction. If an indicator deviated from its trigger
value in an undesirable direction, a statistical assessment was then performed. A median trigger
exceedance was defined as a significant shift in the central tendency (mean or median) of the 2016-
17 data relative to the historic record. A peak trigger exceedance was reported when the frequency
of observations in the 2016-17 data which exceeded the trigger value was higher than the expected
frequency given no significant change.
1 The historic data set for some indicators were based on shorter time series. See the SSR SWQMF for a description of the specific time
period used for each indicator at each station

Environmental Monitoring and Science Division
Status of Ambient Environmental condition Page 9 of 40 Ambient Water Quality Management Framework South Saskatchewan Region
All statistical methods used in this report are described in the South Saskatchewan Region
Surface Water Quality Management Framework: Statistical Methods Final Report (2011).
Statistical assessments were performed using custom statistical software developed by
GranDuke Geomatics2 following the sequence of steps outlined in Figures 6 and 7 of the South
Saskatchewan Region Surface Water Quality Management Framework: Statistical Methods Final
Report (2011).
Water Quality Limits Surface water quality limits were derived from the Canadian Council of Minister’s for the
Environment (CCME) and provincial water quality guidelines, for 9 of the 15 primary water quality
indicators. Details of the specific water quality limits used for each indicator are given in the SSR
SWQMF.
2 Now FarmersEdge (http://www.farmersedge.ca/)

Environmental Monitoring and Science Division
Status of Ambient Environmental condition Page 10 of 40 Ambient Water Quality Management Framework South Saskatchewan Region
Statistically Significant
Exceedances of Water Quality
Triggers, 2016–2017
Table 3 compares median and 90th percentile values from the 2016-17 data with the historical
record (1999-2009) at stations where significant median or peak trigger exceedances occurred.
Trigger exceedances during 2016–2017 were observed at three stations for two primary
indicators. A significant exceedance of the median trigger value was observed for total dissolved
solids at Bow River (Cluny) during both the open and winter seasons. Significant exceedances
of peak trigger values were observed for sulphate at the Bow River (Carseland) and Bow River
(Cochrane) stations during both the open water and winter seasons. There were no
exceedances for any of the other stations or indicators. Summary statistics of 2016–2017 data
for the remaining stations and indicators are shown in Appendix A.
Table 3: Median and 90th percentile values for primary indicators exhibiting a statistically
significant trigger exceedance (shaded in blue) in the South Saskatchewan Region during
2016–2017
STATION INDICATOR PERIOD SEASON MEDIAN 90TH
PERCENTILE n
Bow River (Carseland)
Sulphate (mg/L)
1999-2009 (trigger)
open 42.9 51.5 70
winter 53.9 58.0 50
2016-17 open 55.0 60.0 7
winter 66.0 73.0 5
Bow River (Cluny)
Total Dissolved Solids (mg/L)
1999-2009 (trigger)
open 211 245 48
winter 257 290 32
2016-17 open 220 234 7
winter 300 312 5
Bow River (Cochrane)
Sulphate (mg/L)
1999-2009 (trigger)
open 33.6 40.4 70
winter 42.2 45.8 50
2016-17 open 38.0 45.0 7
winter 49.0 51.2 5

Environmental Monitoring and Science Division
Status of Ambient Environmental condition Page 11 of 40 Ambient Water Quality Management Framework South Saskatchewan Region
Exceedances of Water Quality
Limits, 2016–2017
Median values for 9 of the 15 primary indicators were compared to surface water quality limits
described in the SSR SWQMF. Median total dissolved solids concentration at Milk River Hwy
880 exceeded the water quality limit during the winter season. There were no other exceedances
of surface water quality limits as defined in the SSR SWQMF.
Secondary Indicators, 2016–2017
The median seasonal concentrations of secondary indicators at each site were compared to chronic
guidelines where available. Median concentrations did not exceed chronic guideline values at any of
the sites. Summary statistics for all secondary indicators are provided in Appendix A. Note that
summary statistics shown for secondary indicators are for information purposes only as there are no
triggers or limits assigned to these indicators.

Environmental Monitoring and Science Division
Status of Ambient Environmental condition Page 12 of 40 Ambient Water Quality Management Framework South Saskatchewan Region
References
Alberta Environment and Sustainable Resource Development. (2014). South Saskatchewan
Region, Surface Water Quality Management Framework.
https://open.alberta.ca/publications/9781460118603.
Alberta Environment and Sustainable Resource Development. (2014). South Saskatchewan
Regional Plan.
https://landuse.alberta.ca/LandUse%20Documents/South%20Saskatchewan%20Regional%20Plan
%202014-2024%20-%20February%202017.pdf.
HDR Corporation. (2011). South Saskatchewan Regional Plan Surface Water Quality
Management Framework: Statistical Methods Final Report. Prepared for Alberta Environment
https://open.alberta.ca/publications/9781460125397.

Environmental Monitoring and Science Division
Status of Ambient Environmental condition Page 13 of 40 Ambient Water Quality Management Framework South Saskatchewan Region
Appendix A. Descriptive Statistics
for the Nine Long Term River
Network Stations

Environmental Monitoring and Science Division
Status of Ambient Environmental condition Page 14 of 40 Ambient Water Quality Management Framework South Saskatchewan Region
Table A1: Median and 90th percentile values for primary indicators in the Oldman River (Brocket)
INDICATOR TIME
PERIOD SEASON MEDIAN 90TH
PERCENTILE n
Total Ammonia (mg/L) 1999-2009 open 0.010 0.060 91
winter 0.010 0.039 52
2016-17 open 0.025 0.025 7
winter 0.025 0.025 5
Chloride (mg/L) 1999-2009 open 0.9 1.8 70
winter 1.2 1.9 50
2016-17 open 1.3 1.6 7
winter 1.8 2.0 5
Nitrate (mg/L) 1999-2009 open 0.078 0.128 91
winter 0.092 0.132 52
2016-17 open 0.052 0.079 7
winter 0.1 0.134 5
Total Nitrogen (mg/L) 1999-2009 open 0.23 0.35 70
winter 0.19 0.32 50
2016-17 open 0.16 0.302 7
winter 0.14 0.384 5
Total Dissolved Phosphorus (mg/L)
1999-2009 open 0.003 0.006 91
winter 0.003 0.005 52
2016-17 open 0.007 0.008 7
winter 0.002 0.003 5
Total Phosphorus (mg/L) 1999-2009 open 0.007 0.018 91
winter 0.005 0.010 52
2016-17 open 0.005 0.006 7
winter 0.005 0.006 5
Sulphate (mg/L) 1999-2009 open 22.1 29.4 70
winter 29.6 36.0 50
2016-17 open 25.0 30.0 7
winter 34.0 36.8 5
Sodium Adsorption Ratio 1999-2009 open 0.16 0.22 70
winter 0.18 0.20 50
2016-17 open 0.18 0.23 7
winter 0.16 0.18 5

Environmental Monitoring and Science Division
Status of Ambient Environmental condition Page 15 of 40 Ambient Water Quality Management Framework South Saskatchewan Region
Table A1: Median and 90th percentile values for primary indicators in the Oldman River
(Brocket) (continued)
INDICATOR TIME PERIOD SEASON MEDIAN 90TH
PERCENTILE n
Specific Conductance (µS/cm)
1999-2009 open 276 313 91
winter 308 342 52
2016-17 open 280 334 7
winter 350 350 5
Total Dissolved Solids (mg/L)
1999-2009 open 156 181 70
winter 179 202 50
2016-17 open 160 188 7
winter 180 190 5
Total Organic Carbon (mg/L)
1999-2009 open 2.0 3.7 70
winter 1.6 2.2 50
2016-17 open 1.4 1.6 7
winter 1.4 2.0 5
Total Suspended Solids (mg/L)
1999-2009 open 3 10 84
winter 1 6 47
2016-17 open 1 2 7
winter 1 1 5
Turbidity (NTU)
1999-2009 open 4.5 18.8 91
winter 2.3 8.5 52
2016-17 open 1.7 2.7 7
winter 1.6 2.8 5
pH
1999-2009 open 8.26 8.35 91
winter 8.26 8.34 52
2016-17 open 8.28 8.43 7
winter 8.33 8.34 5
Escherichia coli (cfu/100ml)
1999-2009 open 3 14 70
winter 2 27 49
2016-17 open 3 8 7
winter 27 83 5

Environmental Monitoring and Science Division
Status of Ambient Environmental condition Page 16 of 40 Ambient Water Quality Management Framework South Saskatchewan Region
Table A2: Median and 90th percentile values for secondary indicators in the Oldman River
(Brocket)
INDICATOR TIME PERIOD SEASON MEDIAN 90TH
PERCENTILE n
2,4-D (µg/L)
1999-2009 open 0.0025 0.0032 39
winter 0.0025 0.0025 4
2016-17 open 0.0025 0.0106 4
winter
Dicamba (µg/L)
1999-2009 open 0.0025 0.0068 39
winter 0.0025 0.0025 4
2016-17 open 0.0025 0.0025 4
winter
MCPA (µg/L)
1999-2009 open 0.0025 0.0025 39
winter 0.0025 0.0025 4
2016-17 open 0.0025 0.0099 4
winter
Mecoprop (µg/L)
1999-2009 open 0.0025 0.0025 39
winter 0.0025 0.0025 4
2016-17 open 0.0025 0.0025 4
winter
Total Mercury (ng/L)
1999-2009 open 0.30 1.40 18
winter 0.33 0.62 8
2016-17 open 0.62 0.82 7
winter 0.49 0.62 5
Total Recoverable Selenium (µg/L)
1999-2009 open 0.52 0.76 14
winter 0.73 0.85 7
2016-17 open 0.38 0.52 7
winter 0.66 0.75 5

Environmental Monitoring and Science Division
Status of Ambient Environmental condition Page 17 of 40 Ambient Water Quality Management Framework South Saskatchewan Region
Table A3: Median and 90th percentile values for primary indicators in the Oldman River
(Hwy 3 in Lethbridge)
INDICATOR TIME PERIOD SEASON MEDIAN 90TH
PERCENTILE n
Total Ammonia (mg/L)
1999-2009 open 0.020 0.070 94
winter 0.020 0.059 52
2016-17 open 0.025 0.025 7
winter 0.053 0.123 5
Chloride (mg/L)
1999-2009 open 1.5 3.2 70
winter 2.1 3.0 50
2016-17 open 2.1 2.7 7
winter 2.9 8.9 5
Nitrate (mg/L)
1999-2009 open 0.023 0.138 94
winter 0.219 0.348 52
2016-17 open 0.027 0.050 7
winter 0.240 0.266 5
Total Nitrogen (mg/L)
1999-2009 open 0.25 0.64 72
winter 0.40 0.59 50
2016-17 open 0.21 0.44 7
winter 0.36 1.08 5
Total Dissolved Phosphorus (mg/L)
1999-2009 open 0.003 0.009 93
winter 0.003 0.006 52
2016-17 open 0.007 0.008 7
winter 0.004 0.093 5
Total Phosphorus (mg/L)
1999-2009 open 0.012 0.151 94
winter 0.008 0.022 52
2016-17 open 0.010 0.024 7
winter 0.022 0.141 5
Sulphate (mg/L)
1999-2009 open 35.8 52.1 70
winter 45.0 58.0 50
2016-17 open 42.0 49.6 7
winter 46.0 56.0 5
Sodium Adsorption Ratio
1999-2009 open 0.42 0.59 70
winter 0.46 0.60 50
2016-17 open 0.48 0.60 7
winter 0.43 0.61 5

Environmental Monitoring and Science Division
Status of Ambient Environmental condition Page 18 of 40 Ambient Water Quality Management Framework South Saskatchewan Region
Table A3: Median and 90th percentile values for primary indicators in the Oldman River
(Hwy 3 in Lethbridge) (continued)
INDICATOR TIME PERIOD SEASON MEDIAN 90TH
PERCENTILE n
Specific Conductance (µS/cm)
1999-2009 open 323 397 91
winter 358 437 52
2016-17 open 330 384 7
winter 370 404 5
Total Dissolved Solids (mg/L)
1999-2009 open 182 224 69
winter 217 256 50
2016-17 open 190 208 7
winter 200 232 5
Total Organic Carbon (mg/L)
1999-2009 open 2.4 3.9 70
winter 1.7 2.5 50
2016-17 open 1.6 2.2 7
winter 1.2 2.9 5
Total Suspended Solids (mg/L)
1999-2009 open 9 189 93
winter 7 34 52
2016-17 open 11 26 7
winter 59 112 5
Turbidity (NTU)
1999-2009 open 10.0 153.0 91
winter 6.3 27.5 52
2016-17 open 8.7 14.0 7
winter 30.0 59.6 5
pH
1999-2009 open 8.34 8.57 91
winter 8.20 8.28 52
2016-17 open 8.40 8.43 7
winter 8.18 8.20 5
Escherichia coli (cfu/100ml)
1999-2009 open 13 71 72
winter 2 13 48
2016-17 open 37 64 7
winter 12 126 5
Environmental Monitoring and Science Division
Status of Ambient Environmental condition Page 19 of 40 Ambient Water Quality Management Framework South Saskatchewan Region
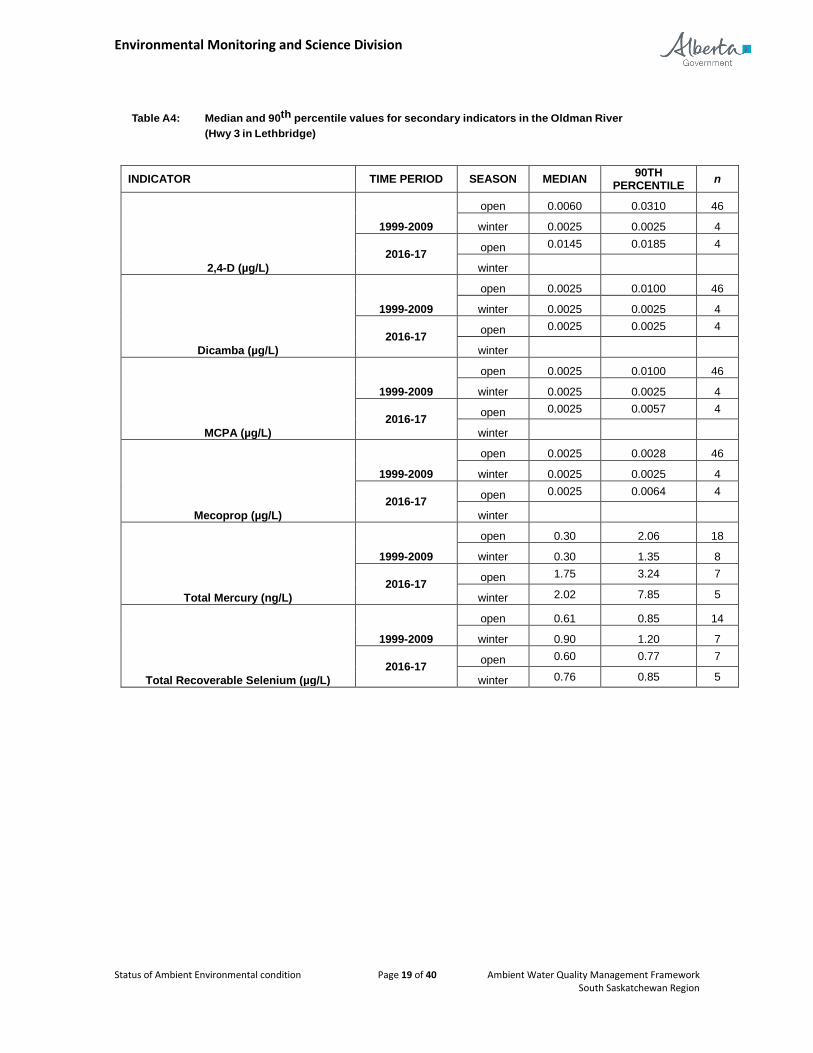
Table A4: Median and 90th percentile values for secondary indicators in the Oldman River
(Hwy 3 in Lethbridge)
INDICATOR TIME PERIOD SEASON MEDIAN 90TH
PERCENTILE n
2,4-D (µg/L)
1999-2009
open 0.0060 0.0310 46
winter 0.0025 0.0025 4
2016-17 open 0.0145 0.0185 4
winter
Dicamba (µg/L)
1999-2009
open 0.0025 0.0100 46
winter 0.0025 0.0025 4
2016-17 open 0.0025 0.0025 4
winter
MCPA (µg/L)
1999-2009
open 0.0025 0.0100 46
winter 0.0025 0.0025 4
2016-17 open 0.0025 0.0057 4
winter
Mecoprop (µg/L)
1999-2009
open 0.0025 0.0028 46
winter 0.0025 0.0025 4
2016-17 open 0.0025 0.0064 4
winter
Total Mercury (ng/L)
1999-2009
open 0.30 2.06 18
winter 0.30 1.35 8
2016-17 open 1.75 3.24 7
winter 2.02 7.85 5
Total Recoverable Selenium (µg/L)
1999-2009
open 0.61 0.85 14
winter 0.90 1.20 7
2016-17 open 0.60 0.77 7
winter 0.76 0.85 5

Environmental Monitoring and Science Division
Status of Ambient Environmental condition Page 20 of 40 Ambient Water Quality Management Framework South Saskatchewan Region
Table A5: Median and 90th percentile values for primary indicators in the Oldman River (Hwy 36)
INDICATOR TIME PERIOD SEASON MEDIAN 90TH
PERCENTILE n
Total Ammonia (mg/L)
1999-2009 open 0.020 0.110 91
winter 0.030 0.134 57
2016-17 open 0.025 0.025 7
winter 0.063 0.111 5
Chloride (mg/L)
1999-2009 open 4.0 6.1 70
winter 6.0 8.1 50
2016-17 open 3.6 5.8 7
winter 4.7 8.4 5
Nitrate (mg/L)
1999-2009 open 0.006 0.140 91
winter 0.317 0.495 57
2016-17 open 0.036 0.066 7
winter 0.290 0.384 5
Total Nitrogen (mg/L)
1999-2009 open 0.31 0.75 70
winter 0.59 0.96 55
2016-17 open 0.27 0.35 7
winter 0.60 0.69 5
Total Dissolved Phosphorus (mg/L)
1999-2009 open 0.003 0.010 91
winter 0.003 0.007 57
2016-17 open 0.008 0.009 7
winter 0.004 0.008 5
Total Phosphorus (mg/L)
1999-2009 open 0.015 0.173 91
winter 0.009 0.019 57
2016-17 open 0.019 0.029 7
winter 0.015 0.027 5
Sulphate (mg/L)
1999-2009 open 44.8 61.4 70
winter 58.1 77.4 50
2016-17 open 51.0 70.4 7
winter 48.0 64.0 5
Sodium Adsorption Ratio
1999-2009 open 0.56 0.78 70
winter 0.65 0.80 50
2016-17 open 0.54 0.74 7
winter 0.54 0.65 5

Environmental Monitoring and Science Division
Status of Ambient Environmental condition Page 21 of 40 Ambient Water Quality Management Framework South Saskatchewan Region
Table A5: Median and 90th percentile values for primary indicators in the Oldman River
(Hwy 36) (continued)
INDICATOR TIME PERIOD SEASON MEDIAN 90TH
PERCENTILE n
Specific Conductance (µS/cm)
1999-2009 open 357 425 91
winter 414 502 52
2016-17 open 350 420 7
winter 390 446 5
Total Dissolved Solids (mg/L)
1999-2009 open 200 243 70
winter 246 296 50
2016-17 open 210 240 7
winter 230 246 5
Total Organic Carbon (mg/L)
1999-2009 open 2.9 4.4 70
winter 2.2 3.0 55
2016-17 open 2.1 2.6 7
winter 1.6 1.7 5
Total Suspended Solids (mg/L)
1999-2009 open 11 200 90
winter 3 17 57
2016-17 open 21 23 7
winter 9 67 5
Turbidity (NTU)
1999-2009 open 9.9 180.0 91
winter 4.9 19.9 52
2016-17 open 11.0 15.0 7
winter 8.6 28.4 5
pH
1999-2009 open 8.37 8.52 91
winter 8.21 8.33 57
2016-17 open 8.41 8.50 7
winter 8.21 8.28 5
Escherichia coli (cfu/100ml)
1999-2009 open 14 151 70
winter 3 17 53
2016-17 open 12 50 7
winter 7 43 5

Environmental Monitoring and Science Division
Status of Ambient Environmental condition Page 22 of 40 Ambient Water Quality Management Framework South Saskatchewan Region
Table A6: Median and 90th percentile values for secondary indicators in the Oldman River
(Hwy 36)
INDICATOR TIME PERIOD SEASON MEDIAN 90TH
PERCENTILE n
2,4-D (µg/L)
1999-2009 open 0.0135 0.0802 44
winter 0.0025 0.0025 4
2016-17
open 0.0655 0.0858 4
winter
Dicamba (µg/L)
1999-2009 open 0.0025 0.0117 44
winter 0.0025 0.0025 4
2016-17
open 0.0025 0.0025 4
winter
MCPA (µg/L)
1999-2009 open 0.0025 0.0184 44
winter 0.0025 0.0025 4
2016-17
open 0.0095 0.0155 4
winter
Mecoprop (µg/L)
1999-2009 open 0.0025 0.0070 44
winter 0.0025 0.0025 4
2016-17
open 0.0065 0.0238 4
winter
Total Mercury (ng/L)
1999-2009 open 0.43 2.37 18
winter 0.80 1.73 8
2016-17
open 1.40 2.01 7
winter 1.03 2.56 5
Total Recoverable Selenium (µg/L)
1999-2009
open 0.59 1.00 14
winter 1.12 1.25 7
2016-17
open 0.54 0.84 7
winter 0.64 1.00 5

Environmental Monitoring and Science Division
Status of Ambient Environmental condition Page 23 of 40 Ambient Water Quality Management Framework South Saskatchewan Region
Table A7: Median and 90th percentile values for primary indicators in the South Saskatchewan
River (Medicine Hat-Hwy 1)
INDICATOR TIME PERIOD SEASON MEDIAN 90TH
PERCENTILE n
Total Ammonia (mg/L)
1999-2009 open 0.020 0.060 70
winter 0.090 0.253 48
2016-17 open 0.025 0.056 7
winter 0.025 0.220 5
Chloride (mg/L)
1999-2009 open 6.4 9.8 70
winter 12.6 19.9 48
2016-17 open 10.0 12.0 7
winter 13.0 18.2 5
Nitrate (mg/L)
1999-2009 open 0.103 0.497 69
winter 1.015 1.258 48
2016-17 open 0.120 0.524 7
winter 0.890 1.260 5
Total Nitrogen (mg/L)
1999-2009 open 0.55 1.01 70
winter 1.33 1.72 48
2016-17 open 0.49 0.82 7
winter 1.40 2.10 5
Total Dissolved Phosphorus (mg/L)
1999-2009 open 0.004 0.009 70
winter 0.004 0.010 48
2016-17 open 0.009 0.010 7
winter 0.005 0.024 5
Total Phosphorus (mg/L)
1999-2009 open 0.023 0.098 70
winter 0.011 0.042 48
2016-17 open 0.016 0.026 7
winter 0.014 0.228 5
Sulphate (mg/L)
1999-2009 open 56.5 76.9 70
winter 62.4 77.6 48
2016-17 open 67.0 83.0 7
winter 66.0 86.2 5
Sodium Adsorption Ratio
1999-2009 open 0.60 0.79 70
winter 0.59 0.88 48
2016-17 open 0.63 0.80 7
winter 0.61 0.76 5
Environmental Monitoring and Science Division
Status of Ambient Environmental condition Page 24 of 40 Ambient Water Quality Management Framework South Saskatchewan Region
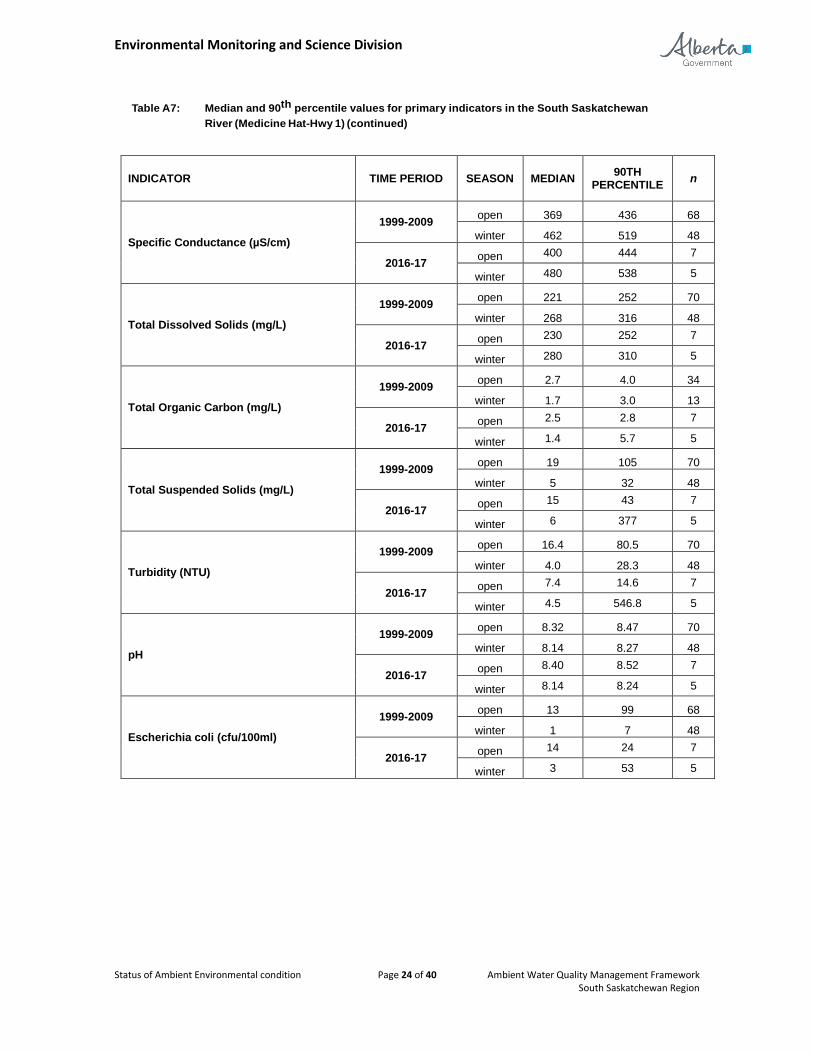
Table A7: Median and 90th percentile values for primary indicators in the South Saskatchewan
River (Medicine Hat-Hwy 1) (continued)
INDICATOR TIME PERIOD SEASON MEDIAN 90TH
PERCENTILE n
Specific Conductance (µS/cm)
1999-2009 open 369 436 68
winter 462 519 48
2016-17 open 400 444 7
winter 480 538 5
Total Dissolved Solids (mg/L)
1999-2009 open 221 252 70
winter 268 316 48
2016-17 open 230 252 7
winter 280 310 5
Total Organic Carbon (mg/L)
1999-2009 open 2.7 4.0 34
winter 1.7 3.0 13
2016-17 open 2.5 2.8 7
winter 1.4 5.7 5
Total Suspended Solids (mg/L)
1999-2009 open 19 105 70
winter 5 32 48
2016-17 open 15 43 7
winter 6 377 5
Turbidity (NTU)
1999-2009 open 16.4 80.5 70
winter 4.0 28.3 48
2016-17 open 7.4 14.6 7
winter 4.5 546.8 5
pH
1999-2009 open 8.32 8.47 70
winter 8.14 8.27 48
2016-17 open 8.40 8.52 7
winter 8.14 8.24 5
Escherichia coli (cfu/100ml)
1999-2009 open 13 99 68
winter 1 7 48
2016-17 open 14 24 7
winter 3 53 5

Environmental Monitoring and Science Division
Status of Ambient Environmental condition Page 25 of 40 Ambient Water Quality Management Framework South Saskatchewan Region
Table A8: Median and 90th percentile values for secondary indicators in the South Saskatchewan
River (Medicine Hat-Hwy 1)
INDICATOR TIME PERIOD SEASON MEDIAN 90TH
PERCENTILE n
2,4-D (µg/L)
1999-2009 open 0.0245 0.1049 44
winter 0.0025 0.0025 3
2016-17 open 0.024 0.0858 4
winter
Dicamba (µg/L)
1999-2009 open 0.0025 0.0170 44
winter 0.0025 0.0025 3
2016-17 open 0.0025 0.0071 4
winter
MCPA (µg/L)
1999-2009 open 0.0025 0.0168 44
winter 0.0025 0.0025 3
2016-17 open 0.0025 0.0025 4
winter
Mecoprop (µg/L)
1999-2009 open 0.0025 0.0132 44
winter 0.0025 0.0025 3
2016-17 open 0.0025 0.0218 4
winter
Total Mercury (ng/L)
1999-2009 open 0.55 2.61 18
winter 0.30 0.41 5
2016-17 open 1.75 3.05 7
winter 0.73 6.28 5
Total Recoverable Selenium (µg/L)
1999-2009 open 0.57 0.85 14
winter 1.00 1.07 4
2016-17 open 0.63 0.71 7
winter 0.78 1.01 5

Environmental Monitoring and Science Division
Status of Ambient Environmental condition Page 26 of 40 Ambient Water Quality Management Framework South Saskatchewan Region
Table A9: Median and 90th percentile values for primary indicators in the Bow River (Cochrane)
INDICATOR TIME PERIOD SEASON MEDIAN 90TH
PERCENTILE n
Total Ammonia (mg/L)
1999-2009 open 0.005 0.041 70
winter 0.008 0.025 50
2016-17 open 0.025 0.025 7
winter 0.025 0.025 5
Chloride (mg/L)
1999-2009 open 1.9 2.9 70
winter 2.0 2.6 50
2016-17 open 2.2 3.0 7
winter 2.3 4.0 5
Nitrate (mg/L)
1999-2009 open 0.074 0.108 69
winter 0.109 0.130 50
2016-17 open 0.092 0.118 7
winter 0.15 0.176 5
Total Nitrogen (mg/L)
1999-2009 open 0.18 0.40 70
winter 0.17 0.23 50
2016-17 open 0.16 0.23 7
winter 0.21 0.24 5
Total Dissolved Phosphorus (mg/L)
1999-2009 open 0.002 0.004 35
winter 0.002 0.004 25
2016-17 open 0.004 0.008 7
winter 0.002 0.006 5
Total Phosphorus (mg/L)
1999-2009 open 0.005 0.009 35
winter 0.003 0.006 25
2016-17 open 0.002 0.006 7
winter 0.002 0.005 5
Sulphate (mg/L)
1999-2009 open 33.6 40.4 70
winter 42.2 45.8 50
2016-17 open 38.0 45.0 7
winter 49.0 51.2 5
Sodium Adsorption Ratio
1999-2009 open 0.07 0.12 70
winter 0.07 0.10 50
2016-17 open 0.06 0.22 7
winter 0.07 0.08 5

Environmental Monitoring and Science Division
Status of Ambient Environmental condition Page 27 of 40 Ambient Water Quality Management Framework South Saskatchewan Region
Table A9: Median and 90th percentile values for primary indicators in the Bow River
(Cochrane) (continued)
INDICATOR TIME PERIOD SEASON MEDIAN 90TH
PERCENTILE n
Specific Conductance (µS/cm)
1999-2009 open 289 317 70
winter 330 349 50
2016-17 open 290 330 7
winter 360 360 5
Total Dissolved Solids (mg/L)
1999-2009 open 165 190 70
winter 190 200 50
2016-17 open 160 180 7
winter 200 200 5
Total Organic Carbon (mg/L)
1999-2009 open 1.0 1.6 34
winter 0.8 0.9 14
2016-17 open 0.8 1.0 7
winter 0.3 0.6 5
Total Suspended Solids (mg/L)
1999-2009 open 2 8 70
winter 1 2 50
2016-17 open 1 4 7
winter 1 1 5
Turbidity (NTU)
1999-2009 open 1.8 10.1 70
winter 0.8 1.7 50
2016-17 open 1.1 3.4 7
winter 0.5 0.7 5
pH
1999-2009 open 8.23 8.38 70
winter 8.17 8.30 50
2016-17 open 8.30 8.35 7
winter 8.21 8.31 5
Escherichia coli (cfu/100ml)
1999-2009 open 2 13 70
winter 1 2 49
2016-17 open 1 5 7
winter 1 360 5

Environmental Monitoring and Science Division
Status of Ambient Environmental condition Page 28 of 40 Ambient Water Quality Management Framework South Saskatchewan Region
Table A10: Median and 90th percentile values for secondary indicators in Bow River (Cochrane)
INDICATOR TIME PERIOD SEASON MEDIAN 90TH
PERCENTILE n
2,4-D (µg/L)
1999-2009 open 0.0025 0.0025 44
winter 0.0025 0.0025 3
2016-17 open 0.0025 0.0176 4
winter
Dicamba (µg/L)
1999-2009 open 0.0025 0.0100 44
winter 0.0025 0.0025 3
2016-17 open 0.0025 0.0025 4
winter
MCPA (µg/L)
1999-2009 open 0.0025 0.0025 44
winter 0.0025 0.0025 3
2016-17 open 0.0025 0.0025 4
winter
Mecoprop (µg/L)
1999-2009 open 0.0025 0.0025 44
winter 0.0025 0.0025 3
2016-17 open 0.0025 0.0078 4
winter
Total Mercury (ng/L)
1999-2009 open 0.30 0.92 22
winter 0.34 0.50 10
2016-17 open 0.40 0.85 7
winter 0.29 0.34 4
Total Recoverable Selenium (µg/L)
1999-2009 open 0.50 0.59 18
winter 0.61 0.80 9
2016-17 open 0.40 0.59 7
winter 0.53 0.61 5

Environmental Monitoring and Science Division
Status of Ambient Environmental condition Page 29 of 40 Ambient Water Quality Management Framework South Saskatchewan Region
Table A11: Median and 90th percentile values for primary indicators in the Bow River (Carseland)
INDICATOR TIME PERIOD SEASON MEDIAN 90TH
PERCENTILE n
Total Ammonia (mg/L)
1999-2009 open 0.045 0.160 70
winter 0.250 0.472 50
2016-17 open 0.025 0.184 7
winter 0.17 0.292 5
Chloride (mg/L)
1999-2009 open 7.6 13.1 70
winter 12.7 20.4 50
2016-17 open 13.0 14.0 7
winter 22.0 23.0 5
Nitrate (mg/L)
1999-2009 open 0.601 0.990 69
winter 1.130 1.403 50
2016-17 open 0.810 1.068 7
winter 1.200 1.520 5
Total Nitrogen (mg/L)
1999-2009 open 1.02 1.72 70
winter 1.68 2.17 50
2016-17 open 1.20 1.30 7
winter 1.70 2.04 5
Total Dissolved Phosphorus (mg/L)
1999-2009 open 0.007 0.016 35
winter 0.017 0.028 25
2016-17 open 0.010 0.016 7
winter 0.016 0.027 5
Total Phosphorus (mg/L)
1999-2009 open 0.021 0.083 35
winter 0.030 0.062 25
2016-17 open 0.015 0.036 7
winter 0.030 0.052 5
Sulphate (mg/L)
1999-2009 open 42.9 51.5 70
winter 53.9 58.0 50
2016-17 open 55.0 60.0 7
winter 66.0 73.0 5
Sodium Adsorption Ratio
1999-2009 open 0.30 0.45 70
winter 0.39 0.58 50
2016-17 open 0.38 0.44 7
winter 0.50 0.54 5
Environmental Monitoring and Science Division
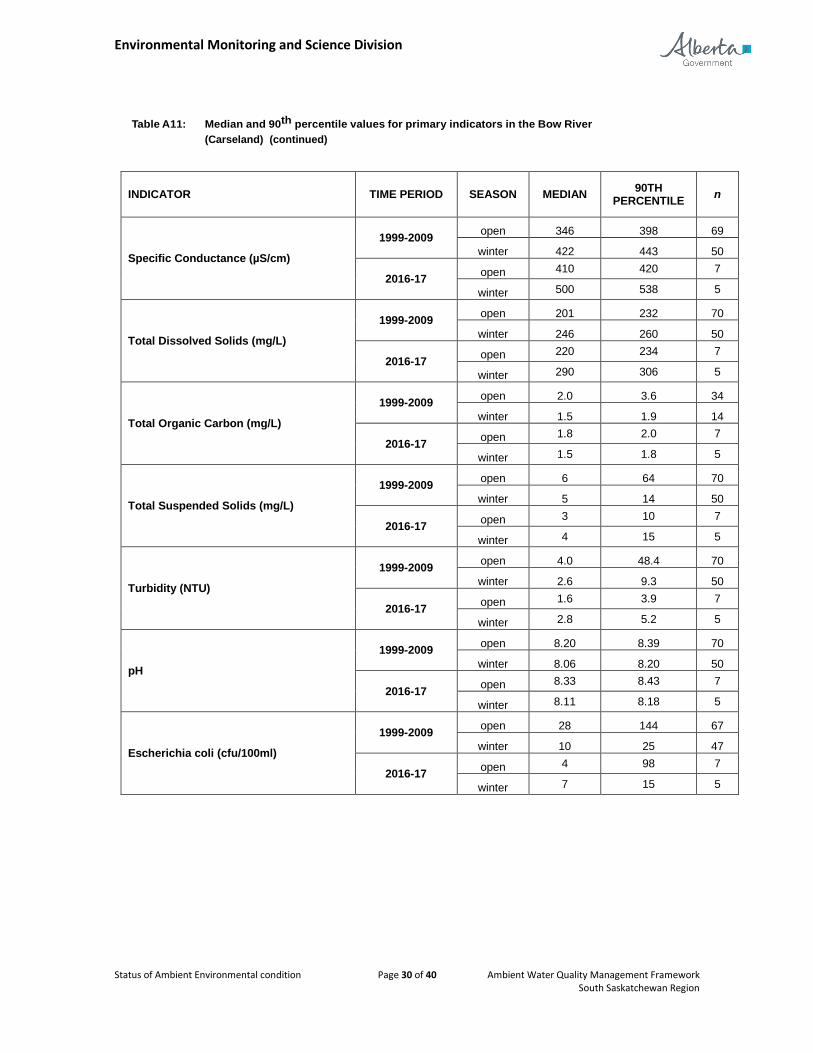
Status of Ambient Environmental condition Page 30 of 40 Ambient Water Quality Management Framework South Saskatchewan Region
Table A11: Median and 90th percentile values for primary indicators in the Bow River
(Carseland) (continued)
INDICATOR TIME PERIOD SEASON MEDIAN 90TH
PERCENTILE n
Specific Conductance (µS/cm)
1999-2009 open 346 398 69
winter 422 443 50
2016-17 open 410 420 7
winter 500 538 5
Total Dissolved Solids (mg/L)
1999-2009 open 201 232 70
winter 246 260 50
2016-17 open 220 234 7
winter 290 306 5
Total Organic Carbon (mg/L)
1999-2009 open 2.0 3.6 34
winter 1.5 1.9 14
2016-17 open 1.8 2.0 7
winter 1.5 1.8 5
Total Suspended Solids (mg/L)
1999-2009 open 6 64 70
winter 5 14 50
2016-17 open 3 10 7
winter 4 15 5
Turbidity (NTU)
1999-2009 open 4.0 48.4 70
winter 2.6 9.3 50
2016-17 open 1.6 3.9 7
winter 2.8 5.2 5
pH
1999-2009 open 8.20 8.39 70
winter 8.06 8.20 50
2016-17 open 8.33 8.43 7
winter 8.11 8.18 5
Escherichia coli (cfu/100ml)
1999-2009 open 28 144 67
winter 10 25 47
2016-17 open 4 98 7
winter 7 15 5

Environmental Monitoring and Science Division
Status of Ambient Environmental condition Page 31 of 40 Ambient Water Quality Management Framework South Saskatchewan Region
Table A12: Median and 90th percentile values for secondary indicators in Bow River (Carseland)
INDICATOR TIME PERIOD SEASON MEDIAN 90TH
PERCENTILE n
2,4-D (µg/L)
1999-2009 open 0.0075 0.0260 44
winter 0.0025 0.0025 3
2016-17 open 0.0110 0.0619 4
winter
Dicamba (µg/L)
1999-2009 open 0.0025 0.0100 44
winter 0.0025 0.0025 3
2016-17 open 0.0025 0.0025 4
winter
MCPA (µg/L)
1999-2009 open 0.0025 0.0071 44
winter 0.0025 0.0025 3
2016-17 open 0.0025 0.0025 4
winter
Mecoprop (µg/L)
1999-2009 open 0.0050 0.0167 44
winter 0.0025 0.0025 3
2016-17 open 0.0110 0.0340 4
winter
Total Mercury (ng/L)
1999-2009 open 0.30 4.81 22
winter 0.35 0.69 10
2016-17 open 0.64 1.46 7
winter 0.84 5.33 5
Total Recoverable Selenium (µg/L)
1999-2009 open 0.59 0.88 18
winter 0.83 0.98 9
2016-17 open 0.58 0.69 7
winter 0.72 0.89 5

Environmental Monitoring and Science Division
Status of Ambient Environmental condition Page 32 of 40 Ambient Water Quality Management Framework South Saskatchewan Region
Table A13: Median and 90th percentile values for primary indicators in the Bow River (Cluny)
INDICATOR TIME PERIOD SEASON MEDIAN 90TH
PERCENTILE n
Total Ammonia (mg/L)
1999-2009 open 0.025 0.120 71
winter 0.195 0.372 48
2016-17 open 0.025 0.055 7
winter 0.150 0.246 5
Chloride (mg/L)
1999-2009 open 8.0 13.0 71
winter 13.0 20.9 43
2016-17 open 12.0 13.4 7
winter 20.0 27.2 5
Nitrate (mg/L)
1999-2009 open 0.520 0.837 59
winter 1.195 1.455 40
2016-17 open 0.670 0.880 7
winter 1.400 1.780 5
Total Nitrogen (mg/L)
1999-2009 open 0.94 1.52 71
winter 1.68 2.07 48
2016-17 open 0.83 1.38 7
winter 1.80 2.26 5
Total Dissolved Phosphorus (mg/L)
1999-2009 open 0.005 0.014 35
winter 0.012 0.020 22
2016-17 open 0.010 0.013 7
winter 0.017 0.020 5
Total Phosphorus (mg/L)
1999-2009 open 0.017 0.128 35
winter 0.017 0.025 22
2016-17 open 0.010 0.015 7
winter 0.024 0.051 5
Sulphate (mg/L)
1999-2009 open 47.9 58.1 48
winter 57.2 63.1 32
2016-17 open 58.0 61.8 7
winter 71.0 78.0 5
Sodium Adsorption Ratio
1999-2009 open 0.35 0.58 48
winter 0.42 0.72 32
2016-17 open 0.40 0.47 7
winter 0.53 0.62 5

Environmental Monitoring and Science Division
Status of Ambient Environmental condition Page 33 of 40 Ambient Water Quality Management Framework South Saskatchewan Region
Table A13: Median and 90th percentile values for primary indicators in the Bow River
(Cluny) (continued)
INDICATOR TIME PERIOD SEASON MEDIAN 90TH
PERCENTILE n
Specific Conductance (µS/cm)
1999-2009 open 360 425 47
winter 441 490 32
2016-17 open 370 414 7
winter 510 550 5
Total Dissolved Solids (mg/L)
1999-2009 open 211 245 48
winter 257 290 32
2016-17 open 220 234 7
winter 300 312 5
Total Organic Carbon (mg/L)
1999-2009 open 2.2 4.3 23
winter 1.3 1.8 16
2016-17 open 1.7 2.0 7
winter 1.4 1.8 5
Total Suspended Solids (mg/L)
1999-2009 open 11 80 71
winter 4 9 48
2016-17 open 6 8 7
winter 7 15 5
Turbidity (NTU)
1999-2009 open 8.5 62.7 48
winter 2.8 7.1 32
2016-17 open 2.4 4.3 7
winter 2.7 5.2 5
pH
1999-2009 open 8.30 8.46 48
winter 8.00 8.23 37
2016-17 open 8.40 8.53 7
winter 8.11 8.26 5
Escherichia coli (cfu/100ml)
1999-2009 open 8 56 67
winter 1 6 48
2016-17 open 7 23 7
winter 3 5 5

Environmental Monitoring and Science Division
Status of Ambient Environmental condition Page 34 of 40 Ambient Water Quality Management Framework South Saskatchewan Region
Table A14: Median and 90th percentile values for secondary indicators in the Bow River (Cluny)
INDICATOR TIME PERIOD SEASON MEDIAN 90TH
PERCENTILE n
2,4-D (µg/L)
1999-2009
open 0.0065 0.0384 32
winter 0.0025 0.0025 3
2016-17 open 0.00825 0.0266 4
winter
Dicamba (µg/L)
1999-2009
open 0.0025 0.0100 32
winter 0.0025 0.0025 3
2016-17 open 0.0025 0.0025 4
winter
MCPA (µg/L)
1999-2009
open 0.0025 0.0097 32
winter 0.0025 0.0025 3
2016-17 open 0.0025 0.0025 4
winter
Mecoprop (µg/L)
1999-2009
open 0.0055 0.0209 32
winter 0.0025 0.0025 3
2016-17 open 0.0090 0.0201 4
winter
Total Mercury (ng/L)
1999-2009
open 0.30 2.53 17
winter 0.30 0.37 5
2016-17 open 0.95 1.37 7
winter 0.64 2.57 5
Total Recoverable Selenium (µg/L)
1999-2009
open 0.70 0.93 10
winter 0.79 0.82 4
2016-17 open 0.56 0.71 7
winter 0.80 0.88 5
Environmental Monitoring and Science Division
Status of Ambient Environmental condition Page 35 of 40 Ambient Water Quality Management Framework South Saskatchewan Region
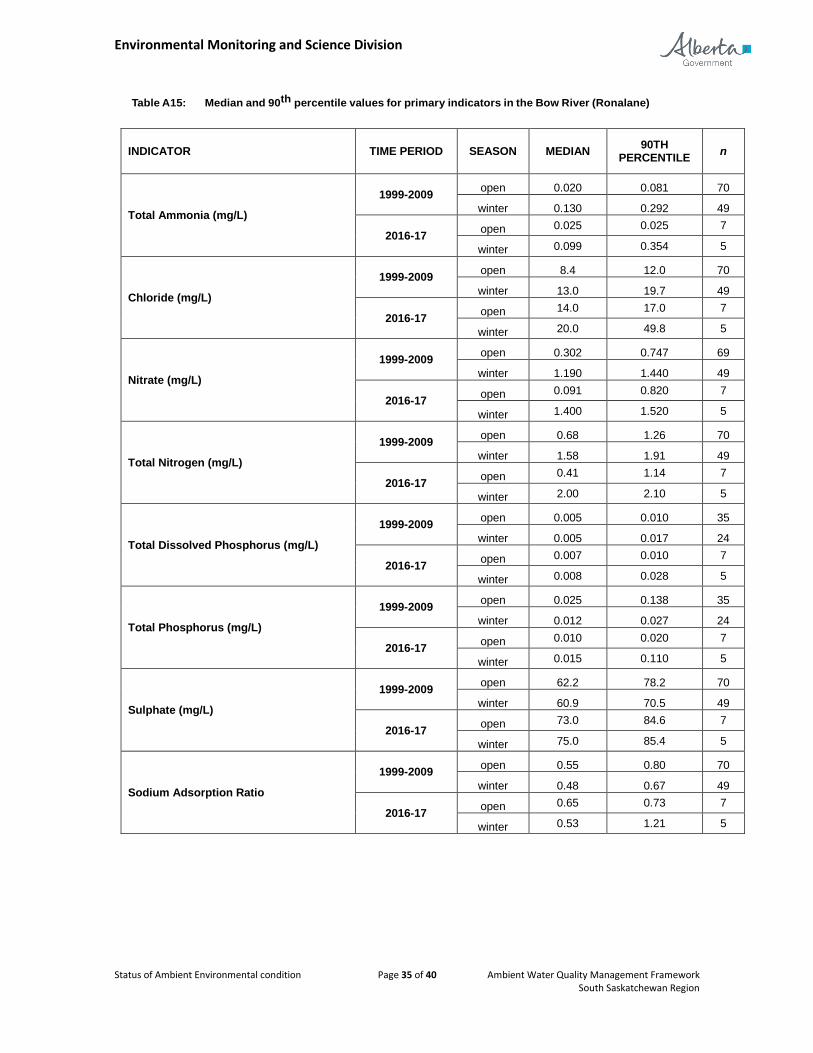
Table A15: Median and 90th percentile values for primary indicators in the Bow River (Ronalane)
INDICATOR TIME PERIOD SEASON MEDIAN 90TH
PERCENTILE n
Total Ammonia (mg/L)
1999-2009 open 0.020 0.081 70
winter 0.130 0.292 49
2016-17 open 0.025 0.025 7
winter 0.099 0.354 5
Chloride (mg/L)
1999-2009 open 8.4 12.0 70
winter 13.0 19.7 49
2016-17 open 14.0 17.0 7
winter 20.0 49.8 5
Nitrate (mg/L)
1999-2009 open 0.302 0.747 69
winter 1.190 1.440 49
2016-17 open 0.091 0.820 7
winter 1.400 1.520 5
Total Nitrogen (mg/L)
1999-2009 open 0.68 1.26 70
winter 1.58 1.91 49
2016-17 open 0.41 1.14 7
winter 2.00 2.10 5
Total Dissolved Phosphorus (mg/L)
1999-2009 open 0.005 0.010 35
winter 0.005 0.017 24
2016-17 open 0.007 0.010 7
winter 0.008 0.028 5
Total Phosphorus (mg/L)
1999-2009 open 0.025 0.138 35
winter 0.012 0.027 24
2016-17 open 0.010 0.020 7
winter 0.015 0.110 5
Sulphate (mg/L)
1999-2009 open 62.2 78.2 70
winter 60.9 70.5 49
2016-17 open 73.0 84.6 7
winter 75.0 85.4 5
Sodium Adsorption Ratio
1999-2009 open 0.55 0.80 70
winter 0.48 0.67 49
2016-17 open 0.65 0.73 7
winter 0.53 1.21 5

Environmental Monitoring and Science Division
Status of Ambient Environmental condition Page 36 of 40 Ambient Water Quality Management Framework South Saskatchewan Region
Table A15: Median and 90th percentile values for primary indicators in the Bow River
(Ronalane) (continued)
INDICATOR TIME PERIOD SEASON MEDIAN 90TH
PERCENTILE n
Specific Conductance (µS/cm)
1999-2009 open 386 431 70
winter 448 499 49
2016-17 open 420 454 7
winter 560 570 5
Total Dissolved Solids (mg/L)
1999-2009 open 228 260 70
winter 263 291 49
2016-17 open 250 264 7
winter 310 338 5
Total Organic Carbon (mg/L)
1999-2009 open 3.0 4.8 34
winter 1.5 2.5 14
2016-17 open 2.4 3.1 7
winter 1.6 4.0 5
Total Suspended Solids (mg/L)
1999-2009 open 12 72 70
winter 6 18 49
2016-17 open 7 29 7
winter 3 102 5
Turbidity (NTU)
1999-2009 open 10.4 73.3 70
winter 3.8 17.4 49
2016-17 open 2.2 9.6 7
winter 3.3 51.2 5
pH
1999-2009 open 8.32 8.58 70
winter 8.06 8.30 49
2016-17 open 8.50 8.61 7
winter 8.11 8.21 5
Escherichia coli (cfu/100ml)
1999-2009 open 14 77 69
winter 1 6 49
2016-17 open 6 78 7
winter 3 11 5

Environmental Monitoring and Science Division
Status of Ambient Environmental condition Page 37 of 40 Ambient Water Quality Management Framework South Saskatchewan Region
Table A16: Median and 90th percentile values for secondary indicators in the Bow River (Ronalane)
INDICATOR TIME PERIOD SEASON MEDIAN 90TH
PERCENTILE n
2,4-D (µg/L)
1999-2009 open 0.0325 0.1443 44
winter 0.0025 0.0025 3
2016-17 open 0.0260 0.0771 4
winter
Dicamba (µg/L)
1999-2009 open 0.0095 0.0354 44
winter 0.0025 0.0025 3
2016-17 open 0.0025 0.0260 4
winter
MCPA (µg/L)
1999-2009 open 0.0025 0.0629 44
winter 0.0025 0.0025 3
2016-17 open 0.0025 0.0057 4
winter
Mecoprop (µg/L)
1999-2009 open 0.0055 0.0160 44
winter 0.0025 0.0025 3
2016-17 open 0.0070 0.0325 4
winter
Total Mercury (ng/L)
1999-2009 open 0.90 4.24 18
winter 0.30 0.51 6
2016-17 open 1.28 2.18 7
winter 0.78 4.83 5
Total Recoverable Selenium (µg/L)
1999-2009 open 0.69 0.94 14
winter 0.83 1.00 5
2016-17 open 0.61 0.69 7
winter 0.87 0.94 5

Environmental Monitoring and Science Division
Status of Ambient Environmental condition Page 38 of 40 Ambient Water Quality Management Framework South Saskatchewan Region
Table A17: Median and 90th percentile values for primary indicators in the Milk River (Hwy 880)
INDICATOR TIME PERIOD SEASON MEDIAN 90TH
PERCENTILE n
Total Ammonia (mg/L)
1999-2009 open 0.025 0.070 81
winter 0.040 0.130 31
2016-17 open 0.025 0.054 7
winter 0.072 0.133 5
Chloride (mg/L)
1999-2009 open 1.3 6.2 81
winter 8.0 14.3 31
2016-17 open 1.4 4.2 7
winter 9.1 13.6 5
Nitrate (mg/L)
1999-2009 open 0.031 0.123 81
winter 0.382 0.807 31
2016-17 open 0.031 0.058 7
winter 0.300 0.618 5
Total Nitrogen (mg/L)
1999-2009 open 0.32 0.59 78
winter 0.82 1.22 31
2016-17 open 0.32 0.43 7
winter 0.63 1.90 5
Total Dissolved Phosphorus (mg/L)
1999-2009 open 0.003 0.006 81
winter 0.003 0.010 31
2016-17 open 0.008 0.023 7
winter 0.004 0.097 5
Total Phosphorus (mg/L)
1999-2009 open 0.079 0.193 81
winter 0.007 0.039 31
2016-17 open 0.059 0.114 7
winter 0.009 0.204 5
Sulphate (mg/L)
1999-2009 open 22.3 170.0 81
winter 197.0 316.0 31
2016-17 open 22.0 107.8 7
winter 180.0 344.0 5
Sodium Adsorption Ratio
1999-2009 open 0.43 2.26 81
winter 2.54 3.80 31
2016-17 open 0.42 1.65 7
winter 2.89 3.60 5

Environmental Monitoring and Science Division
Status of Ambient Environmental condition Page 39 of 40 Ambient Water Quality Management Framework South Saskatchewan Region
Table A17: Median and 90th percentile values for primary indicators in the Milk River
(Hwy 880) (continued)
INDICATOR TIME PERIOD SEASON MEDIAN 90TH
PERCENTILE n
Specific Conductance (µS/cm)
1999-2009 open 248 733 81
winter 916 1380 31
2016-17 open 240 540 7
winter 840 1360 5
Total Dissolved Solids (mg/L)
1999-2009 open 140 488 81
winter 606 900 31
2016-17 open 130 320 7
winter 510 910 5
Total Organic Carbon (mg/L)
1999-2009 open 2.1 4.2 39
winter 3.7 4.8 26
2016-17 open 1.3 2.2 7
winter 4.3 13.2 5
Total Suspended Solids (mg/L)
1999-2009 open 107 304 81
winter 3 12 31
2016-17 open 95 178 7
winter 6 181 5
Turbidity (NTU)
1999-2009 open 60.0 170.0 81
winter 3.7 17.5 31
2016-17 open 33.0 67.0 7
winter 5.1 46.4 5
pH
1999-2009 open 8.23 8.43 81
winter 8.30 8.41 31
2016-17 open 8.21 8.40 7
winter 8.32 8.43 5
Escherichia coli (cfu/100ml)
1999-2009 open 57 230 79
winter 1 9 30
2016-17 open 45 164 7
winter 2 5 5

Environmental Monitoring and Science Division
Status of Ambient Environmental condition Page 40 of 40 Ambient Water Quality Management Framework South Saskatchewan Region
Table A18: Median and 90th percentile values for secondary indicators in the Milk River (Hwy 880)
INDICATOR TIME PERIOD SEASON MEDIAN 90TH
PERCENTILE n
2,4-D (µg/L)
1999-2009 open 0.0025 0.0114 24
winter 0
2016-17 open 0.00375 0.012 4
winter
Dicamba (µg/L)
1999-2009 open 0.0025 0.0025 24
winter 0
2016-17 open 0.0025 0.0025 4
winter
MCPA (µg/L)
1999-2009 open 0.0025 0.0030 24
winter 0
2016-17 open 0.0025 0.0025 4
winter
Mecoprop (µg/L)
1999-2009 open 0.0025 0.0025 24
winter 0
2016-17 open 0.0025 0.0025 4
winter
Total Mercury (ng/L)
1999-2009 open 2.15 9.50 18
winter 0.30 0.70 6
2016-17 open 3.91 7.30 7
winter 0.97 7.41 5
Total Recoverable Selenium (µg/L)
1999-2009 open 0.35 0.89 14
winter 1.20 1.51 5
2016-17 open 0.21 0.59 7
winter 0.90 1.71 5