status of nutria (myocastor coypus) populations in the
TRANSCRIPT

Portland State University Portland State University
PDXScholar PDXScholar
Dissertations and Theses Dissertations and Theses
Winter 3-7-2013
Status of Nutria (Myocastor coypus) Populations in Status of Nutria (Myocastor coypus) Populations in
the Pacific Northwest and Development of the Pacific Northwest and Development of
Associated Control and Management Strategies, Associated Control and Management Strategies,
with an Emphasis on Metropolitan Habitats with an Emphasis on Metropolitan Habitats
Trevor Robert Sheffels Portland State University
Follow this and additional works at: https://pdxscholar.library.pdx.edu/open_access_etds
Part of the Other Animal Sciences Commons, and the Other Environmental Sciences Commons
Let us know how access to this document benefits you.
Recommended Citation Recommended Citation Sheffels, Trevor Robert, "Status of Nutria (Myocastor coypus) Populations in the Pacific Northwest and Development of Associated Control and Management Strategies, with an Emphasis on Metropolitan Habitats" (2013). Dissertations and Theses. Paper 665. https://doi.org/10.15760/etd.665
This Dissertation is brought to you for free and open access. It has been accepted for inclusion in Dissertations and Theses by an authorized administrator of PDXScholar. Please contact us if we can make this document more accessible: [email protected].

Status of Nutria (Myocastor coypus) Populations in the Pacific Northwest and
Development of Associated Control and Management Strategies,
with an Emphasis on Metropolitan Habitats
by
Trevor Robert Sheffels
A dissertation submitted in partial fulfillment of the
requirements for the degree of
Doctor of Philosophy
in
Environmental Sciences and Resources
Dissertation Committee:
Mark D. Sytsma, Chair
Jacoby Carter
Jimmy Taylor
Catherine de Rivera
Michael T. Murphy
Portland State University
2013

© 2013 Trevor Robert Sheffels
i
ABSTRACT
The nutria (Myocastor coypus) is a semi-aquatic rodent native to South America
that was introduced to the Pacific Northwest, USA, in the 1930s. Primary damage
categories from this invasive species include burrowing and herbivory, resulting in
habitat degradation. Nutria have become well-established in metropolitan habitats, and
anecdotal information suggests the problem has increased in recent years. However, little
regional research on the species has been conducted. The scope of this research, which
emphasizes metropolitan habitats, includes three primary foci in relation to nutria
populations in the Pacific Northwest: modeling habitat suitability, assessing activity and
movement patterns, and identifying and managing negative impacts.
Large-scale management of any invasive species requires understanding of the
current and potential future population distribution. Cold temperatures have been
assumed to be a limiting factor for the geographic distribution of nutria populations, but
this assumption had not been explicitly tested. A mechanistic habitat suitability model
based on winter temperatures performed well in predicting nutria distribution in the
Pacific Northwest and nationally. Regional results suggest nutria currently occupy most
accessible suitable habitat. However, coupling the model with future climate change data
suggests a much larger suitable habitat zone regionally and nationally in the near future.
Management of an invasive species on a local scale requires region-specific
information about behavior patterns. Radio-telemetry tracking of local nutria populations
in metropolitan habitats suggested higher diurnal activity levels than reported elsewhere.

ii
Activity areas were also on the lower end of reported nutria home ranges, suggesting the
studied metropolitan wetland sites represent core habitat for nutria in the region.
Comparison of two transmitter attachment methods, a neck collar and a tail mount, did
not identify a clearly superior attachment method for short-term nutria behavior studies.
The presence of nutria in metropolitan habitats in the Pacific Northwest
necessitates the need to expand the limited management techniques available for these
habitats. Standard Vexar® plastic mesh tubes very effectively mitigated nutria herbivory
damage to woody vegetation live stakes planted in a metropolitan habitat restoration site.
A recently developed nutria multiple-capture cage trap captured larger nutria and reduced
non-target captures compared to a standard cage trap. The design of the multiple-capture
trap, however, prevented multiple-capture events because small nutria escaped the trap.
This research contributes substantially to previously limited information about
nutria in the Pacific Northwest and resulted in several new findings. Climate change
modeling provides the first evidence that nutria ranges could expand in the near future.
Evaluation of new radio-telemetry methods will benefit future behavior studies. The
assessment of new damage prevention tools provides more options for the management
of nutria in urban habitats. Management recommendations include creating regional
nutria management plans, identifying and targeting priority monitoring regions, finding
key stakeholders, focusing on public education, and initiating a pilot control program.
Recommendations for research include evaluating effects on native fauna, conducting
disease surveys, assessing the extent of damage, continuing habitat suitability analysis,
and developing population indices.

iii
DEDICATION
To my wife, Megan, who made the completion of this dissertation possible with her
endless support and encouragement and to my daughter, Julia, who is teaching me
lessons in flexibility before she is even born.

iv
ACKNOWLEDGEMENTS
I would first like to thank two people who played invaluable roles in my research.
Mark Sytsma (Portland State University) provided continual support as my advisor and
dissertation committee chair. He always made himself available, consistently provided
needed resources, and challenged me to think independently. His encouragement and
perspective always helped me see the light at the end of the tunnel. Jacoby Carter (USGS
Invasive Species Program) provided primary funding for the duration of the research
program and contributed substantial in-kind support through the loaning of traps and
telemetry equipment. He also provided regular technical guidance and was greatly
involved throughout the development and execution of the research plan. The research
would not have been conducted in any way, shape, or form without this support.
Two other people were instrumental in the development and completion of the
research. Paul Heimowitz (USFWS Aquatic Invasive Species Program) contributed
annual research funding and provided research guidance from a management perspective.
He was also very involved with public education efforts and worked with various media
outlets to highlight research results. Jimmy Taylor (USDA National Wildlife Research
Center) contributed considerable in-kind support through the loaning of multiple-capture
traps and remote telemetry station equipment. He also provided technical support and
contributed substantially to the development and execution of the research plan.
Several other people played important roles in specific areas of the research
program. Catherine Jarnevich (USGS Invasive Species Science Program) was integral in
the development and execution of the habitat suitability modeling work. She was always
v
available and patiently explained the concepts behind the GIS methods employed. Jack
Mortensen (USDA Veterinary Services) and Darren Bruning (formerly USDA Wildlife
Services) provided veterinary supervision for the nutria behavior research. Jack
Mortensen graciously allowed me to work under his veterinary license and conducted
multiple training sessions on handling and anesthetization techniques. Sergio Merino
(USGS Invasive Species Program) demonstrated attachment of tail-mount transmitters in
the field and provided technical support. Gary Witmer (USDA National Wildlife
Research Center) provided background information for the nutria multiple-capture trap.
Fieldwork would not have been possible without contributions from numerous
people. Lori Holts (City of Eugene), Tim Couch (Sauvie Island Drainage Improvement
Company), Mark Nebeker and Dan Marvin (Oregon Department of Fish and Wildlife),
Jennifer Wilson (Wetlands Conservancy), Carl Switzer (City of Tualatin), and Carla
Staedter (City of Tigard) allowed access to study sites and provided logistical guidance.
Field technicians who contributed substantial hours included Jon Batchelor, Paul
Ramirez, Brian Turner, Leslie Bliss-Ketchum, Trevor Ruiz, Cooper Jeppesen, Erin
O’Shea, Kat Barnum, Peter Bailey, and Loren Ynclan.
Finally, I would like to thank the staff, committee members, and colleagues at
Portland State University. In particular, Catherine de Rivera was a valuable mentor and
allowed me to attend her lab meetings. She was consistently available to provide
research support and encouraged me to collaborate with others in the lab whenever
possible. My lab colleagues were always available and provided technical advice and
moral support throughout the research process.

vi
TABLE OF CONTENTS
Abstract ................................................................................................................................ i
Dedication .......................................................................................................................... iii
Acknowledgements ............................................................................................................ iv
List of Tables ................................................................................................................... viii
List of Figures .................................................................................................................... ix
Preface............................................................................................................................... xii
Chapter 1. Introduction and Species Review, with Special Reference to Nutria in the
Pacific Northwest .................................................................................................................1
Section 1. General introduction ...............................................................................1
Section 2. Species overview ....................................................................................2
Section 3. Scope of research ..................................................................................18
Chapter 2. Modeling Suitable Habitat ...............................................................................20
Section 1. Development of a combined climate-hydrologic network mechanistic
model for predicting suitable nutria habitat ...........................................................20
Section 2. Use of a mechanistic habitat suitability model to create a first
approximation of the potential impact of climate change on nutria distribution ...34
Chapter 3. Assessing Activity and Movement Patterns .....................................................41
Section 1. Nutria activity and movement patterns in metropolitan habitats in the
Pacific Northwest ...................................................................................................41
Section 2. Comparison of two techniques for attaching radio-telemetry
transmitters to nutria ..............................................................................................59

vii
Chapter 4. Identifying and Managing Negative Impacts ...................................................68
Section 1. Efficacy of plastic mesh tubes in reducing nutria herbivory damage to
live stakes in a riparian restoration site ..................................................................68
Section 2. Comparison of the performance of a new nutria multiple-capture cage
trap to a standard cage trap ....................................................................................80
Chapter 5. Conclusions and Recommendations .................................................................94
Section 1. Research conclusions and contributions ...............................................94
Section 2. Management recommendations ............................................................96
Section 3. Research recommendations ..................................................................99
Literature Cited ................................................................................................................102
Appendix A. Supplemental Material for Chapter 2 .........................................................136
Appendix B. Supplemental Material for Chapter 3 .........................................................137
Appendix C. Supplemental Material for Chapter 4. ........................................................138

viii
LIST OF TABLES
Table 2.1.1. Quantitative assessment of the accuracy of the mechanistic nutria habitat
suitability model in predicting nutria presence in the Pacific Northwest based on 2003-
2007 temperature data ........................................................................................................28
Table 2.2.1. Potential impact of climate change on the geographical extent of suitable
nutria habitat in the Pacific Northwest and contiguous United States from the present
(based on 2003-2007 mechanistic model of suitable nutria habitat) through the 2050s ...37
Table 3.1.1. Comparison of population characteristics and linear distance traveled from
point of capture/release to point of radio-transmitter recovery between four metropolitan
wetland sites in the Lower Tualatin River Watershed, Oregon .........................................51
Table 3.1.2. Estimates of total area utilized (MCP) and utilization probability distribution
(KDE) for both individual nutria with ≥ 20 locations and study populations in two
metropolitan wetland sites in the Lower Tualatin River Watershed, Oregon ....................55
Table 3.2.1. Comparison of retention time, animal response, and transmitter performance
between neck collar and tail-mount radio-transmitters deployed in four metropolitan
wetland sites in the Lower Tualatin River Watershed, Oregon .........................................64
Table 4.1.1. Comparison of survival (%) of three woody vegetation species and overall
survival between plots protected by Vexar® tubes and unprotected vegetation plots
within the Delta Ponds metropolitan waterway in Eugene, Oregon ..................................74
Table 4.2.1. Number of trap nights and site characteristics of seven trapping locations on
Sauvie Island, located at the metropolitan edge of Portland, Oregon ................................83
Table 4.2.2. Comparison of the performance and deployment advantages (+) and
disadvantages (−) between nutria multiple-capture cage traps and standard cage traps ....92
ix
LIST OF FIGURES
Figure 1.2.1. Adult nutria (Myocastor coypus) in the lawn of an apartment complex in
Beaverton, Oregon ...............................................................................................................5
Figure 1.2.2. Relationship between nutria trapping harvest numbers and mean nutria pelt
price between 1958-2011 in state of Oregon; prices are expressed in constant dollars ....17
Figure 1.2.3. Photos of human interactions with nutria; a) woman and young child
feeding a nutria in a park in Beaverton, Oregon, b) group of nutria feeding on carrots in
wetland adjacent to Springwater Trail in Gresham, Oregon, and c) nutria eating from
hand of person in Gresham, Oregon ..................................................................................18
Figure 2.1.1. Geographical agreement between a) nutria distribution and relative density
survey conducted in 2007 for state of Oregon and b) Oregon nutria trapping reports from
2003-2007 ..........................................................................................................................25
Figure 2.1.2. Predicted suitable habitat (in black) for nutria in Oregon and Washington in
2007 based on a) no months with mean minimum temperature < 0 °C and mean
maximum temp < 5 °C in previous five years and b) no months with mean minimum
temperature < 0 °C and mean maximum temp < 5 °C in previous five years and habitat
within 100 m of water ........................................................................................................27
Figure 2.1.3. Standardized distribution of the median number of extreme cold months
(mean minimum monthly temperature < 0 °C and mean maximum monthly temp < 5 °C)
between 2003-2007 in 12-digit hydrologic units (HUs) with a) high, b) medium, c) low,
and d) zero relative nutria population densities according to the 2007 survey of Pacific
Northwest nutria distribution and relative density; n = number of hydrologic units .........29
Figure 2.1.4. Geographical extent of predicted suitable nutria habitat (based on 2003-
2007 mechanistic model) in the contiguous United States compared to status of nutria
populations by state as described by Bounds (2000) and Carter and Leonard (2002) ......30
Figure 2.1.5. Geographic area in Pacific Northwest predicted suitable for nutria by
preliminary worldwide Maxent models using four methods for selecting global
background points: a) random, b) random within countries with known nutria
populations, c) kernel density estimation of weighted surface around presence locations,
and d) target group: Echimyidae ........................................................................................31
Figure 2.2.1. Potential impact of predicted climate change on the geographic distribution
of suitable nutria habitat from the present (based on 2003-2007 mechanistic model of
suitable nutria habitat) through the 2050s in the a) Pacific Northwest and b) contiguous

x
United States; suitable habitat on national scale represents temperature model only and
does not include water buffer .............................................................................................38
Figure 3.1.1. Schematic depicting a) relative human population density and locations of
the metropolitan study sites within the Tualatin River Watershed, Oregon, and b) aerial
imagery of the four study sites ...........................................................................................43
Figure 3.1.2. Daily temporal activity patterns from August-December 2011 of
metropolitan nutria populations in the Lower Tualatin River Watershed, Oregon, at a)
Hedges Creek, b) Nyberg Creek, c) Red Rock Creek, and d) Summer Creek; radial
numbers denote hour of day, internal axis represents relative nutria activity level, and
dashed lines represent 95% confidence intervals; period of darkness excludes twilight
hours ...................................................................................................................................49
Figure 3.1.3. Overall daily temporal activity patterns of metropolitan nutria populations
in the Lower Tualatin River Watershed, Oregon, in a) August, b) September, c) October,
d) November, and e) December 2011; radial numbers denote hour of day, internal axis
represents relative nutria activity level, dashed lines represent 95% confidence intervals,
and n = # of study animals with active transmitters; period of darkness excludes twilight
hours ...................................................................................................................................50
Figure 3.1.4. Relationship between daily minimum temperature and a) diurnal and b) b
nocturnal activity levels of metropolitan nutria populations in the Lower Tualatin River
Watershed, Oregon, in December 2011; error bars denote 95% confidence intervals ......51
Figure 3.1.5. Aerial depiction of area utilized, calculated using minimum convex
polygon (MCP) and kernel density estimation (KDE) methods, by metropolitan nutria
populations from August-December 2011 in the Lower Tualatin River Watershed,
Oregon, at a) Hedges Creek and b) Red Rock Creek ........................................................53
Figure 3.1.6. Spatial orientation of core area utilized (50% KDE isopleth) from August-
December 2011 for individual nutria (identified by radio frequency #) with ≥ 20 locations
in metropolitan wetland sites in the Lower Tualatin River Watershed, Oregon, at a)
Hedges Creek and b) Red Rock Creek ..............................................................................54
Figure 3.2.1. Photos depicting design of VHF transmitters deployed on nutria at four
metropolitan wetland sites in the Lower Tualatin River Watershed, Oregon, via a) neck
collar and b) tail-mount (shown without PVC pipe) attachment methods .........................60
Figure 3.2.2. Photos depicting orientation of VHF transmitters deployed on nutria at four
metropolitan wetland sites in the Lower Tualatin River Watershed, Oregon, for a) neck
collar and b) tail-mount attachments ..................................................................................62

xi
Figure 4.1.1. Aerial imagery depicting Delta Ponds metropolitan waterway in Eugene,
Oregon, in relation to Willamette River to the west and urban development on all sides;
circles denote two locations of vegetation transects ..........................................................70
Figure 4.1.2. Partial transect of woody vegetation live stakes with two vegetation plots
protected by Vexar® plastic mesh tubes and motion-activated surveillance cameras
monitoring the vegetation plots within the Delta Ponds metropolitan waterway in Eugene,
Oregon; circular wire barrier at left of photo is not part of study exclusion treatment .....72
Figure 4.1.3. Examples of a motion-activated surveillance camera station capturing
nutria targeting live stakes in an unprotected vegetation plot within the Delta Ponds
metropolitan waterway in Eugene, Oregon .......................................................................74
Figure 4.1.4. Kaplan-Meier survival curves at 9, 44, 94, and 100 days at Delta Ponds
metropolitan waterway in Eugene, Oregon, from February-May 2009 for live stakes of a)
black cottonwood (n = 29), b) red osier dogwood (n = 37), and c) willow species (n = 54)
in unprotected vegetation plots; dashed lines denote 95% confidence intervals ...............75
Figure 4.1.5. Cumulative number of independent (more than 0.5 hours between camera
triggers) nutria events captured on surveillance cameras from February-May 2009 in
protected and unprotected vegetation plots with the Delta Ponds metropolitan waterway
in Eugene, Oregon .............................................................................................................76
Figure 4.2.1. Aerial imagery depicting Sauvie Island in relation to the Columbia River to
the east, Willamette River to the south, and Multnomah Channel to the west; seven study
site locations are shown; Portland, Oregon, is located 15 km to the southeast .................82
Figure 4.2.2. Nutria multiple-capture trap depicted by a) technical drawing with wire
fencing only shown on one panel for illustrative purposes and b) photo of constructed
trap from rear .....................................................................................................................84
Figure 4.2.3. Comparison of the distribution of nutria captures by size class (kg) between
multiple-capture traps and standard cage traps deployed in pairs at seven locations on
Sauvie Island, Oregon, from March-April 2011 ................................................................87
Figure 4.2.4. Camera surveillance capture of a nutria social group in the vicinity of a
nutria multiple-capture trap on Sauvie Island, Oregon ......................................................89

xii
PREFACE
My research focused on informing the management of a specific invasive rodent,
the nutria (Myocastor coypus), in the Pacific Northwest, USA, however, research results
have applications for a broad range of vertebrate species across geographic regions. The
habitat suitability modeling work in Chapter 2 provides information about current and
future nutria priority monitoring areas on a regional and national scale. The model also
provides a framework for modeling suitable habitat, both present and future, for other
cold-limited species. The assessment of activity and movement patterns in Chapter 3
describes appropriate spatial and temporal scales for nutria control in regional
metropolitan habitats. Design of the two naturally detaching radio transmitters assessed
in the study can be adapted for other short-term vertebrate telemetry studies to avoid the
need for animal recapture. Research in Chapter 4 evaluated two methods, one non-lethal
and one lethal, for managing nutria damage. In addition to demonstrating the effective
use of a plastic barrier for preventing nutria damage to restoration vegetation, results
highlight the need for understanding location-specific herbivore habitat use and food
habits prior to restoration work. The low non-target capture rate of a new nutria multiple-
capture cage trap identified the trap as a potential new control tool for metropolitan areas;
trap bias toward certain size classes displayed by both the multiple-capture trap and a
standard cage trap highlights the importance of understanding potential effects of trap
bias on the success of vertebrate pest trapping programs.

xiii
Several terms used throughout the manuscript need to be defined. First, the term
“metropolitan” was used to best describe the areas in which my field research was
conducted. “Metropolitan” was selected over “urban” to highlight the inclusion of less
populated surrounding suburban areas in addition to the densely populated urban core.
Though the term “urban” is generally not defined in the literature, much of my research
fits in the field of urban ecology; the terms “metropolitan” and “urban” can be used
interchangeably for comparison with other studies. Second, the geography of the “Pacific
Northwest” can be delineated in many different ways; I defined the “Pacific Northwest”
as the geographic area encompassing the states of Oregon and Washington. Third, I used
the term “utilization area” to describe the physical area used by nutria within my study
sites. The traditional definition of “home range” for mammals is the “area traversed by
the individual in its normal activities of food gathering, mating, and caring for young”
(Burt 1943). Since I did not document specific behaviors and analyzed movement at both
the individual and population level, “utilization area” is a more accurate description.
Again, the interpretation of “home range” is generally not addressed in the literature; my
results can essentially be compared with other home range studies.

- 1 -
CHAPTER 1
INTRODUCTION AND SPECIES REVIEW, WITH SPECIAL REFERENCE TO
NUTRIA IN THE PACIFIC NORTHWEST
Section 1. General introduction
Invasive species are becoming an increasing concern worldwide, and the rapid
expansion of global travel has increased the number of potential introduction pathways
(Hulme 2009). The adverse impacts of invasive species (e.g., disruption of ecological
processes, competition with native species for resources, reduction of biological
diversity) have been well-documented (Elton 1958, Mack and D’Antonio 1998). More
than 50,000 non-native species have been introduced in the United States alone, resulting
in estimated economic damages of $120 billion per year (Pimentel et al. 2005). The field
of invasion ecology continues to grow, and research often focuses on preventing the
establishment of an invasive species in non-native regions. It is well-established that
early detection and rapid response are vital components of invasive species eradication
efforts (Mehta et al. 2007, Simpson et al. 2009). However, a multitude of invasive
species have already become established all over the world in habitats with land uses
ranging from completely undeveloped to urban.
As the level of human development continues to increase around the world, many
species are experiencing rapidly changing habitat conditions. Many species display
behavioral adaptations to anthropogenic influences in urban habitats (Ditchkoff et al.
2006), a process that has been termed “synurbization” (Luniak 2004). Another

- 2 -
consequence of increased human development is the associated increase in human-
wildlife conflicts (Messmer 2000). Much of the research on human-wildlife conflicts is
focused on limiting anthropogenic impacts to sensitive species (Treves et al. 2006),
however, there are also many invasive species creating economic and societal conflicts in
developed areas (McNeely 2001).
Damage caused by wildlife, both native and non-native, in urban areas often
differs from damage in more natural environments. Examples of human-wildlife
conflicts in developed areas include destruction of restored habitat, personal property
damage, and threats to human safety (Conover et al. 1995). These conflicts highlight the
need for vertebrate pest management strategies specific to the urban environment, such as
control methods that minimize non-target risks (Bengsen et al. 2008). Wildlife
management and control in urban areas must also account for societal perception (Fall
and Jackson 2002, Dickman 2010). Additionally, the adaptability of invasive species
necessitates species-specific, and even geographic region-specific, strategies in many
instances. The nutria (Myocastor coypus) is an example of a vertebrate invasive species
already established in the United States and elsewhere for which regional urban-specific
management strategies are needed.
Section 2. Species overview
Distribution.—The nutria is a large, semi-aquatic, invasive rodent native to South
America south of 23° latitude (Ehrlich 1967, Woods et al. 1992). The native range
includes southern Brazil, Bolivia, Paraguay, Uruguay, Argentina, and central and

- 3 -
southern Chile (Gosling and Baker 1991). Nutria have been introduced around the world
over the last century for fur farming and are now established on every continent except
Australia and Antarctica (Carter and Leonard 2002). In the United States, 15 states are
considered to have stable or increasing nutria populations (Bounds 2000).
Nutria populations in the United States are located primarily in coastal and
wetland regions. Primary habitat type is freshwater and brackish marshes (Bounds 2000),
with freshwater habitats being preferred (Dozier 1985). Nutria populations are also
common in a variety of aquatic environments such as ponds, swamps, drainage canals,
rivers, streams, and other slow-flowing water systems (LeBlanc 1994). Nutria remain
close to water sources and generally do not utilize upland habitat (Doncaster and Micol
1989, Guichón et al. 2003a, D’Adamo et al. 2000). The primary limiting factor for nutria
distribution appears to be the severity of the winter season. Nutria are not adapted to
extreme cold temperatures, and mortality rates during unusually cold winters can climb to
90% after several consecutive days of subfreezing temperatures (Gosling et al. 1983).
Behavioral flexibility of nutria, however, has allowed them to persist in regions
previously thought to be too harsh for survival (Doncaster and Micol 1990).
Nutria are also able to adapt to varying levels of human interaction. Nutria
populations in their native range are found primarily in areas without human perturbation
because of heavy hunting pressure (Guichón and Cassini 1999, Guichón and Cassini
2005, Leggieri et al. 2011), but native populations are also observed in urban habitats
(Corriale et al. 2006, Corriale et al. 2008). Non-native populations in introduced ranges
persist in rural and developed areas (Bertolino and Ingegno 2009). In fact, local non-

- 4 -
native nutria populations can become habituated to human presence (Carter and Leonard
2002, Meyer 2005, Witmer et al. 2012).
Species description.—The nutria is often confused with the beaver (Castor
canadensis) or muskrat (Ondatra zibethicus), but the species has a variety of distinctive
features. Nutria are smaller than the beaver and much larger than the muskrat. The mean
adult size of the nutria is approximately 5.5 kg, and a mature adult body length measures
about 60 cm (Evans 1970). Guichón et al. (2003c) found that nutria reached a larger size
in introduced ranges in the United States and Europe compared to native populations in
Argentina. Maximum recorded body masses for nutria in the Pacific Northwest are 10.9
kg for males and 7.3 kg for nulliparous females (Peloquin 1969).
Nutria exhibit several additional distinguishing features that aid in identification
(Figure 1.2.1). The most prominent feature is a thin, rounded, rat-like tail, as opposed to
the horizontally flattened tail of the beaver and the laterally compressed tail of the
muskrat. The hind legs of the nutria are much longer than the front legs, giving the
species a hunched appearance when on land (Bounds et al. 2003). Nutria have prominent
incisors that range in color from yellow to dark orange and white vibrissae on the muzzle
(Woods et al. 1992). Fur color ranges from yellowish to dark brown (Evans 1970). The
nutria also has several adaptations for aquatic environments that include webbed hind
feet, a valvular nose and mouth, eyes and ears set high on the head, and mammae located
high on the sides of the body to allow for nursing in the water (LeBlanc 1994).

- 5 -
Figure 1.2.1. Adult nutria (Myocastor coypus) in the lawn of an apartment complex in Beaverton, Oregon
Social behavior and reproduction.—Nutria have a polygynous mating system and
also exhibit an organized social structure (Gosling and Baker 1987). In their native
range, nutria social groups contain approximately 10 individuals consisting of juveniles,
sub-adults, and adults of both sexes. Behavioral groups may or may not represent genetic
groups (Túnez et al. 2009). Each group typically has one dominant male that is larger
than the other males (Guichón et al. 2003b). The resident dominant male is territorial and
drives away young maturing males within the group and mature males from other social
groups. This behavior results in males being more likely to disperse than females
(Gosling and Baker 1989).
Nutria are prolific non-seasonal breeders, although reproductive peaks occur
throughout the year (Bounds et al. 2003), and gestation periods range from approximately
127-138 days (Newson 1966). Mean litter size is 4-5 offspring (LeBlanc 1994), although
females can produce a litter size of up to 13 young in optimal habitats (Gosling 1974).

- 6 -
Pregnant females have the ability to abort fetuses under adverse conditions (Gosling
1986). Most studies have calculated a pregnancy rate of 80% or higher for sexually
mature females within a population (Bounds et al. 2003), and mature females can
produce 2-3 litters per year (Brown 1975). Newborns are highly precocial and are active
as soon as one hour after birth (Gosling and Baker 1991). Nutria become sexually mature
at 4-6 months of age (Evans 1970). Guichón et al. (2003c) found that individuals in non-
native populations became sexually mature sooner than individuals in native populations.
These reproductive traits highlight the capacity of the species to proliferate quickly.
Gosling (1974) estimated that a population of 8,000-10,000 individuals could increase to
15,000-18,000 individuals in one year in the absence of population control.
Peloquin (1969) studied the reproductive biology of a nutria population in the
Willamette Valley, Oregon, over a two-year period. Sexual maturity ranged from four to
nine months for females and six to nine months for males. Mean body mass at the onset
of sexual maturity was 2.8 kg and 1.9 kg for males and females, respectively. Mean litter
size was five young with a range from three to eight young. Major birth peaks occurred
in January and May, followed by minor peaks in March and October. Peloquin (1969)
concluded that the reproductive characteristics of the study population indicated the
Willamette Valley was a highly suitable habitat for nutria.
Ecology.—Nutria population densities are generally highest in the fall and winter
and lowest in spring after mortality from trapping and cold winter weather (Bounds et al.
2003). Annual density estimates range from 0.5-21.4 individuals/ha (Willner et al. 1979),
and population density varies widely depending on habitat suitability. Density estimates

- 7 -
also can change drastically throughout the year in response to abiotic factors. In Oregon,
a nutria population was estimated at 0.6 individuals/ha in winter when water levels were
high and 138 individuals/ha in summer when many of the seasonal ponds and streams
were dry (Wentz 1971). Several direct and indirect population indices have been
developed, but the accuracy of these indices have been called into question (Carter et al.
1999, Bounds et al. 2003).
Nutria build and use resting and feeding nests in dense vegetation during the
warmer months and construct burrows when temperatures drop during winter months
(Atwood 1950). Nutria dig burrows in banks adjacent to water ranging from simple one-
entrance burrows to complex passages with multiple levels and entrances (Warkentin
1968). Entrances are generally located just above water line, and burrows as long as 45
m have been recorded (LeBlanc 1994). Peloquin (1969) recorded burrows up to 6.1 m in
Oregon with a mean entrance diameter of 23 cm and noted that nutria demonstrated
preference for banks with slopes ranging from 45-90°. Bounds et al. (2003) suggested
that nutria populations in the Pacific Northwest demonstrate higher burrowing activity
than populations in Louisiana by referencing the level of muskrat burrowing as a baseline
for both regions. Nutria also utilize other sources of cover, including man-made
structures, during periods of severe winter weather (Norris 1967a).
Activity.—Nutria have been categorized as nocturnal in both native and
introduced ranges (Chabreck 1962, Palomares et al. 1994), although nutria can be active
throughout the day (Bounds et al. 2003). Activity patterns shift in response to both
human and climate factors. A nutria population in Germany exhibited strongly diurnal

- 8 -
behavior due to the influence of local human feeding (Meyer 2005). Nutria may also be
more active during the day in the absence of predator pressure, including humans
(LeBlanc 1994). Gosling et al. (1980) reported higher diurnal activity during extreme
cold temperature events in the winter months.
Nutria generally utilize a small area, as daily movement occurs within 180 m of
shelter location (LeBlanc 1994). Mean home range size estimates vary widely from < 2
ha to > 30 ha and can vary by season (Doncaster and Micol 1989, Ras 1999, Nolfo-
Clements 2009). Males generally utilize larger home ranges than females, and home
range size can be largely dependent on resource availability (Gosling and Baker 1989).
Nutria are capable of long distance dispersal events when resources are limited. Aliev
(1965) documented an individual nutria that dispersed a distance of 65 km over a two-
year period in eastern Europe.
Feeding habits.—Nutria are generalist herbivores capable of consuming up to
25% of their body mass daily by utilizing both aquatic and terrestrial vegetation (Gosling
1974, Guichón et al. 2003a). Foraging comprised 80% of observed activity for native
populations in Argentina (D’Adamo et al. 2000). Diet can include all types of plant
material, including leaves, stems, roots, and bark (Willner et al. 1979, Murua et al. 1981).
Nutria are considered wasteful feeders, as estimates indicate as much as 90% of damaged
plant material can remain unconsumed when foraging occurs on belowground roots and
tubers (Taylor et al. 1997). Nutria have been shown to over-utilize preferred species
(Borgnia et al. 2000), but are able to change food habits seasonally based on availability

- 9 -
of food sources (Abbas 1991, Wilsey et al. 1991). For example, consumption of roots
increases in winter months when other food sources are scarce (Bounds et al. 2003).
Nutria are opportunistic feeders known to utilize different food sources depending
on vegetation present in the region. In their natural range of Argentina, nutria diets
consisted of 40-60% aquatic monocots, 30-35% terrestrial monocots, and 0-15% dicots.
Spikerushes and duckweeds were the two most consumed species (Borgnia et al. 2000).
Nutria populations in Italy targeted aquatic macrophytes 82% of the time, primarily reeds
and Elodea species (Prigioni et al. 2005a). Plants commonly consumed by nutria in
Louisiana include cordgrasses, duckweeds, arrowheads, and bulrushes (Wilsey et al.
1991). Nutria diets in Maryland rely heavily on plant roots (Willner et al. 1979). Nutria
are also commonly observed feeding on lawn grass in urban systems in Louisiana
(Jacoby Carter, US Geological Survey, personal communication).
Nutria utilize a variety of plant species in the Pacific Northwest. Wentz (1971)
found that broadleaf arrowhead (Saggittaria latifolia) and smartweed (Polygonum spp.)
were selected by nutria in the Willamette Valley, Oregon, and concluded these species
may be locally reduced or extirpated by foraging nutria. Wentz observed nutria feeding
on 40 different species of plants, and 15 species accounted for over 80% of the foraging
observations. Nutria foraged more heavily on herbaceous dicots than monocots in coastal
habitats of Oregon (A. Meyer, 2006), but herbivory impacts were not as severe as those
reported in Maryland and Louisiana. Nutria also feed on a wide range of crops located in
close proximity to aquatic habitat (Kuhn and Peloquin 1974) and eat lawn grass in
metropolitan habitats (author, personal observation).

- 10 -
Mortality.—Gosling and Baker (1981) estimated the potential longevity of nutria
in Great Britain to be 6.3 years ± 0.4 years [SD]. Atwood (1950) concluded that < 10%
of nutria in Louisiana survived to 2.5 years of age. Bounds et al. (2003) suggested that
only 15-20% of individuals survive past two years of age in natural conditions. Annual
mortality rate estimates range from 53% (Chapman et al. 1978) to 74% (Newson 1969).
The most common source of mortality is prolonged freezing temperatures (Norris 1967a,
Evans 1970, Gosling et al. 1983, Doncaster and Micol 1990). These studies concluded
that mortality results both from direct physiological effects of the cold and from
starvation. Doncaster and Micol (1990) also documented high mortality after a five week
flooding period in France. Large nutria population reductions resulting from severe
winter weather have also been documented in Oregon (Kuhn and Peloquin 1974).
The impact of predation on nutria population dynamics has not been well-
quantified. Caiman (Caiman spp.) are the primary natural predator of nutria in its native
range (Willner 1982), and alligators (Alligator mississippiensis) prey upon nutria in
Louisiana (Gabrey et al. 2009, Keddy et al. 2009). Other potential predators include
various carnivorous mammals and large birds of prey (Bounds et al. 2003). Many
predators only kill juvenile nutria because of the large size of adults (Gosling et al. 1981).
Domestic dogs are potential predators in metropolitan areas (Jacoby Carter, US
Geological Survey, personal communication). Other substantial sources of mortality
documented in the native range include vehicle strikes, poisoning, and infectious diseases
(Martino et al. 2008).

- 11 -
Damage.—Nutria in high densities can cause substantial environmental and
economic damage. The most studied impact has been the role of nutria herbivory in the
loss of wetland and riparian structure and function, such as reduced plant biomass and
sediment retention (Grace and Ford 1996, Carter et al. 1999, Johnson-Randall and Foote
2005, McFalls et al. 2010). Nutria feeding habits can lead to destruction of the root mat
and result in conversion to open water systems when damage is severe (Boorman and
Fuller 1981, Bounds et al. 2003). Nutria feeding can also result in damage to terrestrial
vegetation, including crops in agricultural areas (Evans 1970, LeBlanc 1994).
Herbivory damage to a variety of agricultural crops occurs in both Oregon and
Washington. Larrison (1943) warned of the potential of increased damage to vegetable
production in the Puget Sound area as early as the 1940s. Kuhn and Peloquin (1974)
reported historic nutria damage to agricultural crops in the Willamette Valley and
estimated losses of thousands of dollars per year. The crop damage was moderate to
severe by the 1960s with damage to seed, grain, forage, hay, and trees (Kuhn and
Peloquin 1974). Damage to regional agricultural crops such as alfalfa, wheat, corn, peas,
and sugar beets is still common today, but comprehensive damage estimates are not
available (Justin Stevenson, formerly USDA Wildlife Services, personal
communication). Nutria herbivory is also destructive to regional wetland and riparian
habitat restoration projects. Herbivory at a restoration project site in Vancouver,
Washington, resulted in damages totaling $400,000 (Tim Esary, City of Vancouver,
personal communication). Damage to lawns and gardens in both rural and metropolitan

- 12 -
areas is also regularly reported (Justin Stevenson, formerly USDA Wildlife Services,
personal communication).
Nutria burrowing can lead to soil erosion, particularly when wave action is
present in tidal systems or when precipitation saturates the soil. Nutria burrow into
natural stream banks (LeBlanc 1994), which can result in soil sloughing into streams and
subsequent water quality impacts for native species. Burrows also damage a variety of
earthen water control structures (e.g., levees, dikes, embankments) and compromise the
ability of these structures to control water flow (Evans 1970, LeBlanc 1994). Stream
banks and water control structures weakened by nutria burrows are susceptible to cave-
ins (Evans 1970). Other documented damage includes burrowing into Styrofoam
flotation of boat docks and under buildings (Evans 1970, LeBlanc 1994).
Soil erosion resulting from nutria burrowing represents the largest category of
damage in the Pacific Northwest (Sheffels and Sytsma 2007). Bank erosion due to nutria
burrowing could result in deterioration of habitat for native fish species in the region (A.
Meyer, 2006). In addition to erosion in natural systems, damage to roads and irrigation
canals commonly occurs in the Pacific Northwest (Justin Stevenson, formerly USDA
Wildlife Services, personal communication). Heavy machinery and livestock breaking
through banks weakened by nutria burrows has also been reported (Gordon Oman,
Wahkiakum County Diking District, personal communication). Regional homeowners
living near stream or wetland systems can face costs of thousands of dollars to repair
nutria erosion damage to private property (Justin Stevenson, formerly USDA Wildlife
Services, personal communication).
- 13 -
Many other potential concerns associated with non-native nutria populations have
been studied. For example, competition with sympatric species (Ionescu et al. 2010,
Ruys et al. 2011), direct and indirect effects on waterfowl (Simpson 1980, Bertolino et al.
2011), facilitation of aquatic invertebrate dispersal (Waterkeyn et al. 2010), and
destruction of seismic cables (Gunn and Schmidly 1984) have all been documented.
Feral nutria populations are also reservoirs for a wide range of zoonotic diseases and
parasites (Babero and Lee 1961, Newson and Holmes 1968, Howerth et al. 1994, Bollo et
al. 2003, Martino et al. 2008). Even though nutria inhabit urban areas, transmission risks
have not been well-studied (Jojola et al. 2005). Finally, potentially aggressive behavior
by nutria can pose a hazard to children and pets that approach too closely (Jim Tabor,
Washington Department of Fish and Wildlife, personal communication).
Management.—Mitigating nutria impacts has historically been conducted using
three lethal control methods: poisoning, shooting, and trapping. Pre-baiting has been
shown to improve results for all eradication methods (LeBlanc 1994). The potential use
of rodenticides for nutria control continues to be assessed (Nolte et al. 2004, Mach and
Poché 2007), but applications are limited by primary and secondary consumption hazards
for non-target species (Witmer et al. 2010). Shooting nutria can be very effective in
undeveloped areas where the use of firearms is not prohibited (Evans 1970, LeBlanc
1994). Trapping is the most widely used nutria control method on varying spatial scales
and has been shown to be a potentially cost-effective control option (Bertolino et al.
2005, Panzacchi et al. 2007, Bertolino and Viterbi 2010). A few studies have suggested

- 14 -
additional methods to improve trapping success, such as the use of floating rafts (Baker
and Clarke 1988) and scent lures (Jojola et al. 2009).
Best management practices suggest two basic types of traps for nutria capture:
foot-hold restraining traps and body-grip traps (Association of Fish and Wildlife
Agencies 2006). Both are single capture traps; body-grip traps are lethal and foot-hold
traps are non-lethal. Non-lethal management of nutria populations is common when non-
target risks or public safety are a primary concern. Cage traps have also been used
effectively on a range of spatial scales and habitat types (Gosling et al. 1988, Prigioni et
al. 2005b, Cocchi and Riga 2008).
Many indirect, non-lethal methods for nutria management have also been
suggested. These methods focus on preventing nutria ingress to an area by excluding or
deterring nutria from establishing a permanent presence. Exclusion methods include
burying fences to protect sensitive areas and establishing vegetation barriers to protect
individual vegetation plantings (Evans 1970, LeBlanc 1994). Habitat modification
methods include manipulating water levels seasonally to flood burrows or eliminate
standing water, contouring stream banks to reduce slope angle, and controlling vegetation
near water to reduce refuge areas (Evans 1970, LeBlanc 1994).
Attempts to eradicate feral nutria populations have taken place in several
locations with varying degrees of success. In the United States, small nutria populations
have been eradicated in California and Indiana (Carter and Leonard 2002). In general,
effective eradication projects must take place while nutria populations are small (Drake
2005). The most successful large-scale eradication program to date took place in Great

- 15 -
Britain and is considered a model for eradication of a vertebrate pest species (Bomford
and O’Brien 1995). An extensive trapping program during a five-year period in the
1980s reduced the number of adult females from 3,000 to approximately 20 individuals,
and continued trapping efforts for five additional years eliminated the remaining
population (Gosling and Baker 1987). The eradication program was aided by substantial
research on the biology and behavior of nutria in Great Britain (Gosling 1980, Gosling et
al. 1980, Gosling 1981a, Gosling 1981b, Gosling and Baker 1981) and a continuous
population census during control efforts (Gosling et al. 1981).
Large-scale nutria control programs in the United States exist primarily in two
states, Louisiana and Maryland. Both programs are largely supported by federal funding.
The Coastwide Nutria Control Program, which is headed by the Louisiana Department of
Wildlife and Fisheries, offers a bounty to encourage private trappers to target nutria. The
stated goal of the program, which officially began in 2002, is to annually harvest 400,000
nutria from coastal Louisiana to reduce nutria herbivory damage on marsh ecosystems.
The program has reported a decrease in damaged marsh area from an estimated 102,585
wetland acres in 1999 to an estimated 4,234 wetland acres in 2012 according to aerial
surveys (Hogue and Mouton 2012). In addition to providing a mechanism for population
control, the federally subsidized bounty program is an important revenue source for many
hunters and trappers in the region (Jojola et al. 2005).
The goal of the nutria program in Maryland is eradication in order to preserve the
fragile marsh ecosystems of the Chesapeake Bay. The program is run by the Nutria
Management Team, which consists of federal, regional, and local partners. In 2000, a

- 16 -
three-year research study was initiated with the stated goals of estimating nutria
populations and densities, monitoring nutria behavior and movement in response to
trapping, and evaluating the reproductive response of nutria to trapping (Bounds and
Carowan 2000). A large-scale trapping effort was implemented from 2002-2006 to test
the feasibility of eradication, and all known high density nutria populations were
removed during this effort (Nutria Management Team 2012). The final phase of the
program, which has been expanded to include the entire Delmarva Peninsula, is to
eradicate nutria in the region by 2015 through strategic detection and removal of low
density populations (Nutria Management Team 2012).
Invasion history in the Pacific Northwest.—Nutria were introduced to Oregon
and Washington beginning in the 1930s for fur farming (Larrison 1943, Willner 1982).
More than 600 nutria farms existed in Oregon from the 1930s to the 1950s (Kuhn and
Peloquin 1974), and farms were also present in Washington (Larrison 1943, Guenther
1950). Damaged holding structures resulting from flooding and intentional releases
quickly led to the establishment of feral populations. By the 1940s, feral nutria were
regularly being caught by trappers in the Willamette Valley, the Puget Sound area, along
coastal Oregon rivers, and along the Columbia River (Larrison 1943, Ingles 1965, Mace
1970, Kuhn and Peloquin 1974). A sharp decrease in the value of nutria fur in the 1950s
led to the collapse of the industry in the region (Kuhn and Peloquin 1974). Introduced
populations in Idaho and Montana did not survive (Carter and Leonard 2002), and feral
nutria populations in California were eradicated (Deems and Pursley 1978).

- 17 -
Nutria in Oregon and Washington were trapped mostly by accidental catch until
the 1970s (Sheffels and Sytsma 2007). A major increase in pelt prices in the late 1970s
and early 1980s corresponded with large increases in the annual trapping take. Trapping
in Oregon peaked in the 1977-78 trapping year when 16,272 nutria were taken, however,
pelt prices then decreased and annual nutria harvest by trappers declined markedly
(Figure 1.2.2). This trend has also been observed in Louisiana (Hogue and Mouton 2012)
and likely reflects depressed pelt prices rather than decreasing population densities (Verts
and Carraway 1998). Regional harvest data also indicate a relatively stable population
geographically, as nutria are consistently captured in the same counties (i.e., nutria do not
appear to be spreading to previously unoccupied counties in appreciable numbers).
Figure 1.2.2. Relationship between nutria trapping harvest numbers and mean nutria pelt price between
1958-2011 in state of Oregon; prices are expressed in constant dollars
Nutria populations are increasing in Oregon and Washington (Bounds 2000),
which has resulted in increased establishment of nutria populations in metropolitan areas.
Anecdotally, nutria nuisance complaints have increased in Oregon and Washington in

- 18 -
recent decades (Sheffels and Sytsma 2007). The lack of public education has led to
humans exacerbating the problem, such as people feeding nutria in public parks (Figure
1.2.3). Although there has been recent interest in the development of a regional plan for
nutria management (Sheffels and Sytsma 2007), management and control efforts are
currently only conducted on the local scale.
Figure 1.2.3. Photos of human interactions with nutria; a) woman and young child feeding a nutria in a
park in Beaverton, Oregon, b) group of nutria feeding on carrots in wetland adjacent to Springwater Trail in
Gresham, Oregon, and c) nutria eating from hand of person in Gresham, Oregon
Section 3. Scope of research
As early as 1943, Larrison (1943) suggested that nutria in the Pacific Northwest
should be studied so that control measures could be implemented before their range
expanded. Unfortunately, little study of the growing nutria populations occurred
(Sheffels and Sytsma 2007). The recent increase in nutria damage complaints in Oregon
and Washington, coupled with the presence of nutria populations in urban areas, has
resulted in heightened awareness of nutria on a regional level. This awareness has
brought into focus the need for strategic management of this invasive species. In order to
better manage nutria populations in the Pacific Northwest, it is important to understand

- 19 -
the status of nutria on a regional level and develop appropriate management and control
strategies, particularly in metropolitan habitats where options are currently limited.
The scope of this research, which emphasizes metropolitan habitats, includes
three primary foci in relation to nutria populations in the Pacific Northwest: habitat
suitability, behavior patterns, and impact mitigation. Habitat suitability modeling work
presented in Chapter 2 was driven by the following questions:
1. What habitat factors are important for predicting suitable habitat for nutria in the
Pacific Northwest and elsewhere?
2. How will global climate change scenarios potentially influence suitable nutria
habitat in the Pacific Northwest and elsewhere?
Field research presented in Chapter 3 on nutria behavior patterns in metropolitan habitats
focused on the following questions:
1. Do nutria activity and movement patterns in metropolitan habitats in the Pacific
Northwest differ from patterns observed elsewhere in non-urban habitats?
2. What method for attaching radio-telemetry transmitters is best suited for short-
term nutria behavior studies?
The development of impact mitigation techniques presented in Chapter 4 was based on
the following questions:
1. Can Vexar® plastic mesh tubes mitigate nutria herbivory damage to woody
vegetation species commonly planted for habitat restoration efforts?
2. Is the newly developed nutria multiple-capture cage trap a viable method for
nutria population control, particularly in metropolitan habitats?

- 20 -
CHAPTER 2
MODELING SUITABLE HABITAT
Section 1. Development of a combined climate-hydrologic network mechanistic
model for predicting suitable nutria habitat
Established invasive species populations are only able to spread geographically if
additional suitable habitat is available, and both biotic and abiotic factors influence
whether habitat is suitable for a species (Lockwood et al. 2007). If suitable habitat is
available, spread is influenced by landscape structure (With 2002), connectivity (Minor et
al. 2009), and the presence of dispersal corridors (Leuven et al. 2009). Rapid range
expansion of invasive rodent species, such as the semi-aquatic muskrat (Ondatra
zibethicus) in Europe (Elton 1958, Skyrienė and Paulauskas 2012), when conditions are
advantageous has been documented. Invasive, semi-aquatic rodents have been shown to
follow a general diffusion spread pattern (Reeves and Usher 1989, Lockwood et al.
2007), but isolated (i.e. satellite) populations can serve as “invasion hubs” for invasive
vertebrate species (Florance et al. 2011). Knowledge of the geographic distribution of
suitable habitat for vertebrate invasive species is key to understanding the mechanisms
for potential spread.
The development of habitat suitability models using geographic information
systems (GIS) is an important tool for managing invasive species (Stohlgren and Schnase
2006). These models also can be used to predict future distribution of invasive species
based on climate change projections (Jarnevich and Stohlgren 2009). In general, habitat

- 21 -
suitability models use the current realized niche of a species in one or multiple areas to
predict the current or potential future fundamental niche. However, predicted habitat use
may differ depending upon the modeling approach taken (Elith and Graham 2009).
While many approaches exist, there are currently two primary methods for
modeling habitat suitability. Mechanistic models explicitly incorporate processes thought
to limit species distribution (Kearney and Porter 2009). Species environmental matching
models, or correlative models, relate observed species distributions to a specified set of
spatial environmental parameters (Elith and Leathwick 2009). The availability of GIS
software has made it possible for researchers to create complex spatial models that can be
used to identify suitable habitat for invasive species (Holcombe et al. 2007). The creation
of habitat suitability models can be especially powerful when both mechanistic and
correlative models independently predict similar scenarios (Kearney et al. 2010,
Dormann et al. 2012).
While several studies have focused on nutria distribution at different scales
(Carter and Leonard 2002, Salsamendi et al. 2009), little work has been done on
modeling suitable nutria habitat (Bertolino and Ingegno 2009). The adaptability of the
nutria to a range of biotic conditions (e.g., utilization of a wide variety of food sources,
establishment in areas with low predator pressure, coexistence with sympatric species)
suggests the species is an ideal candidate for a mechanistic approach to model suitable
habitat based on physiological constraints. The relationship between extreme winter
weather and nutria mortality rate has been modeled (Gosling et al. 1983), but the
influence of cold temperatures on the geographical distribution of nutria populations has

- 22 -
not been explicitly tested. The objective of this research was to create a mechanistic
habitat suitability model for nutria based on winter temperatures that can be adapted to
other spatial and temporal scenarios.
STUDY AREA
The geographic area used for model validation encompassed the states of Oregon
and Washington. Using the Pacific Northwest to create a nutria habitat suitability model
offered several advantages over using other regions with nutria populations. First, feral
nutria populations have been established in the region for 75 years and the spatial
distribution of county-level nutria trapping records have remained stable for several
decades (Witmer et al. 2012). This allowed for the assumption that nutria are occupying
all accessible suitable habitat in the region (Jacoby Carter, US Geological Survey,
personal communication). Second, the regional biogeography includes two
longitudinally distinct climate zones created by the Cascade Mountains, resulting in sharp
temperature gradients within a small geographical area (Gale Research Company 1985).
This phenomenon is important because evidence suggests that temperature is a primary
predictor of nutria distribution (Willner et al. 1979, Doncaster and Micol 1990). Third, a
detailed dataset of relative nutria density at the sub-watershed level was available for all
of Oregon and a portion of the state of Washington (Sheffels and Sytsma 2007).
METHODS
Modeling work was completed in partnership with the USGS Invasive Species
Science Program at the Fort Collins Science Center and the USGS National Wetlands
Research Center.

- 23 -
Model criteria.—The process of selecting predictor variables involved a search of
the scientific literature and expert knowledge of nutria biology and ecology. Based on
this information, it was assumed that biotic interactions do not influence the nutria’s
geographic range on a regional level. Two abiotic variables, winter temperatures and
distance to water were determined to be the primary limiting factors for nutria
distribution. The use of nutria life history characteristics to model suitable habitat based
on climate patterns was inspired by the work of Gosling et al. (1983). They simulated the
effect of cold weather on nutria mortality based on the following expression:
∑
where is the length of a continuous run of freezing days and is the number of runs
each winter. Freezing days were defined as 24 hour periods in which the minimum
temperature was < 0 °C and maximum temperature was < 5 °C (Gosling et al. 1983).
The modeling approach differed from Gosling et al. (1983) in that temperature
was evaluated on a monthly temporal scale rather than daily. This approach was used for
two reasons: 1) daily minimum and maximum temperatures interpolated across the region
were not available at an appropriate resolution and 2) the use of readily available monthly
temperature data increased the utility of the model for other applications (e.g., climate
change analysis, post-hoc analysis of past timeframes). The model used the same
temperature thresholds identified by Gosling et al. (1983), so the number of months with
a mean minimum temperature < 0 °C and mean maximum temperature < 5 °C was
calculated. Determination of a distance to water criterion was based on numerous habitat
use studies concluding that nutria do not utilize areas outside the transition zone between

- 24 -
aquatic and upland habitats (Doncaster and Micol 1989, Guichón et al. 2003a, D’Adamo
et al. 2000). This restricted habitat use was represented in the model by establishing a
100 m buffer around all aquatic systems within the study area.
Model creation and validation datasets.—Cold temperature criteria were
extracted from monthly climate data at a 4 km resolution (PRISM Climate Group) for a
five-year period (2003-2007) prior to the date of the sub-watershed nutria presence data.
A five-year period was selected to encompass nutria life span while minimizing variation
of confounding factors (e.g., hunting and trapping pressure, weather patterns). The water
data layer was created by merging flow lines and water bodies extracted from a national
surface water dataset (National Hydrography Dataset Plus) and adding the distance to
water buffer. This water layer was then intersected with the cold temperature layers to
create a predicted geographic area of suitable nutria habitat.
The models were evaluated by comparing the predicted nutria presence to a
regional nutria distribution and relative density map (Appendix A) based on 12-digit
hydrologic units (sub-watersheds up to 40,000 acres) updated from Sheffels and Sytsma
(2007). The validation dataset was previously developed by systematically surveying
local fish and wildlife biologists, and results of the survey from Oregon matched the
geographic distribution of state nutria harvest records from 2003-2007 (Figure 2.1.1).
Hydrologic units for which biologists did not submit reports (either presence or absence)
were excluded from analysis. Only hydrologic units with no extreme cold months over
the specified time period were considered suitable nutria habitat.

- 25 -
Figure 2.1.1. Agreement between a) nutria distribution and relative density survey conducted in 2007 for
state of Oregon and b) Oregon nutria trapping reports from 2003-2007
Evaluation methods.—The zonal statistics tool within the Spatial Analyst
extension in ArcGIS 10.1 (ESRI 2010) was used to extract the minimum and maximum
number of months meeting the temperature criteria (i.e., extreme cold months) within
each hydrologic unit with a reported relative nutria density. These data were summarized
to determine predicted nutria presence (hydrologic units with no extreme cold months)
and absence (hydrologic units with ≥ one extreme cold month) locations in Oregon and
Washington. Predicted nutria presence/absence was compared to the observed nutria
presence/absence dataset to assess model prediction errors. An error matrix was
constructed to calculate prevalence, correct classification rate, sensitivity, specificity,
false positive rate, false negative rate, misclassification rate, kappa, and the true skill
statistic. These measures assess prediction errors of presence/absence models based on
the number of true positive, false positive, false negative, and true negative cases
predicted by the model. Calculations are described in detail elsewhere (Fielding and Bell
1997, Manel et al. 2001, Allouche et al. 2006).

- 26 -
Model performance also was assessed using several visual methods. The
relationship between relative nutria density and the number of extreme cold months was
graphed to visualize trends. Model parameters were applied to the contiguous United
States and compared to national nutria distribution reported by Bounds (2000) and Carter
and Leonard (2002). The physiological model also was compared with preliminary
results of a global correlative modeling approach using Maxent (Phillips et al. 2006)
being conducted in partnership with the US Geological Survey. Maxent model results
will be presented in future manuscripts, but a preliminary qualitative comparison was
made to assess whether a different modeling approach on a worldwide scale yielded
similar results.
Predictor variables used for the Maxent models were minimum temperature of
coldest month, maximum temperature of warmest month, mean diurnal temperature
range, annual precipitation, precipitation seasonality, and precipitation of warmest
quarter. Four methods for background point selection were used: random, random within
countries with known nutria populations, kernel density estimation of weighted surface
around presence locations, and the use of the Echimyidae family as a target group. The
Maxent approach finds the largest spread (i.e., maximum entropy) of presence locations
in relation to the background environmental variables. A detailed explanation of Maxent
modeling approaches can be found elsewhere (Phillips et al. 2006, Elith et al. 2011).
RESULTS
The number of months that met the extreme cold temperature criteria within a
sub-watershed between 2003-2007 ranged from 0-41 months. All suitable habitat (i.e.,

- 27 -
12-digit hydrologic units with no extreme cold months from 2003-2007) was located west
of the Cascade Mountains (Figure 2.1.2) and extended westward to the Pacific Ocean.
Suitable habitat was predicted across the latitudinal range from the southern border of
Oregon to the northern border of Washington. The total area of predicted suitable habitat
with no extreme cold months was 90,553 km2. Restricting suitable habitat to areas within
100 m of water reduced suitable habitat by 45% to 49,955 km2 (Figure 2.1.2).
Figure 2.1.2. Predicted suitable habitat (in black) for nutria in Oregon and Washington in 2007 based on a)
no months with mean minimum temperature < 0 °C and mean maximum temp < 5 °C in previous five years
and b) no months with mean minimum temperature < 0 °C and mean maximum temp < 5 °C in previous
five years and habitat within 100 m of water
The model performed well predicting suitable nutria habitat based on comparison
with the known nutria distribution dataset, though model accuracy was influenced by the
statistic used to summarize the number of extreme cold months within 12-digit
hydrologic units (Table 2.1.1). The overall correct classification rate was 89-90%
regardless of the summary statistic (i.e., minimum, maximum, mean, median) used, but

- 28 -
model sensitivity and specificity was more variable. The median number of extreme cold
months, based on a count of 16 km2 cells, within 12-digit hydrologic units was ultimately
used to evaluate the model because it represents the most common (i.e., largest
proportion of area) number of extreme cold months within a sub-watershed. The median
number of cold months correctly predicted 87% of nutria presence locations (sensitivity)
and 90% of absence locations (specificity). The true skill statistic (sensitivity +
specificity – 1), which is calculated independently of species prevalence across space,
was 0.774.
Table 2.1.1. Quantitative assessment of the accuracy of the mechanistic nutria habitat suitability model in
predicting nutria presence in the Pacific Northwest based on 2003-2007 temperature data
Measure of Accuracy* Summary statistic for # of extreme cold months with a hydrologic unit
Minimum Maximum1 Mean
1 Median
Prevalence 0.131 0.131 0.131 0.131
Correct classification rate 0.890 0.899 0.899 0.899
Sensitivity 0.954 0.685 0.685 0.870
Specificity 0.880 0.931 0.931 0.903
False positive rate 0.120 0.069 0.069 0.097
False negative rate 0.046 0.315 0.315 0.130
Misclassification rate 0.110 0.101 0.101 0.101
Kappa 0.633 0.581 0.581 0.636
True skill statistic 0.833 0.616 0.616 0.774
*calculations described in detail in Fielding and Bell (1997) and Allouche et al. (2006) 1 equal because hydrologic unit with maximum # cold of months = 0 also has mean # of cold months = 0
Reported nutria density was also strongly associated with the number of extreme
cold months (Figure 2.1.3, Appendix A). Cells with no extreme cold months were
recorded in 99.7% (307/308) of 12-digit hydrologic units with medium and high nutria
densities. Cells with extreme cold months were only recorded in 8.4% (10/119) of
hydrologic units with high nutria densities. Conversely, all but 11.7% (399/3422) of
hydrologic units with no nutria populations had cells with five or more extreme cold
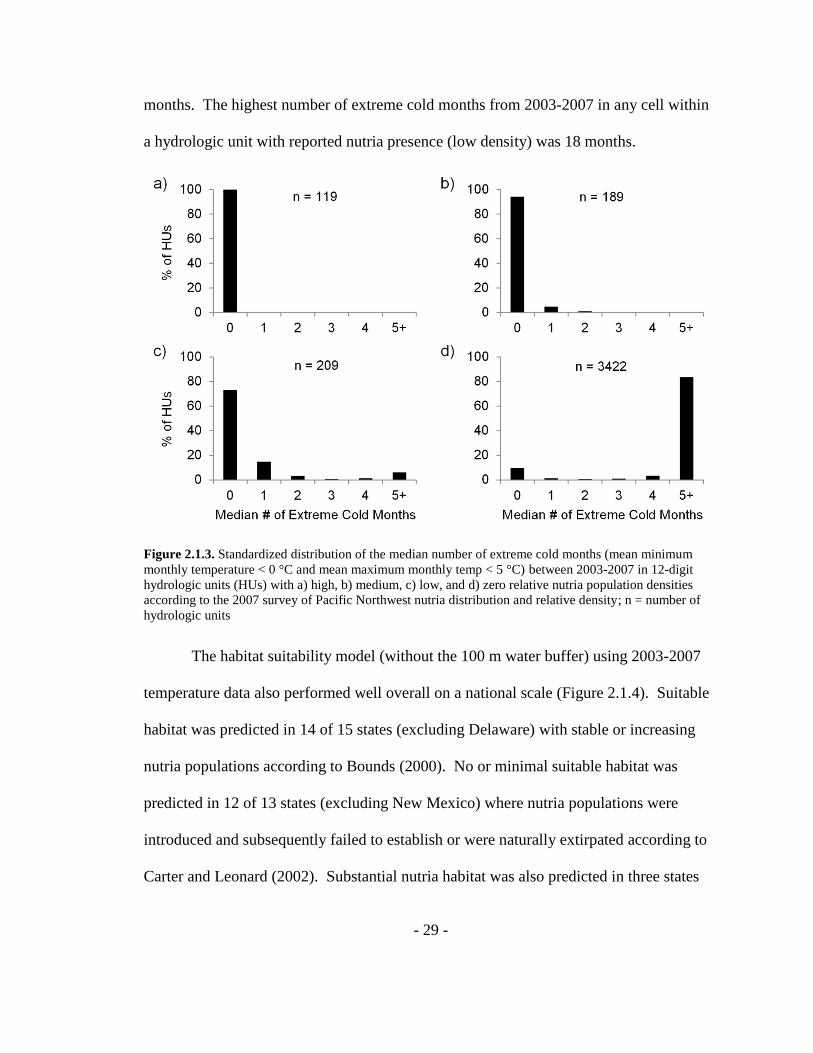
- 29 -
months. The highest number of extreme cold months from 2003-2007 in any cell within
a hydrologic unit with reported nutria presence (low density) was 18 months.
Figure 2.1.3. Standardized distribution of the median number of extreme cold months (mean minimum
monthly temperature < 0 °C and mean maximum monthly temp < 5 °C) between 2003-2007 in 12-digit
hydrologic units (HUs) with a) high, b) medium, c) low, and d) zero relative nutria population densities
according to the 2007 survey of Pacific Northwest nutria distribution and relative density; n = number of
hydrologic units
The habitat suitability model (without the 100 m water buffer) using 2003-2007
temperature data also performed well overall on a national scale (Figure 2.1.4). Suitable
habitat was predicted in 14 of 15 states (excluding Delaware) with stable or increasing
nutria populations according to Bounds (2000). No or minimal suitable habitat was
predicted in 12 of 13 states (excluding New Mexico) where nutria populations were
introduced and subsequently failed to establish or were naturally extirpated according to
Carter and Leonard (2002). Substantial nutria habitat was also predicted in three states

- 30 -
(Arizona, Nevada, and South Carolina) where nutria have never been introduced and
have failed to disperse (Carter and Leonard 2002) and in California, where nutria have
been eradicated (Deems and Pursley 1978).
Figure 2.1.4. Geographical extent of predicted suitable nutria habitat (based on 2003-2007 mechanistic
model) in the contiguous United States compared to status of nutria populations by state as described by
Bounds (2000) and Carter and Leonard (2002)
The mechanistic habitat suitability model also produced similar results in the
Pacific Northwest to preliminary global Maxent models currently being developed by US
Geological Survey. All four Maxent background point selection methods predicted the
most suitable habitat being restricted to the geographic area west of the Cascade
Mountains (Figure 2.1.5). Additionally, all four models ranked the minimum
temperature of the coldest month variable as the most important predictor for determining
suitable nutria habitat.

- 31 -
Figure 2.1.5. Geographic area in Pacific Northwest predicted suitable for nutria by preliminary worldwide
Maxent models using four methods for selecting global background points: a) random, b) random within
countries with known nutria populations, c) kernel density estimation of weighted surface around presence
locations, and d) target group: Echimyidae
DISCUSSION
The mechanistic model performed well matching predicted suitable habitat with
known nutria distribution in the Pacific Northwest and the contiguous United States.
These results provide solid evidence that extreme cold weather is the primary factor
limiting nutria distribution. This conclusion is further supported by the correlative
Maxent models resulting in similar predictions using a larger geographical area and a
completely different modeling approach. While additional predictor variables (e.g., land
use, vegetative cover) may increase in importance as the geographic area of interest
becomes more localized, model results suggest that winter temperatures and distance to
water are the most important predictors of suitable nutria habitat on a regional scale.
The mechanistic model results were grouped as binary outcomes: suitable habitat
or unsuitable habitat. This approach fit the data well in the Pacific Northwest and
simplified the analysis, but in reality a gradient exists in which some areas could be
categorized as marginal habitat. For example, the model at the national scale predicted
that the state of Delaware contained no suitable habitat while Bounds (2000) reported that

- 32 -
a stable nutria population existed there in 2000. However, no nutria populations were
confirmed in the state from 2002-2012 until a population was recently discovered by a
local landowner (Delaware Department of Natural Resources and Environmental Control
2012). Delaware is likely marginal habitat for nutria, and populations may be severely
reduced or extirpated by unusually harsh winters. In the Pacific Northwest, the eastern
boundary of current distribution could represent shifting marginal habitat. For example,
trapping records show a small nutria population was present in the Yakima Valley,
Washington, east of the Cascades in the 1970s-1980s, but unusually harsh winters
reportedly extirpated this population (George Brady, Washington Department of Fish and
Wildlife [retired], personal communication).
There are several factors that may explain the discrepancies between predicted
suitable habitat and known geographic distribution of nutria populations on a national
scale. A follow up to Carter and Leonard (2002), as well as records in the Nonindigenous
Aquatic Species Database (United States Geological Survey 2004), revealed that nutria
are present in small numbers in New Mexico (Jacoby Carter, US Geological Survey,
personal communication) as predicted by the model. It is likely that nutria are absent
from Arizona and Nevada because there are no aquatic dispersal routes into these states
(Jacoby Carter, US Geological Survey, personal communication). In South Carolina,
nutria may be excluded because of high predation pressure from an abundant population
of large alligators (Jacoby Carter, US Geological Survey, personal communication).
The model performed better predicting nutria presence than absence. Physical
barriers for nutria dispersal likely played a role in the false positive rate being higher than

- 33 -
the false negative rate. For example, the model predicted suitable habitat in Curry,
Josephine, and Jackson Counties in southwestern Oregon. However, the nutria
distribution survey and trapping records both indicate that nutria are not present in these
counties. The probable explanation is that there are no dispersal routes available for
nutria to reach suitable habitat in these areas. Southwestern Oregon is a rugged region,
and Curry, Josephine, and Jackson Counties are separated from the counties to the north
by the Rogue-Umpqua Divide Wilderness Area. This mountainous terrain is a natural
southern barrier to nutria dispersal. However, the model provides evidence that nutria
will likely be able to survive farther south than the current distribution if individuals find
a dispersal route or are introduced into the southwestern region of Oregon.
The habitat suitability model predictions also can provide valuable information on
locations where undiscovered nutria populations could persist now or in the future. For
example, a previously unknown nutria population was discovered in 2005 in Skagit
County, Washington, near the Canadian border (Davison and Bohannon 2005). The
location of this population is predicted as suitable habitat by the mechanistic model. It is
likely that other unknown populations are present in the Pacific Northwest, and the
habitat suitability model can be used to target regions most likely to harbor these
populations. Similarly, running the model parameters with projected future climate
datasets could identify potential new areas of suitable habitat for nutria populations in the
future and again provide information about geographic regions where monitoring
resources should be focused.

- 34 -
The model also has applications for other geographic regions and species. For
example, non-native nutria are known to grow larger than nutria in their native South
American range (Guichón et al. 2003c). The model could be applied to the native range
to assess whether nutria follow the ecogeographic pattern of larger individuals inhabiting
colder climate regions at the intraspecific level (Rensch 1938, James 1970). The model
could also be used to assess the invasion potential for nutria in colder climate regions,
such as eastern Europe where captive nutria populations are bred for fur and meat
production (Mertin et al. 2003, Bănăţean-Dunea et al. 2010). The simplicity of the model
also increases its relevance for other species. For example, the combined climate-
hydrologic network model framework could be adapted using other abiotic factors to
assess suitable habitat for other invasive species, such as the emerald ash borer (Agrilus
planipennis) and Burmese python (Python molurus bivittatus), known to be limited by
cold temperatures (Crosthwaite et al. 2011, Dorcas et al. 2011).
Section 2. Use of a mechanistic habitat suitability model to create a first
approximation of the potential impact of climate change on nutria distribution
Global greenhouse gas emissions are projected to continue increasing for several
decades, resulting in continued warming temperatures (Intergovernmental Panel on
Climate Change 2007). Climate change and invasive species are often viewed as separate
threats to biodiversity, but the synergistic effects of these threats must be studied (Brook
2008). For example, the mechanisms associated with invasive species introduction,
colonization, establishment, and spread are likely to be influenced by future climate

- 35 -
(Sutherst 2000). While invasive vertebrates are often capable of rapid adaptations for
dispersal (Alford et al. 2009), there are few examples of potential range shifts in invasive
vertebrates in response to climate change (Brook 2008).
Most studies of the impact of climate change on vertebrate organisms have
focused on native species for conservation purposes (Fordham et al. 2012). Within the
field of invasion ecology, the research focuses on the potential for new invasions as a
result of changing climates (Dukes and Mooney 1999, Rahel and Olden 2008). However,
there are also many potential consequences of climate change for existing invasive
species including the alteration of climatic constraints, distribution, and effectiveness of
management strategies (Hellmann et al. 2008). Coupling current species distribution
models and climate change models is a powerful tool to assess potential range shifts of an
invasive species and to develop more informed management strategies based on potential
changes (Jeschke and Strayer 2008).
No studies to date have examined the potential future distribution of nutria
populations in non-native ranges. Nutria distribution in the Pacific Northwest and
elsewhere is likely to be affected by climate change because modeling work highlighted
in the previous section of this chapter identifies winter temperatures as a primary
predictor of suitable habitat. The objective of this research was to model future suitable
nutria habitat in the Pacific Northwest and throughout the contiguous United States as a
first approximation of the impact of climate change on the geographic shift of potential
nutria distribution.

- 36 -
METHODS
Climate change modeling work was completed in partnership with the USGS
Invasive Species Science Program at the Fort Collins Science Center and the USGS
National Wetlands Research Center.
Model criteria.—The same extreme cold month (mean minimum < 0 °C and mean
maximum < 5 °C) temperature and distance to water criteria outlined in the previous
section of this chapter were used to delineate suitable nutria habitat for the Pacific
Northwest. Hydrology was not included as a predictor variable on the national scale
because the goal was a first approximation model. The global climate change model used
for analysis was the third version of the Coupled Global Climate Model (CGCM3_T47),
downscaled at 1 km resolution, produced by the Canadian Centre for Climate Modelling
and Analysis (Flato et al. 2000). This model was selected because it demonstrated the
best overall performance for the Pacific Northwest region out of 20 global climate change
models evaluated by Mote and Salathé (2010).
Winter temperatures predicted for both A2 and A1B greenhouse gas emissions
scenarios, described in the Special Report on Emissions Scenarios (Intergovernmental
Panel on Climate Change 2000), were available. There were negligible differences
between the two scenarios for the spatial and temporal scales of interest. The available
A1B dataset was more comprehensive, so the A1B scenario was used to identify potential
suitable nutria habitat through the 2050s. Total land area values were obtained from
2000 Census data (United States Census Bureau 2004).

- 37 -
RESULTS
The climate change model predicted substantial increases in suitable nutria habitat
for both the Pacific Northwest and the contiguous United States (Table 2.2.1, Figure
2.2.1). The model predicted that 94% of the total area in the Pacific Northwest would
exhibit winter temperatures warm enough for nutria to persist by the 2050s. The full
model with the 100 m water buffer predicted 39% of the total area as suitable habitat,
representing a 240% increase over current conditions. The predicted increase in total
area warm enough for nutria throughout the contiguous United States for the same time
period was 118%, encompassing 81% of the total area. Since the model is a first
approximation, the water buffer was not included in the national model.
Table 2.2.1. Potential impact of climate change on the geographical extent of suitable nutria habitat in the
Pacific Northwest and contiguous United States from the present (based on 2003-2007 mechanistic model
of suitable nutria habitat) through the 2050s
Suitable Habitat Pacific Northwest Contiguous United States*
Current 2020s 2050s Current 2020s 2050s
Total land area (km2) 439,470 439,470 439,470 8,080,465 8,080,465 8,080,465
Suitable habitat area (km2) 49,955 156,051 169,805 3,004,895 5,851,637 6,547,305
Suitable habitat area (%) 11.4 35.5 38.6 37.2 72.4 81.0
Increase from current habitat (%) 0.0 212.4 239.9 0.0 94.7 117.9
Increase from previous time period (%) n/a 212.4 8.8 n/a 94.7 11.9
*suitable habitat on national scale represents temperature model only and does not include water buffer
The orientation of the geographic shift in potential suitable nutria habitat differed
between the Pacific Northwest and the contiguous United States. The predicted increase
in suitable habitat in Oregon and Washington occurred longitudinally, while predicted
increase in suitable habitat on a national scale was latitudinal. Suitable nutria habitat by
the 2050s was predicted in every county in Oregon and Washington and all states in the
contiguous United States except North Dakota, Minnesota, and Wisconsin.

- 38 -
Figure 2.2.1. Potential impact of predicted climate change on the geographic distribution of suitable nutria
habitat from the present (based on 2003-2007 mechanistic model of suitable nutria habitat) through the
2050s in the a) Pacific Northwest and b) contiguous United States; suitable habitat on national scale
represents temperature model only and does not include water buffer
DISCUSSION
Model results suggest that nutria populations could extend their range
substantially both in the Pacific Northwest and the contiguous United States in the future.
While the availability of water will restrict suitable habitat on a local and regional level,
the model predicts the only large-scale areas that will remain unsuitable by the 2050s will
be at extreme elevations (e.g., Rocky Mountains) and the northernmost latitudes. Most of
the increase in suitable area, particularly in the Pacific Northwest, was predicted to occur
by the 2020s with minimal further expansion through the 2050s. This suggests a large
portion of the Pacific Northwest that currently represents marginal nutria habitat could
soon become suitable habitat with only a 1-2 °C increase in mean temperatures (Mote and
Salathé 2010). The predicted increase in suitable habitat moving north across the United
States concurs with observations of latitudinal shifts for cold-limited species across
several taxonomic groups in Great Britain (Hickling et al. 2006).
- 39 -
The climate change model represents a first approximation of suitable nutria
habitat, but it should be noted that some geographic areas predicted as suitable in the
future (i.e., winter temperatures will be warm enough for nutria to persist) may not be
accessible to nutria. For example, nutria are semi-aquatic animals, so land area without
surface water will remain unsuitable regardless of climate. There also may be future
suitable areas where nutria will not be able to disperse because of geographic barriers
(e.g., mountain ranges with sharp elevation gradients). Finally, it should be noted that the
A1B emissions scenario used in the analysis assumes 1) rapid economic growth, 2) a
global population reaching 9.0 billion by 2050 and then gradually declining, 3) a
convergent world, and 4) the quick spread of new and efficient technologies with a
balanced emphasis on all energy sources (Intergovernmental Panel on Climate Change
2000). Divergence from these assumptions may substantially alter the magnitude of
increasing temperatures.
Despite many assumptions and the absence of additional predictor variables,
model results clearly demonstrate that climate change could result in a substantial
increase in the potential range of non-native nutria populations in the Pacific Northwest
and throughout the contiguous United States. In Oregon and Washington, the potential
establishment of nutria populations east of the Cascade Mountains could be a major
economic concern. Agriculture is a primary economic sector east of the Cascade Range
in both Oregon and Washington, and regional nutria populations are known to cause
damage to crops ranging from grains to fruit trees (Kuhn and Peloquin 1974).

- 40 -
Nutria would not be able to persist in much of eastern Oregon and Washington
because of a lack of surface water. However, there are 1.3 million acres of irrigated
cropland in Oregon and 1.6 million acres in Washington (US Department of Agriculture
2009), a majority of which is located east of the Cascade Mountains where precipitation
levels are low. Agricultural land with surface irrigation canals and reservoirs could
potentially support nutria populations (Evans 1970, LeBlanc 1994), especially given that
adjacent agricultural crops would provide an accessible food source (Ellis 1963, Willner
et al. 1979). The establishment of nutria populations in these habitats would likely result
in nutria becoming a pest species for eastern Oregon and Washington farmers.
Non-native nutria populations are not considered to have a maximum temperature
threshold, as populations are found in desert wetlands in Texas (Milholland et al. 2010).
This physiological tolerance led to the model predicting a retention of suitable habitat
along the current southern distribution boundary in the contiguous United States. A
similar pattern was observed for a disease-transmitting European tick (Ixodes ricinus)
where less extreme winter temperatures led to northward expansion of the geographic
distribution limit while the southern boundary was retained (Lindgren et al. 2000).
However, a wide range of terrestrial organisms across taxonomic levels are exhibiting
rapid range shifts in response to warming temperatures where both northern and southern
boundaries are shifting to higher latitudes (Chen et al. 2011). This suggests a potential
change in biotic interactions for nutria as species assemblages continue to shift.

- 41 -
CHAPTER 3
ASSESSING ACTIVITY AND MOVEMENT PATTERNS
Section 1. Nutria activity and movement patterns in metropolitan habitats in the
Pacific Northwest
Metropolitan areas are rapidly expanding worldwide. Global urban populations
grew at an annual rate of 2.6% from 1950-2011, and the global level of urbanization (i.e.,
proportion of people living in cities and surrounding suburbs) is projected to increase
from 52% in 2011 to 67% by 2050 (United Nations Department of Economic and Social
Affairs 2012). This increasing urbanization has implications for wildlife species utilizing
metropolitan areas. Many species adapt their behavior in these habitats to avoid or limit
contact with humans (Ditchkoff et al. 2006). At the other end of the spectrum, some
species become habituated and even attracted to humans (Whittaker and Knight 1998).
Mammal spatial and temporal activity patterns can be influenced by many human
activities (Luniak 2004), and behavior shifts are species-dependent. Banded mongoose
(Mungos mungo) utilizing garbage dumps as feeding sites maintained smaller core areas
within their home ranges (Gilchrist and Otali 2002), while North American elk (Cervus
elaphus) increased travel in response to off-road recreation activities (Naylor et al. 2009).
Bobcats in an urban nature reserve shifted to nocturnal activity in areas with high human
use (George and Crooks 2006), while the striped field mouse (Apodemus agrarius)
shifted to diurnal activity in urban parks (Luniak 2004). Understanding urban-specific
behavior patterns is important for conserving biodiversity (Sutherland 1996) and limiting
adverse effects of invasive species (Holway and Suarez 1999) in these habitats.

- 42 -
Nutria in their native range avoid humans (Leggieri et al. 2011), but there is
evidence that non-native nutria populations habituate to human activities (Meyer 2005).
Although non-native nutria populations are present in developed areas, few studies have
assessed nutria behavior in urban landscapes (Denena et al. 2003, Towns et al. 2003,
Carter et al. unpublished data). Additionally, no research has been conducted on activity
and movement patterns of non-native nutria populations in the Pacific Northwest despite
the presence of the species in the region for 80 years. Understanding nutria behavior has
been shown to be important for habitat and region-specific control efforts (Gosling and
Baker 1989). Objectives of this research were to 1) determine daily activity patterns of
local nutria populations in metropolitan habitats in the Pacific Northwest and 2) assess
the extent of individual and group movement within regional metropolitan habitats.
STUDY AREA
The study was conducted within the Lower Tualatin River Watershed on the west
side of the Portland, Oregon, metropolitan area. The regional climate is characterized by
cool, wet winters and warm, dry summers. Most of the 100 cm of annual precipitation
falls between October and March (Oregon Climate Service 2012). The Lower Tualatin
River Watershed drains 250 km2, and over 50% of the area is classified as urban use
(Tualatin River Watershed Council 2001). A watershed restoration program is underway
to reduce water temperatures and increase spawning fish habitat (Smith and Ory 2005).
Nutria are prevalent throughout the basin, including the metropolitan area
encompassing the northeastern portion of the watershed. Trapping is employed as a
strategy for population control, particularly within habitat restoration sites, to limit soil
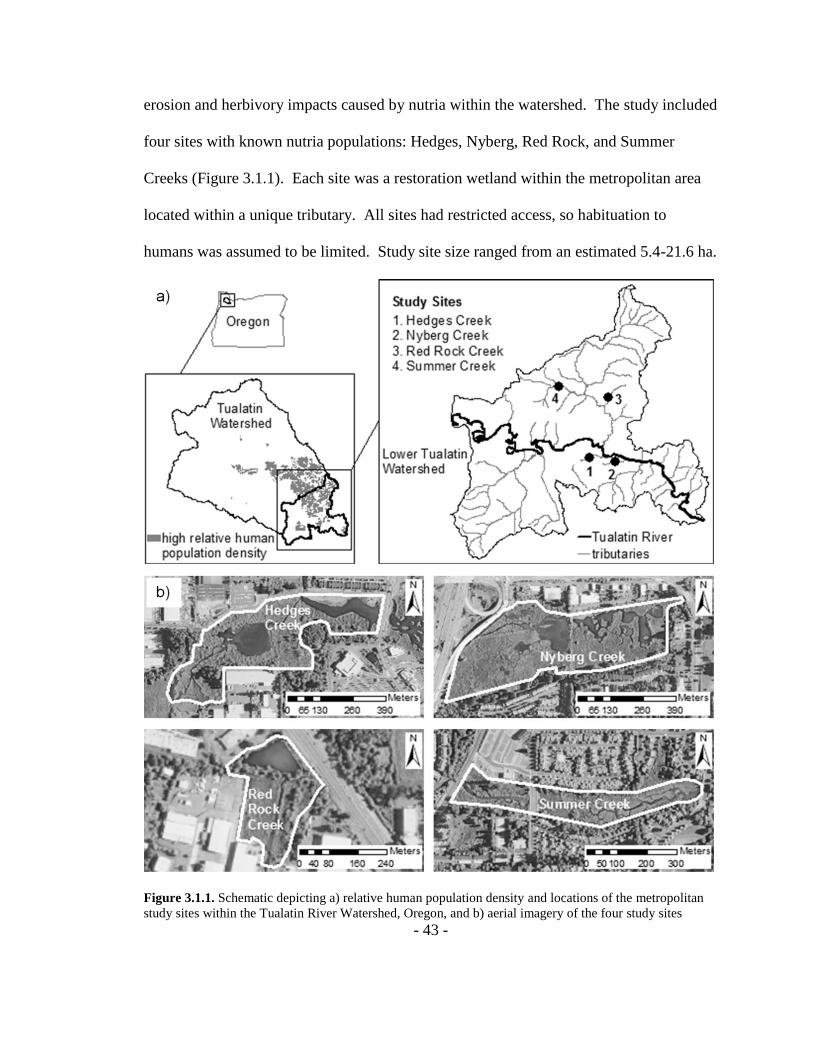
- 43 -
erosion and herbivory impacts caused by nutria within the watershed. The study included
four sites with known nutria populations: Hedges, Nyberg, Red Rock, and Summer
Creeks (Figure 3.1.1). Each site was a restoration wetland within the metropolitan area
located within a unique tributary. All sites had restricted access, so habituation to
humans was assumed to be limited. Study site size ranged from an estimated 5.4-21.6 ha.
Figure 3.1.1. Schematic depicting a) relative human population density and locations of the metropolitan
study sites within the Tualatin River Watershed, Oregon, and b) aerial imagery of the four study sites

- 44 -
METHODS
Nutria capture and handling.—After pre-baiting for several days to improve
trapping success (LeBlanc 1994), five cage traps (Havahart® model #1045) were used at
each site to capture study animals in August 2011. Traps were placed in areas with signs
of nutria activity, baited with apples and carrots, and checked daily. Animal sex and
body mass were recorded for captured nutria. Passive integrated transponder tags were
injected into the right hind quarter to permanently identify each individual. Each nutria
was fitted with a very high frequency (VHF) radio-telemetry transmitter and released at
the site of capture after it demonstrated full recovery from handling. VHF technology
was selected over GPS technology because the lower cost per unit allowed for a larger
sample size and greater ability to assess variation (Girard et al. 2006). Transmitter
design, attachment, and performance are described in detail in the next section.
Animal handling protocols were approved by the Portland State University
Institutional Animal Care and Use Committee (Protocol #: psu11.03.01.1). Nutria
trapping was conducted under a scientific take permit from the Oregon Department of
Fish and Wildlife (permit #: 012-11). All capture and handling procedures were in
accordance with Sikes et al. (2011).
Nutria activity and movement monitoring.—A remote data logging station was
established at a central location within each of the four sites to continuously monitor
nutria activity from August-December 2011. A station consisted of a VHF telemetry
receiver/data logger (Advanced Telemetry Systems, model R4500SD) fitted with an
omnidirectional dipole antenna. Stations were powered by a 12-volt deep cycle marine

- 45 -
battery connected to a 65-watt solar panel. The receiver/data logger units, housed within
a waterproof case (Pelican™, model 1460), were programmed to cycle through all
transmitter frequencies continuously and log the strongest signal of each frequency at five
minute intervals. These data were used to evaluate nutria activity patterns by calculating
the magnitude of signal change throughout the 24 hour day. Control transmitters also
were used to ensure that signal strength drift did not exhibit temporal patterns.
Handheld receivers (Advanced Telemetry Systems, model R410) were used to
triangulate nutria locations within two randomly selected sites: Hedges Creek and Red
Rock Creek. Locations were always determined during the four hour window after
sunset, which was identified as the period of highest activity according to baseline data
from the remote data logging stations. Field visits to collect animal locations were
conducted approximately twice weekly from September-November 2011, and only one
location was determined for each animal during a site visit. Determining animal
locations involved two researchers simultaneously using handheld receivers and Yagi
antennas from permanently established stations to take compass bearings in the direction
of strongest signal strength for each frequency. The point where the bearings intersected
was plotted as the animal location using the Google Earth 6.1 platform (Google 2011).
Researchers moved between stations to create more perpendicular bearing angles to
increase precision. Handheld receivers were also used to recover transmitters after a
mortality signal indicated the unit had not moved for at least the previous eight hours.
Statistical methods.—Signal strength data from the receiver/datalogger units were
manipulated to assess daily activity patterns. Absolute change in signal strength

- 46 -
magnitude was calculated individually for each frequency (i.e., individual) and grouped
by hour of day. Hourly activity levels (AL) for each individual were then rescaled to
allow for comparisons between months and sites according to the following formula:
| | | |
where ssm = signal strength magnitude, h = hour of day, and H = hour of day with
highest activity level, therefore giving the hour of highest activity for an individual a
value of 100 for the factor (i.e, site, month) of interest. Mean hourly activity levels of all
individuals were then calculated by site and month. Monthly analyses only included
individuals with ≥ 20 signal detections for every hour of the day during the respective
month. Variability in activity levels was assessed with 95% confidence intervals.
The middle date of the month was used to delineate time of sunrise and sunset for
each month. Nocturnal and diurnal nutria activity levels in the first (August) and last
(December) months were compared using Student’s paired t-tests. Twilight hours,
defined as 0.5 hours before and after sunrise and sunset were excluded from analysis to
avoid potential misclassification. A one-way repeated measures ANOVA was used to
compare the effect of time on mean activity level for each study month. A subset
consisting of all animals with transmitters still attached in December (n = 8) was used to
achieve a balanced repeated measures ANOVA design. A Tukey post-hoc test was used
to conduct a multiple comparison of means. Linear correlation was used to assess the
relationship between December daily minimum temperatures and nutria activity levels.
Movement was assessed by calculating distance between capture/release and
transmitter recovery locations and spatial area utilized. Linear (i.e., shortest) distance

- 47 -
traveled from capture/release to transmitter recovery locations was used to isolate any
long-distance dispersal events and was evaluated between sites by calculating 95%
confidence intervals. A Student’s t-test was used to compare linear distance between
males and females, and linear correlation was used to assess the relationship between
body mass and linear distance traveled. A two-tailed alpha of 0.05 was used.
Spatial area utilized was calculated using both the minimum convex polygon
(MCP) deterministic method and the fixed kernel density estimation (KDE) probabilistic
method. The MCP method (Mohr 1947) delineates a polygon area that encloses all
animal location points by creating a series of convex angles connecting the outer animal
location points. The KDE method (Silverman 1986), described in detail elsewhere
(Worton 1989, Seaman and Powell 1996), essentially uses the density of animal location
points to create a histogram that represents the probability of finding an animal within a
defined area. Bandwidth for the fixed kernel was set at 500 m after trial and error
showed it to be the most biologically appropriate buffer (i.e., restricted utilized area to
suitable habitat types without excessive fragmentation), and cell size was fixed at 1.0 m2.
Both area utilization methods were calculated using Geospatial Modelling Environment
Version 0.7.2.1 (Beyer 2012), and ArcGIS 10.1 (ESRI 2010) was used to display results.
Spatial area utilized was calculated for the study populations at Hedges Creek and
Rock Creek, as well as individual animals at these sites with ≥ 20 location points (n = 7).
Animals with < 20 location points were excluded due to inadequate sample size for
kernel estimates (Blundell et al. 2001). The MCP method was used to characterize
movement range, while the KDE method was used to calculate the utilization distribution

- 48 -
(i.e., probability of animals being within specified spatial zones). Isopleth lines at 25%,
50%, and 95% were calculated. The standard convention of using the 50% isopleth line
to characterize the core activity zone was followed (Laver and Kelly 2008). Descriptive
statistics were calculated to summarize utilization area results grouped by site and sex,
but inferential tests were not conducted because of inadequate sample size. Linear
correlation was used to assess the relationship between utilization area and body mass.
RESULTS
A total of 30 nutria were captured at the four sites (Appendix B). Daily nutria
activity patterns were similar across sites, so between-site data were pooled. Nutria were
consistently active during the day throughout the study. The study populations at all four
sites exhibited a sharp decrease in activity in the period associated with sunrise and a
smaller activity peak after sunset. Decreased activity associated with sunrise was most
pronounced at Nyberg Creek and least pronounced at Red Rock Creek (Figure 3.1.2).
The diurnal:nocturnal activity level ratio (i.e., proportion of diurnal activity compared to
nocturnal activity level) ranged from 0.83:1 in October to 1.35:1 in December.
Overall activity patterns were similar in August-October, began to shift to higher
activity before sunset in November, and shifted noticeably to lower activity after sunset
in December (Figure 3.1.3). There was no difference in diurnal activity from August to
December (t7 = 0.92, P = 0.390), but a significant decrease in nocturnal activity was
detected (t7 = 4.71, P = 0.002). There also was a significant effect of month on the mean
activity level of individuals (n = 8) that still had active transmitters in December (F4,28 =
4.58, P = 0.006). Tukey post-hoc analysis indicated that mean activity in both September
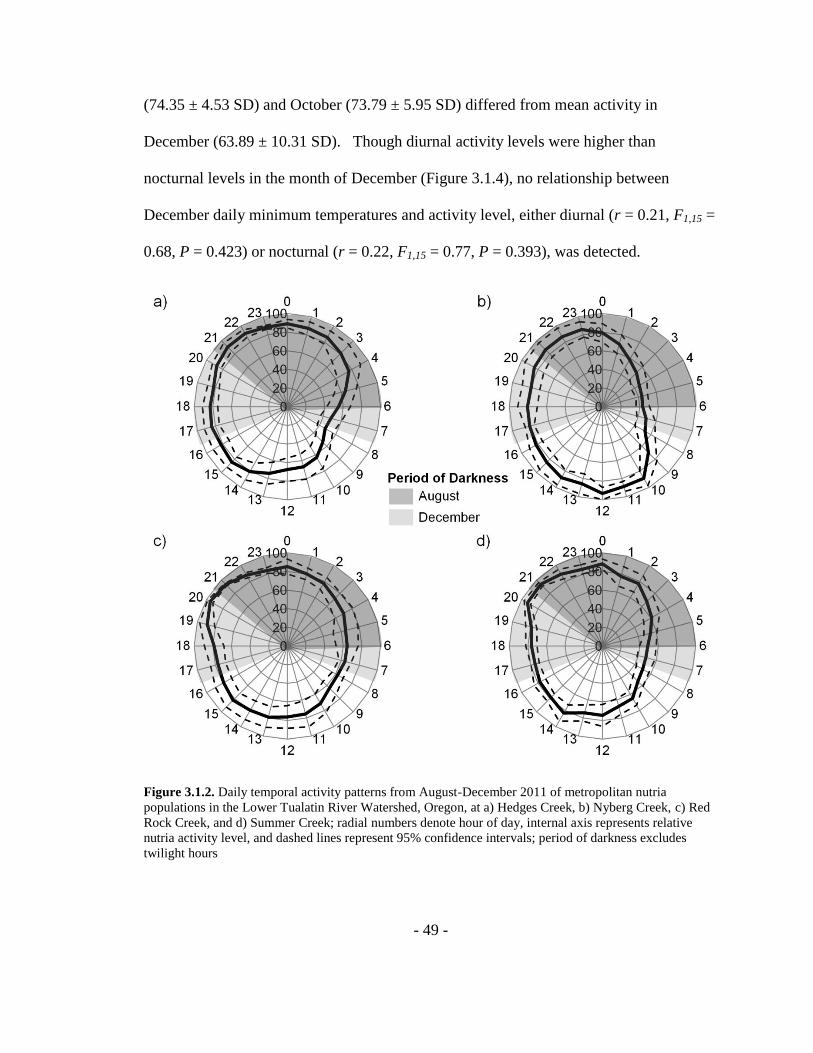
- 49 -
(74.35 ± 4.53 SD) and October (73.79 ± 5.95 SD) differed from mean activity in
December (63.89 ± 10.31 SD). Though diurnal activity levels were higher than
nocturnal levels in the month of December (Figure 3.1.4), no relationship between
December daily minimum temperatures and activity level, either diurnal (r = 0.21, F1,15 =
0.68, P = 0.423) or nocturnal (r = 0.22, F1,15 = 0.77, P = 0.393), was detected.
Figure 3.1.2. Daily temporal activity patterns from August-December 2011 of metropolitan nutria
populations in the Lower Tualatin River Watershed, Oregon, at a) Hedges Creek, b) Nyberg Creek, c) Red
Rock Creek, and d) Summer Creek; radial numbers denote hour of day, internal axis represents relative
nutria activity level, and dashed lines represent 95% confidence intervals; period of darkness excludes
twilight hours

- 50 -
Figure 3.1.3. Overall daily temporal activity patterns of metropolitan nutria populations in the Lower
Tualatin River Watershed, Oregon, in a) August, b) September, c) October, d) November, and e) December
2011; radial numbers denote hour of day, internal axis represents relative nutria activity level, dashed lines
represent 95% confidence intervals, and n = # of study animals with active transmitters; period of darkness
excludes twilight hours

- 51 -
Figure 3.1.4. Relationship between daily minimum temperature and a) diurnal and b) b nocturnal activity
levels of metropolitan nutria populations in the Lower Tualatin River Watershed, Oregon, in December
2011; error bars denote 95% confidence intervals
Linear distance traveled between the capture/release location and transmitter
recovery location ranged from 13-1452 m (Table 3.1.1). No difference (t23 = 1.41, P =
0.170) in mean linear distance between males (mean = 373 m ± 119 m [SE]) and females
(mean = 169 m ± 58 m [SE]) was detected. Similarly, no significant relationship between
animal body mass and linear distance was observed (r = 0.23, F1,25 = 1.44, P = 0.242).
Overall mean linear distance was 272 m ± 68 m [SE]. Pairwise comparisons using 95%
confidence intervals showed that mean linear distance was higher at Summer Creek than
Red Rock Creek, but no other pairwise differences were observed (Table 3.1.1).
Table 3.1.1. Comparison of population characteristics and linear distance traveled from point of
capture/release to point of radio-transmitter recovery between four metropolitan wetland sites in the Lower
Tualatin River Watershed, Oregon
Site Population Characteristics Linear Distance Traveled (m)*
Sex ratio (M:F) Mean body mass (kg) Mean Minimum Maximum 95% CI
Hedges 4:3 4.1 162 13 426 59-265
Nyberg 2:5 5.2 138 18 365 40-235
Red Rock 4:3 3.2 131 73 215 83-179
Summer 6:1 6.0 574 38 1452 204-945
*distance between capture/release site and transmitter recovery site

- 52 -
All radio-locations at Hedges Creek and Red Rock Creek were located in the
immediate vicinity of the restoration wetland areas (Figure 3.1.5). The known nutria den
sites discovered during field visits (an abandoned beaver lodge at Hedges Creek and a
series of burrows in a narrow channel at Red Rock Creek) at both study sites were located
within the overall core utilization areas (50% isopleth) of the study populations. These
dens were located adjacent to open water areas within both sites (Figure 3.1.5). The
spatial pattern of core utilization areas for individual nutria with ≥ 20 radio-locations
showed a relatively higher degree of overlap at Red Rock Creek compared to Hedges
Creek (Figure 3.1.6).
The overall study population utilization area was 19.4 ha at Hedges Creek and
13.5 ha at Red Rock Creek based on MCP calculations (Table 3.1.2). The general
activity area according to 95% isopleths was 11.7 ha and 8.2 ha at Hedges Creek and Red
Rock Creek, respectively. Mean utilization area using the MCP method was 7.8 ha ± 2.4
ha [SE] for males (n = 2) and 3.8 ha ± 0.8 ha [SE] for females (n = 5). No significant
relationship between animal body mass and MCP utilization area was observed (r = 0.45,
F1,5 = 1.24, P = 0.316).
Mean utilization area for individual nutria with ≥ 20 radio-locations was 5.9 ha ±
2.16 ha [SE] at Hedges Creek (n = 3) and 4.3 ha ± 0.6 ha [SE] at Red Rock Creek (n =4)
based on MCP calculations. The 95% isopleth mean areas for these individuals at
Hedges Creek and Red Rock Creek were 5.7 ha ± 0.9 ha [SE] and 5.4 ha ± 0.7 ha [SE],
respectively. The 50% isopleth mean area for individuals (i.e. core activity area) was 1.4
ha ± 0.2 ha [SE] at Hedges Creek and 1.2 ha ± 0.2 ha [SE] at Red Rock Creek.

- 53 -
Figure 3.1.5. Aerial depiction of area utilized, calculated using minimum convex polygon (MCP) and
kernel density estimation (KDE) methods, by metropolitan nutria populations from August-December 2011
in the Lower Tualatin River Watershed, Oregon, at a) Hedges Creek and b) Red Rock Creek

- 54 -
Figure 3.1.6. Spatial orientation of core area utilized (50% KDE isopleth) from August-December 2011 for
individual nutria (identified by radio frequency #) with ≥ 20 locations in metropolitan wetland sites in the
Lower Tualatin River Watershed, Oregon, at a) Hedges Creek and b) Red Rock Creek

- 55 -
Table 3.1.2. Estimates of total area utilized (MCP) and utilization probability distribution (KDE) for both
individual nutria with ≥ 20 locations and study populations in two metropolitan wetland sites in the Lower
Tualatin River Watershed, Oregon
Site Animal Characteristics # Locations Area Utilized (ha)
Sex Body Mass (kg) Frequency MCP KDE Isopleths
95% 50% 25%
Hedges M 4.3 165.744 23 10.2 7.5 1.8 0.7
Hedges F 2.3 165.894 27 3.6 4.8 1.2 0.5
Hedges F 2.0 166.332 27 3.8 4.8 1.1 0.5
Red Rock M 6.1 164.918 22 5.4 7.1 1.7 0.7
Red Rock F 6.4 165.918 28 4.9 5.9 1.5 0.6
Red Rock F 2.0 165.981 26 2.7 3.9 0.8 0.3
Red Rock F 2.0 166.318 26 4.1 4.6 0.9 0.4
Hedges study population (n = 8) 132 19.4 11.7 2.2 0.8
Red Rock study population (n = 7) 144 13.5 8.2 1.5 0.6
MCP = minimum convex polygon
KDE = kernel density estimation
DISCUSSION
The primary difference in observed temporal activity patterns in this study
compared to previous studies in other regions was the level of diurnal activity. While
there was a decline in activity in the time period associated with sunrise, as reported
elsewhere (Chabreck 1962, Gosling 1979, Palomares et al. 1994), a high level of diurnal
activity was observed regardless of month. Other studies have only documented high
diurnal activity in the presence of human feeding (Meyer 2005) or extreme cold
temperature (Gosling et al. 1980). A similar activity pattern was observed at all four
study sites, and the relatively small confidence intervals indicate activity patterns of the
study animals were synchronous. This spatial and temporal overlap suggests observed
results represent the activity cycle of urban nutria populations in the Portland, Oregon,
metropolitan area.

- 56 -
The most noticeable shift in temporal activity patterns was the decrease in
nocturnal activity and associated increase in diurnal activity during the month of
December compared to summer and fall months. Though there were 16 days with
minimum temperatures < 0 °C in December compared to only three days in November in
the Portland metropolitan area (National Oceanic and Atmospheric Administration 2012),
there was no evidence that nutria activity was influenced by daily minimum temperature.
The likely explanation is that the observed activity shift was the onset of a seasonal cycle
rather than a response to fluctuating daily temperatures. This activity pattern shift was
not observed during the winter months in a nutria population in the native range
(Palomares et al. 1994). Unfortunately, the freezing temperatures continuously created
layers of frost on the solar panels powering the remote data logging stations and
prevented continued activity tracking through the rest of the winter months.
This is the first study to report local population-level nutria utilization areas, so
results could not be compared to other regions. Mean individual utilization areas were
smaller than recent home range estimates of 28.8 ha in Louisiana (Nolfo-Clements 2009)
and 9.8 ha in Maryland (Ras 1999), but larger than the mean home range of 2.74 ha for a
metropolitan reservoir in Texas (Denena et al. 2003). The mean utilization areas of 5.9
ha at Hedges Creek and 4.3 ha at Red Rock Creek were at the lower end of home range
estimates reported in the literature (Bounds et al. 2003). While not tested statistically due
to inadequate sample size, results support previous findings that males and adults utilize
larger home ranges than females and juveniles, respectively (Doncaster and Micol 1989,
Gosling and Baker 1989). The maximum linear distance between capture/release and

- 57 -
transmitter recovery locations was < 1.5 km, so no long distance dispersal events were
observed during the study timeframe.
The spatial distribution of core activity areas may have been influenced by nutria
population structure and habitat availability at the two sites. At Hedges Creek, the two
females overlapped core activity areas in the proximity of the known den site. The male,
likely a non-dominant adult based on a regional body mass model (Peloquin 1969),
exhibited a core activity area spatially distinct from the two females. This distinct
activity zone suggests the male was not in the same social group as the two females or
perhaps was driven out of the social group by a dominant male (Gosling and Baker
1989). Additionally, multiple open water areas at Hedges Creek may increase the
likelihood of multiple social groups co-existing at the site.
The individual (three females, one male) core activity areas at Red Rock Creek
overlapped substantially and included the known den sites. Female nutria generally do
not exhibit territorial behavior (Ryszkowski 1966, Doncaster and Micol 1989), so the
highly similar core activity areas are not surprising. Further, available space may have
been restricted at Red Rock Creek. In addition to being a smaller overall area than
Hedges Creek, only one open water source was present and a shallow concrete box
culvert 40 m in length adjacent to the nutria den canal may have reduced movement
through that corridor.
The higher level of diurnal activity for nutria in the Lower Tualatin River
Watershed compared to other regions is opposite the pattern observed for many mammals
in urban habitats (Ditchkoff et al. 2006). A possible explanation for the observed results

- 58 -
is reduced risk of diurnal activity due to the relative lack of natural predator pressure in
urban habitats (Gering and Blair 1999, Fischer et al. 2012). Nutria utilization areas in the
Lower Tualatin River Watershed were smaller than predicted home range size based on
classic body size-dependent formulas (McNab 1963, Harestad and Bunnell 1979) and
also smaller than nutria home range estimates in non-urban habitats elsewhere (Nolfo-
Clements 2009). This pattern of smaller home ranges in urban habitats has been
documented in other mammals of similar size, such as the raccoon (Procyon lotor,
Prange et al. 2004) and Virginia opossum (Didelphis virginiana, Meier 1983).
Results of the nutria telemetry study bring into focus several management and
control implications. First, the high level of diurnal activity in metropolitan nutria
habitats results in increased contact with humans and associated safety concerns. Second,
the common practice of wildlife control personnel conducting covert trapping during
nocturnal periods may result in lower capture rates in the cold winter months. Third,
nutria do not appear to be using metropolitan wetlands as temporary refuges from which
dispersal events occur. In fact, the small utilization areas observed at both Hedges Creek
and Red Rock Creek suggest these restoration sites represent core habitat for nutria
(Gosling and Baker 1991) and that sufficient resources were available to support the
study populations (Coreil et al. 1988, Gosling and Baker 1989). These observations
suggest that nutria populations in metropolitan habitats in the Pacific Northwest will
persist and that regional nutria management efforts must include strategies specific to
urban habitats.

- 59 -
Section 2. Comparison of two techniques for attaching radio-telemetry transmitters
to nutria
Radio-tracking has become the standard method for quantifying animal
movements, primarily because it allows researchers to collect large amounts of
information over multiple spatial scales (Millspaugh and Marzluff 2001). However,
improper use of radio-telemetry equipment can lead to misleading results (Hebblewhite
and Haydon 2010). A crucial component of radio-telemetry studies is the attachment of
radio-transmitters. An ideal transmitter attachment method should have minimal
influence on animal health and behavior, and at the same time allow for practical and
feasible deployment. Many studies have assessed the influence of radio-transmitters on
mammal behavior (Gursky 1999, Dennis and Shah 2012, Walker et al. 2012). However,
while several avian studies have directly compared multiple transmitter attachment
methods at the intraspecific level (Wanless et al. 1988, Rotella et al. 1993, Iverson et al.
2006), similar information for mammals is limited.
Many studies have used radio tracking to study nutria movement, most of which
have utilized neck collars to deploy transmitters (Coreil and Perry 1977, Ras 1999,
Denena et al. 2003, J. Meyer 2006, Haramis and White 2011). These studies have dealt
with many challenges, primarily related to improper collar fit leading to animal morbidity
or mortality (e.g., rubbing abrasions leading to infection, leg becoming stuck in loose
collar). Objectives of this research were to 1) further evaluate a tail-mount attachment
method developed by Merino et al. (2007), 2) assess the performance of a new natural

- 60 -
breakaway transmitter collar, and 3) compare the advantages and disadvantages of the
two attachment methods for short-term nutria movement studies.
METHODS
Transmitter design.—Two transmitter designs were used: a neoprene collar
transmitter and a glue-on tail-mount transmitter (Figure 3.2.1). Collar transmitters
(Advanced Telemetry Systems, model M1830; mass = 56 g) were modified by sewing a
biodegradable elastic segment into the neoprene banding, similar to the method that has
been used on transmitters for bears and other large mammals (Garshelis and McLaughlin
1998). Glue-on transmitters (Advanced Telemetry Systems, model R2030; mass = 58 g)
were modified according to Merino et al. (2007) to allow for adhesion to 19.0 mm or 25.4
mm polyvinyl chloride (PVC) pipe. Both transmitter types were designed to naturally
fall off the animal after a period of approximately three months to eliminate the need for
animal recapture.
Figure 3.2.1. Photos depicting design of VHF transmitters deployed on nutria at four metropolitan wetland
sites in the Lower Tualatin River Watershed, Oregon, via a) neck collar and b) tail-mount (shown without
PVC pipe) attachment methods
Transmitter attachment.—Animals randomly selected to be fitted with collar
transmitters were placed in a squeeze cage to safely administer chemical immobilization
drugs. Anesthesia was achieved through intramuscular injection of ketamine

- 61 -
hydrochloride (Bó et al. 1994) and dexmedetomidine hydrochloride (Jalanka and Roeken
1990). Dosage for ketamine and dexmedetomidine were 5.0 mg/kg and 0.1 mg/kg,
respectively. An intramuscular injection of atipamezole hydrochloride (Jalanka and
Roeken 1990) at a dosage of 0.35 mg/kg was used to antagonize the dexmedetomidine
and accelerate recovery. Once animals were safely under anesthesia, collars were fitted
snugly enough that a researcher’s index and middle fingers (approximately 3.5 cm width
and 1.5 cm height) could not slide under the collar without considerable force. Collars
were oriented so that the antenna tracked down the back of the animal toward the
posterior (Figure 3.2.2). Animal vital signs (i.e., heart rate, respiration, and temperature)
were monitored to confirm safe anesthesia, a general physical examination was
conducted, and animal measurements (i.e., sex, mass, body length, total length, and hind
foot length) were recorded. Animals were released at capture sites only after
demonstrating recovery from anesthesia.
Nutria randomly selected to be fitted with tail-mount transmitters were physically
immobilized using a squeeze cage. Transmitters glued to a 5.0 cm section of PVC pipe,
either 19.0 mm or 25.4 mm diameter depending on animal tail size, were then fitted and
secured directly to the tail using a quick-drying, two-part epoxy. Transmitter units were
oriented with the antenna trailing behind the animal and held in place for approximately
five minutes (Figure 3.2.2). Animals then remained caged for a minimum of 15 minutes
to allow for epoxy to harden before they were released back into the water. Methodology
followed Merino et al. (2007) and was demonstrated in a field trial by the original
researchers. Sex and body mass was recorded before animals were released.

- 62 -
Figure 3.2.2. Photos depicting orientation of VHF transmitters deployed on nutria at four metropolitan
wetland sites in the Lower Tualatin River Watershed, Oregon, for a) neck collar and b) tail-mount
attachments
Research was conducted under the training and supervision of a certified wildlife
veterinarian and chemical immobilization drugs were handled and stored according to
controlled substances regulations of the Drug Enforcement Administration. At least two
researchers were present when handling nutria to ensure the safety of all study animals.
Nutria capture and handling protocols were approved by the Portland State University
Institutional Animal Care and Use Committee (protocol #: psu11.03.01.1), and all capture
and handling procedures were in accordance with Sikes et al. (2011).
Statistical methods.—Variability between transmitter types was assessed using a
Fisher’s exact test (FET) for sex ratio and a Student’s t-test for animal body mass.
Transmitter retention time was also compared with a Student’s t-test. Acute mortality
rate between transmitter types was assessed with Fisher’s exact test. A Welch’s t-test to
correct for unequal variances was used to compare linear distance traveled from
capture/release site to transmitter recovery site between transmitter types. Linear
distance was calculated as a proxy for movement to assess whether behavior patterns

- 63 -
differed between nutria fitted with neck collars and tail mounts. All tests were conducted
using a two-tailed alpha of 0.05.
RESULTS
Transmitters were deployed on nutria ranging from 1.5-9.5 kg, and 90% (27/30)
of the deployed transmitters were recovered. Three transmitters were not recovered
because batteries failed before detachment; these were removed from all analyses. There
was no difference in body mass (t25 = 0.53, P = 0.600) between animals fitted with neck
(4.5 kg ± 1.9 kg [SD]), n = 11) and tail (5.0 kg ± 2.7 kg [SD], n = 16) transmitters,
respectively. Likewise, there was no difference in sex ratio between the neck collar and
tail mount study groups (FET, P = 0.116), so within-treatment data were pooled for
subsequent analyses.
The mean handling and recovery time for animals fitted with neck collar
transmitters was 53 min ± 23 min [SD] (n = 8). Handling time for animals fitted with
tail-mount transmitters was not recorded, but was similar to the period of 20 min reported
by Merino et al. (2007). While there was no significant difference (t17 = 2.02, P = 0.059)
in retention time between attachment types when considering transmitters that naturally
detached (i.e., excluding nutria that died with transmitters still attached) from study
animals, there was a pattern of earlier, though more variable, detachment for tail mounts.
Retention time ranged from 71-175 days (mean = 120 days ± 38 days [SD]) for neck
collars and 21-201 days (mean = 72 days ± 51 days [SD]) for tail mounts (Table 3.2.1).
Neck collar transmitters remained attached significantly longer than tail-mounted
transmitters overall when transmitter fate was not considered (t25 = 2.79, P = 0.010).

- 64 -
The overall acute mortality of study animals was 29.6% (Table 3.2.1). The
mortality rate was significantly higher for animals with neck collars compared to animals
with tail mounts (FET, P = 0.033). Predation and decomposition prevented
determination of cause of death in most instances, but substantial neck abrasions were
observed on two animals with neck collars. The smallest animals randomly fitted with
neck collars all weighed 2.0 kg (n = 3), and each deployment resulted in mortality.
Conversely, a tail-mounted transmitter was successfully deployed and recovered after
detachment from an animal weighing 1.5 kg. Two tail-mounted transmitters were
recovered with tails still attached to the PVC pipe. One of these animals was
subsequently observed on several occasions, but long-term status (e.g., morbidity,
mortality) could not be determined for either animal. No instances of feet becoming
stuck in neck collars were recorded.
Table 3.2.1. Comparison of retention time, animal response, and transmitter performance between neck
collar and tail-mount radio-transmitters deployed in four metropolitan wetland sites in the Lower Tualatin
River Watershed, Oregon
There was no difference (t11 = 1.44, P = 0.178) in linear distance traveled from
capture/release site to transmitter recovery site between tail mounts (mean = 180 m ± 38
m [SE]) and neck collars (mean = 406 m ± 153 m [SE]). All recovered transmitters were
Transmitter Type
Retention Time (days) Neck (n = 5) Tail (n = 14) Overall
Mean 120 72 84
Minimum 71 21 21
Maximum 175 201 201
Animal Response (%) Neck (n = 11) Tail (n = 16) Overall
Acute Mortality 54.5 12.5 29.6
Transmitter Detachment 45.5 87.5 70.4
Transmitter Performance (%) Neck (n = 14) Tail (n = 16) Overall
Battery Failure 21.4 0.0 10.0

- 65 -
found either in the transition zone between water and upland habitat or in shallow water <
1.0 m deep. All units were in good condition, although the antennas of several tail-mount
transmitters were partially exposed as a result of the animals chewing through the rubber
coating. Skin and hair was attached to the interior of the PVC pipe for all detached tail-
mount transmitters as described by Merino et al. (2007). All three units that experienced
battery failure were neck collar transmitters, but there was no detectable difference in
signal transmission between the transmitter types.
DISCUSSION
The performance of tail-mount transmitters differed somewhat from the results of
the initial field trial in Louisiana (Merino et al. 2007). Tail mounts that detached from
animals were retained for a mean period of 72 days ± 51 days [SD] in Oregon compared
to 96 days ± 38 days [SD] in Louisiana. The loss of nutria tails still fastened to
transmitters occurred on two occasions in Oregon, but was not observed in Louisiana.
While the tail is not considered to aid nutria movement (Merino et al. 2007), tail loss
leads to an increased risk of infection and potentially reduced capacity for
thermoregulation (Krattenmacher and Rubsamen 1987). This study concurs with the
conclusion of Merino et al. (2007) that tail-mount transmitters are a viable alternative to
neck collars for short-term nutria movement studies, however, methods to safeguard
against tail loss (e.g., identification of epoxies that reduce skin irritation, improved sizing
of PVC pipe mounts) should be developed.
The new breakaway collar transmitter performed as designed, breaking down and
releasing from animals naturally after several months. However, the significantly higher
acute mortality rate for animals fitted with collars compared to tail-mount transmitters

- 66 -
suggests that 1) the collar fit needs to be improved to reduce adverse impacts on study
animals, 2) the collar should be designed to break down and detach more quickly, or 3)
collars should not be deployed on animals capable of short-term rapid body mass changes
(i.e., juveniles and pregnant females near full-term). It should be noted that the acute
mortality rate of 54.5% was within the range reported in the literature (Bounds et al.
2003), however, the actual mortality rate may have been higher because the fate of
animals after transmitter detachment was unknown.
Other nutria studies have also reported difficulty fitting neck collars (Evans et al.
1971, Coreil and Perry 1977, Merino et al. 2007). A possible design modification could
be the use of plastic beads instead of neoprene banding to potentially reduce neck
abrasions (Ras 1999, Haramis et al. 2011). Identification of materials that break down in
1-2 months in aquatic environments that could be incorporated into a collar design may
also improve collar performance. Mechanical breakaway devices are not yet an option
because the mechanisms are currently too heavy to deploy on a nutria collar (Haramis et
al. 2011). J. Meyer (2006) suggested limiting nutria telemetry study duration to no more
than two months to minimize issues associated with neck collars, however, GPS
technology may be the only option to obtain enough data points over a shorter timeframe.
The designs of the tail-mount and breakaway neck collar can be adapted for
deployment on other species and should be considered, particularly when animal
recapture is not necessary. Another option not considered in this study that is regularly
used for transmitter deployment in aquatic mammals is surgical implantation (Horning et
al. 2008). Implantation of radio-transmitters has been demonstrated in nutria (Nolfo and

- 67 -
Hammond 2006) and other sympatric species, such as the North American beaver
(Castor canadensis, Wheatley 1997) and muskrat (Ondatra zibethicus, Lacki et al. 1989).
This method is mostly restricted to long-term studies because it generally involves a
recovery time in holding facilities, although field implantation has been demonstrated for
the Eurasian beaver (Castor fiber, Ranheim et al. 2004). Transmitters also cannot be
removed without additional surgery, and recent findings for the American badger
(Taxidea taxus) suggest implantation methods may carry long-term risks even if short-
term recovery is successful (Quinn et al. 2010).
There were several advantages and disadvantages for both transmitter attachment
types for nutria. Tail-mount transmitters were relatively simple and less expensive (i.e.,
no chemical drugs) to deploy in a short period of time, however, a thorough physical
examination of the study animals was not possible. Collar transmitters took a longer
period of time to deploy due to anesthesia administration and recovery, but a complete
physical examination of the animal was easy to complete. While not statistically
significant, retention time of transmitters that ultimately detached was longer and more
predictable for neck collars than tail mounts. Longer retention time could be an
advantage or disadvantage depending on the purpose of the study. There was no
evidence that nutria behavior (i.e., movement assessed by linear distance traveled)
differed between transmitter attachment methods. Finally, limited observations suggest
tail-mount transmitters may be able to successfully be deployed on a wider range of
nutria size classes than neck collar transmitters.

- 68 -
CHAPTER 4
IDENTIFYING AND MANAGING NEGATIVE IMPACTS
Section 1. Efficacy of plastic mesh tubes in reducing nutria herbivory damage to live
stakes in a riparian restoration site
Mammalian herbivory is well-recognized as an important driver of ecological
processes associated with plant community structure (Olofsson et al. 2004). For
example, mammalian herbivores can alter succession patterns in both terrestrial
(Davidson 1993) and aquatic (Gedan et al. 2009) systems. Mammalian herbivory is also
known to increase, or sometimes decrease, plant diversity (Olff and Ritchie 1998). These
ecological effects are dependent on mammalian herbivore feeding strategies, which
impact movement and habitat use (Owen-Smith et al. 2010). Herbivore feeding strategies
are especially important to understand for habitat restoration where success is often
dependent on the reestablishment of specific herbaceous and woody plant species. While
much attention has been given to the negative ecological effects of livestock grazing on
riparian habitats, particularly in western North America (Fleischner 1994, Belsky et al.
1999, Poff et al. 2011), wildlife herbivores in these riparian zones also can pose major
problems for restoration efforts (Opperman and Merenlender 2000).
More than $1 billion has been spent on stream restoration efforts annually since
1990 in the United States (Bernhardt et al. 2005). Greater than 60% of the projects
completed during this timeframe were for endangered fish, primarily salmon, habitat
restoration in the Pacific Northwest and California (Katz et al. 2007). A primary

- 69 -
component of these restoration projects was the reestablishment of riparian vegetation
(Roni et al. 2002). Riparian vegetation buffers can reduce sediment inputs to streams,
moderate water temperature, stabilize stream banks, and provide habitat complexity
(Osborne and Kovacic 1993). The large amount of resources allocated to stream
restoration projects, particularly in the Pacific Northwest, suggests that information on
potential obstacles to the success of these projects should be a priority (Rumps et al.
2007). One such potential obstacle in Oregon and Washington is herbivory damage
caused by nutria.
While damage has not been well-quantified, regional habitat restoration managers
report that nutria populations are causing substantial herbivory damage to newly planted
riparian vegetation. It is important to understand the extent of this damage and whether
effective damage mitigation tools are available. Objectives of this research were to 1)
determine whether nutria exhibit preferences among woody riparian vegetation species
and 2) assess the efficacy of standard Vexar® plastic mesh tubes in reducing nutria
damage to newly planted woody vegetation.
STUDY AREA
The study was conducted in the Delta Ponds urban waterway located in Eugene,
Oregon. The regional climate is characterized by cool, wet winters and warm, dry
summers. Most of the 100 cm of annual precipitation falls between October and March
(Oregon Climate Service 2012). Delta Ponds consists of 60 ha of connected ponds,
channels, and associated riparian areas surrounded by development on all sides (Figure
4.1.1). A restoration project on the former mining site was undertaken from 2004-2012

- 70 -
to reconnect the side channel to the adjacent Willamette River (City of Eugene 2012).
The primary goal was to restore the natural hydrologic regime to provide rearing habitat
for juvenile salmon.
Figure 4.1.1. Aerial imagery depicting Delta Ponds metropolitan waterway in Eugene, Oregon, in relation
to Willamette River to the west and urban development on all sides; two circles denote locations of
vegetation transects
Reestablishing riparian woody vegetation was a primary component of the
restoration plan, but initial planting efforts were greatly hindered by losses to herbivores.
A nutria control campaign in 2006 removed > 70 nutria from the waterway during a two
week trapping period (Lauri Holts, City of Eugene Parks and Open Space, personal
communication). Although observed nutria activity at the site diminished, a reproducing
nutria population remained at Delta Ponds. Beaver (Castor canadensis) were also
present in the waterway, so the role of each species in the observed herbivory loss was
unclear prior to the study.
- 71 -
METHODS
Vegetation installation and monitoring.—Soil benches for habitat restoration were
recently constructed in three areas within Delta Ponds, but vegetation had not yet been
replanted on the benches. A 28 m transect to monitor nutria effects on replanted
vegetation was established parallel to the water’s edge at two of the locations (Figure
4.1.1). The third bench was omitted from the study due to a high level of human foot
traffic. Benches were planted with live stakes of black cottonwood (Populus balsamifera
ssp. trichocarpa), red osier dogwood (Cornus sericea), and willow (Salix spp.) collected
from Delta Ponds and other nearby locations. These species are three of the most
common woody species used for wetland and riparian restoration in the Pacific
Northwest because of the ability to harvest viable live stakes from existing trees and
shrubs. Live stake planting followed standard methods (Hartmann et al. 2002) and was
completed in February 2009.
The live stakes were planted on 0.6 m centers in three rows parallel to the water’s
edge for a total of 120 live stakes in each transect. The proportion of each species
approximated proportions observed elsewhere in the Delta Ponds waterway. Overall
proportions for planted live stakes were 0.48, 0.29, and 0.23 for willow, red osier
dogwood, and black cottonwood, respectively. Both transects were divided into four
equal segments, each containing 30 live stakes. In each transect, two randomly selected
segments were left unprotected while all live stakes in the other two segments were
protected with individual barriers. Standard Vexar® plastic mesh tubes were used to
protect the planted vegetation from herbivory (Figure 4.1.2). Tubes were approximately

- 72 -
1.0 m in height and 100 mm in diameter. Each tube was stabilized by threading a single
bamboo stake through the plastic mesh and anchoring it into the ground.
Figure 4.1.2. Partial transect of woody vegetation live stakes with two vegetation plots protected by
Vexar® plastic mesh tubes and motion-activated surveillance cameras monitoring the vegetation plots
within the Delta Ponds metropolitan waterway in Eugene, Oregon; circular wire barrier at left of photo is
not part of study exclusion treatment
Individual live stakes were monitored throughout the study. Each live stake was
given a unique indentification number engraved in an aluminum tag staked next to the
planting. The initial vegetation inventory was done concurrently with the live stake
installation. Subsequent vegetation inventories were made 9 days, 44 days, 94 days, and
100 days after vegetation installation. During each inventory, the status (alive, removed)
of each live stake was recorded and Vexar® tubes were inspected for damage.
Remaining plant material from destroyed live stakes was removed from transects.
Nutria activity monitoring.—Four infrared game cameras (Leaf River, model IR-
3BU) were established along both transects to monitor nutria activity in each transect
segment. Cameras were installed five days before vegetation installation to assess

- 73 -
baseline nutria activity. Camera surveillance was conducted continuously for the
duration of the study, and nutria camera triggers separated by at least 0.5 hours were
considered independent events. Cameras were programmed to record 30 second video
clips to increase the likelihood of species identification. Nutria were not observed in the
daylight hours during the study set-up period, so cameras were not active during daylight
hours to prevent excessive waterfowl camera triggers.
Statistical methods.—Yates’ chi-squared test was used to compare unprotected
vegetation survival between transects. Formal testing of protected vegetation survival
was not needed because all protected live stakes in both transects survived. Yates’ chi-
squared test also was used to assess overall survival between protected and unprotected
treatments. Kaplan-Meier survival curves were produced to assess survival of each
species over time, and a log-rank test was used to test for differences between species.
Pairwise comparisons between species were then performed using log-rank tests and the
Bonferroni method to correct for multiple comparisons. A Pearson’s chi-squared
goodness-of-fit test was used to assess nutria activity level between protected and
unprotected plots at the south transect. All tests were conducted using a two-tailed alpha
of 0.05. Technical issues resulted in surveillance cameras at the north transect
comprising less than 4% (31/832) of the total camera triggers, so the north transect was
omitted from nutria activity analysis.
RESULTS
The survival of unprotected (χ12 = 2.94, P = 0.086) live stakes did not differ
between transects and all protected live stakes in both transects survived, so between-

- 74 -
transect data were pooled for survival analysis. The survival of live stakes differed
significantly between protected and unprotected plots (χ12 = 168.1, P < 0.001). In fact,
100% (120/120) of protected plantings survived for the duration of the study, while only
17% (20/120) of unprotected plantings survived (Table 4.1.1).
Table 4.1.1. Comparison of survival (%) of three woody vegetation species and overall survival between
plots protected by Vexar® tubes and unprotected vegetation plots within the Delta Ponds metropolitan
waterway in Eugene, Oregon
Treatment Species
Black cottonwood
(n = 55)
Red osier dogwood
(n = 69)
Willow species
(n = 116)
Overall
(n = 240)
Protected 100 100 100 100
Unprotected 0 11 30 17
In unprotected plots, the survival of black cottonwood, red osier dogwood, and
willow was 0% (0/29), 11% (4/37), and 30% (16/54), respectively. Herbivory damage in
the unprotected plots resulted in live stakes being completely removed from the ground
before root systems could become established. Both camera and physical evidence (e.g.
teeth marks on live stakes) suggested that nutria were responsible for the observed
vegetation damage (Figure 4.1.3). Damage to Vexar® plastic mesh tubing was not
observed through video surveillance or physical inspection.
Figure 4.1.3. Examples of a motion-activated surveillance camera station capturing nutria targeting live
stakes in an unprotected vegetation plot within the Delta Ponds metropolitan waterway in Eugene, Oregon

- 75 -
Survival rate of unprotected woody plantings differed by species (χ22 = 42.7, P <
0.001; Figure 4.1.4). Pairwise comparisons suggested that nutria targeted black
cottonwood over both red osier dogwood (χ12 = 26.9, P < 0.001) and willow (χ1
2 = 31.7,
P < 0.001). In fact, nutria removed 72% (21/29) of black cottonwood live stakes within
the first nine days and 100% within 44 days. No preference between red osier dogwood
and willow was detected (χ12 = 2.6, P = 0.105). Damage to red osier dogwood and
willow live stakes occurred primarily between days 9-44, when 76% (29/38) of red osier
dogwood and 57% (30/53) of willow plantings were removed.
Figure 4.1.4. Kaplan-Meier survival curves at 9, 44, 94, and 100 days at Delta Ponds metropolitan
waterway in Eugene, Oregon, from February-May 2009 for live stakes of a) black cottonwood (n = 29), b)
red osier dogwood (n = 37), and c) willow species (n = 54) in unprotected vegetation plots; dashed lines
denote 95% confidence intervals
Nutria were more active in unprotected plots compared to protected plots along
the south transect (χ12 = 9.81, P = 0.002). Cameras captured 70 independent nutria events
in unprotected plots and 39 events in protected plots in the 100 day period after
vegetation installation (Figure 4.1.5). Only two nutria events were recorded in the five
day period before live stakes were planted. The rate of nutria activity in unprotected

- 76 -
plots increased starting day 7 after vegetation installation, and a similar pattern was
observed in protected plots starting day 25. Nutria activity rate decreased in protected
plots beginning day 44, but remained stable in unprotected plots until activity ceased. No
nutria were observed in unprotected plots after day 69 or protected plots after day 84.
Other species regularly observed (n > 30) on camera surveillance were the Canada goose
(Branta canadensis), mallard (Anas platyrhynchos), and raccoon (Procyon lotor).
Beavers also were documented on seven occasions. None of these species were observed
removing planted live stakes.
Figure 4.1.5. Cumulative number of independent (more than 0.5 hours between camera triggers) nutria
events captured on surveillance cameras from February-May 2009 in protected and unprotected vegetation
plots with the Delta Ponds metropolitan waterway in Eugene, Oregon
DISCUSSION
Nutria at Delta Ponds targeted the planted woody live stakes soon after they were
available. Most nutria diet studies from other regions have concluded that woody plant
food sources represent a small proportion of the overall diet (Shirley et al. 1981, Wilsey

- 77 -
et al. 1991, Prigioni et al. 2005a). However, terrestrial vegetation can comprise up to
35% of the nutria diet in their native range (Borgnia et al. 2000) and nearly 100% of the
diet in some non-native urban habitats (Carter et al. unpublished data). A study
conducted in the Willamette Valley, Oregon, reported that willow was the most targeted
vegetation species and comprised 12% of the nutria diet (Wentz 1971). It should be
noted that Wentz conducted physical observations rather than fecal or stomach content
analysis, so the proportion of floating and submerged aquatic vegetation in the diet was
likely underrepresented. Kuhn and Peloquin (1974) also reported nutria damage to a
variety of tree species in the Willamette Valley. Results from Delta Ponds support the
conclusions of Wentz (1971) and Kuhn and Peloquin (1974) that regional nutria
populations regularly utilize available woody vegetation as part of their diet. This study
also provides the first evidence that nutria prefer black cottonwood over other common
wetland and riparian trees and shrubs.
Vexar® plastic mesh tubing effectively protected woody live stakes from nutria
herbivory damage during the three month initial establishment phase. These results were
contrary to those reported by Conner and Toliver (1987) in Louisiana. They concluded
that Vexar® mesh tubes were ineffective at mitigating nutria herbivory damage to
baldcypress (Taxodium distichum) seedlings after 75% of the protected plantings,
compared to 79% of unprotected plantings, were destroyed by nutria over the same three
month timeframe. Conner and Toliver (1987) also reported that nutria systematically
chewed through the base of the plastic mesh to access the seedlings. Nutria regularly

- 78 -
investigated live stakes protected by Vexar® tubes in this study, but there was no video
or physical evidence of nutria attempting to chew through the plastic mesh.
A possible explanation for these results compared to those of Conner and Toliver
(1987) is the relative difference in nutria habitat use between the studies. Delta Ponds
contained limited physical evidence, excluding camera surveillance, of nutria activity.
Observations suggested that relative nutria habitat use at Delta Ponds was low two years
after the control effort. Conversely, Conner and Toliver (1987) documented a high
number of nutria feeding platforms, indicating a higher relative habitat use in the
Louisiana study. Other factors (e.g. intermittent inundation of plots at Delta Ponds vs.
constant inundation of plots in Louisiana) also could have contributed to conflicting
results between the studies. Meyers et al. (1995) did report that a more expensive
product, Tubex tree shelters, effectively mitigated nutria herbivory to baldcypress in
Louisiana.
Nutria activity patterns in protected and unprotected plots suggest that nutria
targeted the most easily accessible woody plants. Nutria activity occurred almost
exclusively in unprotected plots for the first 24 days after vegetation installation. Nutria
then shifted approximately 50% of their activity to the protected plots, presumably after
the most preferred plantings in the unprotected plots had been utilized, for the next 20
days. Interestingly, nutria activity in protected plots then decreased even though a vast
majority of the remaining woody vegetation was located in these plots. A possible
explanation is that nutria shifted to alternative food sources outside the plots that
provided higher energy intake per unit time, as described by optimal foraging theory

- 79 -
(MacArthur and Pianka 1966). The eventual disappearance of nutria from both protected
and unprotected plots provides further evidence that the remaining live stakes were less
desirable than other food sources at Delta Ponds. It should be noted that nutria may have
chewed through the mesh tubes, as reported by Conner and Toliver (1987) in Louisiana,
if alternate food sources were scarce or nutria habitat use was higher at Delta Ponds.
Though the Delta Ponds study was conducted on a small spatial and temporal
scale, observed nutria selective herbivory and adaptive relative habitat use patterns
mirrored those documented for other vertebrate herbivores. Time and energy are known
to play a major role in food preference (Emlen 1966). For example, white-footed mice
(Peromyscus leucopus) in natural habitats consistently selected food according to
metabolic profitability (Lewis et al. 2001). In terms of habitat use, a proportional
relationship exists between the amount of time spent in an area and the available quantity
and quality of food (Bailey et al. 1996). For example, the relative habitat use of two
mammalian herbivores, mule deer (Odocoileus hemionus) and moose (Alces alces), was
higher in commercially thinned forest stands because understory vegetation was more
abundant (Sullivan et al. 2007). These examples strengthen the conclusion that woody
plants protected by Vexar® tubes at Delta Ponds, regardless of plant species, were not as
attractive to nutria as other available food sources.
The use of Vexar® plastic mesh tubes to mitigate herbivory damage is an
attractive option because it is non-lethal. Additionally, most costs are up-front and may
be minimal compared to the values of resources protected. Other studies have suggested
their use in upland forest habitats to protect replanting efforts from species ranging from

- 80 -
voles to deer (Pauls 1986, Engeman et al. 1999, Johnson and Okula 2006), however, this
is the first study to document effective short-term use of Vexar® for revegetation
protection in a riparian habitat. While this study demonstrated mesh tubes can protect
live stakes from nutria damage during the most critical initial months when live stake root
systems are establishing, the efficacy of these barriers for long-term protection in an
aquatic environment remains to be determined.
Herbivore food habits also should be considered when conducting habitat
restoration activities in locations where herbivore populations are present. Results from
Delta Ponds provide information for restoration managers facing nutria issues to evaluate
when choosing appropriate woody vegetation for wetland and riparian restoration, and
similar assessments should be conducted for other mammalian herbivores. Finally,
comparing the Delta Ponds results to those of Conner and Toliver (1987) highlights the
potential importance of herbivore population management, either lethal or non-lethal,
prior to restoration work in sensitive habitats.
Section 2. Comparison of the performance of a new nutria multiple-capture cage
trap to a standard cage trap
Management of invasive vertebrate pests, and sometimes native nuisance species,
usually includes population control (Hone 1994). Vertebrate pest control has changed
drastically over the last century from an arguably haphazard approach to the development
of integrated pest management (IPM) strategies (Fall and Jackson 1998). As the IPM
field continues to develop, vertebrate pest control strategies increasingly need to account

- 81 -
for animal welfare and ethical issues by minimizing negative effects on people, animals,
and the environment (Littin et al. 2004). Trapping is a vital component of IPM strategies
for many vertebrate pest species (Norris et al. 2003), but trapping approaches must
continually be adapted both to keep pace with evolving societal perspectives and to more
effectively target pest species of interest.
Uncontrolled non-native nutria populations can result in substantial environmental
and economic impacts. It was estimated that nutria populations left uncontrolled would
cause annual damages of $5.9 million in the state of Maryland alone (Southwick
Associates 2004). Economic losses associated with the growing nutria population in Italy
are expected to increase to $11-15 million per year (Panzacchi et al. 2007). Nutria are
well-established as an invasive species worldwide, and the only way to effectively
mitigate their impacts over the long-term is through population control (LeBlanc 1994),
which usually includes trapping (Norris 1967b, Baker and Clarke 1988, Prigioni et al.
2005b). However, few novel nutria control methods are being developed.
One potential new tool that has undergone initial field testing is a nutria multiple-
capture cage trap (Witmer et al. 2008). A multiple-capture trap (MCT) could be an
attractive option for nutria control in metropolitan habitats because of the potential to put
more nutria at risk while virtually eliminating lethal non-target impacts. Objectives of
this research were to 1) compare the efficacy of the nutria multiple-capture trap to a
standard two-door cage trap (SCT) and 2) evaluate whether the design of the MCT
targeted certain nutria size classes.

- 82 -
STUDY AREA
The study was conducted on Sauvie Island, located 15 km northwest of Portland,
Oregon, on the metropolitan edge. The climate is characterized by cool, wet winters and
warm, dry summers. Most of the 100 cm of annual precipitation falls between October
and March (Oregon Climate Service 2012). The 10,500 ha island is bordered by the
Columbia River, Multnomah Channel, and Willamette River to the east, west, and south,
respectively (Figure 4.2.1). The island consists of residential, agricultural, recreational,
and managed wildlife areas. The area has little topographical relief and is covered by an
extensive aquatic network. Water levels are controlled throughout the year. Crop
irrigation is the priority on the western and southeastern sections, while waterfowl habitat
conservation is the focus in the state wildlife area on the northern section. Nutria are
present everywhere on the island and are considered a pest due to their burrowing and
feeding, which results in canal erosion and crop damage.
Figure 4.2.1. Aerial imagery depicting Sauvie Island in relation to the Columbia River to the east,
Willamette River to the south, and Multnomah Channel to the west; seven study site locations are shown;
Portland, Oregon, is located 15 km to the southeast

- 83 -
Study sites were located on both private property and public land designated as a
state wildlife area. Criteria for site selection were 1) physical evidence of nutria activity,
2) slow-flowing water, 3) adjacent agricultural crop, and 4) accessibility. Preliminary
video surveillance at 11 sites fitting the criteria showed nutria activity at seven sites, so
the trap comparison was conducted at these seven sites (Table 4.2.1). Vegetation at the
sites was dominated by invasive species, and no submerged aquatic vegetation was
observed at any of the sites.
Table 4.2.1 Number of trap nights and site characteristics of seven trapping locations on Sauvie Island,
located at the metropolitan edge of Portland, Oregon
Site Name Trap Nights Site Characteristics
Ownership Dominant vegetation Adjacent crop
Baileys Nursery I 144 private property RCG, HBB clover
Charlton Ditch 144 private property RCG, HBB corn
Deadwillow Unit 144 state wildlife area RCG corn
Farm Canal 76 state wildlife area RCG, HBB corn Charlton Pond 72 private property RCG, CCT corn Baileys Nursery II 72 private property RCG, HBB grass
Mudhen Unit 72 state wildlife area RCG corn
RCG = reed canarygrass (Phalaris arundinacea) – invasive
HBB = Himalayan blackberry (Rubus armeniacus) – invasive
CCT = common cattail (Typha latifolia) – native
METHODS
Trap design.—The MCT prototype was designed and deployed for basic field
testing by Witmer et al. (2008). The basic MCT design (Figure 4.2.2) is a semi-
collapsible polyvinyl chloride (PVC) frame held together with heavy cable ties. Cable
ties are also used to attach galvanized welded wire fencing to the frame on all sides. The
one-way funnel entrance consists of a metal frame welded to heavy gauge metal wire,
creating a funnel shape that can be adjusted to various diameters. A constructed MCT
weighs approximately 20 kg. A complete description of the design and construction of

- 84 -
the MCT is provided by Witmer et al. (2008). The cost to construct a MCT is
approximately $90 for materials and $40 for labor, for a total of $130 per trap (Gary
Witmer, USDA National Wildlife Research Center, personal communication). The SCT
used for comparison was a two-door spring-loaded cage trap (Havahart® model #1045;
retail price: $80), which is a standard cage trap for capturing raccoons and nuisance
animals of similar size. Each SCT was 91.4 cm L × 25.4 cm W × 30.5 cm H and
weighed approximately 3.5 kg.
Figure 4.2.2. Nutria multiple-capture trap depicted by a) technical drawing with wire fencing only shown
on one panel for illustrative purposes and b) photo of constructed trap from rear
Trap placement and monitoring.—Three MCTs and three SCTs were established
at each of the seven sites, resulting in a total of 21 MCTs and 21 SCTs. The units of a
trap pair (one SCT, one MCT) were located no more than five meters apart, and trap pairs
within each site were established at least 50 meters apart in areas with evidence of nutria
activity. The funnel door specifications for each MCT were randomly selected at each
site without replacement and set to one of the following diameters: 10.0 cm, 11.5 cm, or
13.0 cm. Pre-baiting using carrots, apples, and sweet potatoes was conducted for at least

- 85 -
three consecutive days at all sites in an effort to increase capture success (LeBlanc 1994).
A trail of bait leading to each trap was maintained after trapping began. All trap units
were checked daily and bait was replaced when necessary. A motion-activated infrared
camera (Reconyx™ HyperFire™ HC500, Reconyx™ RapidFire™ RC55) established at
each MCT continuously documented animal activity. Two trapping periods were
conducted in March and April 2011.
Animal handling.—Captured nutria and other species classified by the state of
Oregon as non-native species (i.e., opossum [Didelphis virginiana]) were euthanized
using a firearm in accordance with euthanasia guidelines published by the American
Veterinary Medical Association (2007). All other non-target species were immediately
released at the capture site. The sex, body mass (kg), total length (cm), body length (cm),
and hind foot length (cm) was recorded for all nutria. Animal handling protocols were
approved by the Portland State University Institutional Animal Care and Use Committee
(protocol #: psu11.03.01.1). Nutria trapping was conducted under a scientific take permit
from the Oregon Department of Fish and Wildlife (permit #: 012-11). All capture and
handling procedures were in accordance with Sikes et al. (2011).
Statistical methods.—Traps were deployed in pairs (1 MCT, 1 SCT) to ensure
nutria had equal access to both cage trap models, so capture data were used to assess the
independence of traps within a trap pair by calculating event probabilities. Variability
between sites was assessed using Fisher’s exact tests (FET) for trap choice and sex ratio
and a one-way ANOVA for animal body mass. Pearson’s chi-squared tests were used to
test independence within trap pairs and potential differences between trap types for total

- 86 -
number of nutria captured and nutria sex ratio. Yates’ chi-squared test was used to assess
non-target captures between trap types. A Student’s t-test was used to compare nutria
body mass between trap types, and a one-way ANOVA was used to evaluate whether
nutria body mass differed based on funnel door diameter. Body mass was the nutria size
metric used for all tests because it is strongly correlated with the length measurements
(i.e., total, body, and hind foot) and is the standard size metric reported in the literature.
All tests were conducted using a two-tailed alpha of 0.05.
RESULTS
Total catch-per-unit-effort (CPUE), defined as the number of nutria captured per
trap night, for the study was 0.036. A total of 26 nutria were captured over 724 trap
nights, and all captures occurred at four sites: Baileys Nursery I, Charlton Ditch, Farm
Canal, and Deadwillow Unit (Appendix C). Trap camera surveillance showed lower
nutria activity at sites where no nutria were captured (Baileys Nursery II, Charlton Pond,
and Mudhen Unit), and these sites were dropped from all analyses. Within a trap pair,
nutria capture events occurred at the following frequencies: MCT only – 27% (6/22),
SCT only – 55% (12/22), and MCT and SCT – 18% (4/22). There was no difference in
trap choice (FET, P = 0.060), nutria sex (FET, P = 0.843), or nutria body mass (F3,33 =
1.21, P = 0.331) between sites so data were pooled.
Capture data showed that 1) capture rates did not differ between the MCT and
SCT, and 2) the MCT only retained single animals and therefore functioned as a large
SCT in terms of nutria captures. Following these assumptions, a nutria capture event
would have a 0.5 probability of occurring in either trap type. If the two units within a

- 87 -
trap pair are independent, the expected probability of simultaneous captures in both traps
when at least one capture occurs is 0.5 × 0.5 = 0.25. The observed probability of 0.18 did
not differ from the expected probability (χ12 = 0.55, P = 0.460), so within-site data were
also pooled.
Nutria captured in the MCT were significantly larger than nutria captured in the
SCT (t24 = 2.34, P = 0.027), with mean body masses of 6.4 kg ± 1.8 kg [SD] (n = 10) and
4.2 kg ± 2.6 kg [SD] (n = 16), respectively. The MCTs did not capture any nutria less
than 3.7 kg and 60% of the animals captured in this trap type were larger than 6.0 kg.
Conversely, 75% of the nutria captured in the SCTs were less than 6.0 kg (Figure 4.2.3).
Nutria body mass did not differ based on the diameter of the MCT funnel door (F2,7 =
0.39, P = 0.693). In fact, the largest nutria was captured in a trap with the smallest
entrance diameter (10.0 cm) and the smallest nutria was captured in a trap with the largest
entrance diameter (13.0 cm). No differences between trap types were found for either sex
ratio (χ22 = 1.71, P = 0.191) or the total number of nutria captured (χ1
2 = 1.39, P = 0.239).
Figure 4.2.3. Comparison of the distribution of nutria captures by size class (kg) between multiple-capture
traps and standard cage traps deployed in pairs at seven locations on Sauvie Island, Oregon, from March-
April 2011

- 88 -
Non-target catches differed greatly between MCTs and SCTs. The MCT virtually
eliminated non-target catches (one opossum), while the SCT caught numerous non-target
individuals: 35 muskrats (Ondatra zibethicus), two skunks (Mephitis mephitis), two
opossums, one feral cat (Felis catus), one brown rat (Rattus norvegicus), one brush rabbit
(Sylvilagus bachmani), and one songbird (species unknown). It should be noted that the
SCT data were likely skewed because released native non-target individuals, particularly
muskrats, were likely recaptured on multiple occasions. However, non-target capture
rates between the trap types still differed using the minimum number of unique non-
target animal captured (11 muskrats, two opossums, one skunk, one feral cat, one brown
rat, one brush rabbit, one songbird; χ12 = 13.48, P < 0.001). Between 53-73% of total
SCT captures were non-target individuals, while the single opossum in the MCT
accounted for 9% of total MCT captures.
The MCTs did not retain multiple animals on any occasions. However, camera
surveillance showed multiple nutria present in a MCT on at least two occasions. In both
cases, at least one individual was a small nutria that escaped. One escape was through
the funnel door and the other through the welded wire fencing. Full-size nutria escaped
from MCTs on at least three occasions. One animal escaped through the top of the trap,
another escaped through a bottom corner where a piece of welded wire fencing was
broken, and the nature of the third escape could not be determined. Camera surveillance
also showed the presence of nutria in the vicinity of both trap types without animals
entering on numerous occasions (Figure 4.2.4). Nutria social groups observed by the
cameras generally consisted of one large individual and multiple smaller individuals

- 89 -
(likely juveniles). Other species that were occasionally documented by camera
surveillance but were never captured were beaver (Castor canandensis) and raccoon
(Procyon lotor). Neither of these species were observed trying to enter either trap type.
Figure 4.2.4. Camera surveillance capture of a nutria social group in the vicinity of a nutria multiple-
capture trap on Sauvie Island, Oregon
The initial construction of MCTs by one person took a mean time of 13.0 minutes
(ranged from 10-17 minutes) when traps were fully constructed in the field (n = 24) and
7.0 minutes (ranged from 6-8 minutes) when traps were partially constructed off-site and
folded for transport (n = 6). Trap maintenance time (i.e., inspection, bait refill, and
animal removal) was not recorded, but was similar between trap types. Bait was missing
on occasion from both trap types, but camera surveillance did not identify the source of
bait removal events.
DISCUSSION
The MCT did not capture and retain multiple nutria simultaneously, but
differences between the trap types existed. The MCT was more efficient at targeting
individuals > 6.0 kg and failed to capture any nutria < 3.7 kg, while the SCT captured a

- 90 -
higher proportion of animals < 6.0 kg. The SCT demonstrated a high rate of non-target
captures, which was not an issue for the MCT. While camera surveillance did not detect
a large number of non-target animals entering and exiting the MCTs, the inability of the
MCT to retain small animals likely contributed to the low rate of non-target captures.
The design of each trap type played a role in size bias and total capture rate
results. Camera surveillance showed juvenile nutria moved in and out of MCTs on
occasion. The ability of the MCT to capture all size classes is especially important
considering that nutria form social groups consisting of both adults and juveniles
(Guichón et al. 2003b, Túnez et al. 2009). These social groups were regularly
documented by camera surveillance (Figure 4.2.4), but the inability of the MCT design to
capture small individuals within social groups limited its efficacy. The SCT might have
had less of a size bias if a larger trap (e.g., 106.7 cm L × 38.1 cm W × 38.1 cm H) had
been used, but problems with non-target catches likely would have persisted due to a low
escape rate.
Results point to several potential design modifications that may improve the
performance of the nutria MCT. Large nutria were captured in MCTs with the minimum
funnel door diameter of 10.0 cm. Deployment protocol of the nutria MCT should include
a maximum funnel diameter of 10.0 cm, and smaller diameter sizes may be appropriate.
Other entrance designs (e.g., rotating paddle door, one-way door) also could be explored.
Observations support the conclusion of Witmer et al. (2008) that small animal escape is a
primary concern for the MCT. However, it should be noted that MCT design

- 91 -
modifications to retain smaller juvenile nutria may result in a corresponding increase in
the capture rate of small non-target species (e.g., muskrats).
Habitat-specific modifications, some of which have been applied to SCTs, could
also improve the efficacy of the MCT. For example, cage traps deployed on rafts have
been shown to capture more nutria than those deployed on land (Baker and Clarke 1988).
The base of the MCT could be modified to anchor to a raft when open water is prevalent.
The height of the MCT could be reduced in habitats (e.g., metropolitan areas) where
discrete trapping is a priority, with reduced trap mass as an added benefit.
MCT performance results differed somewhat in comparison to the initial field
testing in Louisiana (Witmer et al. 2008). This study experienced a lower nutria CPUE
(0.036) than the CPUE reported in Louisiana (0.122); however, it was within the reported
range of other nutria studies (Bounds et al. 2003). The timing for the study may have
contributed to the low trapping success. Trapping was conducted in the early spring
when vegetation was emerging, possibly making the bait less attractive to nutria because
of abundant natural food sources. This hypothesis is supported by the fact that cameras
regularly observed nutria in close proximity to both MCTs and SCTs without entering. A
pre-baiting period longer than three days also may have improved trapping success.
Another difference between the studies was nutria size, as nutria captured in the
MCT were larger on Sauvie Island (6.4 kg ± 1.8 kg [SD]) than in Louisiana (3.8 kg ± kg
[1.3 SD]). This is likely a result of smaller animals in the Louisiana population due to
high trapping pressure in Terrebonne Parish, Louisiana, where Witmer et al. (2008)
conducted their study (Gary Witmer, USDA National Wildlife Research Center, personal

- 92 -
communication). Finally, Witmer et al. (2008) captured multiple nutria in a trap on three
occasions while no successful multiple-capture events occurred on Sauvie Island.
The MCT prototype shows promise as a new nutria population control tool to
supplement other tools and techniques in an adaptive management strategy, particularly if
both adults and juveniles can be put at risk. However, the advantages and disadvantages
(Table 4.2.2) of the current nutria MCT design should be considered on a case-by-case
basis. For example, the MCT could be the best option for land managers in sensitive
habitats and metropolitan areas where non-target issues are a primary concern. The SCT
might be a better option when wildlife control operators need to quickly and discretely
move in and out of an area. Other possible options for population control may be to 1)
simultaneously deploy both MCTs and SCTs to target all nutria size classes more
efficiently, 2) modify the MCT design to reduce the escape rate of smaller animals, or 3)
use larger SCTs to reduce size bias against larger animals. These strategies also could
potentially be employed for other nuisance species of similar body size.
Table 4.2.2. Comparison of the performance and deployment advantages (+) and disadvantages (−)
between nutria multiple-capture cage traps and standard cage traps
Trap Type
Performance SCT MCT
Multiple catches not possible (−) possible (+)
Non-target catches many (−) none/few (+)
Active period inactive when tripped (−) always active (+)
Animal escape possible, trap fails to trip (−) possible, small animals escape (−)
Deployment
Cost moderate: $80 (+) expensive: $130 (−)
Size/mass small: 3.5 kg (+) large: 20 kg (−)
Placement options most locations (+) relatively flat 2 m2 area (−)
Initial placement low effort (+) moderate effort: 7-13 minutes (−)

- 93 -
This study only compared the efficacy of the MCT to a standard cage trap for one
species, but results have broad applications for vertebrate capture. While multiple
trapping methods are often employed for both invasive and native mammal capture,
direct comparisons of trap performance at the intraspecific level are not common
(Blundell et al. 1999, Morriss et al. 2000). The observed biases toward certain nutria size
classes for both trap types on Sauvie Island suggest this phenomenon should be carefully
examined for other vertebrate pest species. This is especially important for eradication
campaigns since the ability to put all animals at risk is needed for success (Bomford and
O’Brien 1995). The importance of limiting non-target captures is obvious for kill traps,
but the ability of live traps to limit non-target captures, as demonstrated by the nutria
MCT, is important as well. Some mammals, such as beaver (Arjo et al. 2008; Jimmy
Taylor, USDA Wildlife Services, personal communication), captured in live traps can
experience capture myopathy leading to acute or delayed mortality, so the assumption
that non-target animals can simply be released without risk is not always accurate.
The central promise of the MCT is the potential to capture multiple animals at
once. This has many advantages when dealing with species, like nutria, that live in
family groups. While this promise was not fulfilled with the current nutria MCT design,
a modified MCT design to prevent small animal escape may improve efficacy. The MCT
concept is an important development in the ongoing attempts to mitigate vertebrate pest
impacts around the globe. Continued development of new control methods, such as the
MCT, is crucial for effective vertebrate pest population control and management in both
urban and rural habitats.

- 94 -
CHAPTER 5
CONCLUSIONS AND RECOMMENDATIONS
Section 1. Research conclusions and contributions
The paucity of nutria research in the Pacific Northwest since the initial
introduction of the species in the 1930s has resulted in large gaps in knowledge. My
primary research goal was to address the following questions in relation to the
management of regional nutria populations, particularly in metropolitan habitats:
1. What is the current and potential future regional distribution of suitable habitat for
nutria populations and do climatic factors determine this distribution? (Chapter 2)
2. Do nutria activity and movement patterns in regional metropolitan habitats differ
from patterns reported elsewhere in non-urban habitats? (Chapter 3)
3. Are there potential new damage mitigation tools to address nutria management
and control needs specific to metropolitan habitats? (Chapter 4)
Chapter 2 conclusions and contributions.—The assumption that cold
temperatures limit nutria distribution was formally tested for the first time. The close
match between the habitat suitability model results and the known population distribution
for both the Pacific Northwest and contiguous United States supported this previously
held assumption. Additionally, the accuracy and simplicity of the model provides a
framework for similar modeling approaches for other cold-limited species.
The direct relationship between temperature and suitable nutria habitat also
allowed for potential future suitable nutria habitat to be modeled based on future climate

- 95 -
change scenarios. The first approximation future habitat model suggested that substantial
nutria range expansion could potentially occur both regionally and nationally in the near
future. The development of the nutria habitat suitability model also provides the
foundation for future research on the impact of climate change on the distribution of
nutria, and other non-native species, in the United States and elsewhere.
Chapter 3 conclusions and contributions.—Nutria in metropolitan habitats in the
Pacific Northwest exhibited higher levels of diurnal activity than non-urban nutria
populations located elsewhere, which increases potential conflict with humans. Limited
movement within these habitats indicated that urban habitat restoration sites can serve as
core habitat for regional nutria populations. These results are the first step toward filling
a large knowledge gap in relation to the behavior of nutria populations in the Pacific
Northwest and should inform regional control and management strategies.
The regional nutria activity study also employed new telemetry methods that are
broadly applicable. This was the first study to use remote radio-telemetry methods to
monitor nutria activity patterns continuously, and the demonstrated methodology can be
used for other telemetry studies on animal activity cycles. The study also included an
assessment of a new breakaway neck collar design for attaching radio-transmitters to
nutria and contributed additional information regarding the efficacy of a tail mount
system. The design of these naturally detaching transmitter deployment techniques can
be adapted for deployment on other species.
Chapter 4 conclusions and contributions.—Vexar® plastic mesh protection tubes,
previously thought to be ineffective for preventing woody vegetation from nutria damage,

- 96 -
were very effective at mitigating nutria herbivory during initial establishment of
restoration plantings. Comparing this result with the conflicting conclusion of a previous
study highlights the potential importance of herbivore population management prior to
habitat restoration work. This is also the first research to identify black cottonwood
(Populus balsamifera ssp. trichocarpa), a commonly used species for urban wetland
restoration in the Pacific Northwest, as a targeted food source for nutria. This observed
preference suggests knowledge of herbivore food habits is important for the success of
habitat restoration efforts.
The trapping research provided new information about the efficacy of a recently
developed nutria multiple-capture cage trap compared to a standard cage trap. The
observation that both trap types were biased toward certain nutria size classes highlights a
potential issue for other vertebrate pest control efforts, particularly eradication
campaigns. The multiple-capture trap also was identified as a potential control tool for
nutria, and potentially other nuisance species of similar body size, in urban habitats
because it exhibited much lower non-target capture rates than standard cage traps.
Section 2. Management recommendations
1. Creation of state and/or regional nutria management plan(s).—The development
of nutria management plans for the Pacific Northwest will be crucial for the long-
term success of managing the regional nutria problem. The current practice of
conducting sporadic local nutria control efforts will become increasing ineffective
over time in light of potential future nutria range expansion. Recent proposed

- 97 -
legislation (Senate Bill 899) included Oregon and Washington as states eligible to
competitively apply for federal funding had the legislation passed, however, any
available future funds are unlikely to be awarded to the Pacific Northwest states if
management plans are not in place. Past and current management and eradication
programs from other regions (e.g., Great Britain, Louisiana, Maryland) should be
used as resources.
2. Identification of priority areas for early detection and rapid response.—A
primary component of regional management moving forward should be the
identification of priority geographic areas for nutria early detection/rapid response
(EDRR) efforts. Such an effort has already been successful in Skagit County,
Washington (Davison and Bohannon 2005), which should be used as a resource
for EDRR efforts. Additionally, the climate change work has provided a
framework for identifying priority areas. For example, modeling suggests the Tri-
Cities region in Washington will be future suitable habitat. Anecdotal nutria
sightings from this area have been reported in the past, and the three primary
water sources for eastern Washington (Columbia River, Yakima River, and Snake
River) converge in the Tri-Cities area.
3. Identification of key stakeholders.—The identification of key stakeholders in the
Pacific Northwest is important for several reasons. First, resources are needed to
effectively coordinate and communicate regional nutria management activities,
such as EDRR efforts and the creation of a regional nutria database. Second,
current state regulations in relation to nutria control differ between Oregon and

- 98 -
Washington. Stakeholders could work to standardize these regulations to
facilitate full cooperation between the states. Third, active nutria management
and eradication programs in Louisiana and Maryland, respectively, have relied on
federal funding, which increases the likelihood of proposed federal nutria
legislation in the near future. Stakeholders in place in the Pacific Northwest could
promote the need to include Oregon and Washington in future nutria legislation.
4. Public education.—Non-native nutria populations have been present in the region
for 80 years, yet some people are unaware the nutria is an invasive species.
Others choose to accept the nutria as a naturalized species (Christie 2012). In
both cases, these people are largely unaware of the detrimental impacts caused by
nutria. Anecdotally, public knowledge about nutria in the region has increased as
a result of outreach associated with this dissertation research, but continued
education and outreach is needed to continue to inform the public about the
regional nutria problem. Even simple steps such as posting informational signage
in locations (e.g., public parks) where close contact between nutria and people is
common have proven to be effective (Laura Guderyahn, City of Gresham,
personal communication).
5. Pilot control program.—A pilot control program to eradicate nutria from a local
watershed would provide valuable information about the efficacy of regional
control efforts moving forward. The channelized nature of nutria habitat in the
Pacific Northwest, compared to vast wetlands in other regions, suggests a
systematic control and monitoring program could be feasible. Candidate

- 99 -
watersheds for a pilot program should include habitat in developed areas to reflect
the region-wide presence of nutria in these habitats. One possible location is the
Ash Creek Watershed in Polk County, Oregon, where a citizen bounty program
has already been developed (Jackie Hastings, Polk County Soil and Water
Conservation District, personal communication). Specific research goals attached
to the control effort would further increase the value of such a pilot program.
Section 3. Research recommendations
1. Effects on native fauna.—Nutria can potentially affect native fauna both directly
and indirectly. Apparent declines in native muskrat (Ondatra zibethicus)
populations have been observed in areas where nutria are abundant on the Finley
National Wildlife Refuge in western Oregon (Heidi Brunkal, US Fish and
Wildlife Service, personal communication). However, potential competition
between nutria and muskrats has never been formally studied. Nutria may also
indirectly affect sensitive species, such as federally listed Pacific salmon
(Oncorhynchus spp.), through habitat degradation. For example, nutria damage
compromised a salmon habitat restoration project in Vancouver, Washington
(Tim Esary, City of Vancouver, personal communication). Scientific research of
these largely unstudied effects to fauna native in the Pacific Northwest is needed.
2. Occurrence of zoonotic diseases.—Diseases found in nutria populations are well-
studied in other regions, but little is known about diseases in regional nutria
populations. The presence of nutria in metropolitan habitats in the Pacific

- 100 -
Northwest necessitates the need for information about zoonotic diseases harbored
in these populations. The known presence of tularemia in nutria in Vancouver,
Washington (Justin Stevenson, formerly USDA Wildlife Services, personal
communication), and giardia in Polk County, Oregon (Jackie Hastings, Polk
County Soil and Water Conservation District, personal communication),
highlights the need for information. Disease surveys, particularly in metropolitan
habitats, would identify potential risks to public health. Surveys would also
provide information about potential disease transmission to native species.
3. Extent of herbivory and burrowing damage.—Regional landowners and natural
resources managers regularly report nutria herbivory and burrowing damage, but
the extent of damage is unknown. Anecdotally, nutria control efforts can
dramatically reduce damage. A nutria trapping program in Seattle, Washington,
resulted in the recovery of vegetation in wetland habitats along the fringes of
Lake Washington (Justin Dayton, USDA Wildlife Services, personal
communication). A local nutria bounty program on Puget Island, Washington, led
to greatly reduced dike repair costs (Gordon Oman, Wahkiakum County Diking
District #1, personal communication). Long-term research on nutria damage
before and after control efforts would help quantify the extent of damage and
provide data for cost-benefit analyses of regional nutria control efforts.
4. Additional habitat suitability analysis.—The habitat suitability and climate
change analysis results raise additional questions about current and future suitable
habitat for nutria in the Pacific Northwest. The habitat suitability model answered
- 101 -
a specific question about minimum temperature and therefore did not attempt to
identify areas of marginal nutria habitat. The first approximation climate change
model assessed potential future habitat on a region-wide scale. However, analysis
at more local scales could prove useful. For example, the temporary presence of
nutria in the Yakima Valley, Washington, in the 1970s-1980s suggests this area
represents marginal habitat. Targeted assessment of invasion potential into high
priority areas such as the Yakima Valley or Tri-Cities area would be valuable.
5. Population estimation indices.—Nutria population indices, both direct and
indirect, have been developed in other regions (Ras 1999, Corriale et al. 2008),
albeit with limited success. However, these methods may not be applicable in the
Pacific Northwest due to different habitat characteristics. The development of
accurate population indices specific to habitats in the Pacific Northwest would be
a valuable tool for answering research questions. For example, it is possible that
nutria population densities are higher in metropolitan habitats due to distinct
habitat boundaries and nutria diets being supplemented by human feeding
(personal observation). Direct and indirect population indices (e.g., removal
sampling, burrow density, tracks and feces) could be developed in conjunction
with a pilot eradication program.

- 102 -
LITERATURE CITED
Abbas, A. 1991. Feeding strategy of coypu (Myocastor coypus) in central western France.
Journal of Zoology 224:385-401.
Alford, R. A., G. P. Brown, L. Schwarzkopf, B. L. Phillips, and R. Shine. 2009.
Comparisons through time and space suggest rapid evolution of dispersal
behavior in an invasive species. Wildlife Research 36:23-28.
Aliev, F. F. 1965. Dispersal of nutria in the USSR. Journal of Mammalogy 46:101-102.
Allouche, O., A. Tsoar, and R. Kadmon. 2006. Assessing the accuracy of species
distribution models: prevalence, kappa, and the true skill statistic (TSS). Journal
of Applied Ecology 43:1223-1232.
American Veterinary Medical Association. 2007. AVMA guidelines on euthanasia.
<http://www.avma.org/issues/animal_welfare/euthanasia.pdf>. Accessed 12 July
2012.
Arjo, W. M., R. E. Joos, C. O. Kochanny, J. L. Harper, D. L. Nolte, and D. L. Bergman.
2008. Assessment of transmitter models to monitor beaver Castor Canadensis and
C. fiber populations. Wildlife Biology 14:309-317.
Association of Fish and Wildlife Agencies. 2006. Best management practices for trapping
nutria in the United States. <http://www.fishwildlife.org/files/Nutria_BMP.pdf>.
Accessed 12 July 2012.
Atwood, E. L. 1950. Life history studies of nutria, or coypu, in coastal Louisiana. Journal
of Wildlife Management 14:249-265.

- 103 -
Babero, B. B. and J. W. Lee. 1961. Studies on the helminthes of nutria, Myocastor
coypus (Molina), in Louisiana with check-list of other worm parasites from this
host. Journal of Parasitology 47:378-390.
Bailey, D. W., J. E. Gross, E. A. Laca, L. R. Rittenhouse, M. B. Coughenour, D. M.
Swift, and P. L. Sims. 1996. Mechanisms that result in large herbivore grazing
distribution patterns. Journal of Range Management 49:386-400.
Baker, S. J. and C. N. Clarke. 1988. Cage trapping coypus (Myocastor coypus) on baited
rafts. Journal of Applied Ecology 25:41-48.
Bănăţean-Dunea, M. Bura, A. Grozea, S. Voia, S. Pătruică, and C. Călămar. 2010. The
influence of forage combination maize grain – fodder beet on feeding behavior
duration for intensively farmed coypu (nutria). Scientific Papers: Animal Science
and Biotechnologies 43:80-86.
Belsky, A. J., A. Matzke, and S. Uselman. 1999. Survey of livestock influences on stream
and riparian ecosystems in the western United States. Journal of Soil and Water
Conservation 54:419-431.
Bengsen, A., L. K. Leung, S. J. Lapidge, and I. J. Gordon. 2008. The development of
target-specific vertebrate pest management tools for complex faunal communities.
Ecological Management and Restoration 9:209-216.
Bernhardt, E. S., M. A. Palmer, J. D. Allan, G. Alexander, K. Barnas, and S. Brooks.
2005. Synthesizing U.S. river restoration efforts. Science 308:636–637.

- 104 -
Bertolino, S. and B. Ingegno. 2009. Modelling the distribution of an introduced species:
the coypu Myocastor coypus (Mammalia, Rodentia) in Piedmont region, NW
Italy. Italian Journal of Zoology 76:340-346.
Bertolino, S. and R. Viterbi. 2010. Long-term cost-effectiveness of coypu (Myocastor
coypus) control in Piedmont (Italy). Biological Invasions 12:2549-2558.
Bertolino, S., A. Perrone, and L. Gola. 2005. Effectiveness of coypu control in small
Italian wetland areas. Wildlife Society Bulletin 33:714-720.
Bertolino, S., C. Angelici, E. Monaco, A. Monaco, and D. Capizzi. 2011. Interactions
between coypu (Myocastor coypus) and bird nests in three Mediterranean
wetlands of central Italy. Hystrix-Italian Journal of Mammalogy 22:333-339.
Beyer, H. L. 2012. Geospatial Modelling Environment, Version 0.7.2.1. (software).
<http://www.spatialecology.com/gme>.
Blundell, G. M., J. W. Kern, R. T. Bowyer, and L. K. Duffy. 1999. Capturing river otters:
a comparison of Hancock and leg-hold traps. Wildlife Society Bulletin 27:184-
192.
Blundell, G. M., J. A. Maier, and E. M. Debevec. 2001. Linear home ranges: effects of
smoothing, sample size, and autocorrelation on kernel estimates. Ecological
Monographs 71:469-489.
B , R. F., F. Palomares, . F. Beltr n, . de illafa e, and S. Moreno. 1994.
Immobilization of coypus (Myocastor coypus) with ketamine hydrochloride and
xylazine hydrochloride. Journal of Wildlife Diseases 30:596-598.

- 105 -
Bollo, E., P. Pregel, S. Gennero, E. Pizzoni, S. Rosati, P. Nebbia, and B. Biolatti. 2003.
Health status of a population of nutria (Myocastor coypus) living in a protected
area in Italy. Research in Veterinary Science 75:21-25.
Bomford, M. and P. O’Brien. 1995. Eradication or control for vertebrate pests?. Wildlife
Society Bulletin 23:249-255.
Boorman, L. A. and R. M. Fuller. 1981. The changing status of reedswamp in the Norfolk
Broads. Journal of Applied Ecology 18:241-269.
Borgnia, M., M. L. Galante, and M. H. Cassini. 2000. Diet of the coypu (Nutria,
Myocastor coypus) in agro-systems of Argentinean pampas. Journal of Wildlife
Management 64:354-361.
Bounds, D. L. 2000. Nutria: an invasive species of national concern. Wetland Journal
12:9-16.
Bounds, D. B. and G. A. Carowan, Jr. 2000. Nutria: a nonnative nemesis. Transactions
of the North American Wildlife and Natural Resources Conference 65:405-413.
Bounds, D. L., M. H. Sherfy, and T. A. Mollett. 2003. Nutria. Pages 1119-1147 in G. A.
Feldhamer, B. C. Thompson, and J. A. Chapman, editors. Wild Mammals of
North America: Biology, Management, and Conservation, Second Edition. The
Johns Hopkins University Press, Baltimore, Maryland, USA.
Brook, B. W. 2008. Synergies between climate change, extinctions and invasive
vertebrates. Wildlife Research 35:249-252.

- 106 -
Brown, L. N. 1975. Ecological relationships and breeding biology of the nutria
(Myocastor coypus) in the Tampa, Florida, area. Journal of Mammalogy 56:928-
930.
Burt, W. H. 1943. Territoriality and home range concepts as applied to mammals. Journal
of Mammalogy 24:346-352.
Carter, J. and B. P. Leonard. 2002. A review of the literature on the worldwide
distribution, spread of, and efforts to eradicate the coypu (Myocastor coypus).
Wildlife Society Bulletin 30:162-175.
Carter, J., A. L. Foote, and L. A. Johnson-Randall. 1999. Modeling the effects of nutria
(Myocastor coypus) on wetland loss. Wetlands 19:209-218.
Chabreck, R. 1962. Daily activity of nutria in Louisiana. Journal of Mammalogy 43:337-
344.
Chapman, J. A., G. R. Willner, K. R. Dixon, and D. Pursley. 1978. Differential survival
rates among leg-trapped and live-trapped nutria. Journal of Wildlife Management
42:926-928.
Chen, I. C., J. K. Hill, R. Ohlemüller, D. B. Roy, and C. D. Thomas. 2011. Rapid range
shifts of species associated with high levels of climate warming. Science
333:1024-1026.
Christie, D. 2012. Hi! I’m a nutria. The New York Times, opinionated documentary. 19
March. <http://www.nytimes.com/2012/03/20/opinion/hi-im-a-nutria.html?_r=0>.

- 107 -
City of Eugene, Oregon. 2012. Delta Ponds floodplain restoration project summary.
<http://www.eugene-or.gov/DocumentCenter/Home/View/5890>. Accessed 29
October 2012.
Cocchi, R. and F. Riga. 2008. Control of a coypu Myocastor coypus population in
northern Italy and management implications. Italian Journal of Zoology 75:37-42.
Conner, W. H. and J. R. Toliver. 1987. Vexar seedling protectors did not reduce nutria
damage to planted baldcypress seedlings. Tree Planters’ Notes 38:26-29.
Conover, M. R., W. C. Pitt, K. K. Kessler, T. J. DuBow, and W. A. Sanborn. 1995.
Review of human injuries, illnesses, and economic losses caused by wildlife in
the United States. Wildlife Society Bulletin 23:407-414.
Coreil, P. D. and H. R. Perry, Jr. 1977. A collar for attaching radio transmitters to nutria.
Proceedings of the Annual Conference of the Southeastern Association of Game
and Fish Agencies 31:254-258.
Coreil, P. D., P. J. Zwank, and H. R. Perry, Jr. 1988. Female nutria habitat use in the
intermediate marsh zone of coastal Louisiana. Proceedings of the Louisiana
Academy of Sciences 51:21-30.
Corriale, M. J., S. M. Arias, R. F. Bó, and G. Porini. 2006. Habitat-use patterns of the
coypu Myocastor coypus in an urban wetland of its original distribution. Acta
Theriologica 51:295-302.
Corriale, M. J., S. M. Arias, R. F. Bó, and G. Porini. 2008. A methodology for indirect
estimation of the Myocastor coypus abundance at an urban wetland in Argentina.
Acta Zoologica Sinica 54:164-168.

- 108 -
Crosthwaite, J. C., S. Sobek, D. B. Lyons, M. A. Bernards, and B. J. Sinclair. 2011. The
overwintering physiology of the emerald ash borer, Agrilus planipennis Fairmaire
(Coleoptera: Buprestidae). Journal of Insect Physiology 57:166-173.
D’Adamo, P., M. L. uich n, R. F. B , and M. H. Cassini. 2000. Habitat use by coypu
Myocastor coypus in agro-systems of the Argentinean Pampas. Acta Theriologica
45:25-33.
Davidson, D. W. 1993. The effects of herbivory and granivory on terrestrial plant
succession. Oikos 68:23-35.
Davison, M. and J. Bohannon. 2005. Nutria (Myocastor coypus) in Skagit County, WA:
Background, Trapping Results, and Recommendations. Unpublished report.
Washington Department of Fish and Wildlife.
Deems, E. F. and D. Pursley, eds. 1978. North American furbearers: their management,
research and harvest status in 1976. International Association of Fish and Wildlife
Agencies in cooperation with the Maryland Department of Natural Resources-
Wildlife Administration. University of Maryland, College Park, USA.
Delaware Department of Natural Resources and Environmental Control. 2012. First
invasive nutria population since 2002 confirmed in Delaware [Press release].
<http://www.dnrec.delaware.gov/News/Pages/First-invasive-nutria-population-
since-2002-confirmed-in-Delaware.aspx>.
Denena, M. M., R. W. Manning, and T. R. Simpson. 2003. Home range and movement of
nutria (Myocastor coypus) at Spring Lake in central Texas, with anecdotal
- 109 -
comments on the American beaver (Castor canadensis) of the same area.
Museum of Texas Tech University, Occasional Paper #226.
Dennis, T. E. and S. F. Shah. 2012. Assessing acute effects of trapping, handling, and
tagging on the behavior of wildlife using GPS telemetry: a case study of the
common brushtail possum. Journal of Applied Animal Welfare Science 15:189-
207.
Dickman, A. J. 2010. Complexities of conflict: the importance of considering social
factors for effectively resolving human-wildlife conflict. Animal Conservation
13:458-466.
Ditchkoff, S. S., S. T. Saalfeld, and C. J. Gibson. 2006. Animal behavior in urban
ecosystems: modifications due to human-induced stress. Urban Ecosystems 9:5-
12.
Doncaster, C. P. and T. Micol. 1989. Annual cycle of a coypu (Myocastor coypus)
population: male and female strategies. Journal of Zoology 217:227-240.
Doncaster, C. P. and T. Micol. 1990. Response by coypus to catastrophic events of cold
and flooding. Holarctic Ecology 13:98-104.
Dorcas, M. E., J. D. Wilson, and J. W. Gibbons. 2011. Can invasive Burmese pythons
inhabit temperate regions of the southeastern United States?. Biological Invasions
13:793-802.
Dormann, C. F., S. S. Schymanski, J. Cabral, I. Chuine, C. Graham, F. Hartig, M.
Kearney, X. Morin, C. Römermann, B. Schröder, and A. Singer. 2012.

- 110 -
Correlation and process in species distribution models: bridging a dichotomy.
Journal of Biogeography 39:12:2119-2131.
Dozier, H. L. 1985. The present status and future of nutria in the southeast states.
Proceedings of the Annual Conference of the Southeastern Association of Game
and Fish Commissioners 5:368-373.
Drake, J. M. 2005. Risk analysis for invasive species and emerging infectious diseases:
concepts and applications. American Midland Naturalist 153:4-19.
Dukes, J. S. and H. A. Mooney. 1999. Does global change increase the success of
biological invaders?. Trends in Ecology and Evolution 14:135-139.
Ehrlich, S. 1967. Field studies in the adaptation of nutria to seasonal variations.
Mammalia 31:347-360.
Elith, J. and C. H. Graham. 2009. Do they? How do they? Why do they differ? On
finding reasons for differing performances of species distribution models.
Ecography 32:66-77.
Elith, J. and J. R. Leathwick. 2009. Species distribution models: ecological explanation
and prediction across space and time. Annual Review of Ecology, Evolution, and
Systematics 40:677-697.
Elith, J., S. J. Phillips, T. Hastie, M. Dudík, Y. E. Chee, and C. J. Yates. 2011. A
statistical explanation of MaxEnt for ecologists. Diversity and Distributions
17:43-57.

- 111 -
Ellis, E. A. 1963. Some effects of selective feeding by the coypu (Myocastor coypus) on
the vegetation of Broadland. Transactions of the Norfolk and Norwich
Naturalists’ Society 20:32-35.
Elton, C. S. 1958. The ecology of invasions by animals and plants. Methuen Publishing,
London, England.
Emlen, J. M. 1966. The role of time and energy in food preference. American Naturalist
100:611-617.
Engeman, R. M., R. M. Anthony, V. G. Barnes, H. W. Krupa, and J. Evans. 1999.
Evaluations of plastic mesh tubes for protecting conifer seedlings from pocket
gophers in three western states. Western Journal of Applied Forestry 14:86-90.
ESRI. 2010. ArcGis, Version 10.1 in ESRI, Redlands, California, USA. (software).
Evans, J. 1970. About nutria and their control. United States Bureau of Sports Fisheries
and Wildlife Resource Publication 86, Denver, Colorado, USA.
Evans, J., J. O. Ellis, R. D. Nass, and A. L. Ward. 1971. Techniques for capturing,
handling, and marking nutria. Proceedings of the Annual Conference of the
Southeastern Association of Game and Fish Commissioners 25:295-315.
Fall, M. W. and W. B. Jackson. 1998. A new era of vertebrate pest control? An
introduction. International Biodeterioration and Biodegradation 42:85-91.
Fall, M. W. and W. B. Jackson. 2002. The tools and techniques of wildlife damage
management—changing needs: an introduction. International Biodeterioration
and Biodegredation 49:87-91.

- 112 -
Fielding, A. H. and J. F. Bell. 1997. A review of methods for the assessment of prediction
errors in conservation presence/absence models. Environmental Conservation
24:38-49.
Fischer, J. D., S. H. Cleeton, T. P. Lyons, and J. R. Miller. 2012. Urbanization and the
predation paradox: the role of trophic dynamics in structuring vertebrate
communities. BioScience 62:809-818.
Flato, G. M., G. J. Boer, W. G. Lee, N. A. McFarlane, D. Ramsden, M. C. Reader, and A.
J. Weaver. 2000. The Canadian Centre for Climate Modelling and Analysis
Global Coupled Model and its climate. Climate Dynamics 16:451-467.
Fleischner, T. L. 1994. Ecological costs of livestock grazing in western North America.
Conservation Biology 8:629-644.
Florance, D., J. K. Webb, T. Dempster, M. R. Kearney, A. Worthing, and M. Letnic.
2011. Excluding access to invasion hubs can contain the spread of an invasive
vertebrate. Proceedings of the Royal Society B 278:2900-2908.
Fordham, D. A., H. R. Akçakaya, M. Araújo, and B. W. Brook. 2012. Modeling range
shifts for invasive vertebrates in response to climate change. Pages 86-108 in J. F.
Brodie, E. S. Post, and D. F. Doak, eds. Wildlife Conservation in a Changing
Climate. University of Chicago Press, Chicago, Illinois, USA.
Gabrey, S. W., N. Kinler, and R. M. Elsey. 2009. Impacts of nutria removal on food
habits of American alligators in Louisiana. Southeastern Naturalist 8:347-354.

- 113 -
Gale Research Company. 1985. Narrative Summaries, Tables and Maps for Each State
with Overview of State Climatologist Programs, Third Edition. National Oceanic
and Atmospheric Administration, Washington, DC, USA.
Garshelis, D. L. and C. R. McLaughlin. 1998. Review and evaluation of breakaway
devices for bear radiocollars. Ursus 10:459-465.
Gedan, K. B., C. M. Crain, and M. D. Bertness. 2009. Small-mammal herbivore control
of secondary succession in New England tidal marshes. Ecology 90:430-440.
George, S. L. and K. R. Crooks. 2006. Recreation and large mammal activity in an urban
nature reserve. Biological Conservation 133:107-117.
Gering, J. C. and R. B. Blair. 1999. Predation on artificial bird nests along an urban
gradient: predatory risk or relaxation in urban environments?. Ecography 22:532-
541.
Gilchrist, J. S. and E. Otali. 2002. The effects of refuse-feeding on home-range use,
group size, and intergroup encounters in the banded mongoose. Canadian Journal
of Zoology 80:1795-1802.
Girard, I., C. Dussault, J. P. Ouellet, R. Courtois, and A. Caron. 2006. Balancing number
of locations with number of individuals in telemetry studies. Journal of Wildlife
Management 70:1249-1256.
Google. 2011. Google Earth, Version 6.1. <http://www.google.com/earth/index.html>.
Created November 2012.
Gosling, L. M. 1974. The coypu in East Anglia. Transactions of the Norfolk and Norwich
Naturalists Society 23:49-59.

- 114 -
Gosling, L. M. 1979. The twenty-four hour activity cycle of captive coypus (Myocastor
coypus). Journal of Zoology 187:341-367.
Gosling, L. M. 1980. The duration of lactation in feral coypus (Myocastor coypus).
Journal of Zoology 191:461-474.
Gosling, L. M. 1981a. Climatic determinants of spring littering by feral coypus,
Myocastor coypus. Journal of Zoology 195:281-288.
Gosling, L. M. 1981b. The effect of cold weather on success in trapping feral coypus
(Myocastor coypus). Journal of Applied Ecology 18:467-470.
Gosling, L. M. 1986. Selective abortion of entire litters in the coypu: adaptive control of
offspring production in relation to quality and sex. The American Naturalist
127:772-795.
Gosling, L. M. and S. J. Baker. 1981. Coypu (Myocastor coypus) potential longevity.
Journal of Zoology 197:285-312.
Gosling, L. M. and S. J. Baker. 1987. Planning and monitoring an attempt to eradicate
coypus from Britain. Symposia of the Zoological Society of London 58:99-113.
Gosling, L. M. and S. J. Baker. 1989. Demographic consequences of differences in the
ranging behavior of male and female coypus. Pages 155-167 in R. J. Putnam, ed.
Mammals as pests. Chapman and Hall, London, England.
Gosling, L. M. and S. J. Baker. 1991. Coypu. Pages 267-275 in G. B. Corbet and S.
Harris, eds. The handbook of British mammals. Blackwell, Oxford, England.

- 115 -
Gosling, L. M., G. E. Guyon, and K. M. H. Wright. 1980. Diurnal activity of feral coypus
(Myocastor coypus) during the cold winter of 1978-1979. Journal of Zoology
192:143-146.
Gosling, L. M., A. D. Watt, and S. J. Baker. 1981. Continuous retrospective census of the
East Anglian coypu population between 1970 and 1979. Journal of Animal
Ecology 50:885.
Gosling, L. M., S. J. Baker, and J. R. Skinner. 1983. A simulation approach to
investigating the response of a coypu population to climatic variation. EPPO
Bulletin 13:183-192.
Gosling, L. M., S. J. Baker, and C. N. Clarke. 1988. An attempt to remove coypus
(Myocastor coypus) from a wetland habitat in east Anglia. Journal of Applied
Ecology 25:49-62.
Grace, J. B. and M. A. Ford. 1996. The potential impact of herbivores on the
susceptibility of the marsh plant Sagittaria lancifolia to saltwater intrusion in
coastal wetlands. Estuaries 19:13-20.
Guenther, S. E. 1950. Nutria. Game Bulletin 2:5. Washington State Game Department,
Olympia, Washington, USA.
Guichón, M. L. and M. H. Cassini. 1999. Local determinants of coypu distribution along
the Luján River, eastcentral Argentina. Journal of Wildlife Management 63:895-
900.

- 116 -
Guichón, M. L. and M. H. Cassini. 2005. Population parameters of indigenous
populations of Myocastor coypus: the effect of hunting pressure. Acta
Theriologica 50:125-132.
Guichón, M. L., V. Benitez, A. Abba, M. Borgnia, and M. H. Cassini. 2003a. Foraging
behavior of coypus Myocastor coypus: Why do coypus consume aquatic plants?.
Acta Oecologica 24:241-246.
Guichón, M. L., M. Borgnia, C. F. Righi, G. H. Cassini, and M. H. Cassini. 2003b. Social
behavior and group formation in the coypu (Myocastor coypus) in the
Argentinean pampas. Journal of Mammalogy 84:254-262.
Guichón, M. L., C. P. Doncaster, and M. H. Cassini. 2003c. Population structure of
coypus (Myocastor coypus) in their region of origin and comparison with
introduced populations. Journal of Zoology 261:265-272.
Gunn, S. J. and D. J. Schmidly. 1984. Preventing nutria damage to seismic cables with
chemical and physical deterrents. Texas Journal of Science 36:205-215.
Gursky, S. 1998. Effects of radio transmitter weight on a small nocturnal primate.
American Journal of Primatology 46:145-155.
Haramis, G. M. and T. S. White. 2011. A beaded collar for dual micro GPS/VHS
transmitter attachment to nutria. Mammalia 75 79-82.
Harestad, A. S. and F. L. Bunnell. 1979. Home range and body weight – a reevaluation.
Ecology 60:389-402.

- 117 -
Hartmann, H. T., D. E. Kester, F. T. Davies, Jr., and R. L. Geneve. 2002. Plant
Propagation: Principles and Practices. Pearson Education, Inc., Upper Saddle
River, New Jersey, USA.
Hebblewhite, M. and D. T. Haydon. 2010. Distinguishing technology from biology: a
critical review of the use of GPS telemetry data in ecology. Philosophical
Transactions of the Royal Society B 365:2303-2312.
Hellman, J. J., J. E. Byers, B. G. Bierwagen, and J. S. Dukes. 2008. Five potential
consequences of climate change for invasive species. Conservation Biology
22:534-543.
Hickling, R., D. B. Roy, J. K. Hill, R. Fox, and C. D. Thomas. 2006. The distributions of
a wide range of taxonomic groups are expanding polewards. Global Change
Biology 12:450-455.
Hogue, J. and E. Mouton. 2012. Coastwide Nutria Control Program 2011-2012: nutria
harvest distribution 2011-2012 and a survey of nutria herbivory damage in coastal
Louisiana in 2012. Louisiana Department of Wildlife and Fisheries.
<http://nutria.com/uploads/1112CNCPfinalreport_FINAL2.pdf>. Accessed 29
December 2012.
Holcombe, T., T.J. Stohlgren and C. Jarnevich. 2007. Invasive species management and
research using GIS. Managing Vertebrate Invasive Species: Proceedings of an
International Symposium 1:108-114.
Holway, D. A. and A. V. Suarez. 1999. Animal behavior: an essential component of
invasion biology. Trends in Ecology and Evolution 14:328-330.

- 118 -
Hone, J. 1994. Analysis of Vertebrate Pest Control. Cambridge University Press, New
York, New York, USA.
Horning, M., M. Haulena, P. A. Tuomi, and J. E. Mellish. 2008. Intraperitoneal
implantation of life-long telemetry transmitter in otariids. BMC Veterinary
Research 4:51.
Howerth, E. W., A. J. Reeves, M. R. McElveen, and F. W. Austin. 1994. Survey for
selected diseases in nutria (Myocastor coypus) from Louisiana. Journal of
Wildlife Diseases 30:450-453.
Hulme, P. E. 2009. Trade, transport and trouble: managing invasive species pathways in
an era of globalization. Journal of Applied Ecology 46:10-18.
Ingles, L. G. 1965. Mammals of the Pacific States: California, Oregon, Washington.
Stanford University Press, Stanford, California, USA.
Intergovernmental Panel on Climate Change. 2000. Special report on emissions
scenarios. A Special Report of Working Group III of the Intergovernmental Panel
on Climate Change. Cambridge University Press, Cambridge, United Kingdom.
Intergovernmental Panel on Climate Change. 2007. Climate change 2007: synthesis
report. Contribution of Working Groups I, II, and III to the Fourth Assessment
Report of the Intergovernmental Panel on Climate Change. Cambridge University
Press, Cambridge, United Kingdom and New York, New York, USA.
Ionescu, ., C. Paşca, R. uri, M. Popa, . Sârbu, O. Ionescu, M. Sârbu, and A. Paşca.
2010. Interaction of beaver (Castor fiber) with other species of macrofauna rivers.
Revista de Silvicultură şi Cinegetică 15:68-72.

- 119 -
Iverson, S. A., W. S. Boyd, D. Esler, D. M. Mulcahy, and T. D. Bowman. 2006.
Comparison of the effects and performance of four types of radiotransmitters for
use with scoters. Wildlife Society Bulletin 34:656-663.
Jalanka, H. H. and B. O. Roeken. 1990. The use of medetomidine, medetomidine-
ketamine combinations, and atipamezole in nondomestic mammals: a review.
Journal of Zoo and Wildlife Medicine 21:259-282.
James, F. C. 1970. Geographic size variation in birds and its relationship to climate.
Ecology 51:365-390.
Jarnevich, C.S. and T.J. Stohlgren. 2009. Near term climate projections for invasive
species distributions. Biological Invasions 11:1373-1379.
Jeschke, J. M. and D. L. Strayer. 2008. Usefulness of bioclimatic models for studying
climate change and invasive species. Annals of the New York Academy of
Sciences 1134:1-24.
Johnson, R. G. and J. P. Okula. 2006. Antelope bitterbrush reestablishment: a case study
of plant size and browse protection effects. Native Plants Journal 7:125-133.
Johnson-Randall, L. A. and A. L. Foote. 2005. Effects of managed impoundments and
herbivory on wetland plant production and stand structure. Wetlands 25:38-50.
Jojola, S. M., G. W. Witmer, and D. Nolte. 2005. Nutria: an invasive rodent pest or
valued resource?. Proceedings of the Wildlife Damage Management Conference
11:120-126.

- 120 -
Jojola, S. M., G. W. Witmer, and P. W. Burke. 2009. Evaluation of attractants to improve
trapping success of nutria on Louisiana coastal marsh. Journal of Wildlife
Management 73:1414:1419.
Katz, S. L., K. Barnas, R. Hicks, J. Cowen, and R. Jenkinson. 2007. Freshwater habitat
restoration actions in the Pacific Northwest: a decade’s investment of habitat
improvement. Restoration Ecology 15:494-505.
Kearney, M. and W. P. Porter. 2009. Mechanistic niche modeling: combining
physiological and spatial data to predict species’ ranges. Ecology Letters 12:334-
350.
Kearney, M. R., B. A. Wintle, and W. P. Porter. 2010. Correlative and mechanistic
models of species distribution provide congruent forecasts under climate change.
Conservation Letters 3:203-213.
Keddy, P. A. L. Gough, J. A. Nyman, T. McFalls, J. Carter, and J. Siegrist. 2009.
Alligator hunters, pelt traders, and runaway consumption of gulf coast marshes.
Pages 115-133 in B. R. Silliman, E. D. Grosholz, and M. D. Bertness, eds. Human
impacts on salt marshes, a global perspective. University of California Press,
Berkeley, California, USA.
Krattenmacher, R. and K. Rubsamen. 1987. Thermoregulatory significance of non-
evaporative heat loss from the tail of the coypu (Myocastor coypus) and the
tammar-wallaby (Macropus eugenii). Journal of Thermal Biology 12:15-18.
Kuhn, L. W. and E. P. Peloquin. 1974. Oregon’s nutria problem. Proceedings of the
Vertebrate Pest Conference 6:101-105.

- 121 -
Lacki, M. J., P. N. Smith, W. T. Peneston, and F. D. Vogt. 1989. Use of methoxyflurane
to surgically implant transmitters in muskrats. Journal of Wildlife Management
53:331-333.
Larrison, E. J. 1943. Feral coypus in the Pacific Northwest. The Murrelet 24:3-9.
Laver, P. N. and M. J. Kelly. 2008. A critical review of home range studies. Journal of
Wildlife Management 72:290-298.
LeBlanc, D. J. 1994. Nutria. Pages B71-80 in S. E. Hygnstrom, R. M. Timm, and G. E.
Larson, editors. Prevention and control of wildlife damage. University of
Nebraska Cooperative Extension, Lincoln, Nebraska, USA.
Leggieri, L. R., M. L. Guichón, and M. H. Cassini. 2011. Landscape correlates of the
distribution of coypu Myocastor coypus (Rodentia, Mammalia) in Argentinean
Pampas. Italian Journal of Zoology 78:124-129.
Leuven, R. S., G. van der Velde, I. Baijens, J. Snijders, C. van der Zwart, H. J. Lenders,
and A. bij de Vaate. 2009. The river Rhine: a global highway for dispersal of
aquatic invasive species. Biological Invasions 11:1989-2008.
Lewis, C. E., T. W. Clark, and T. L. Derting. 2001. Food selection by the white-footed
mouse (Peromyscus leucopus) on the basis of energy and protein contents.
Canadian Journal of Zoology 79:562-568.
Lindgren, E., L. Tälleklint, and T. Polfeldt. 2000. Impact of climatic change on the
northern latitude limit and population density of the disease-transmitting
European tick Ixodes ricinus. Environmental Health Perspectives 108:119-123.
- 122 -
Littin, K. E., D. J. Mellor, B. Warburton, and C. T. Eason. 2004. Animal welfare and
ethical issues relevant to the humane control of vertebrate pests. New Zealand
Veterinary Journal 52:1-10.
Lockwood, J. L., M. F. Hoopes, and M. P. Marchetti. 2007. Invasion Ecology. Blackwell
Publishing, Oxford, UK.
Luniak, M. 2004. Synurbization – adaptation of animal wildlife to urban development.
Proceedings of the 4th
International Urban Wildlife Symposium 1:50-55.
MacArthur, R. H. and E. R. Pianka. 1966. On optimal use of a patchy environment. The
American Naturalist 100:603-609.
Mace, R. U. 1970. Oregon’s furbearing animals. Wildlife Bulletin #6. Oregon State
Game Commission, Portland, Oregon, USA.
Mach, J. J. and R. M. Poché. 2007. Research and development of a new rodenticide for
nutria. Pages 312-317 in Managing Vertebrate Invasive Species: Proceedings of
an International Symposium. USDA/APHIS/WS, National Wildlife Research
Center, 7-9 August, 1997, Fort Collins, Colorado, USA.
Mack, M. C. and C. M. D’Antonio. 1998. Impacts of biological invasions on disturbance
regimes. Trends in Ecology and Evolution 13:195-198.
Manel, S., H. C. Williams, and S. J. Ormerod. 2001. Evaluating presence-absence models
in ecology: the need to account for prevalence. Journal of Ecology 38:921-931.
Martino, P., J. C. Sassaroli, J. Calvo, J. Zapata, and E. Gimeno. 2008. A mortality survey
of free range nutria (Myocastor coypus). European Journal of Wildlife Research
54:293-297.
- 123 -
McFalls, T. B., P. A. Keddy, D. Campbell, and G. Shaffer. 2010. Hurricanes, floods,
levees, and nutria: vegetation responses to interacting disturbance and fertility
regimes with implications for coastal wetland restoration. Journal of Coastal
Research 26:901-911.
McNab, B. K. 1963. Bioenergetics and the determination of home range size. American
Naturalist 97:133-140.
McNeely, J. A. 2001. The great reshuffling: human dimensions of invasive alien species.
International Union for Conservation of Nature and Natural Resources, Gland,
Switzerland and Cambridge, United Kingdom.
Mehta, S. V., R. G. Haight, F. R. Homans, S. Polasky, and R. C. Venette. 2007. Optimal
detection and control strategies for invasive species management. Ecological
Economics 61:237-245.
Meier, K. E. 1983. Habitat use by opossums in an urban environment. Thesis, Oregon
State University, Corvallis, USA.
Merino, S., J. Carter, and G. Thibodeaux. 2007. Testing tail-mounted transmitters with
Myocastor coypus (nutria). Southeastern Naturalist 6:159-164.
Mertin, D., . Hanusov , and P. Fľak. 2003. Assessment of meat efficiency in nutria
(Myocastor coypus). Czech Journal of Animal Science 48:35-45.
Messmer, T. A. 2000. The emergence of human-wildlife conflict management: turning
challenges into opportunities. International Biodeterioration and Biodegradation
45:97-102.

- 124 -
Meyer, A. 2006. The impacts of nutria on vegetation and erosion in Oregon. Thesis,
University of Colorado, Boulder, USA.
Meyer, J. 2005. Diurnal activity patterns of coypu in an urban habitat. Acta Theriologica
50:207-211.
Meyer, J. 2006. Field methods for studying nutria. Wildlife Society Bulletin 34:850-852.
Meyers, R. S., G. P. Shaffer, and D. W. Llewellyn. 1995. Baldcypress (Taxodium
distichum (L.) Rich.) restoration in southeast Louisiana: the relative effect of
herbivory, flooding, competition, and macronutrients. Wetlands 15:141-148.
Milholland, M. T., J. P. Shumate, T. R. Simpson, and R. W. Manning. 2010. Nutria
(Myocastor coypus) in Big Bend National Park; a non-native species in desert
wetlands. Texas Journal of Science 62:205-222.
Millspaugh, J. J. and J. M. Marzluff, editors. 2001. Radio tracking and animal
populations. Academic Press, San Diego, California, USA.
Minor, E. S., S. M. Tessel, K. A. Engelhardt, and T. R. Lookingbill. 2009. The role of
landscape connectivity in assembling exotic plant communities: a network
analysis. Ecology 90:1802-1809.
Mohr, C. O. 1947. Table of equivalent populations of North American small mammals.
American Midland Naturalist 37:223-249.
Morriss, G. A., B. Warburton, and W. A. Ruscoe. 2000. Comparison of the capture
efficiency of a kill-trap set for brushtail possums that excludes ground-birds, and
ground set leg-hold traps. New Zealand Journal of Zoology 27:201-206.

- 125 -
Mote, P. W. and E. P. Salathé, Jr. 2010. Future climate in the Pacific Northwest. Climatic
Change 102:29-50.
Murua, R., O. Neumann and I. Dropelmann. 1981. Food habits of Myocastor coypus in
Chile. Proceedings of the Worldwide Furbearer Conference 1:544-558.
National Hydrography Dataset Plus Version 1.0, US Environmental Protection Agency
and US Geological Survey. <http://www.horizon-
systems.com/NHDPlus/NHDPlusV1_home.php>. Created February 2008.
National Oceanic and Atmospheric Administration – National Weather Service. 2012.
The Portland climate summary for the year of 2011. <http://www.wrh.noaa.gov/
pqr/climate/annual/2011_clapdx.txt>. Accessed 11 January 2013.
Naylor, L. M., M. J. Wisdom, and R. G. Anthony. Behavioral responses of North
American elk to recreational activity. Journal of Wildlife Management 73:328-
338.
Newson, R. M. 1966. Reproduction in the feral coypu (Myocastor coypus). Symposia of
the Zoological Society of London 15:323-334.
Newson, R. M. 1969. Population dynamics of the coypu (Myocastor coypus) in eastern
England. Pages 203-204 in K. Petrsewicz and L. Rykowski, eds. Energy flows
through small mammal populations. Polish Scientific Publishers, Warsaw, Poland.
Newson, R. M. and R. G. Holmes. 1968. Some ectoparasites of the coypu (Myocastor
coypus) in eastern England. Journal of Animal Ecology 37:471-481.
Nolfo-Clements, L. E. 2009. Nutria survivorship, movement patterns, and home ranges.
Southeastern Naturalist 8:399-410.

- 126 -
Nolfo, L. E. and E. E. Hammond. 2006. A novel method for capturing and implanting
radiotransmitters in nutria. Wildlife Society Bulletin 34:104-110.
Nolte, D. L., A. E. Barras, S. E. Adams, G. Linscombe, and D. J. LeBlanc. 2004.
Assessing potential for using zinc phosphide bait to control nutria on Louisiana
coastal marsh. Proceedings of the Vertebrate Pest Conference 21:150-157.
Norris, J. D. 1967a. A campaign against feral coypus (Myocastor coypus Molina) in
Great Britain. Journal of Applied Ecology 4:191-199.
Norris, J. D. 1967b. The control of coypus (Myocastor coypus Molina) by cage trapping.
Journal of Applied Ecology 4:167-189.
Norris, R. F., E. P. Caswell-Chen, and M. Kogan. 2003. Concepts in Integrated Pest
Management. Prentice Hall, Upper Saddle River, New Jersey, USA.
Nutria Management Team. 2012. Chesapeake Bay nutria eradication project: strategic
plan. <http://www.fws.gov/chesapeakenutriaproject/PDFs/CNEP_
strategic%20plan_3_2012.pdf>. Accessed 8 June 2012.
Olff, H. and M. E. Ritchie. 1998. Effects of herbivores on grassland plant diversity.
Trends in Ecology and Evolution 13:261-265.
Olofsson, J., P. E. Hulme, L. Oksanen, and O. Suominen. 2004. Importance of large and
small mammalian herbivores for the plant community structure in the forest
tundra ecotone. Oikos 106:324-334.
Opperman, J. J. and A. M. Merenlender. 2000. Deer herbivory as an ecological constraint
to restoration of degraded riparian corridors. Restoration Ecology 8:41-47.

- 127 -
Oregon Climate Service. 2012. Oregon Climate. <http://www.ocs.orst.edu>. Accessed 28
June 2012.
Osborne, L. L. and D. A. Kovacic. 1993. Riparian vegetated buffer strips in water-quality
restoration and stream management. Freshwater Biology 29:243-258.
Owen-Smith, N., J. M. Fryxell, and E. H. Merrill. 2010. Foraging theory upscaled: the
behavioural ecology of herbivore movement. Philosophical Transactions of the
Royal Society B 365:2267-2278.
Palomares, F., R. B , . F. Beltr n, . illafa a, and S. Moreno. 1994. Winter circadian
activity pattern of free-ranging coypus in the Paraná River Delta, eastern
Argentina. Acta Theriologica 39:83-88.
Panzacchi, M., S. Bertolino, R. Cocchi, and P. Genovesi. 2007. Population control of
coypu Myocastor coypus in Italy compared to eradication in UK: a cost-benefit
analysis. Wildlife Biology 13:159-171.
Pauls, R. W. 1986. Protection with Vexar cylinders from damage by meadow voles of
tree and shrub seedlings in northeastern Alberta. Proceedings of the Vertebrate
Pest Conference 12:199-204.
Peloquin, E. P. 1969. Growth and reproduction of the feral nutria Myocastor coypus
(Molina) near Corvallis, Oregon. Thesis, Oregon State University, Corvallis,
USA.
Phillips, S. J., R. P. Anderson, and R. E. Schapire. 2006. Maximum entropy modeling of
species geographic distributions. Ecological Modelling 190:231-259.

- 128 -
Pimentel, D., R. Zuniga, and D. Morrison. 2005. Update on the environmental and
economic costs associated with alien-invasive species in the United States.
Ecological Economics 52:273-288.
Poff, B., K. A. Koestner, D. G. Neary, and V. Henderson. 2011. Threats to riparian
ecosystems in western North America: an analysis of existing literature. Journal
of the American Water Resources Association 47:1241-1254.
Prange, S., S. D. Gehrt, and E. P. Wiggers. 2004. Influences of anthropogenic resources
on raccoon (Procyon lotor) movements and spatial distribution. Journal of
Mammalogy 85:483-490.
Prigioni, C., A. Balestrieri, and L. Remonti. 2005a. Food habits of the coypu, Myocastor
coypus, and its impact on aquatic vegetation in a freshwater habitat of NW Italy.
Folia Zoologica 54:269-277.
Prigioni, C., L. Remonti, and A. Balestrieri. 2005b. Control of the coypu (Myocastor
coypus) by cage-trapping in the cultivated plain of northern Italy. Hystrix-Italian
Journal of Mammalogy 16:159-167.
PRISM Climate Group, Oregon State University. <http://prism.oregonstate.edu>. Created
February 2008.
Quinn, J. H., P. M. Gaffney, K. Gilardi, M. Murray, D. A. Jessup, and C. K. Johnson.
2010. Complication associated with abdominal surgical implantation of a radio
transmitter in an American badger (Taxidea taxus). Journal of Zoo and Wildlife
Medicine 41:174-177.

- 129 -
Rahel, F. J. and J. D. Olden. 2008. Assessing the effects of climate change on aquatic
invasive species. Conservation Biology 22:521-533.
Ranheim, B., F. Rosell, H. A. Haga, and J. M. Arnemo. 2004. Field anaesthetic and
surgical techniques for implantation of intraperitoneal radio transmitters in
Eurasian beavers Castor fiber. Wildlife Biology 10:11-15.
Ras, L. B. 1999. Population estimates and movements of nutria (Myocastor coypus) at
Tudor Farms, Dorchester County, Maryland. Thesis. University of Maryland
Eastern Shore, Princess Anne, USA.
Reeves, S. A. and M. B. Usher. 1989. Application of a diffusion model to the spread of
an invasive species: the coypu in Great Britain. Ecological Modelling 47:217-232.
Rensch, B. 1938. Some problems of geographical variation and species-formation.
Proceedings of the Linnean Society of London 150:275-285.
Roni, P., T.J. Beechie, R.E. Bilby, F.E. Leonetti, M.M. Pollock and G.R. Pess. 2002. A
review of stream restoration techniques and a hierarchical strategy for prioritizing
restoration in Pacific Northwest watersheds. North American Journal of Fisheries
and Management 22:1-20.
Rotella, J. J., D. W. Howerter, T. P. Sankowski, and J. H. Devries. 1993. Nesting effort
by wild mallards with 3 types of radio transmitters. Journal of Wildlife
Management 57:690-695.
Rumps, J. M., S. L. Katz, K. Barnas, M. D. Morehead, R. Jenkinson, S. R. Clayton, and
P. Goodwin. 2007. Stream restoration in the Pacific Northwest: analysis of
interviews with project managers. Restoration Ecology 15:506-515.

- 130 -
Ruys, T., O. Lorvelec, A. Marre, and I. Bernez. 2011. River management and habitat
characteristics of three sympatric aquatic rodents: common muskrat, coypu and
European beaver. European Journal of Wildlife Research 57:851-864.
Ryszkowski, L. 1966. The space organization of nutria (Myocastor coypus) populations.
Symposia of the Zoological Society of London 18:259-265.
Salsamendi, E., L. Latierro and . O’Brien. 2009. Current distribution of the coypu
(Myocastor coypus) in the Basque Autonomous Community, Northern Iberian
Peninsula. Hystrix – Italian Journal of Mammalogy 20:155-160.
Seaman, D. E. and R. A. Powell. 1996. An evaluation of the accuracy of kernel density
estimators for home range analysis. Ecology 77:2075-2085.
Sheffels, T. R. and M. D. Sytsma. 2007. Report on nutria management and research in
the Pacific Northwest. Unpublished report. Portland, Oregon: Portland State
University.
Shirley, M. G., R. H. Chabreck, and G. Linscombe. 1981. Foods of nutria in fresh
marshes of southeastern Louisiana. Proceedings of the Worldwide Furbearer
Conference 1:517-530.
Sikes, R. S., W. L. Gannon, and the Animal Care and Use Committee of the American
Society of Mammalogists. 2011. Guidelines of the American Society of
Mammalogists for the use of wild mammals in research. Journal of Mammalogy
92:235-253.
Silverman, B. W. 1986. Density Estimation for Statistics and Data Analysis. Chapman
and Hall, London, United Kingdom.

- 131 -
Simpson, T. R. 1980. The influence of nutria on aquatic vegetation and waterfowl in east
Texas. Dissertation, Texas A&M University, College Station, USA.
Simpson, A., C. Jarnevich, J. Madsen, R. Westbrooks, C. Fournier, L. Mehrhoff, M.
Browne, J. Graham, and E. Sellers. 2009. Invasive species information networks:
collaboration at multiple scales for prevention, early detection, and rapid response
to invasive alien species. Biodiversity 10:5-13.
Skyrienė, G. and A. Paulauskas. 2012. Distribution of invasive muskrats (Ondatra
zibethicus) and impact on ecosystem. Ekologija 58:357-367.
Smith, K. and J. Ory. 2005. Healthy Streams Plan. Clean Water Services, Hillsboro,
Oregon, USA.
Southwick Associates. 2004. Potential economic losses associated with uncontrolled
nutria populations in Maryland’s portion of the Chesapeake Bay. Prepared for the
Maryland Department of Natural Resources.
Stohlgren, T.J. and J.L. Schnase. 2006. Risk analysis for biological hazards: what we
need to know about invasive species. Risk Analysis 26:163-173.
Sullivan, T. P., D. S. Sullivan, P. M. Lindgren, and D. B. Ransome. 2007. Long-term
responses of ecosystem components to stand thinning in young lodgepole pine
forest – IV. Relative habitat use by mammalian herbivores. Forest Ecology and
Management 240:32-41.
Sutherland, W. J. 1996. From Individual Behaviour to Population Ecology. Oxford
University Press, Oxford, United Kingdom.

- 132 -
Sutherst, R. W. 2000. Climate change and invasive species: a conceptual framework.
Pages 211-240 in H. A. Mooney and R. J. Hobbs, eds. Invasive Species in a
Changing World. Island Press, Washington, DC, USA.
Taylor, K. L., J. B. Grace, and B. D. Marx. 1997. The effects of herbivory on neighbor
interactions along a coastal marsh gradient. American Journal of Botany 84:709-
715.
Towns, K., T. R. Simpson, R. W. Manning, and F. L. Rose. 2003. Food habits and
selective foraging of the nutria (Myocastor coypus) in Spring Lake, Hays County,
Texas. Museum of Texas Tech University, Occasional Paper #227.
Treves, A., R. B. Wallace, L. Naughton-Treves, and A. Morales. 2006. Co-managing
human-wildlife conflicts: a review. Human Dimensions of Wildlife 11:383-396.
Tualatin River Watershed Council. 2001. Summary of Lower Tualatin Watershed
analysis. <http://www.trwc.org/tualatin-info/lower/Lower_summary.pdf>.
Accessed 2 December 2012.
Túnez, J. I., M. L. Guichón, D. Centrón, A. P. Henderson, C. Callahan, and M. H.
Cassini. 2009. Relatedness and social organization of coypus in the Argentinean
pampas. Molecular Ecology 18:147-155.
United States Department of Agriculture. 2009. Census of Agriculture 2007: United
States summary and state data. Washington, DC, USA.
United Nations Department of Economic and Social Affairs. 2012. World urbanization
prospects: the 2011 revision. United Nations, New York, New York, USA.

- 133 -
United States Census Bureau. 2004. Census of Population and Housing – Population and
Housing Unit Counts: United States Summary 2000. Washington, DC, USA.
United States Geological Survey. 2004. Nonindigenous Aquatic Species Database.
Gainsville, Florida, USA. <http://nas.er.usgs.gov>. Accessed 23 January 2013.
Verts, B. J. and L. Carraway. 1998. Land mammals of Oregon. University of California
Press, Berkeley, California, USA.
Walker, K. A., A. W. Trites, M. Haulena, and D. M. Weary. 2012. A review of the effects
of different marking and tagging techniques on marine mammals. Wildlife
Research 39:15-30.
Wanless, S., M. P. Harris, and J. A. Morris. 1988. The effect of radio transmitters on the
behavior of common murres and razorbills during chick rearing. The Condor
90:816-823.
Warkentin, M. J. 1968. Observations on the behavior and ecology of the nutria in
Louisiana. Tulane Studies in Zoology and Botany 15:10-17.
Waterkeyn, A., O. Pineau, P. Grillas, and L. Brendonck. 2010. Invertebrate dispersal by
aquatic mammals: a case study with nutria Myocastor coypus (Rodentia,
Mammalia) in southern France. Hydrobiologia 654:267-271.
Wentz, W. A. 1971. The impact of nutria (Myocastor coypus) on marsh vegetation in the
Willamette Valley, Oregon. Thesis, Oregon State University, Corvallis. USA.
Wheatley, M. 1997. A new surgical technique for implanting radio transmitters in
beavers, Castor Canadensis. Canadian Field-Naturalist 111:601-606.

- 134 -
Whittaker, D. and R. L. Knight. 1998. Understanding wildlife responses to humans.
Wildlife Society Bulletin 26:312-317.
Willner, G. R. 1982. Nutria. Pages 1059-1076 in J. A. Chapman and G. A. Feldhamer,
eds. Wild mammals of North America. Johns Hopkins University Press,
Baltimore, Maryland, USA.
Willner, G. R., J. A. Chapman, and D. Pursley. 1979. Reproduction, physiological
responses, food habits and abundance of nutria on Maryland marshes. Wildlife
Monographs 65:1-43.
Wilsey, B. J., R. H. Chabreck, and R. G. Linscombe. 1991. Variation in nutria diets in
selected fresh water forested wetlands of Louisiana. Wetlands 11:263-278.
With, K. A. 2002. The landscape ecology of invasive spread. Conservation Biology
16:1192-1203.
Witmer, . W., . D. Eisemann, T. M. Primus, . R. O’Hare, K. R. Perry, R. M. Elsey,
and P. L. Trosclair III. 2010. Assessing potential risk to alligators, Alligator
mississippiensis, from nutria control with zinc phosphide rodenticide baits.
Bulletin of Environmental Contamination and Toxicology 84:698-702.
Witmer, G. W., P. W. Burke, S. Jojola, and D. L. Nolte. 2008. A live trap model and field
trial of a nutria (Rodentia) multiple-capture trap. Mammalia 72:352-354.
Witmer, G., T. R. Sheffels, and S. R. Kendrot. 2012. The introduction, impacts, and
management of a large, invasive, aquatic rodent in the United States. Pages 49-89
in D. C. Abreu and S. L. De Borbon, eds. Marshes: Ecology, Management and
Conservation. Nova Science Publishers Inc., Hauppauge, New York, USA.

- 135 -
Woods, C. A., L. Contreras, G. Willner-Chapman, and H. P. Whidden. 1992. Myocastor
coypus. Mammalian Species 398:1-8.
Worton, B. J. 1989. Kernel methods for estimating the utilization distribution in home-
range studies. Ecology 70:164-168.

- 136 -
APPENDIX A. SUPPLEMENTAL MATERIAL FOR CHAPTER 2
Figure A.A.1. Pacific Northwest nutria distribution and relative density map based on survey of fish and
wildlife biologists in 2007

- 137 -
APPENDIX B. SUPPLEMENTAL MATERIAL FOR CHAPTER 3
Table A.B.1. Basic study animal and radio-transmitter information for each nutria trapped and fitted with a
transmitter in the Lower Tualatin Watershed, Oregon, in August 2011
Study Animal Information Radio-transmitter Information
Capture
date
Capture
site
Sex Body Mass
(kg)
Type Frequency Mortality
date*
Recovery
date
Status
01 Aug 2011 Nyberg M 7.9 T 165.368 28 Sep 2011 18 Oct 2011 detached
01 Aug 2011 Summer M 5.9 N 166.193 01 Jan 2012 27 Jan 2012 detached
02 Aug 2011 Hedges F 2.0 N 166.332 19 Feb 2012 24 Feb 2012 attached^
02 Aug 2011 Nyberg F 5.9 N 165.793 24 Sep 2011 29 Sep 2011 attached
03 Aug 2011 Hedges F 2.3 N 165.894 unknown not recovered n/a
03 Aug 2011 Nyberg F 3.4 N 165.956 27 Nov 2011 14 Dec 2011 detached
03 Aug 2011 Nyberg F 3.9 T 165.181 27 Sep 2011 18 Oct 2011 detached
03 Aug 2011 Summer M 8.2 T 164.118 05 Dec 2011 12 Dec 2011 attached
04 Aug 2011 Nyberg F 4.5 T 165.443 13 Dec 2011 14 Dec 2011 detached
04 Aug 2011 Summer M 6.6 N 165.869 12 Dec 2011 03 Jan 2012 detached
05 Aug 2011 Hedges ? 2.0 T 165.295 05 Oct 2011 10 Nov 2011 detached
05 Aug 2011 Summer M 7.9 T 164.944 05 Dec 2011 12 Dec 2011 detached
09 Aug 2011 Nyberg M 5.4 N 166.257 unknown not recovered n/a
10 Aug 2011 Hedges M 4.3 N 165.744 25 Nov 2011 29 Nov 2011 detached
10 Aug 2011 Hedges M 2.5 T 164.682 22 Oct 2011 03 Nov 2011 detached
10 Aug 2011 Nyberg F 5.2 T 165.281 31 Aug 2011 09 Sep 2011 detached
10 Aug 2011 Summer ? 1.4 T 165.642 24 Sep 2011 31 Oct 2011 detached
11 Aug 2011 Summer M 7.0 T 165.531 23 Sep 2011 25 Oct 2011 detached
12 Aug 2011 Hedges M 6.8 T 164.831 09 Oct 2011 10 Nov 2011 detached
16 Aug 2011 Hedges F 9.5 T 164.968 24 Sep 2011 05 Oct 2011 detached
16 Aug 2011 Hedges M 3.6 T 165.630 28 Sep 2011 05 Oct 2011 detached
19 Aug 2011 Red Rock F 6.4 N 165.918 26 Dec 2011 03 Jan 2012 attached
19 Aug 2011 Red Rock F 2.0 N 165.981 10 Dec 2011 03 Jan 2012 attached
19 Aug 2011 Red Rock M 2.0 T 165.518 10 Oct 2011 10 Nov 2011 attached
19 Aug 2011 Red Rock M 2.0 N 165.856 unknown not recovered n/a
22 Aug 2011 Red Rock F 2.0 N 166.318 26 Dec 2011 03 Jan 2012 attached
22 Aug 2011 Red Rock M 2.0 T 164.431 13 Oct 2011 12 Jan 2012 detached
23 Aug 2011 Red Rock M 6.1 T 164.918 11 Mar 2012 23 Mar 2012 detached
23 Aug 2011 Summer F 5.7 N 165.781 02 Dec 2011 02 Dec 2011 detached
23 Aug 2011 Summer M 5.7 N 166.206 26 Dec 2011 03 Jan 2012 attached
T = tail attachment
N = neck attachment
*initial date on which transmitter did not move within previous 8.0 hours or subsequently until recovery
^animal mortality with transmitter still attached

- 138 -
APPENDIX C. SUPPLEMENTAL MATERIAL FOR CHAPTER 4
Table A.C.1. Basic study animal and trap information for each nutria trapped and euthanized on Sauvie
Island, Oregon, from March-April 2011
Study Animal Information Trap Information
Capture date Capture site Sex Body mass (kg) Type Same trap pair
08 Mar 2011 Baileys Nursery I M 7.9 MCT
09 Mar 2011 Baileys Nursery I M 6.1 MCT
09 Mar 2011 Baileys Nursery I F 3.9 SCT
09 Mar 2011 Charlton Ditch M 1.8 SCT
10 Mar 2011 Baileys Nursery I F 3.9 SCT
19 Mar 2011 Baileys Nursery I F 8.6 MCT x
19 Mar 2011 Baileys Nursery I M 8.4 SCT x
19 Mar 2011 Deadwillow Unit F 6.2 SCT
22 Mar 2011 Charlton Ditch M 2.0 SCT
22 Mar 2011 Deadwillow Unit M 1.3 SCT
23 Mar 2011 Baileys Nursery I M 5.4 MCT
23 Mar 2011 Charlton Ditch M 9.5 SCT
24 Mar 2011 Charlton Ditch F 7.5 MCT x
24 Mar 2011 Charlton Ditch M 2.0 SCT x
25 Mar 2011 Charlton Ditch F 6.7 SCT
26 Mar 2011 Charlton Ditch F 4.1 SCT
26 Mar 2011 Deadwillow Unit F 1.4 SCT
14 Apr 2011 Baileys Nursery I M 3.7 MCT x
14 Apr 2011 Baileys Nursery I F 5.0 SCT x
15 Apr 2011 Charlton Ditch F 4.1 SCT
16 Apr 2011 Baileys Nursery I M 6.4 MCT
21 Apr 2011 Baileys Nursery I M 5.6 SCT
21 Apr 2011 Farm Canal M 3.9 MCT
22 Apr 2011 Farm Canal F 5.7 MCT
23 Apr 2011 Farm Canal M 8.6 MCT x
23 Apr 2011 Farm Canal F 1.4 SCT x
MCT = multiple-capture trap
SCT = single capture trap