status of e/p in crack and plug - the cdf group at...
TRANSCRIPT

Status of E/p in Crack and Plug
Simulation Group Meeting Apr 6th, 2006
Pedro A. Movilla Fernández (LBNL)

Pedro Movilla Fernández (LBNL) Simulation Group Meeting Apr 6th, 2006 2
IntroductionWhere we are:
� We tuned the Gflash hadronic lateral profile to agree with the measured profiles in the Central. Tuned parameter values are currently used for all detector parts.
� Various iterations to tune FEDP and relative sampling fractions were done in the Central using the new lateral profile (see previous Shawn's talks).
� What is the impact for the E/p measurement in Crack and Plug?
This talk:
� Establish “reasonable” measurement of E/p versus p in Crack and Plug based on all available isolated single track data.
� Comparison with MC (FakeEv + MB) based on cdfSim/ProductionExe 6.1.4int1 (MCv6 B).
� E/p dependence on lateral profile and background.
� Appendix: E/p distributions.

Pedro Movilla Fernández (LBNL) Simulation Group Meeting Apr 6th, 2006 3
Di-Jet Balance
� Ken showed in the last Simulation Group meeting that the MC based on the new tuning significantly underestimates the measured di-jet balance in the Crack region.
� Agreement in Plug region not bad but still improvable.
� Simulated JES in Crack/Plug is lower w.r.t. old tuning. More leackage of energy at the jet cone boundaries due to wider profiles at high p?

Pedro Movilla Fernández (LBNL) Simulation Group Meeting Apr 6th, 2006 4
Data Sets
Single Track Trigger Data: statistics production
� 3, 4, 7 GeV/c thres.: gjtc0d ~16M events 5.3.3_nt
� 10 GeV/c thres.: gjtc0h_stt10 ~4M events 6.1.2
� 15 GeV thres: gjtc0h_stt15 ~6M events 6.1.2
Minimum Bias Data:
� gmbs0d ~21M events 5.3.3_nt
Remarks:
� STT data contain single tracks in crack/plug region as byproduct
� STT data has no visible threshold effects in crack/plug:Have verified that there are no charge asymmetries (as e.g. observed in the gjtc0h_stt15 sample in the central)

Pedro Movilla Fernández (LBNL) Simulation Group Meeting Apr 6th, 2006 5
Track Selection
Track quality: COT hits Silicon hits
axial stereo axial stereo zCrack: ≥20 ≥20 ≥4 - -Plug: ≥7 ≥7 ≥4 ≥2 ≥2
Event quality:
� Number of vertices: 1
� |Z(vertex)| < 60cm
Signal region:
� 7x7 isolation
� Track extrapolates to PES of signal regions:”Crack” = Tower 10 and 11“Plug” = Tower 13, 14, 15
� Partial CES isolation for crack towers
Using IO tracks is crucial for reasonable E/p measurement in the plug!(see e.g. my SGM talk of July 20, 2005)
gmbs0d

Pedro Movilla Fernández (LBNL) Simulation Group Meeting Apr 6th, 2006 6
Isolated Track StatisticsCrack Plug

Pedro Movilla Fernández (LBNL) Simulation Group Meeting Apr 6th, 2006 7
Signal Definition
Contour cut: |ηrel| <0.6, |φrel|<0.9
η
φ
far strip
EM HAD
XX
η
φ
far strip
near strip EM HAD
XX
EM HADSignal: 2x2 blocks 3x3 blocksBackg: 2x far strip (1x2) 3xfar strip (1x3)
Plug
EM HADSignal: 3x1 strip 3x1 stripBackg: 1.5 x (near + far block)
Crack
Contour cut: |ηrel| <0.9, |φrel|<0.9
signal contribution
background estimate
X extrapolated track impact point
� Tracks are extrapolated to PES for both EM and HAD compartment
� Plug: adjacent towers in φ are paired
Plots shown in the following:EM, HAD, TOT=EM+HAD, MIP=HAD (EM<670MeV)

Pedro Movilla Fernández (LBNL) Simulation Group Meeting Apr 6th, 2006 8
Signal and Background (Data Only, Simple Means)
tower 10
tower 11
plug
EM HAD TOT MIP
signal
bck
gjtc0dgjtc0h_stt10gjtc0h_stt15gmbs0d

Pedro Movilla Fernández (LBNL) Simulation Group Meeting Apr 6th, 2006 9
Corrected Signal (Data Only, Simple Means)
tower 10
tower 11
plug
EM HAD TOT MIP

Pedro Movilla Fernández (LBNL) Simulation Group Meeting Apr 6th, 2006 10
Using Gaussian Means in the Plug
� Different data sets generally provide a consistent measurement of the single particle response.
� Exception: EM response in the plug at p>5GeV/c. gjtc0h_stt15 > gjtc0h_stt10 > gjtc0d > gmbs0dDifferent contributions due to correlated backgounds?
� For TOT, uncertainties due to background problems can be absorbed using Gaussian means instead of simple means.
� Apply “converging Gaussian fits” to TOT and MIP distributions in the plug for p>4GeV/c to extract mean and sigma.
� For tower 10, Gaussian fits are not feasible. To be consistent, employ simple means for both crack towers

Pedro Movilla Fernández (LBNL) Simulation Group Meeting Apr 6th, 2006 11
Gaussian Fit Example (gmbs0d, Plug)

Pedro Movilla Fernández (LBNL) Simulation Group Meeting Apr 6th, 2006 12
Using Gaussian Means for the Plug
TOT TOT MIP
uncorrected
corrected
Gaussian means Simple means

Pedro Movilla Fernández (LBNL) Simulation Group Meeting Apr 6th, 2006 13
MC Samples
MC samples were generated isolated tracks using FAKE_EV:
� 3 tracks per event
� flat spectrum, |η| = 0.72 - 2.1 (covering towers 6 to 17)
� pions/kaons/protons ~ 6/3/1
� processed with cdfSim / ProductionExe 6.1.4int1 (MCv6 B)Pythia Minimum Bias Tune A superimposed on top of each event
For the comparison data/MC, the data points from the four individual datasamples gjtc0d, gjtc0h_stt15, gjtc0h_stt10 and gmbs0d, were first corrected forbackground and then combined using the weighted average.

Pedro Movilla Fernández (LBNL) Simulation Group Meeting Apr 6th, 2006 14
Fakeev Minbias vs Data Average
tower 10
tower 11
plug
EM HAD TOT MIP
Gaussian means

Pedro Movilla Fernández (LBNL) Simulation Group Meeting Apr 6th, 2006 15
Fakeev Minbias vs Data Average (Plug Towers)
tower 13
tower 14
tower 15
EM HAD TOT MIP

Pedro Movilla Fernández (LBNL) Simulation Group Meeting Apr 6th, 2006 16
Findings
� In tower 11 and Plug, the MC significantly exceeds the EM and TOT response for p<6GeV/c and underestimates EM and TOT for p>6GeV/c
� Simulated HAD reponse in fair agreement with data (tower 10+11) at p<4GeV/c but generally systematically lower at higher p
� Simulated MIP response ok in Plug, a little too low in Crack.
Possible explanation: Leackage effects due to limited signal region.(a) Widening the lateral profile at p>5GeV/c increases leackage(b) Narrowing the lateral profile at p<5GeV/c decreases leackage
EM HAD TOT MC/Datacomparison in Gen-5
Effect also present in the central (few %) but is larger in the plug (finer granularity)
(a)
(b)
(a)(a)
(b) (b)

Pedro Movilla Fernández (LBNL) Simulation Group Meeting Apr 6th, 2006 17
Dependence on the Lateral Profile
� So one problem of tuning the simulated absolute single particle response in the Plug is the current signal definition (EM 2x2 blocks, HAD 3x3 blocks)
� The past tune at p<5 GeV (shown in last slide) looks optically nice but relies on the assumption of (probably wrong) lateral profile parameters:
- derived using limited isolated tracks statistics- mainly based on SISA tracks faking too low E/p due to resolution effects
(see my SGM talk July 20th 2005)
� Widening the signal region would probably increase mismeasurements due to background contribution. Furthermore, only 4 towers in Plug can be “hit” by IO tracks.
We need to make the simulated lateral profile in the Plug as perfect as possible before adressing the issue of tuning of the absolute response.Central tuning results are still not optimal for the Plug (too narrowprofiles at low p.)
Pedro Movilla Fernández (LBNL) Simulation Group Meeting Apr 6th, 2006 18
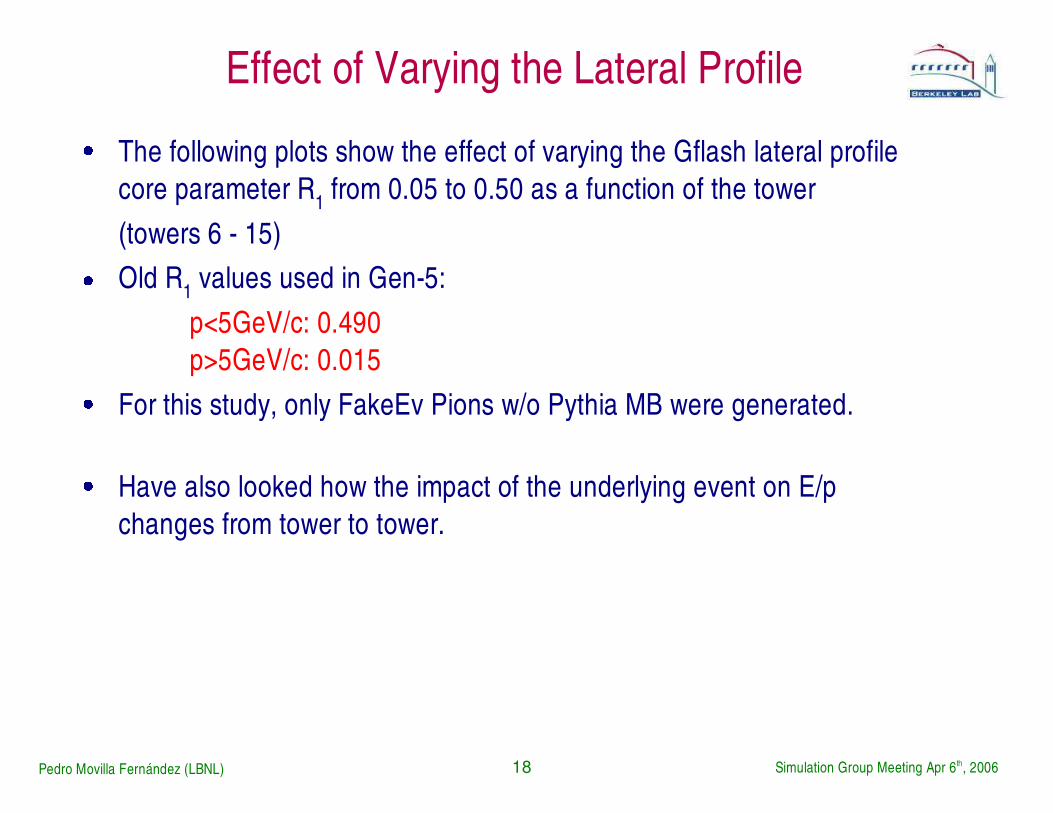
Effect of Varying the Lateral Profile
� The following plots show the effect of varying the Gflash lateral profile core parameter R1 from 0.05 to 0.50 as a function of the tower (towers 6 - 15)
� Old R1 values used in Gen-5:p<5GeV/c: 0.490p>5GeV/c: 0.015
� For this study, only FakeEv Pions w/o Pythia MB were generated.
� Have also looked how the impact of the underlying event on E/p changes from tower to tower.

Pedro Movilla Fernández (LBNL) Simulation Group Meeting Apr 6th, 2006 19
Dependence on Lateral Profile (Wall)
tower 6
tower 7
tower 8
EM HAD TOT MIP

Pedro Movilla Fernández (LBNL) Simulation Group Meeting Apr 6th, 2006 20
Dependence on Lateral Profile (Crack)
tower 9
tower 10
tower 11
EM HAD TOT MIP
!!!Drastically increased effect starting with tower 11. (No effect in EM of tower 10 because of poor instrumentation + more passive material?)

Pedro Movilla Fernández (LBNL) Simulation Group Meeting Apr 6th, 2006 21
Dependence on Lateral Profile (Plug)
tower 12
tower 13
tower 14
tower 15
EM HAD TOT MIP

Pedro Movilla Fernández (LBNL) Simulation Group Meeting Apr 6th, 2006 22
Impact of MinBias (Tower 10)
EM HAD TOT MIP
uncorrected
corrected

Pedro Movilla Fernández (LBNL) Simulation Group Meeting Apr 6th, 2006 23
Impact of MinBias (Tower 11)
EM HAD TOT MIP
uncorrected
corrected

Pedro Movilla Fernández (LBNL) Simulation Group Meeting Apr 6th, 2006 24
Impact of MinBias (Plug)
EM HAD TOT MIP
uncorrected
corrected

Pedro Movilla Fernández (LBNL) Simulation Group Meeting Apr 6th, 2006 25
Conclusions
� Consistent measurement of single particle response in Crack and Plug using different data sets.
� Interdependence of lateral profile and absolute E/p response in the Plug caused by non-negligible shower leackage effects due to limited signal region.
� Careful tuning of the lateral profile before tuning the absolute response necessary.
� Currently used lateral parameters derived from the Central (see previous talk) still not perfect.
� Based on the currently used lateral profiles, the simulated energy scale in Crack and Plug has to be decreased at low p and increased at high p.

Pedro Movilla Fernández (LBNL) Simulation Group Meeting Apr 6th, 2006 26
Appendix: Normalized E/p Distributions

Pedro Movilla Fernández (LBNL) Simulation Group Meeting Apr 6th, 2006 27
Tower 10 (0.5-2 GeV/c)

Pedro Movilla Fernández (LBNL) Simulation Group Meeting Apr 6th, 2006 28
Tower 10 (2-3 GeV/c)

Pedro Movilla Fernández (LBNL) Simulation Group Meeting Apr 6th, 2006 29
Tower 10 (3-5 GeV/c)

Pedro Movilla Fernández (LBNL) Simulation Group Meeting Apr 6th, 2006 30
Tower 10 (5-8 GeV/c)

Pedro Movilla Fernández (LBNL) Simulation Group Meeting Apr 6th, 2006 31
Tower 10 (8-12 GeV/c)

Pedro Movilla Fernández (LBNL) Simulation Group Meeting Apr 6th, 2006 32
Tower 10 (12-16 GeV/c)

Pedro Movilla Fernández (LBNL) Simulation Group Meeting Apr 6th, 2006 33
Tower 11 (0.5-2 GeV/c)
Pedro Movilla Fernández (LBNL) Simulation Group Meeting Apr 6th, 2006 34
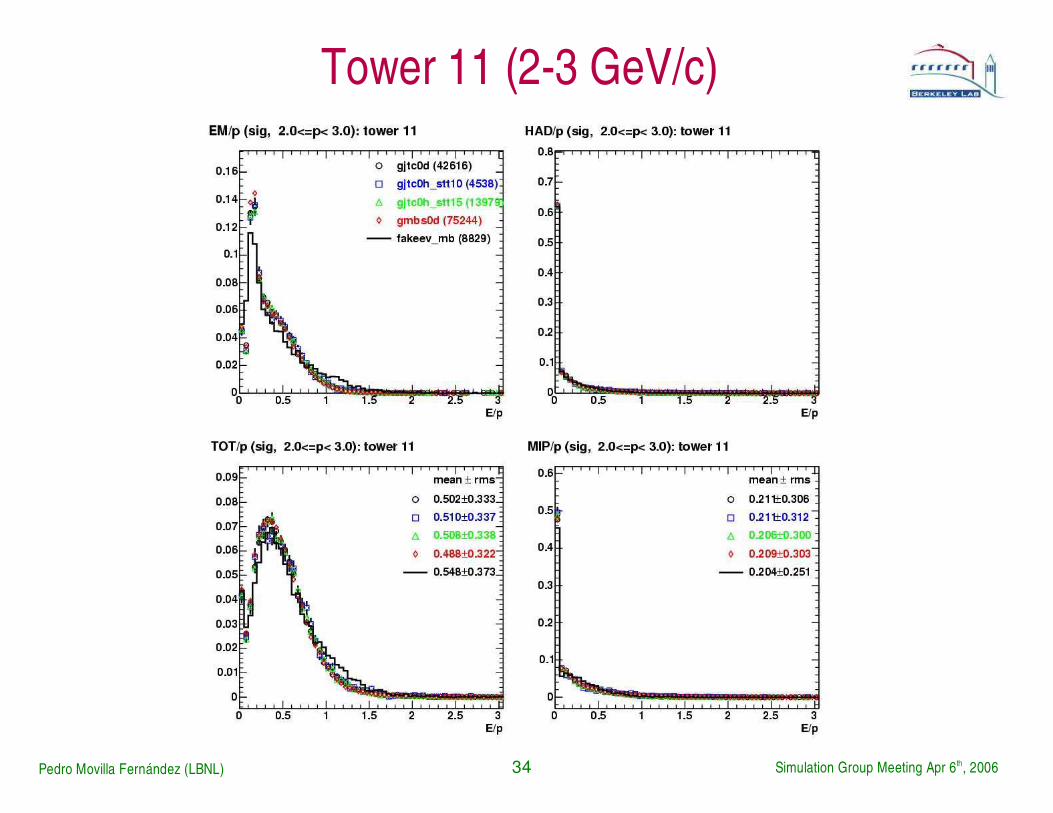
Tower 11 (2-3 GeV/c)

Pedro Movilla Fernández (LBNL) Simulation Group Meeting Apr 6th, 2006 35
Tower 11 (3-5 GeV/c)

Pedro Movilla Fernández (LBNL) Simulation Group Meeting Apr 6th, 2006 36
Tower 11 (5-8 GeV/c)

Pedro Movilla Fernández (LBNL) Simulation Group Meeting Apr 6th, 2006 37
Tower 11 (8-12 GeV/c)

Pedro Movilla Fernández (LBNL) Simulation Group Meeting Apr 6th, 2006 38
Tower 11 (12-16 GeV/c)

Pedro Movilla Fernández (LBNL) Simulation Group Meeting Apr 6th, 2006 39
Plug (0.5-2 GeV/c)

Pedro Movilla Fernández (LBNL) Simulation Group Meeting Apr 6th, 2006 40
Plug (2-3 GeV/c)

Pedro Movilla Fernández (LBNL) Simulation Group Meeting Apr 6th, 2006 41
Plug (3-5 GeV/c)

Pedro Movilla Fernández (LBNL) Simulation Group Meeting Apr 6th, 2006 42
Plug (5-8 GeV/c)

Pedro Movilla Fernández (LBNL) Simulation Group Meeting Apr 6th, 2006 43
Plug (8-12 GeV/c)

Pedro Movilla Fernández (LBNL) Simulation Group Meeting Apr 6th, 2006 44
Plug (12-16 GeV/c)

Pedro Movilla Fernández (LBNL) Simulation Group Meeting Apr 6th, 2006 45
Plug (16-24 GeV/c)