status of drug use in the department of defense...
TRANSCRIPT


Status of Drug Use in the Department of Defense Personnel
Fiscal Year 2010 Drug Testing Statistical Report
Office of the Under Secretary of Defense for Personnel and Readiness
4000 Defense Pentagon, Suite 1E532
Washington, DC 20301-4000

Status of Drug Use in the DoD Personnel Fiscal Year 2010 Drug Testing Statistical Report
i
TABLE OF CONTENTS EXECUTIVE SUMMARY .................................................................................................1
INTRODUCTION ...............................................................................................................3
HISTORICAL PERSPECTIVE ...........................................................................................4
METHODS ..........................................................................................................................5
High Risk Group ........................................................................................................... 5 Defense Manpower Data Center Personnel Databases ................................................. 5 Laboratory Information Management System Database .............................................. 6 Defense Manpower Data Center Compiled Data.......................................................... 7 Drug Testing Metrics .................................................................................................... 7
MILITARY LABORATORY OPERATIONS ....................................................................8
RESULTS AND SALIENT OBSERVATIONS ...............................................................10
Laboratory Performance ............................................................................................. 10 DoD Testing Results ................................................................................................... 10 Active Duty Testing Results ....................................................................................... 10 National Guard and Reserve Testing Results ............................................................. 11 DoD Drug Positive Distribution ................................................................................. 12 Deployment Testing .................................................................................................... 12 Military Entrance Processing Station Testing............................................................. 13 FY 2010 DoD Agency Drug Testing .......................................................................... 13
Discussion and Conclusions ..............................................................................................13
Future Endeavors ........................................................................................................ 15 Early Indicators for Increase in Prescription Drug Abuse .......................................... 16 Early Indicators – Prevalence Testing for Benzodiazepines and Hydrocodone ......... 16 Early Indicators – Media Coverage ............................................................................ 17
FIGURES ..................................................................................................................... 18-29
TABLES ..................................................................................................................... 30-38
APPENDICES ............................................................................................................. 39-41
LIST OF FIGURES
Figure 1: Location of Service Operated Drug Screening Laboratories ............................18
Figure 2: Active Duty Mean Test Ratios ..........................................................................18

Status of Drug Use in the DoD Personnel Fiscal Year 2010 Drug Testing Statistical Report
ii
Figure 3: Active Duty Illicit Drug Positive Rates .............................................................19
Figure 4: Active Duty, ‘High Risk Population’, Mean Test Ratios ..................................19
Figure 5: Active Duty, ‘High Risk Population’, Illicit Drug Positive Rates ....................20
Figure 6: Reserve Component, Active Duty, Mean Test Ratios .......................................20
Figure 7: Reserve Component, Active Duty, Illicit Drug Positive Rates .........................21
Figure 8: Reserve Component, Active Duty, ‘High Risk Population’, Mean Test Ratios .................................................................................................................21
Figure 9: Reserve Component, Active Duty, ‘High Risk Population’, Illicit Drug Positive Rates ..................................................................................................................22
Figure 10: Reserve Component, Not on Active Duty, Mean Test Ratios .........................22
Figure 11: Reserve Component, Not on Active Duty, Illicit Drug Positive Rates ...........23
Figure 12: Reserve Component, Not on Active Duty, ‘High Risk Population’ Mean Test Ratios .................................................................................................................23
Figure 13: Reserve Component, Not on Active Duty, ‘High Risk Population’ Illicit Drug Positive Rates ....................................................................................................24
Figure 14: Service Active Duty Personnel Heroin-Positive Service members Reported by Fiscal Year .........................................................................................................24
Figure 15: National Guard Component, Active Duty, Mean Test Ratios .........................25
Figure 16: National Guard Component, Active Duty, Illicit Drug Positive Rates ...........25
Figure 17: National Guard Component, Active Duty, ‘High Risk Population’ Mean Test Ratios .................................................................................................................26
Figure 18: National Guard Component, Active Duty, ‘High Risk Population’ Illicit Drug Positive Rates ....................................................................................................26
Figure 19: National Guard Component, Not on Active Duty, Mean Test Ratios .............27
Figure 20: National Guard Component, Not on Active Duty, Illicit Drug Positive Rates ..................................................................................................................27
Figure 21: National Guard Component, Not on Active Duty, ‘High Risk Population’ Mean Test Ratios ...............................................................................................28
Figure 22: National Guard Component, Not on Active Duty, ‘High Risk Population’ Illicit Drug Positive Rates .................................................................................28
Figure 23: DoD Military Positive Rates vs. U.S. Workforce Rates .................................29
Status of Drug Use in the DoD Personnel Fiscal Year 2010 Drug Testing Statistical Report
iii
LIST OF TABLES
Table 1: Military Drug Testing Laboratory Performance Measures ................................30
Table 2: Total DoD Illicit Drug Testing Performance Metrics .........................................30
Table 3: Active Duty Illicit Drug Positive and Testing Rates ..........................................31
Table 4: Active Duty, ‘High Risk Population’ Illicit Drug Positive and Testing Rates ...31
Table 5: Reserve Component, Active Duty, Illicit Drug Positive and Testing Rates .......31
Table 6: Reserve Component, Active Duty, ‘High Risk Population’ Illicit Drug Positive and Testing Rates ..............................................................................................32
Table 7: Reserve Component, Not on Active Duty, Illicit Drug Positive and Testing Rates ..................................................................................................................32
Table 8: Reserve Component, Not on Active Duty, ‘High Risk Population’ Illicit Drug Positive and Tesing Rates ..................................................................................32
Table 9: National Guard Component, Active Duty, Illicit Drug Positive and Testing Rates ..................................................................................................................33
Table 10: National Guard Component, Active Duty, ‘High Risk Population’ Illicit Drug Positive and Testing Rates ................................................................................33
Table 11: National Guard Component, Not on Active Duty, Illicit Drug Positive and Testing Rates .....................................................................................................33
Table 12: National Guard Component, Not on Active Duty, ‘High Risk Population’ Illicit Drug Positive and Testing Rates ..............................................................34
Table 13: Total DoD Drug Positive Percent Distribution .................................................34
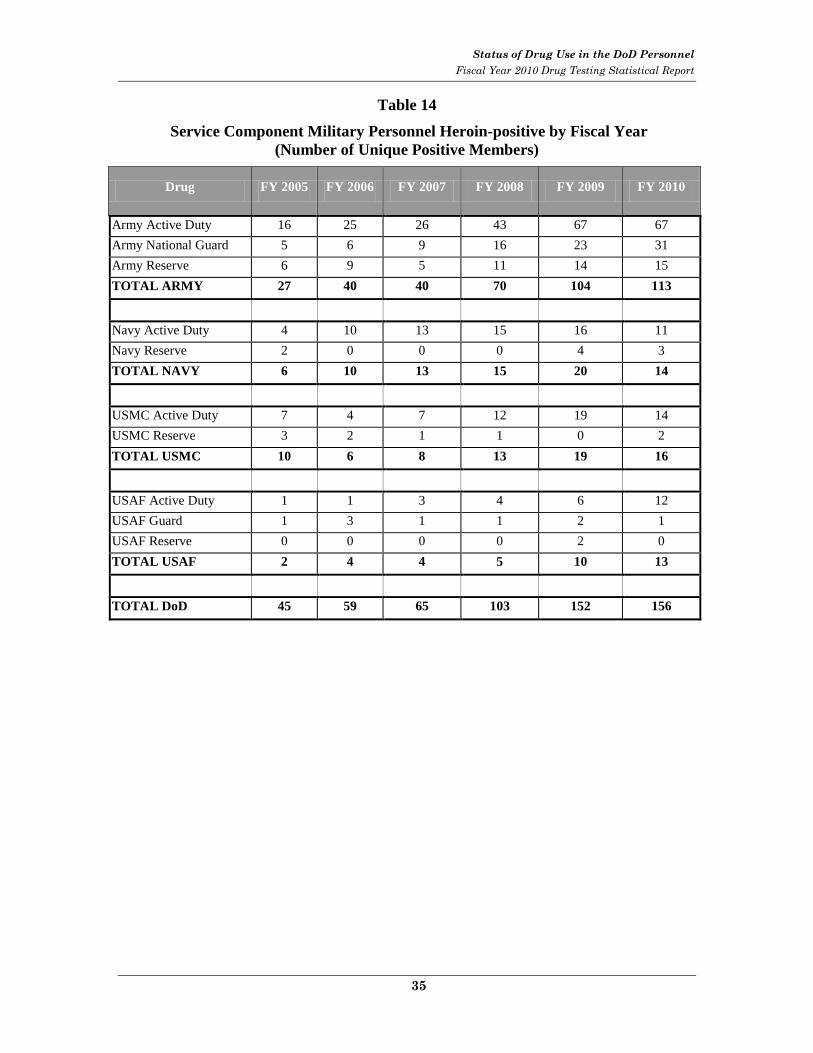
Table 14: Service Component Military Personnel Heroin-positive by Fiscal Year ........35
Table 15: Deployment Drug Testing ................................................................................36
Table 16: Military Accession Illicit Drug Testing Positive Rate ......................................37
Table 17: DoD Agencies Drug Testing Results ................................................................37
Table 18: Percent Probability of Detection Drug Use on Any Given Urinalysis Collection Based Upon Varying Testing Rate and Assuming a Single Incident of Drug Use per Month at Various Urine Drug Detection Windows ................38
Table 19: Percent Probability of Detection Drug Use on Any Given Urinalysis Collection Based Upon the Testing Rate and Assuming a 3-Day Drug Detection Window at a Varying Frequency of Drug Use in the Month ............38

Status of Drug Use in the DoD Personnel Fiscal Year 2010 Drug Testing Statistical Report
iv
LIST OF APPENDICES
Appendix A: Cutoff Concentrations in the Military Drug Abuse Testing Program .........39
Appendix B: Chairman, Joint Chiefs of Staff Memorandum, November 1, 2010 ..... 40-41

Status of Drug Use in the DoD Personnel Fiscal Year 2010 Drug Testing Statistical Report
v
LIST OF ACRONYMS
AFMES – Armed Forces Medical Examiners’ System DoD – Department of Defense DCAA – Defense Contract Audit Agency DCMA – Defense Contract Management Agency DDRP – Drug Demand Reduction Program DIA – Defense Intelligence Agency DISA – Defense Information Systems Agency DLA – Defense Logistics Agency DHHS – Department of Health and Human Services DMDC – Defense Manpower Data Center DODIG – DoD Office of the Inspector General DSS – Defense Security Service DTRA – Defense Threat Reduction Agency FTDTL – Forensic Toxicology Drug Testing Laboratory FY – Fiscal Year LIMS – Laboratory Information Management System MDA – Methylenedioxyamphetamine, a drug of abuse and a metabolite of MDMA MDMA – Methylenedioxymethamphetamine, a drug of abuse commonly called
“ecstasy” MEDCOM – Medical Command MEPS – Military Entrance Processing Station, conducts physical examinations and drug
tests on applicants to any military Service NGA – National Geospatial-Intelligence Agency NSA – National Security Agency MRO – Medical Review Officer OUSD(P&R) – Office of the Under Secretary of Defense for Personnel and Readiness OPTEMPO – Operating tempo of military activities to include patrols, assaults, air
sorties PDTS – Pharmacy Data Transaction Service SAMHSA – Substance Abuse and Mental Health Services Administration TDP – Testing Designated Position USUHS – Uniform Services University of the Health Sciences WHS – Washington Headquarters Services

Status of Drug Use in the DoD Personnel Fiscal Year 2010 Drug Testing Statistical Report
1
Executive Summary
The abuse of illicit and prescription drugs in the U.S. military has substantial implications on force readiness. It negatively impacts performance in the inherently hazardous conditions of combat, and degrades safety and security for civilians in sensitive testing designated positions (TDPs). This report summarizes drug testing results from Fiscal Year (FY) 2010, discusses these findings, and presents recommendations on how to mitigate drug threats.
Findings
• Overall positive drug rates for active duty personnel across all Services continued to decline between FY 2008 – 2010 (Figure 3).
• The overall Department of Defense (DoD) positive drug rate for FY 2010 was 1.13 percent (Table 2), well below the 2 percent goal.
• The high risk population comprises 36 percent of overall Service members, but accounts for 73 percent of positive drug results.
• While heroin and morphine use is still very low; the rates of abuse for these drugs increased over three fold from FY 2006 levels (Tables 13, 14).
• Oxycodone and oxymorphone prescription drug abuse has almost doubled from FY 2007 levels (Table 13).
Discussion Although drug positive rates have decreased for the Department for several years,
this alone is not indicative of the total health of our forces. Special attention must be paid to the high risk population which consists of enlisted males ages 18-25. This category has historically accounted for the majority of abusers with the highest positive drug rates. Marijuana and cocaine continue to be the primary illicit drugs of abuse. Prescription drug abuse is also a growing issue for Service members, especially as this may be an unintentional result of treating combat injuries and deployment related stress and anxiety.
Recommendations To deter drug abuse, the Department and Services must re-vector testing towards
the high risk population. It is especially important to conduct more frequent testing, and also refocus prevention, education, and outreach efforts towards this group. The Department must also address emerging drug threats. These include increased abuse of prescription medications and “Spice”, a synthetic marijuana-like substance. Prescription drug testing should be expanded to add frequently abused medications, such as Vicodin
Status of Drug Use in the DoD Personnel Fiscal Year 2010 Drug Testing Statistical Report
2
and Valium to the panel of tested drugs. The DoD should also partner with the National Institute of Health and other federal agencies to determine the prevalence of “Spice” in our military. All available research must be analyzed, and commercially developed screening kits should be evaluated for performance and effectiveness.

Status of Drug Use in the DoD Personnel Fiscal Year 2010 Drug Testing Statistical Report
3
Introduction Drug use is incompatible with DoD military and public service.1
The DoD deterrence program components include compulsory random drug testing with punitive consequences, and anti-drug education and prevention. The effectiveness of this program is measured by monitoring the prevalence of drug abuse from drug testing statistics and from triennial surveys. There are two primary established goals:
Drug abuse negatively impacts Service member performance inherent in the hazardous conditions of combat. Drug abuse degrades safety and security associated with the military work environment and also for civilians in sensitive testing designated positions (TDPs). The current DoD DDRP was mandated in 1981 with a mission to deter Service members from abusing illicit and misusing prescription drugs. The DoD DDRP policy for military Service members is promulgated in DoD Directive 1010.1 (Military Personnel Drug Abuse Testing Program) with detailed guidance concerning drug testing procedures contained in DoD Instruction 1010.16 (Technical Procedures for the Military Personnel Drug Abuse Testing Program). General guidance for drug and alcohol abuse deterrence for DoD personnel is provided in DoD Directive 1010.4 (Drug and Alcohol Abuse by DoD Personnel) along with the requirement for an annual report on the status of drug use among DoD personnel. This annual report presents statistics on drug abuse by members of the Armed Forces - active duty, reserve, and National Guard. Data from the DoD compulsory drug testing program shows the historical perspective from FY 2006-2010.
(1) The DoD minimum random drug testing goal is equivalent to 100 percent of the Component’s yearly assigned end strength (as modified by DDRP policy memorandum dated October 1, 2003).
(2) In the March 3, 2008 memorandum signed by the Principal Deputy Under Secretary of Defense for Personnel and Readiness, a drug positive rate below 2 percent was adopted as a “Wellness of the Force Indicator” goal.
The DoD DDRP policy for civilian personnel drug testing is contained in DoD Directive 1010.9 (DoD Civilian Employee Drug-Free Workplace Program). The random testing rate goal for DoD civilian personnel in TDPs is 100 percent of the yearly assigned strength subject to available fiscal year resources. This is the fourth year that complete data has been available for the civilian drug testing program with centralization of DoD testing at the Fort Meade Forensic Toxicology Drug Testing Laboratory (FTDTL).
1 Department of Defense Directive 1010.1. Military Personnel Drug Abuse Testing Program. Reissued with Change 1, January 11, 1999. http://www.dtic.mil/whs/directives/corres/pdf/101001p.pdf.

Status of Drug Use in the DoD Personnel Fiscal Year 2010 Drug Testing Statistical Report
4
An additional assessment of the status of illicit substance use is the DoD Survey of Health Related Behaviors Among Active Duty Military Personnel. This DoD survey2
is conducted every three years as a measure of effectiveness independent from the drug testing program data. The specific metric monitored by the survey is self-reported use of illicit drugs and the misuse of prescription drugs within the past 30 days.
Historical Perspective In his final report “The Vietnam Drug User Returns”3, author L. Robins states in
an Action Office Monograph that approximately 42 percent of the U.S. Military personnel in Vietnam in 1971 had used opiates at least once, and half of these individuals were reported to be physically dependent at some time. On June 22, 1971, the Army instituted a stiffer policy on drug use. An amnesty program was coupled with mandatory urinalysis drug testing. The Pentagon reported that nearly 16,000 (of which 14,736 were Army personnel) Service men voluntarily identified themselves as heroin users and sought treatment.4
The 1980 DoD Survey of Health Related Behavior Among Military Personnel showed that 27.6 percent of all Service members had used an illegal drug in the past 30 days; in some units, the rate was greater than 38 percent.
5
The drug problem was generally viewed as an Army problem until the night of May 25, 1981. An aircraft accident aboard the USS Nimitz resulted in 14 killed, 48 injured, 7 planes destroyed, and 11 planes damaged at an estimated cost of $150M. The post accident investigation revealed that six of those fatally injured had marijuana metabolite in their bodies. In the final report, while the presence of marijuana was not directly attributed to the events of that night, the extent of drug abuse throughout the military Services could not be dismissed.
2 2008 Department of Defense Survey of Health Related Behaviors Among Military Personnel, http://www.tricare.mil/tma/ddrp/documents/2009.09 percent202008 percent20DoD percent20Survey percent20of percent20Health percent20Related percent20Behaviors percent20Among percent20Active percent20Duty percent20Military percent20Personnel.pdf.
3 Robins, LN. The Vietnam Drug User Returns. Special Action Office for Drug Abuse Prevention, Series A, Number 2, May, 1974.
4 Elaine Casey, “History of Drug Use and Drug Users in the United States”, Schaffer Library of Drug Policy, pg 29. http://www.druglibrary.org/schaffer/history/casey1.htm
5 Reference In: Highlights, 2002 Department of Defense Survey of Health Related Behaviors Among Military Personnel, http://www.tricare.mil/main/news/dodsurvey.htm

Status of Drug Use in the DoD Personnel Fiscal Year 2010 Drug Testing Statistical Report
5
The DoD struggled to build a credible and effective drug deterrence testing program. Despite its best efforts, a 1983 commission headed by Dr. David Einsel reviewed the drug testing procedures and found the system broken. Procedures did not meet acceptable forensic standards. As a result, over 10,000 Service members discharged for use of illegal drugs were offered reparations, including the option to return to active duty. Laboratory commanders were relieved or removed from the promotion list, and one brigadier general was forced to retire.
Since the Einsel report, the DoD has provided close oversight of the drug testing program. State of the art analytical technology has been adopted and, in some cases, developed by the military drug testing laboratories. Effective DoD drug demand reduction policies have been crafted and executed. These efforts have resulted in a highly effective and credible work place drug testing program supported by a substantial amount of case law.
Methods
High Risk Group The term “high risk population” is defined as enlisted males ages 18-25. The
reasons for monitoring the high risk population are to determine the pattern and extent of drug abuse and to normalize comparisons among the Services since each has a different proportion of enlisted vs. officers, males vs. females, and younger vs. older age groups. Rank, age, and gender are risk factors for drug use. The Substance Abuse and Mental Health Services Administration (SAMHSA) National Survey on Drug Use and Health reports civilian statistics for United States males 18-25 years of age, which allow for comparison with civilian populations.
Defense Manpower Data Center (DMDC) Personnel Databases The DMDC Personnel Databases used to support the DoD DDRP include the
Active Duty Personnel Master File, the Reserve Component Personnel Data System, and the Military Drug Test File.
The Active Duty Personnel Master File provides an inventory of all individuals on active duty (excluding reservists on active duty for training) for the Army, Navy, Marine Corps, Air Force, Coast Guard, Public Health Service, and the National Oceanic and Atmospheric Administration Commissioned Corps at any given point in time. It provides a standardized and centralized database of all present and past members of the active duty force. It was also the central file from which DMDC began its data acquisition strategy back in the mid-1970s. Longitudinal historical data (back to 1971) is available. File sources are from various personnel centers; their requirement to submit data to DMDC is covered under DoD Instruction 1336.5 (Automated Extract of Active Duty Military Personnel Records).

Status of Drug Use in the DoD Personnel Fiscal Year 2010 Drug Testing Statistical Report
6
The Reserve Components Common Personnel Data System provides the DoD with a standardized and centralized database containing personnel information on all current and past members of the Reserve Components in the Army National Guard, Army Reserve, Navy Reserve, Marine Corps Reserve, Air National Guard, Air Force Reserve, and Coast Guard Reserve. The Office of the Assistant Secretary of Defense for Reserve Affairs provides policy guidance to DMDC to ensure that DMDC's administration of the data system conforms to the needs of the Reserve Components. The current data system has been the official source for Reserve Component strengths since its inception in July 1975. In July 1976, it became the official source for accession, loss, and reenlistment information throughout the DoD.
In response to increased operating tempo (OPTEMPO), particularly for Army and Marine Corps personnel, the DMDC has responded to a request from the Deputy Assistant Secretary of Defense for Health Affairs to track illicit drug testing rates and positive drug rates among deployed military personnel in the Southwest Asian theaters of operation. The DMDC has matched the information from the DoD Laboratory Information Management System (LIMS) with deployment records to produce deployment drug data statistics.
The efforts of DMDC provides the Office of the Under Secretary of Defense for Personnel and Readiness (OUSD(P&R)), with a timely, standardized, and centralized database containing all positive and negative drug tests for each of the Services.
Laboratory Information Management System (LIMS) Database LIMS is a computer network with independent servers in each of the six DoD
drug testing laboratories and a central data repository located in San Antonio, TX, managed under a contract by the U.S. Army Medical Command (MEDCOM). The LIMS’ primary function is to control analytical operations, and provide quality assurance and forensic control for each drug testing laboratory. The system also collects data from laboratory testing, much of it through online data transmission, and stores the data in a computer file consisting of 150 data fields on each specimen tested in the drug testing program. Examples of the data fields are social security number of the donor, collection specimen number, collection unit, collection date, laboratory screening test results, laboratory confirmation test results, final test results, etc. Specimens are included in this statistical report based on the date that drug testing laboratory results were reported, not the date of collection. Usually these two dates are within one week of each other but there are occasions where this time difference is greater.

Status of Drug Use in the DoD Personnel Fiscal Year 2010 Drug Testing Statistical Report
7
The LIMS database also contains test results for Armed Forces Medical Examiners System (AFMES) blind proficiency samples, as required by DoD Instruction 1010.16. These are samples are prepared by AFMES with known amounts of drugs or drug metabolites, and assigned social security numbers not currently in use (so-called “phantom personnel”). The samples are sent to each of the six DoD certified military laboratories under assumed unit return addresses from around the world and are unknowingly processed by laboratory personnel in parallel with Service member specimens. In this manner the testing system is challenged to ensure that testing is conducted according to current directives, instructions and standard operating procedures. AFMES has access to the LIMS to monitor test results on their blind proficiency samples. AFMES produces a monthly drug testing quality control summary report for each laboratory. LIMS also permits the AFMES to monitor the overall program quality assurance and provide the OUSD(P&R), immediate notification as soon as irregularities are identified. MEDCOM, working in conjunction with the AFMES, removes these records before data are transmitted to the DMDC for inclusion in their Military Drug Testing File. These blind proficiency sample results are excluded from this FY 2010 annual report.
Defense Manpower Data Center Compiled Data The DMDC uses the databases described to produce quarterly and annual
statistical data on drug abuse in the military. The OUSD(P&R) compiles the data from the DMDC to produce this annual report. Information in this report is used to evaluate drug demand reduction policy and to support changes to policy when justified.
Drug Testing Metrics For the purposes of this report, the illicit drug positive rate is calculated using the
number of unique positive personnel divided by the number of unique tests performed on any given population. This method of calculating the drug positive rate takes into account that an individual may be tested more than once a year and that a test may be positive for more than one illicit drug. The term total drug tests are the total number of specimens tested within any given Military Service population or risk group.
The mean testing ratio is calculated for each group and is defined as the total number of urine specimens tested during the year divided by the average end strength. This ratio is a measure of testing frequency and used to determine if the Services meet the minimum requirements expressed in DoD Directive 1010.1 and DoD policy memoranda. The directive requires a mean minimum testing ratio of 100 percent for active duty forces and requires the reserve and National Guard forces to test at a rate close to this number. The minimum testing requirement is subject to the limitations of reducing training time and funding. If the mean testing ratio in a Service is 100 percent, one can say that the average Service member is tested once per year, but one must realize that some individuals will be tested more than once and some not at all since DoD uses a random selection system.

Status of Drug Use in the DoD Personnel Fiscal Year 2010 Drug Testing Statistical Report
8
Demographic information for each individual included in this statistical report is taken from the month preceding a drug test. This more accurately reflects attributes such as the Service member’s rank or unit status at the time of testing. Personnel information is usually submitted to the DMDC at the end of the month and some elements, such as rank, may change during the month following a positive drug test. For members who had more than one positive drug test, demographics for that individual are those associated with the earliest illicit drug positive result during the fiscal year. End-strength numbers by rank and age represent the earliest rank and age for each member during the fiscal year.
The standard drug testing panel and associated cutoff values are provided in Appendix A. The DoD program screens 100 percent of the acceptable specimens submitted for marijuana, cocaine, and amphetamines (d-methamphetamine, d-amphetamine, methylenedioxymethamphetamine (MDMA, “Ecstasy”)), and methylenedioxyamphetamine (MDA). Because of the significant threat from heroin in the Afghanistan theater of operations, all the military laboratories were instructed to perform 100 percent screening for heroin starting in FY 2005. Opiates (morphine, codeine, oxycodone, and oxymorphone), and phencyclidine (PCP) are tested on a “pulse” test basis defined as a rate of 20 percent of the laboratory’s work load. Applicants at the Military Entrance Processing Stations (MEPS) are tested only for use of marijuana, cocaine, and amphetamines pursuant to the policy memorandum, “Pre-Accession Drug and Alcohol Testing” from the Deputy Secretary of Defense dated June 12, 2006.
For data reported prior to FY 2007 the term “illicit drug(s)” excludes specimens that were positive for codeine, morphine, amphetamine, oxycodone, and oxymorphone. When these drugs are reported positive to the submitting unit, the results are checked by a Medical Review Officer (MRO) because there may be a legitimate medical explanation for their presence in a member’s urine specimen. Until FY 2007 there was no mechanism to input the results of the MRO review into the LIMS database. Leading up to FY 2007 the Services, at the direction of the OUSD(P&R) implemented reporting procedures that required units to route MRO results back to DMDC. Starting with FY 2007 all positive drug results that require a MRO have been validated; otherwise, they are listed as “MRO Unknown”.
All of the drug abuse national indicators report that the use and availability for methamphetamine has been increasing since the mid-1990s. The psychoactive form of methamphetamine is referred to as the “d form”. All the military-certified laboratories must confirm for d-methamphetamine as well as d-amphetamine.
Military Laboratory Operations Counternarcotics funding supports the operations of six Service-operated
laboratories at the locations shown in Figure 1. The use of ‘field’ drug screening kits or testing devices is not authorized for active duty, National Guard, or Reserve military members. All military urine specimens are obtained under observed collection conditions, maintaining strict chain of custody documentation and shipped to the supporting military laboratory.

Status of Drug Use in the DoD Personnel Fiscal Year 2010 Drug Testing Statistical Report
9
Collection team staffing varies between the Services. The Navy and Marine Corps use unit military personnel to perform the administrative and collection operations as a collateral duty. The Army uses military personnel for specimen collections and civilian personnel to perform administrative functions. The Air Force primarily uses civilians and contractors to perform both functions. In all situations, urine specimens are processed and analyzed pursuant to DoD Instruction 1010.16.6
Historically, drug testing at the separate laboratories has been restricted to individual Service support. DoD recognized that efficiency can be gained by moving the system towards “regionalized” testing. The primary reason that regionalization had not been practical was largely due to the different message reporting systems unique to each Service. Significant improvements in the DoD LIMS, along with building a reliable internet reporting system, removed a large part of the restrictions.
Starting in FY 2005, under mutual agreement between the Army, Navy, and Marine Corps, specimens collected in the Pacific Rim Area of Operations were shipped and analyzed at the Tripler Army FTDTL. Additionally, during FY 2005 Army specimens were sent to the Jacksonville Navy FTDTL to better adjust for specific production demands on the Fort Meade Army FTDTL. During FY 2008 the entire National Guard testing workload, both Army and Air National Guard, was moved to the Brooks City Base Air Force FTDTL to balance the work load across the DoD testing system. These efforts have proved very successful in reducing cost, shortening specimen result reporting time, and improving overall customer satisfaction. Further LIMS improvements along with standardization in operating procedures, should result in further regionalization and program enhancement and optimization, leading to a true joint service drug testing system.
The Great Lakes Navy FTDTL primarily supports drug testing of all military applicants that are processed at the 65 MEPS. During the applicants’ initial processing at the MEPS they are tested only for marijuana, cocaine, and amphetamines (which includes designer amphetamines MDMA/MDA) pursuant to the policy memorandum, “Pre-Accession Drug and Alcohol Testing” from the Deputy Secretary of Defense dated June 12, 2006.
The Fort Meade Army FTDTL is certified under DoD guidelines to conduct testing on military member specimens and is also certified by the Department of Health and Human Services’ (DHHS) National Laboratory Certification Program to conduct testing of civilian specimens under DHHS guidelines. Prior to FY 2005, the only civilian testing performed at Fort Meade was for Department of the Army civilian personnel. To lower costs and to begin to capture DoD civilian drug testing data into the DoD LIMS, the entire civilian testing workload was shifted incrementally to Fort Meade and was completed in October 2007.
6 Department of Defense Instruction 1010.16, Technical Procedures for the Military Personnel Drug Abuse Testing Program, December 9, 1994., http://www.dtic.mil/whs/directives/corres/pdf/101016p.pdf.

Status of Drug Use in the DoD Personnel Fiscal Year 2010 Drug Testing Statistical Report
10
During FY 2008 the Naval Medicine Support Command contracted for a comprehensive facilities analysis of the DoD drug testing system.7
One of the final conclusions reached by the independent consultant was that DoD saves an estimated $21 million per year by using government owned and managed FTDTLs as opposed to out-sourcing the laboratory support services.
Results and Salient Observations
Laboratory Performance Markers of FY 2010 laboratory performance for the six military drug testing
laboratories are shown in Table 1.
Salient observations:
• The DoD laboratory system analyzed 5.02 million specimens.
• All the laboratories met the DoD standard reporting turn-around time of 4 days for negative specimens. All labs met the DoD standard 6 day positive specimen reporting turn-around time except the Fort Meade Army FTDTL. The 6.28 day reporting time was attributed to an increased specimen submission and the operation of a dual civilian and military drug testing program.
• All six laboratories met the 100 percent testing requirement for AMP, COC, THC, and Heroin.
• Five of the six laboratories met the 20 percent pulse testing requirement for opiates, PCP, and oxycodone class drugs. Only the Brooks City Base Air Force FTDTL at 18.4 percent was below the 20 percent requirement.
DoD Testing Results The total Component drug testing metrics are shown in Table 2. Overall, DoD
attained the goal of a positive rate below 2 percent and a mean random test rate of 100 percent or greater.
Active Duty Testing Results Active duty testing results and illicit drug positives are shown in Tables 3 and 4
and Figures 2 through 5.
Salient observations:
• Five percent of the positive specimens were MRO unknown in FY 2010 (Table 3, calculated as MRO unknown/positive personnel).
• The DoD active duty positive rate decreased to 1.13 percent (Table 2).
7 “Engineering Study and Analysis of the DoD Drug Laboratories” Sherlock, Smith and Adams, October 2008.

Status of Drug Use in the DoD Personnel Fiscal Year 2010 Drug Testing Statistical Report
11
• The overall Army service population is tested at over twice the DoD goal of 100 percent random testing, while the Navy and Marine Corps service population is tested at over three times the DoD goal of 100 percent. The Air Force service population is tested at the DoD minimum goal of 100 percent (Figure 2).
• While the high risk active duty population is 40 percent of the total active duty force, they contribute to 73 percent of the active duty positive specimens (Tables 3 and 4).
• While the active duty mean test ratios within the Services have remained relatively constant over the years, the active duty illicit drug positive rates (Figure 3) continue to show a significant decline across the Services. The most notable declines in drug positive rates were observed for the Army, Navy, and Marine Corps.
• The Army tests the ‘high risk population’ at over 200 percent and the Navy and Marine Corps test this population at a ratio at over 300 percent, while the Air Force tests the same population at approximately 125 percent (Figure 4).
• The DoD positive illicit drug rate for active duty, ‘high risk population’ (Table 4) is almost twice the positive rate for the overall active duty population (Table 3). The drug positive rate for the active duty, ‘high risk population’, ranges from 0.55 percent for the United States Air Force to 2.48 percent for the Army (Figure 5). The Army active duty, ‘high risk population’ was above the DoD positive drug rate goal of less than 2 percent in FY 2010.
National Guard and Reserve Testing Results Reserve and National Guard testing results and illicit drug positives are shown in
Tables 5 through 12 and Figures 6-13 and 15-22.
Salient observations:
• For FY 2010, MRO unknown rates for the Reserve (Table 5) and National Guard (Table 9) were 11 and 19 percent, respectively as compared to 5.4 percent for the Active Duty (Table 3).
• The positive rate for both the active duty Reserve and National Guard Components has remained below 1 percent for the past five years (Table 5 and Table 9).
• While the Reserve Component, not on active duty positive rate is below two percent (Table 7), the National Guard Component, not on active duty positive rate of 2.36 percent was above the DoD positive drug rate goal of less than 2 percent for five consecutive years (Table 11).
• The National Guard Component ‘high risk population’, not on active duty had a FY 2010 positive rate of 4.3 percent, over two times the DoD goal of a positive rate below 2 percent (Table 12) for five consecutive years.

Status of Drug Use in the DoD Personnel Fiscal Year 2010 Drug Testing Statistical Report
12
DoD Drug Positive Distribution Table 13 shows the proportional contribution of a specific drug to the overall drug
positive distribution. There was no attempt to account for multiple positive results. The following salient features are noted:
• The proportional contribution of a specific drug to the overall drug positive distribution (Table 13) has remained relatively constant over the past five years, with marijuana remaining the primary drug of abuse followed by cocaine. Nonetheless, the positive distribution percent for marijuana increased from 51 percent in FY 2006 to 67 percent in FY 2010; while, cocaine decreased from 27.5 percent to 13.2 percent.
• The proportional rates for oxycodone and oxymorphone have doubled from FY 2009 to FY 2010. This drug class is pulse tested at 20 percent (1 in 5 specimens submitted are tested for oxycodone/oxymorphone).
• In FY 2005, 100 percent screening for heroin was initiated. The proportion of heroin-positive specimens reported in FY 2006 increased from 0.2 percent of total positive reported drugs to 0.6 percent of total positive reported drugs in FY 2010. The proportional increase in heroin-positive specimens from FY 2006 - 2010 is reflected in the concurrent proportional increase in morphine-positive reported specimens.
• While the proportional number of heroin-positive results is less than 1 percent (Table 13), the addiction potential of heroin and the 3.5 fold increase in heroin-positive Service members identified between FYs 2005-2010 (Table 14) cannot be dismissed.
• The number of heroin-positive military members by Service Component is listed in Table 14. When comparing the number of heroin-positive members between Services, the difference in testing rates between the Services must be considered. The Army, and the Navy-Marine Corps components have testing rates of 200 percent and 300 percent, respectively; while, the Air Force testing rate is 100 percent.
• The active duty end strength of the Army and the end strength of Navy-Marine Corps Components are nearly equal; however, the number of Army heroin-positive Service members was, on average, approximately 3 times higher than the number of Navy-Marine Corps heroin-positive Service members identified during the period between FY 2008-2010.
Deployment Testing The results of deployment drug testing are shown in Table 15.
Salient observations:
• The overall DoD deployment testing rate remains relatively low for FY 2010 at 45 percent which must be considered in relationship to in-theater OPTEMPO.

Status of Drug Use in the DoD Personnel Fiscal Year 2010 Drug Testing Statistical Report
13
• All components have a FY 2010 deployment drug positive rate below 0.4 percent, which is well below the DoD 2 percent positive rate goal.
Military Entrance Processing Station (MEPS) Testing The results of the initial MEPS drug testing are shown in Table 16.
Salient observations:
• In FY 2010 the overall DoD positive rate is 1.10 percent, the lowest it has been in the past five years.
• All Services had a decrease in applicant positive rates from FY 2009-2010.
• FY 2009 and FY 2010 data includes amphetamine data which was not incorporated in the MEPS table of previous annual reports.
DoD Agency Drug Testing The drug testing results for the Services and fifteen DoD agencies that have TDPs
are shown in Table 17.
Salient observations:
• In FY 2010 the DoD agencies tested 73 percent of the total civilian TDPs with an overall positive rate of 0.30 percent.
• The FY 2010 the civilian positive rate of 0.30 percent was well below the DoD goal of less than 1 percent and is lower than the rates of other non-DoD agencies.
• In FY 2011 DoD will propose changing the random testing frequency for DoD civilians in TDPs over a two year period in lieu of the annual requirement. This methodology change will not affect pre-employment, follow-up, suspicious, and accident testing which will remain at current levels and periodicity.
Discussion and Conclusions
Despite the pressures of increased OPTEMPO, the Active Duty forces have continued to test at a mean test ratio of over twice the DoD minimum goal of 1.0 random test per Service member per year. While there have been demonstrable improvements in the mean test ratios over the last several years, the Reserve and National Guard remain below the DoD minimum testing goal of 1.0 random testing event per Service member per year. The National Guard and Reserve units must also address the number of MRO ‘status unknown’ positives in the DMDC data files as compared to the DMDC active duty files. The National Guard and Reserve units must ensure that an MRO review is completed and reported to DMDC in a timely manner for incorporation into the DoD DDRP Service data base.

Status of Drug Use in the DoD Personnel Fiscal Year 2010 Drug Testing Statistical Report
14
Overall, the DoD continued to meet the goal of an illicit drug positive rate below 2 percent. However, the ‘high risk populations’ not on active duty for Army Reserve, Marine Corps Reserve, and Army National Guard had a drug positive rate exceeding the DoD goal. It is of particular concern that the ‘high risk populations’ not on active duty for both the Army National Guard (Figure 20) and Army Reserve (Figure 13) have recorded drug positive rates above 2.5 percent for the past five years. In FY 2010, the drug positive rates for these two components were 2.7 percent and 4.5 percent, respectively. Active duty Army, high risk population exceeded 2.5 percent over the past five years. Army Reserve, not on active duty in 2010 was greater than 2 percent. The Army and Marine Corps, not on active duty, high risk population exceeded 2 percent over the last five years. National Guard, not on active duty exceeded 2.5 percent over the last five years. National Guard, not on active duty, high risk population exceeded 4 percent over the last five years. Additional queries to the FYs 2006-2010 data set will be conducted to identify the location and personnel category associated with the illicit drug positive members of these populations. These data will be forwarded to the service components to address and mitigate the underlying cause. While the high risk population makes up 36 percent of the entire force, this population accounts for 73 percent of all the illicit drug positives. This is consistent with national drug use statistics that show rates of drug use vary substantially by age.8
In addition to enhanced anti-drug prevention and education efforts, increasing the overall frequency of urinalysis testing and introducing focused testing efforts on the high risk population may provide a greater deterrent to drug use and improve detection of both casual and habitual drug users. Tables 18 and 19, show the statistical probability of detecting a drug user at different mean test rates. Detection of drug use is dependent on several variables to include the drug window of detection (drug clearance rate from the body), the frequency of drug use in any given month, and the number of days in a year when random urinalysis collections are conducted (i.e., testing events are conducted only on 220 work days as opposed to 365 days a year).
The national survey completed in 2010 showed past month illicit drug use peaks between ages 18 and 25 years of age. In 2010, an estimated 22.6 million (8.9 percent) Americans ages 12 or older reported using an illicit drug in the past 30 days. Accordingly, the Services should task their drug testing resources to target the high risk population at an increased frequency of testing.
If a Service member abuses a drug that has a 3 day window of detection and uses the drug only once a month, and the command considers every day of the year as a testable event with a testing ratio of 100 percent, then the probability of detecting the Service members use is approximately 10 percent. In the same scenario by increasing the testing ratio to 200 – 300 percent, the probability of detecting the Service member increases to 20 – 30 percent, respectively. In practice, most urinalysis testing is conducted on workdays, so the probability of detection is proportionally less by a factor of 0.6 (220 days/365 days). Any drug with a longer window of detection will increase the probability of detecting the Service member, keeping all other variables constant (Table 18).
8 U.S. Department of Health and Human Services, 2003 National Survey on Drug Use and Health: National Findings, http://www.oas.samhsa.gov/nhsda/2k3nsduh/2k3Results.htm

Status of Drug Use in the DoD Personnel Fiscal Year 2010 Drug Testing Statistical Report
15
If a Service member abuses a drug that has a 3 day window of detection and the use occurs more than once a month, then the probability of detection increases as a function of the testing ratio and frequency of monthly drug use (Table 19). For a Service member abusing a drug 3 times in a given month with a command testing ratio of 100 percent, the probability of detection, at best, is 30 percent. Increasing the test ratio to 300 percent will increase the probability of detection linearly.
Deterring drug use begins by testing all military applicants prior to entrance for drug dependency. Out of a total of 329,804 applicants, 1.10 percent tested positive at the MEPS. This rate has steadily declined over the past five years. It is remarkable that an individual will test positive even though applicants are briefed that they will be drug tested when they report to the MEPS. Moreover, both the Army and Navy have policies that allow their recruiters to use “desk side” drug screening tests prior to sending applicants to the MEPS.
Figure 23 provides a perspective on the DoD DDRP data with respect to United States work place drug testing. The chart compares DoD testing results compared to the most recent data available from Quest Diagnostics9
When compared to national surveys of illicit drug use and to civilian work place drug testing programs, the DoD military drug testing program is successfully deterring drug use among military members. Regardless of these favorable comparisons, DoD must continue to remain diligent in its efforts to deter military members from illicit or prescription drug use. History has shown that degradation of the DDRP program adversely affects good order and discipline in the force which could negatively impact national security.
, one of the country’s largest drug testing laboratories. The Quest results represent over 1.5 million tests in 2010 for tests performed for clients with TDPs that fall under the federally-mandated regulations and over 6 million tests in 2010 for tests conducted for the combined general U.S. workforce. The data shown are for amphetamines, cocaine, marijuana, opiates, and PCP. While the Quest data do not reflect MRO review, the DoD plotted positive data does provide a rough comparison. While the FY 2010 DoD positive rate is slightly lower than other federally mandated programs, it is more than two times lower than the combined general U.S. workforce.
Future Endeavors Goals:
• Adjust civilian testing rate from 100 percent annually to 100 percent over two years.
• Target military testing on high risk groups of 18-25 year old personnel.
9 Quest Diagnostics Inc., 1290 Wall Street West, Lyndhurst, NJ 07071, http://www.questdiagnostics.com/employersolutions/dti/2011_09/dti_index.html.

Status of Drug Use in the DoD Personnel Fiscal Year 2010 Drug Testing Statistical Report
16
• Monitor those units within each Service with the highest drug positive rates and implement appropriate directed actions of testing, education, and training to identify and deter drug use.
• Task military personnel to assume collateral duty assignments as members of collections teams to replace contract or civilian personnel.
Chairman, Joint Chiefs of Staff Recommendations (Appendix B):
• Establish mobile specimen collection teams.
• Monitor Commander compliance with random testing requirements.
• Increase specimen collection rates in-theater.
• Expand drug testing to include most common prescription drugs (particularly benzodiazepines and hydrocodone).
Early Indicators for Increase in Prescription Drug Abuse The misuse and abuse of prescription medications such as opiates, depressants
and stimulants in the U.S. military and the general population is a growing concern. Drug abuse within the military has substantial implications on force readiness as well as on the military healthcare system. In an attempt to minimize the instances of such abuse, the military Services have invested heavily in prevention programs focusing on education, awareness, deterrence (e.g. random drug screening), and discipline. Despite these programs, the Services have seen an overall increase in the prevalence of self-reported illicit drug use in the previous 30 days among Active Duty Service Members (ADSM) from 3 percent in 2002 to 5 percent in 2005 and 12 percent in 2008.2 The same trend is observed for the nonmedical misuse of prescription drugs with self-reported prescription drug misuse increasing from 1.8 percent in 2002 to 3.8 percent in 2005 and 11.1 percent in 2008.2 On the other hand, the civilian misuse of prescription drugs has remained relatively constant with a prevalence rate of 2.4 percent in 2010, 2.8 percent in 2009, and 2.7 percent in 2002.2 The higher incidence of prescription drug misuse among Military personnel may be related to the use of opiates for pain management of combat related injuries and of hypnotic sedatives (benzodiazepines) for combat / deployment related stress and anxiety.
Early Indicators – Prevalence Testing for Benzodiazepines and Hydrocodone To monitor the incidence of abused drugs not on the current testing panel, the
DoD performs periodic prevalence testing. Prevalence testing is performed by analyzing previously reported negative specimens from the DoD drug testing laboratories. The DoD drug program calculates the prevalence rate for the monitored drug and determines whether it should be considered for addition to the testing panel. Any positive results from the prevalence tests are compared to the TRICARE Pharmacy Data Transaction Service (PDTS) database to identify those Service members with an authorized prescription which would cause a positive urinalysis test. These authorized-use positive results are not included in the calculated illicit use prevalence rate.

Status of Drug Use in the DoD Personnel Fiscal Year 2010 Drug Testing Statistical Report
17
The latest DoD urine prevalence survey of 15,586 randomly selected Service member specimens found that the prevalence rate of illicit hydrocodone/hydromorphone use was 0.16 percent and the prevalence rate of illicit benzodiazepines use was 0.25 percent. Previous benzodiazepine prevalence testing in 2003 and 2007 identified illicit use rates of approximately 0.21 percent.
Early Indicators – Media Coverage Prescription drug misuse among military personnel has drawn the attention of the
U.S Congress, senior military leaders, and the national media. The release of the 2008 Department of Defense Survey of Health Related Behaviors Among Active Duty Military Personnel led to many articles in the national press highlighting the abuse and misuse of prescription medications by military members.10
The USA TODAY reported that “about one in four soldiers admit abusing prescription drugs, mostly pain relievers, in a one-year period, according to Pentagon health survey.” In addition, the same article cited statistics from the survey of over 28,500 Service members that revealed that almost 20 percent of Marines had abused prescription drugs, mostly painkillers in the past year. Extracting data from the survey, the article points out that pain relievers were misused at a rate three times that of illegal drugs such as marijuana and amphetamines.10 Another report from USA TODAY stated that “military doctors wrote almost 3.8 million prescriptions for pain relief for Service members last year—more than four times the 866,773 doses handed out in 2001."11 The Army Times reported that the U.S. Senate was concerned with the rise in psychiatric drug use of approximately 76 percent since the start of the wars in Iraq and Afghanistan.12
These are just several examples of the media published in the past year. As the DoD authorizes additional prescription drug testing, there will be an expected increase in positive results which may lead to additional reporting within the national media.
10 Gregg Zoroya, “Study Details U.S. Troops’ Prescription Abuse”, USATODAY December 17, 2009, http://www.usatoday.com/printedition/news/20091217/milhealth17_st.art.htm 11 Gregg Zoroya, “Abuse of Pain Pills by Troops Concerns Pentagon”, USATODAY March 17, 2010, http://www.usatoday.com/news/military/2010-03-16-military-drugs_N.htm 12 Andrew Tilghman, “Senators Want Data on Prescription Drug Use”, Army Times March 24, 2010, http://www.armytimes.com/news/2010/03/military_pharmaceuticals_webb_032410w/

Status of Drug Use in the DoD Personnel Fiscal Year 2010 Drug Testing Statistical Report
18
Department of DefenseMilitary Drug Testing Laboratories
Navy Drug Screening LabJacksonville, FL
Army Drug Screening LabFort Meade, MD
Navy Drug Screening LabGreat Lakes, IL
Air Force Drug Screening LabBrooks City BaseSan Antonio, TX
Navy Drug Screening LabSan Diego, CA
Army Drug Screening LabTripler AMC, Hawaii
Figure 1
Location of Service Operated Drug Screening Laboratories (FTDTLs)
Figure 2
Active Duty Mean Test Ratios
00.5
11.5
22.5
33.5
2006 2007 2008 2009 2010
ARMY NAVY USMC USAF

Status of Drug Use in the DoD Personnel Fiscal Year 2010 Drug Testing Statistical Report
19
Figure 3 Active Duty Illicit Drug Positive Rates
Figure 4
Active Duty, ‘High Risk Population’, Mean Test Ratios
0.00%0.20%0.40%0.60%0.80%1.00%1.20%1.40%1.60%1.80%2.00%
2006 2007 2008 2009 2010
ARMY NAVY USMC USAF
00.5
11.5
22.5
33.5
4
2006 2007 2008 2009 2010
ARMY NAVY USMC USAF

Status of Drug Use in the DoD Personnel Fiscal Year 2010 Drug Testing Statistical Report
20
Figure 5 Active Duty, ‘High Risk Population’, Illicit Drug Positive Rates
Figure 6
Reserve Component, Active Duty, Mean Test Ratios
0.00%0.50%1.00%1.50%2.00%2.50%3.00%3.50%
2006 2007 2008 2009 2010
ARMY NAVY USMC USAF
0
0.5
1
1.5
2
2.5
3
2006 2007 2008 2009 2010
ARMY NAVY USMC USAF

Status of Drug Use in the DoD Personnel Fiscal Year 2010 Drug Testing Statistical Report
21
Figure 7 Reserve Component, Active Duty, Illicit Drug Positive Rates
Figure 8
Reserve Component, Active Duty, 'High Risk Population’ Mean Test Ratios
0.00%
0.50%
1.00%
1.50%
2006 2007 2008 2009 2010
ARMY NAVY USMC USAF
0
0.5
1
1.5
2
2.5
3
2006 2007 2008 2009 2010
ARMY NAVY USMC USAF

Status of Drug Use in the DoD Personnel Fiscal Year 2010 Drug Testing Statistical Report
22
Figure 9 Reserve Component, Active Duty, 'High Risk Population’ Illicit Drug Positive Rates
Figure 10
Reserve Component, Not on Active Duty, Mean Test Ratios
0.00%
0.50%
1.00%
1.50%
2.00%
2.50%
2006 2007 2008 2009 2010
ARMY NAVY USMC USAF
0
0.5
1
1.5
2
2.5
3
2006 2007 2008 2009 2010
ARMY NAVY USMC USAF

Status of Drug Use in the DoD Personnel Fiscal Year 2010 Drug Testing Statistical Report
23
Figure 11 Reserve Component, Not on Active Duty, Illicit Drug Positive Rates
Figure 12 Reserve Component, Not on Active Duty, ‘High Risk Population’, Mean Test Ratios
0.00%
0.50%
1.00%
1.50%
2.00%
2.50%
2006 2007 2008 2009 2010
ARMY NAVY USMC USAF
00.5
11.5
22.5
33.5
2006 2007 2008 2009 2010
ARMY NAVY USMC USAF

Status of Drug Use in the DoD Personnel Fiscal Year 2010 Drug Testing Statistical Report
24
Figure 13 Reserve Component, Not on Active Duty, ‘High Risk Population’, Illicit Drug
Positive Rates
Figure 14
Service Military Personnel Heroin-positive by Fiscal Year (Number of Unique Positive Members)
27
39 40
70
104113
6 10 13 1516 1410 6 8
1319 16
2 4 4 510 13
020406080
100120
2005 2006 2007 2008 2009 2010
ARMY NAVY USMC USAF
0.00%0.50%1.00%1.50%2.00%2.50%3.00%3.50%4.00%4.50%5.00%
2006 2007 2008 2009 2010
ARMY NAVY USMC USAF

Status of Drug Use in the DoD Personnel Fiscal Year 2010 Drug Testing Statistical Report
25
Figure 15 National Guard Component, Active Duty, Mean Test Ratios
Figure 16 National Guard Component, Active Duty, Illicit Drug Positive Rates
0.00%0.10%0.20%0.30%0.40%0.50%0.60%0.70%0.80%0.90%1.00%
2006 2007 2008 2009 2010
ARMY USAF
0
0.2
0.4
0.6
0.8
1
1.2
2006 2007 2008 2009 2010
ARMY USAF

Status of Drug Use in the DoD Personnel Fiscal Year 2010 Drug Testing Statistical Report
26
Figure 17 National Guard Component, Active Duty, ‘High Risk Population’
Mean Test Ratios
Figure 18
National Guard Component, Active Duty, ‘High Risk Population’ Illicit Drug Positive Rates
00.20.40.60.8
11.21.41.61.8
2
2006 2007 2008 2009 2010
ARMY USAF
0.00%
0.50%
1.00%
1.50%
2.00%
2.50%
2006 2007 2008 2009 2010
ARMY USAF

Status of Drug Use in the DoD Personnel Fiscal Year 2010 Drug Testing Statistical Report
27
Figure 19 National Guard Component, Not on Active Duty, Mean Test Ratios
Figure 20
National Guard Component, Not on Active Duty, Illicit Drug Positive Rates
00.20.40.60.8
11.21.41.61.8
2
2006 2007 2008 2009 2010
ARMY USAF
0.00%
0.50%
1.00%
1.50%
2.00%
2.50%
3.00%
2006 2007 2008 2009 2010
ARMY USAF

Status of Drug Use in the DoD Personnel Fiscal Year 2010 Drug Testing Statistical Report
28
Figure 21 National Guard Component, Not on Active Duty, ‘High Risk Population’ Mean Test
Ratios
Figure 22 National Guard Component, Not on Active Duty, ‘High Risk Population’ Illicit
Drug Positive Rates
0
0.5
1
1.5
2
2006 2007 2008 2009 2010
ARMY USAF
0.00%
1.00%
2.00%
3.00%
4.00%
5.00%
2006 2007 2008 2009 2010
ARMY USAF

Status of Drug Use in the DoD Personnel Fiscal Year 2010 Drug Testing Statistical Report
29
Figure 23*
DoD Military Positive Rates vs. U.S. Workforce Rates
* Data for U.S. workforce obtained from http://www.questdiagnostics.com/employersolutions/dti/2011_09/dti_index.html. Data for DoD positive rate is calculated by fiscal year. All other data calculated by calendar year.
0.00%0.50%1.00%1.50%2.00%2.50%3.00%3.50%4.00%4.50%5.00%
2006 2007 2008 2009 2010
Federally-Mandated, Safety-Sensitive Workforce
General U.S. Workforce
Combined U.S. Workforce
Overall DoD Positive Rate

Status of Drug Use in the DoD Personnel Fiscal Year 2010 Drug Testing Statistical Report
30
Table 1 FY 2010 Military Drug Testing Laboratory Performance Measures
Tripler1 Meade2 JAX3 SD4 GL5 Brooks6
Specimens Tested 964,874
842,565
(667,776 military) (174,789 civilian)
953,121 869,566
550,802
(220,998 military) (329,804
MEPS)
839,451
Positive TAT7 5.09 6.28 4.49 3.63 1.93 5.49
Negative TAT 1.71 3.07 2.31 1.09 0.31 1.87
Test Rates
AMP 100 percent 100 percent 100 percent 100 percent 100 percent 100 percent
COC 100 percent 100 percent 100 percent 100 percent 100 percent 100 percent
OPI 22.6 percent 20.95 percent 22.71 percent 39.17 percent 24.81 percent 18.39 percent
PCP 21.35 percent 20.94 percent 21.14 percent 63.79 percent 24.81 percent 18.39 percent
THC 100 percent 100 percent 100 percent 100 percent 100 percent 100 percent
HEROIN 100 percent 100 percent 100 percent 100 percent 100 percent 100 percent
OXY 23.18 percent 20.94 percent 21.23 percent 29.54 percent 26.95 percent 18.39 percent 1 Army Drug Screening Laboratory, Tripler Army Medical Center, Honolulu, HI 2 Army Drug Screening Laboratory, Fort Meade, MD, testing rates are calculated using military specimens only 3 Navy Drug Screening Laboratory, Jacksonville, FL 4 Navy Drug Screening Laboratory, San Diego, CA 5 Navy Drug Screening Laboratory, Great Lakes, IL, testing rates are calculated using military specimens only 6 Air Force Drug Screening Laboratory, Brooks City Base, San Antonio, TX 7 Turn-around Time – Day from receipt at lab to the day the specimen result was reported.
Table 2
Total DoD Illicit Drug Testing Performance Metrics
Fiscal Year 2006 2007 2008 2009 2010
Illicit Drug Positive Rate 1.25 percent 1.21 percent 1.20 percent 1.18 percent 1.13 percent
Mean Testing Ratio 1.62 1.61 1.73 1.72 1.65

Status of Drug Use in the DoD Personnel Fiscal Year 2010 Drug Testing Statistical Report
31
Table 3 Active Duty Illicit Drug Positive and Testing Rates
Fiscal Year
Average End Strength
Unique Tests
Positive Personnel
MRO Unknown
Positive Rate
Total Specimens
Tested
Mean Test
Ratio
2010 1,576,520 1,230,452 10,790 591 0.88 percent 3,436,394 2.18
2009 1,564,445 1,222,488 12,368 639 1.01 percent 3,355,435 2.14
2008 1,486,687 1,204,331 12,856 1,049 1.07 percent 3,259,019 2.19
2007 1,555,074 1,194,159 12,866 1,252 1.08 percent 3,206,041 2.06
2006 1,556,884 1,196,678 13,376 N/A 1.12 percent 3,262,563 2.10
Table 4 Active Duty, ‘High Risk Population’ Illicit Drug Positive and Testing Rates
Fiscal Year
Average End Strength
Unique Tests
Positive Personnel
MRO Unknown
Positive Rate
Total Specimens
Tested
Mean Test
Ratio
2010 631,650 523,325 7,829 244 1.50 percent 1,549,320 2.45
2009 637,929 533,622 9,398 255 1.76 percent 1,563,679 2.45
2008 588,850 529,524 9,749 375 1.84 percent 1,522,064 2.58
2007 634,420 523,984 9,666 567 1.84 percent 1,486,999 2.34
2006 637,049 524,549 9,906 N/A 1.89 percent 1,521,678 2.39
Table 5
Reserve Component, Active Duty, Illicit Drug Positive and Testing Rates
Fiscal Year
Average End Strength
Unique Tests
Positive Personnel
MRO Unknown
Positive Rate
Total Specimens
Tested
Mean Test
Ratio
2010 189,063 103,299 677 75 0.66
percent 198,948 1.05
2009 195,821 102,524 781 81 0.76
percent 187,791 0.96
2008 158,880 94,274 700 119 0.74
percent 171,353 1.08
2007 170,277 89,322 590 133 0.66
percent 158,833 0.93
2006 171,927 81,505 700 N/A 0.86
percent 159,883 0.93

Status of Drug Use in the DoD Personnel Fiscal Year 2010 Drug Testing Statistical Report
32
Table 6 Reserve Component, Active Duty, ‘High Risk Population’ Illicit Drug Positive and
Testing Rates
Fiscal Year
Average End Strength
Unique Tests
Positive Personnel
MRO Unknown
Positive Rate
Total Specimens
Tested
Mean Test
Ratio
2010 56,153 34,348 415 15 1.21 percent 66,158 1.18
2009 59,368 34,875 467 18 1.34 percent 63,926 1.08
2008 45,293 31,842 436 19 1.37 percent 59,350 1.31
2007 49,222 28,813 354 24 1.23 percent 53,051 1.08
2006 49,270 26,630 395 N/A 1.48 percent 54,215 1.10
Table 7
Reserve Component, Not on Active Duty, Illicit Drug Positive and Testing Rates
Fiscal Year
Average End Strength
Unique Tests
Positive Personnel
MRO Unknown Positive Rate
Total Specimens
Tested
Mean Test
Ratio
2010 356,768 176,263 2,929 289 1.66 percent 301,401 0.84
2009 250,008 164,539 2,392 181 1.45 percent 266,864 1.07
2008 268,160 167,518 2,043 253 1.22 percent 265,664 0.99
2007 274,659 168,456 2,154 285 1.28 percent 269,530 0.98
2006 276,525 159,680 2,171 N/A 1.36 percent 266,154 0.96
Table 8
Reserve Component, Not on Active Duty, ‘High Risk Population’, Illicit Drug Positive and Testing Rates
Fiscal Year
Average End Strength
Unique Tests
Positive Personnel
MRO Unknown
Positive Rate
Total Specimens
Tested
Mean Test
Ratio
2010 97,176 52,032 1,784 85 3.43 percent 86,282 0.89
2009 60,290 46,876 1,384 48 2.95 percent 72,829 1.21
2008 65,396 46,005 1,188 38 2.58 percent 70,106 1.07
2007 66,653 46,039 1,212 76 2.63 percent 70,907 1.06
2006 53,557 39,371 1,173 N/A 2.98 percent 64,925 1.21

Status of Drug Use in the DoD Personnel Fiscal Year 2010 Drug Testing Statistical Report
33
Table 9 National Guard Component, Active Duty, Illicit Drug Positive and Testing Rates
Fiscal Year
Average End Strength
Unique Tests
Positive Personnel
MRO Unknown
Positive Rate
Total Specimens
Tested
Mean Test
Ratio
2010 188,241 114,159 678 132 0.59 percent 188,090 1.00
2009 187,916 112,799 625 194 0.55 percent 176,092 0.94
2008 148,172 97,923 759 145 0.78 percent 143,000 0.97
2007 156,773 85,703 509 183 0.59 percent 122,210 0.78
2006 192,612 76,462 610 N/A 0.80 percent 118,211 0.61
Table 10
National Guard Component, Active Duty, ‘High Risk Population’ Illicit Drug Positive and Testing Rates
Fiscal Year
Average End Strength
Unique Tests
Positive Personnel
MRO Unknown
Positive Rate
Total Specimens
Tested
Mean Test
Ratio
2010 40,622 25,266 361 23 1.43 percent 40,587 1.00
2009 42,391 25,136 328 36 1.30 percent 38,112 0.90
2008 30,638 22,797 425 33 1.86 percent 32,441 1.06
2007 33,029 18,062 248 30 1.37 percent 25,385 0.77
2006 45,674 16,180 301 N/A 1.86 percent 26,628 0.58
Table 11 National Guard Component, Not on Active Duty, Illicit Drug Positive and Testing
Rates
Fiscal Year
Average End Strength
Unique Tests
Positive Personnel
MRO Unknown
Positive Rate
Total Specimens
Tested
Mean Test
Ratio
2010 444,674 262,608 6,185 669 2.36 percent 412,204 0.93
2009 339,625 254,818 5,735 580 2.25 percent 382,004 1.12
2008 362,274 246,671 5,330 392 2.16 percent 342,987 0.95
2007 365,416 234,453 5,408 713 2.31 percent 313,514 0.86
2006 319,177 198,318 4,482 N/A 2.26 percent 260,839 0.82

Status of Drug Use in the DoD Personnel Fiscal Year 2010 Drug Testing Statistical Report
34
Table 12 National Guard Component, Not on Active Duty, ‘High Risk Population’ Illicit
Drug Positive and Testing Rates
Fiscal Year
Average End Strength
Unique Tests
Positive Personnel
MRO Unknown
Positive Rate
Total Specimens
Tested
Mean Test
Ratio
2010 151,187 93,824 4,005 219 4.27 percent 150,366 0.99
2009 122,143 90,226 3,711 183 4.11 percent 137,213 1.12
2008 123,057 85,727 3,219 127 3.75 percent 121,051 0.98
2007 125,224 79,584 3,293 256 4.14 percent 108,204 0.86
2006 103,120 63,625 2,579 N/A 4.05 percent 85,945 0.83
Table 13
Total DoD Drug Positive Percent Distribution (by number of positive results)
Drug FY 2006 FY 2007 FY 2008 FY 2009 FY 2010
Amphetamine
d-Amphetamine 9.7 percent 2.5 percent 4.3 percent 5.0 percent 5.6 percent
d-Methamphetamine 6.4 percent 1.7 percent 3.4 percent 3.2 percent 3.1 percent
Cocaine 27.5 percent 28.2 percent 22.4 percent 14.7 percent 13.2 percent
Ecstasy 3.6 percent 2.6 percent 2.8 percent 2.9 percent 2.8 percent
Marijuana 50.9 percent 59.9 percent 62.2 percent 68.3 percent 67.4 percent
MDA 1.6 percent 1.2 percent 1.4 percent 1.5 percent 1.3 percent
Phencyclidine* 0.0 percent 0.1 percent 0.0 percent 0.0 percent 0.0 percent
Opioids*
Codeine N/A 0.5 percent 0.3 percent 0.4 percent 0.4 percent
Morphine N/A 0.2 percent 0.2 percent 0.6 percent 0.8 percent
Heroin 0.2 percent 0.3 percent 0.4 percent 0.6 percent 0.6 percent
Oxycodone N/A 1.0 percent 0.9 percent 0.9 percent 1.7 percent
Oxymorphone N/A 1.8 percent 1.6 percent 1.8 percent 3.1 percent
*phencyclidine, codeine, morphine, oxycodone, oxymorphone are tested at a pulse rate of 20 percent.
Status of Drug Use in the DoD Personnel Fiscal Year 2010 Drug Testing Statistical Report
35
Table 14 Service Component Military Personnel Heroin-positive by Fiscal Year
(Number of Unique Positive Members)
Drug FY 2005 FY 2006 FY 2007 FY 2008 FY 2009 FY 2010
Army Active Duty 16 25 26 43 67 67 Army National Guard 5 6 9 16 23 31 Army Reserve 6 9 5 11 14 15 TOTAL ARMY 27 40 40 70 104 113
Navy Active Duty 4 10 13 15 16 11 Navy Reserve 2 0 0 0 4 3 TOTAL NAVY 6 10 13 15 20 14
USMC Active Duty 7 4 7 12 19 14 USMC Reserve 3 2 1 1 0 2 TOTAL USMC 10 6 8 13 19 16
USAF Active Duty 1 1 3 4 6 12 USAF Guard 1 3 1 1 2 1 USAF Reserve 0 0 0 0 2 0 TOTAL USAF 2 4 4 5 10 13
TOTAL DoD 45 59 65 103 152 156

Status of Drug Use in the DoD Personnel Fiscal Year 2010 Drug Testing Statistical Report
36
Table 15 Deployment Drug Testing*
Service Fiscal Year
Total Deployed
Unique Tests
Positive Personnel
MRO Unknown
Positive Rate
Total Specimens
Tested
Mean Test
Ratio
Total DoD 2010 624,855 175,186 445 49 0.25 t
281,480 0.45
2009 655,064 186,930 362 181 0.19 t
302,519 0.47
2008 638,959 169,535 422 193 0.25 t
269,115 0.42
2007 604,777 150,729 308 142 0.20 t
241,308 0.40
2006 606,389 127,391 339 N/A 0.27 t
190,372 0.31
Army 2010 284,005 89,231 297 15 0.33 t
134,062 0.47
2009 291,367 96,356 219 132 0.23 t
149,756 0.52
2008 285,466 90,174 315 131 0.35 t
134,466 0.47
2007 267,514 70,523 188 108 0.27 t
101,632 0.38
2006 258,641 58,816 204 N/A 0.35 t
79,464 0.31
Navy 2010 89,447 42,196 23 8 0.05 t
84,586 0.95
2009 94,824 41,792 26 8 0.06 t
78,523 0.78
2008 100,866 44,081 42 34 0.10 t
87,057 0.86
2007 93,699 47,215 50 7 0.11 t
93,540 1.00
2006 84,532 37,797 49 N/A 0.13 t
69,506 0.82
USMC 2010 64,600 11,036 31 2 0.28 t
17,469 0.27
2009 75,647 21,331 60 1 0.28 t
35,665 0.42
2008 85,316 14,474 23 0 0.16 t
21,898 0.26
2007 82,326 11,478 28 0 0.24 t
17,984 0.22
2006 79,889 14,204 31 N/A 0.22 t
21,898 0.27
USAF 2010 92,326 2,079 5 2 0.24 t
2,274 0.02
2009 91,046 2,155 2 0 0.09 t
2,494 0.03
2008 90,636 2,864 3 1 0.10 t
3,108 0.03
2007 86,562 4,326 6 0 0.14 t
4,543 0.05
2006 83,961 4,693 4 N/A 0.09 t
4,914 0.06
NGB 2010 94,477 30,644 89 22 0.29 t
43,089 0.46
2009 102,180 25,296 55 40 0.22 t
36,081 0.47
2008 76,675 17,942 39 27 0.22 t
22,586 0.29
2007 74,676 17,187 36 27 0.21 t
23,609 0.32
2006 99,366 11,881 51 N/A 0.43 t
14,590 0.15
*Note: All Service figures include both Active Duty and Reserve data

Status of Drug Use in the DoD Personnel Fiscal Year 2010 Drug Testing Statistical Report
37
Table 16 Military Accession Illicit Drug Testing Positive Rate
Applicant Source FY
2006 FY
2007 FY
2008 FY
2009* FY
2010*
Army 2.59
2.55
1.93
1.18
0.96
Navy 1.54
1.41
1.05
1.05
0.99
USMC 3.82
3.69
2.51
1.54
0.73
USAF 0.91
1.09
0.87
0.79
0.71
NGB 3.31
3.42
2.81
2.11
2.01
DoD 2.54
2.53
1.92
1.32
1.10
*Note: FY 2009 and FY 2010 data includes amphetamine data
which is not included in FY 2006-2008 data.
Table 17
FY 2010 DoD Agencies Drug Testing Results
Agency Total TDP
TDP Tested1
Percent TDP
Tested2 Tested
Positive2 FY 2009 Percent Positive3
FY 2010 Percent Positive2
Air Force 32,925 29,186 88.6 percent 70 0.16
0.24 percent Army 45,500 43,454 95.5 percent 112 0.30
0.26 percent
Navy 42,000 31,143 74.2 percent 75 0.33
0.24 percent DCAA 1,140 591 51.8 percent 0 0.00
0.00 percent
DCMA 3,500 6 0.2 percent 0 0.00
0.00 percent DIA 3,500 2,054 58.7 percent 2 0.04
0.10 percent
DISA 2,900 1,102 38.0 percent 4 0.66
0.36 percent DLA 12,147 5,186 42.7 percent 88 0.95
1.70 percent
DODIG 1,540 213 13.8 percent 0 0.09
0.00 percent DSS 728 233 32.0 percent 1 0.24
0.43 percent
DTRA 1,250 2 0.2 percent 0 0.00
0.00 percent NGA 7,800 2,991 38.3 percent 0 0.18
0.00 percent
NSA 18,000 11,760 65.3 percent 39 0.41
0.33 percent USUHS 110 110 100 percent 0 0.00
0.00 percent
WHS 4,390 2,014 45.9 percent 3 0.15
0.15 percent
TOTAL DoD CIVILIANS
177,430 130,045 73.3 percent 394 0.31
percent 0.30 percent
1TDP Tested is the number of random tests only. Does not include applicant testing. 2Only includes random testing. Does not include applicant testing. 3Includes both random and applicant positives.

Status of Drug Use in the DoD Personnel Fiscal Year 2010 Drug Testing Statistical Report
38
Table 18
Percent Probability of Detection Drug Use on any Given Urinalysis Collection Based Upon Varying Testing Rate and Assuming a Single Incident of Drug Use per Month at
Various Urine Drug Detection Windows
Testing frequency Number of Random Collections Per Year
(Every day a testable event - 365
days)
Number of Day that Drug Use is Detectable by Urinalysis Testing (Assuming 1 drug use per month)
1-day
window
2-day
window
3-day window
4-day
window
5-day
window
1 (100 percent) 3 7 10 13 16
2 (200 percent) 7 13 20 26 33
3 (300 percent) 10 20 30 39 49
4 (400 percent) 13 26 39 53 66
5 (500 percent) 16 33 49 66 82
Table 19
Percent Probability of Detection Drug Use on any Given Urinalysis Collection Based Upon the Testing Rate and Assuming a 3-Day Drug Detection Window at a Varying
Frequency of Drug Use in the Month
Testing Frequency Number of Random Collections Per Year
Number of Times Within a Month that Drugs are Used with a 3-day Urine Drug Detection Window
1 drug use per month
2 drug uses per month
3 drug uses per month
4 drug use per month
5 drug use per month
6 drug use per month
1 (100 percent) 10 20 30 39 49 59 2 (200 percent) 20 39 59 79 99 118 3 (300 percent) 30 59 89 118 148 178 4 (400 percent) 39 79 118 158 197 237
5 (500 percent) 49 99 148 197 247 296
Percent Probability of Detection = frequency of use/month x 12 mo/yr x testing freq x detection window/365 days/yr x 100
If collections occur only on work days (220) vice 365, then the probability percentages are reduced by a factor of approximately 0.6.

Status of Drug Use in the DoD Personnel Fiscal Year 2010 Drug Testing Statistical Report
39
Appendix A CUTOFF CONCENTRATIONS IN THE MILITARY DRUG ABUSE TESTING PROGRAM
INITIAL TESTING CUTOFF CONCENTRATIONS
Drug Class
Cutoff Concentration (ng/mL)
Amphetamines 500 Cannabinoids 50 Cocaine Metabolites 150 Designer Amphetamines 500 Phencyclidine 25 Opiates (Morphine/Codeine) 2000 Opiate (6-monoacetylmorphine) 10 Opiates (Oxycodone/Oxymorphone) 100
CONFIRMATION CUTOFF CONCENTRATIONS
Initial Presumptive Positive Test
Confirmation Drug/ Cutoff Reported Drug Metabolite (ng/mL) Use
Amphetamines Amphetamine 100 d-Amphetamine Methamphetamine 100 d-Methamphetamin
Designer Amphetamines
Methylenedioxymethamphetamine 500 MDMA Methylenedioxyamphetamine 500 MDA
Cannabinoids Tetrahydrocannabinol-carboxylic acid 15 THC Cocaine Metabolites Benzoylecgonine 100 Cocaine Phyencyclidine Phencyclidine 25 PCP Opiates Codeine/Morphine
Morphine 4000 Morphine Codeine 2000 Codeine 6-monoacetylmorphine 10 Heroin
Opiates 6-monacetylmorphine
6-monoacetylmorphine 10 Heroin
Opiates Oxycodone/ Oxymorphone
Oxycodone 100 Oxycodone Oxymorphone 100 Oxymorphone

Status of Drug Use in the DoD Personnel Fiscal Year 2010 Drug Testing Statistical Report
40
Appendix B
CM-1238-10 1 November 2010 MEMORANDUM FOR THE UNDER SECRETARY FOR PERSONNEL AND
READINESS
Subject: A Systems Approach to Drug Demand Reduction in the Force 1. This memorandum is in follow up to our ongoing discussions on suicide, deployment stress, and associated problems. I believe that drug abuse represents both a symptom and a problem that fuels the worsening of other conditions. After receiving multiple briefings from scientists and line leaders about a growing concern about drugs, I have come to the conclusion that reducing the use of illicit drugs, unprescribed pharmaceuticals, and excess alcohol requires an integrated approach. Senior military leaders have been aware of the acute need to gain better controls on the inappropriate use of drugs. However, until recently, we have been unaware of the hurdles faced by their subordinate commanders and by the DoD drug testing community. We realize that drug demand reduction operates within a larger system of readiness and is therefore of great importance to the Chiefs. 2. A number of drug testing and enforcement programs were started in the early 1980s in response to the realization that drug abuse was out of control and severely hindering readiness. By all accounts, these programs clearly had the intended effect of reducing drug abuse and giving commanders assurance that they had a sober and ready force. These programs focused on the detection of illicit drugs, and laboratory thresholds were set to detect at levels higher than expected for the simple casual user. With only minor changes, the testing programs we have today are very similar to those highly effective ones launched in the 1980s. 3. We are, however, facing a growing series of problems that risk making our drug testing paradigms ineffective. Despite growing concerns among commanders that drug use is a problem within the ranks, the DoD drug testing programs have remained at budget flat line for the past several years and are facing an estimated 11 million dollar shortfall. While the abuse of prescription drugs has grown substantially since the beginning of the wars, we have only been capable of testing a fraction of these compounds. The main DoD drug testing program is positioned under TMA while its budget is under OSD Policy (DASD Counternarcotics and Global Threats) within the Counternarcotics Central Transfer Account creating a dual loyalty conflict.
4. Compared to the 1980s, there has been a substantial reduction in commanders' willingness to take urinalysis positive individuals to adjudication. This was certainly a concern heard by VCSA Chiarelli during his visits to installations for a suicide prevention task force review. Commanders indicated the competing demands of filling ranks for deployment and removing drug using troops made random urinalysis untenable for many. Furthermore, the adjudication process is often long and is perceived to distract

Status of Drug Use in the DoD Personnel Fiscal Year 2010 Drug Testing Statistical Report
41
leaders from deployment specific tasks. Rising rates of legal narcotics prescriptions without a seamless capability to quickly verify the prescription means that these actually cloak the real extent of the problem. 5. Recommendations: a. Subsume the DoD drug testing efforts directly under Readiness and fully fund the
program to the required levels.
b. Complete the Prescription Drug Verification Portal (the portal that would allow drug testing labs to instantly verify narcotics prescriptions in the TRICARE database).
c. Make drug prosecution statistics part of regular unit readiness reporting. d. Designate several independent drug testing teams (similar to the approach used by the
UK MOD) as mobile units that can independently obtain specimens at random. This encourages commanders to remain compliant and introduces a new variable that is likely to improve deterrence.
e. Fund the expansion of drug testing to include the most common prescription drugs of
abuse (particularly benzodiazepines e.g. Valium, this is estimated by the Drug Demand Reduction Program Office to be a 20 million dollar shortfall).
f. Preface these changes with an announcement to the force encouraging drug
counseling and treatment 90 days prior to any launch of a new testing regimen. The objective of the program should be to drive inappropriate drug use to their lowest possible levels.
g. Regularly exchange information between the DoD Drug Demand Reduction Program
and the ongoing suicide prevention programs and the DoD Joint Pain Task Force.
M.G. MULLEN Admiral, U.S. Navy
Copy to: Chief of Staff, U.S. Army Chief of Naval Operations Chief of Staff, U.S. Air Force Commandant of the Marine Corps