status of copper and zinc levels throughout the kenai
TRANSCRIPT
Status of Copper and Zinc Levels Throughout the Kenai River Watershed
STATUS OF COPPER AND ZINC LEVELS THROUGHOUT THE KENAI
RIVER WATERSHED
4/29/2021
Prepared by the Kenai Watershed Forum for the Alaska Department of Environmental Conservation under ACWA grant 19-02, FAIN: 00J84604
Note: This project has been funded wholly or in part by the United States EPA under assistance agreement number (00J84604) to the Department of Environmental Conservation through the Alaska Clean Water Actions (ACWA) program. The contents of this document do not necessarily reflect the views and policies of the EPA, nor does the EPA endorse trade names or recommend the use of commercial product mentioned in this document.

Status of Copper and Zinc Levels Throughout the Kenai River Watershed
i
Prepared by: Benjamin Meyer Environmental Scientist Kenai Watershed Forum (907) 260-5449 x1207 www.kenaiwatershed.org The Kenai Watershed Forum (KWF) is a 501(c)(3) non-profit and is recognized as the regional watershed organization of the Kenai Peninsula, successfully identifying and addressing the environmental needs of the region by providing high quality education, restoration and research programs. KWF is a dynamic organization dedicated to protecting the streams, rivers, and surrounding communities on the Kenai Peninsula.
Status of Copper and Zinc Levels Throughout the Kenai River Watershed
ii
Contents LIST OF FIGURES ..................................................................................................................................... III
LIST OF TABLES ....................................................................................................................................... III
LIST OF ACRONYMS ............................................................................................................................... III
PURPOSE ................................................................................................................................................. 4
INTRODUCTION ...................................................................................................................................... 5
METHODS ................................................................................................................................................ 6 Copper and zinc sampling ................................................................................................................................................. 6
Kenai River Baseline Water Quality Monitoring (KRBWQM) ................................................................................ 6 Copper and zinc-specific sampling events .................................................................................................................. 7 Sample Accuracy and Precision ..................................................................................................................................... 7 2019 Hardness values ..................................................................................................................................................... 8
Mapping potential sources of copper and zinc ............................................................................................................ 8 Potential sources on the Kenai River ............................................................................................................................. 8 Potential sources throughout the Kenai River watershed ......................................................................................... 8
RESULTS ................................................................................................................................................... 9 Copper and zinc sampling ................................................................................................................................................. 9
Copper ................................................................................................................................................................................ 9 Zinc ....................................................................................................................................................................................... 9 Variation among replicate samples .......................................................................................................................... 10
Mapping potential sources of copper and zinc ......................................................................................................... 10 Potential sources on the Kenai River mainstem........................................................................................................ 10 Potential sources throughout the Kenai River watershed ...................................................................................... 10
DISCUSSION .......................................................................................................................................... 11 Copper and zinc sampling .............................................................................................................................................. 11
Copper ............................................................................................................................................................................. 11 Zinc .................................................................................................................................................................................... 12 Variation among replicate samples .......................................................................................................................... 12 Potential drivers of copper and zinc exceedances ................................................................................................ 12 Research recommendations ......................................................................................................................................... 13
CONCLUSION ........................................................................................................................................ 15 From information to action ........................................................................................................................................... 16
DATA AVAILABILITY ............................................................................................................................. 16
REFERENCES .......................................................................................................................................... 17
APPENDIX A: FIGURES .......................................................................................................................... 20
APPENDIX B: TABLES ............................................................................................................................. 27

Status of Copper and Zinc Levels Throughout the Kenai River Watershed
iii
LIST OF FIGURES Figure 1. Kenai River watershed and water quality monitoring site locations during biannual (2000 – present) KRBWQM sampling events. ........................................................................................................................ 20 Figure 2. 2019 - 2020 sampling locations .............................................................................................................. 21 Figure 3. Kenai River mainstem sites copper concentrations and criterion (CCC) values. ............................... 22 Figure 4. Kenai River tributary sites copper concentrations and criterion (CCC) values. ................................ 23 Figure 5. Kenai River mainstem sites zinc concentrations and criterion (CCC) values. ..................................... 24 Figure 6. Kenai River tributary sites zinc concentrations and criterion (CCC) values. ...................................... 25 Figure 7. Kenai River Mainstem and tributaries, dissolved copper and zinc sample results by year. .......... 26 LIST OF TABLES Table 1. Alaska Department of Environmental Conservation water quality standards and pertaining calculations ..................................................................................................................................................................... 27 Table 2. Sampling site coordinates. .......................................................................................................................... 28 Table 3. Instances where zinc and copper data differs from Paired calcium and magnesium data. .......... 29 Table 4. Copper and zinc levels and hardness-dependent criterion standards. .............................................. 30 Table 5. Relative difference levels (RPD) of duplicate samples by site and date. .......................................... 33
LIST OF ACRONYMS ADF&G - Alaska Department of Fish & Game ADEC - Alaska Department of Environmental Conservation CCC - Criterion Chronic Concentration CWA - Clean Water Act EPA - United States Environmental Protection Agency KPB - Kenai Peninsula Borough KPFHP - Kenai Peninsula Fish Habitat Partnership KRBWQM - Kenai River Baseline Water Quality Monitoring KRCMP - Kenai River Comprehensive Management Plan KRSMA - Kenai River Special Management Area KWF - Kenai Watershed Forum QAPP - Quality Assurance Project Plan RPD – Relative Percent Difference USFS - United States Forest Service USGS - United States Geological Survey

Status of Copper and Zinc Levels Throughout the Kenai River Watershed
4
PURPOSE This field report highlights efforts conducted to assess levels of copper and zinc, as well as to their potential sources in surface water throughout the Kenai River watershed. These efforts are intended to complement and respond to the literature review submitted to ADEC in 2017 by the Kenai Watershed Forum under ACWA grant 17-06 (Sires 2017b). This field report will address the following questions:
1. What are the copper and zinc levels at specific water monitoring locations throughout the Kenai River watershed during spring and summer 2019-2020 sampling events?
2. Where are elevated levels of copper and zinc occurring throughout the Kenai River watershed during spring and summer 2019-2020 sampling events?
3. What is the status of mapping efforts of potential copper and zinc sources on the Kenai River and throughout its watershed?

Status of Copper and Zinc Levels Throughout the Kenai River Watershed
5
INTRODUCTION The Kenai River is a glacially-fed system located on the Kenai Peninsula. This 82-mile (132 km) river begins at the outlet of Kenai Lake and flows into the Cook Inlet, a branch of the Gulf of Alaska. Due to its size, the Kenai River is generally divided into three sections: the upper river (Cooper Landing at river mile [RM] 82 to Skilak Lake at RM 65), middle river (RM 50 at the outlet of Skilak Lake to RM 21 in Soldotna at the Sterling Highway bridge), and lower river (RM 21 to RM 0 at the mouth in the city of Kenai) (USGS 2021b). Several major glacial and non-glacial tributaries flow into the Kenai River (Figure 1). The Kenai River watershed plays host to millions of Pacific salmon that utilize its waters for rearing and spawning habitat. These salmon are critical to Alaskan economy, recreation, and culture. As a result, the Kenai River watershed is a priority for conservation efforts, as it experiences significant anthropogenic pressures (Schoen et al. 2017). Over 20 years ago the Kenai Watershed Forum (KWF) identified a need for monitoring surface water quality parameters often influenced by development, impervious surfaces, boat use, and other sources. KWF established the Kenai River Baseline Water Quality Monitoring (KRBWQM) program in 2000 to track water quality changes over time. Twenty-two sites were chosen along the Kenai River mainstem and in its major tributaries with the intention of providing information on overall watershed conditions twice per year (Figure 1). Since inception a broad suite water quality parameters have been measured biannually including the metals copper, zinc, lead, arsenic, and others; nutrients such as phosphorus and nitrogen; hydrocarbon pollutants; fecal coliform bacteria; and intrinsic parameters such as pH, turbidity, conductance, and temperature. As a result of ongoing monitoring efforts, increases in copper and zinc concentrations at some sites in the lower river were identified from 2010 through 2014 relative to previous sampling years (Guerron Orejuela 2016; Sires 2017a), warranting further investigation and more intensive monitoring for these metals. Zinc and copper are elements with both natural and anthropogenic sources, and when present in aquatic environments at high levels these metals can potentially be of ecological concern (Skidmore 1964). Metals interacting with aquatic organisms often exhibit greatest toxicity when in the dissolved phase (Gerhardt 1993), and can have harmful effects on Pacific salmon and their habitat. Sublethal levels of dissolved copper commonly found in urban aquatic systems have been shown to disrupt salmonid olfactory function (Tierney et al. 2010), behavior (Goldstein et al. 1999; Scott and Sloman 2004), and survival (McIntyre et al. 2012), primarily in freshwater. Chinook salmon (Oncorhynchus tshawytscha) have shown increased susceptibility to mortality from elevated zinc levels during early life stages- a critical period of time in development (Chapman 1978). Effective toxicity of dissolved metals varies with environmental conditions, particularly water hardness. Hardness is used to calculate aquatic toxicity criteria for many dissolved metals because magnesium and calcium compete for metals binding sites on the fish gill (Galvez 1998). Copper and zinc exceedances are identified when their levels are compared to a hardness-dependent freshwater criterion chronic concentration (CCC), which varies with calcium and magnesium concentration (Table 1) (ADEC 2008). Through grant funds provided through the Alaska Department of Environmental Conservation (ADEC) and matching funds from KWF, KWF identified four tributary and three mainstem sites in addition to the standard biannual KRBWQM sampling sites throughout the Kenai River watershed for supplemental sampling in the springs and summers of 2019-2020 (Figure 2). This report presents results the supplemental sampling events in tandem with results from the biannual KRBWQM events in 2019-2020. Additional efforts to identify potential sources of copper and zinc throughout the Kenai River watershed were initiated in 2019-2020 and are reported here. These efforts included a fieldwork component in which five river trips were conducted in order to photograph potential zinc and copper sources visible

Status of Copper and Zinc Levels Throughout the Kenai River Watershed
6
from the Kenai River mainstem. Photos from these trips were incorporated into a GIS shapefile established to document adjacent potential sources of these heavy metals including impervious surfaces, boat landings, and wastewater discharge. In addition to KWF’s field imagery, St. Mary’s University of Minnesota Geospatial Services was contracted to develop a draft ArcGIS database of sources potentially related to copper and zinc pollution. The geodatabase is intended to be of use in future monitoring efforts and potentially in the production of a future decision support tool.
METHODS
Copper and zinc sampling Water quality sampling efforts for dissolved copper and zinc in 2019-2020 targeted sites that have been monitored biannually since the year 2000 as part of the Kenai River Baseline Water Quality Monitoring (KRBWQM) project, as well as new additional sites targeted to explore spatial trends in dissolved copper and zinc concentrations (referred to here on as “copper and zinc-specific sampling events.” In total, these sites comprise ten sites on the Kenai River mainstem and nine tributary sites (Figure 1). Note: all river miles listed throughout document are in reference to the Kenai River mainstem. River miles listed for tributaries reference their confluence river mile on the mainstem of the Kenai River. Sampling site names were chosen based on sampling location; their corresponding river miles can be found in Table 4. Kenai River Baseline Water Quality Monitoring (KRBWQM) Kenai Watershed Forum conducted biannual KRBWQM events in 2019 and 2020. Sampling events are of a cooperative nature and require the participation and/or financial contributions of several agencies and organizations including:
• Alaska Department of Fish and Game • City of Kenai • City of Soldotna • Cook Inlet Aquaculture Association • Alaska Department of Environmental Conservation • Alaska Department of Natural Resources • Kenai Peninsula Borough • Kenai Watershed Forum • United States Fish and Wildlife Service • United States Forest Service • Local Kenai Peninsula volunteers
Due to logistical and safety constraints as a result of the COVID-19 pandemic, spring KRBWQM sampling did not occur in spring 2020. The twenty-two sites in the KRBWQM sampling program were originally selected to represent the Kenai River watershed's ambient water quality conditions. Samples in 2019-2020 were analyzed for hydrocarbons, total suspended solids, phosphorus and nitrogen, fecal coliform, and metals (total and dissolved). Values reported in this document include concentrations of dissolved copper, zinc, magnesium, and calcium. Sample locations for the selection of data included in this report are presented in Table 2,

Status of Copper and Zinc Levels Throughout the Kenai River Watershed
7
and sample dates are included in Table 4. After a training session, sampling participants were split into small groups and sampled 2-5 sites by foot or boat. Sample collection timing coincided with an outgoing tide to reduce potential saltwater contamination of samples in the lower river. Individuals collecting samples by foot waded into the water until the water depth was approximately two feet and the participant was offshore in flowing water while still maintaining personal safety. For sites accessed by boats, water samples were taken from the bow while the boat faced upstream. Prior to sampling, all bottles were labeled with site and river mile; sampling team name; date and time; and parameter. Samples were collected by facing upstream, wearing clean gloves, removing the bottle seal, inverting the bottle and plunging it approximately one foot below the water surface. The bottle was then turned 90 degrees to allow water to fill at that depth. All bottles were stored in insulated coolers with ice packs to keep at 4ºC and shipped via Grant Aviation to Anchorage. They were retrieved and analyzed by SGS North American, Inc (Anchorage, AK) within the holding time of each sample. Copper and zinc analyses were performed by SGS in Anchorage, while calcium and magnesium analyses were performed by ALS Environmental of Kelso, WA. These procedures follow the protocols established in a Quality Assurance Project Plan (QAPP) originally approved by ADEC in 2001, later revised and approved by ADEC again in 2013 and 2019 (ADEC 2020a). Parameter values were reported digitally; data entry and management was done in Microsoft Excel and R (R Core Team 2021). Hardness and hardness-dependent freshwater CCC criteria were calculated using ADEC-provided equations shown in Table 1(ADEC 2008). KRBWQM data from 2019-2020 described in this report includes all mainstem and tributary sites including and below river mile 23 (Swiftwater Park), as well as data from sites at the outlet of Skilak Lake and Jim’s Landing, which are included as reference sites presumed to have chemical water quality parameters minimally affected by anthropogenic influence. Further details on historical KRBWQM results and protocols can be found in the project’s most recent summary report (Guerron Orejuela 2016). Copper and zinc-specific sampling events In addition to the long-running biannual KRBWQM sampling events, in 2019 and 2020 KWF staff and volunteers also conducted water quality sampling specifically focused on dissolved copper and zinc concentrations. Sites for these sampling events included four sites in the upper reaches of tributaries and three mainstem Kenai River locations not regularly targeted in previous years (Figure 2). Tributary sites were selected based on their historically-elevated levels of copper and/or zinc (Sires 2017b) as well as their location above most potential anthropogenic influence. On the Kenai River mainstem, the Slikok Creek confluence site was chosen in order to compare the levels of copper and zinc found in the mainstem to those within the Slikok Creek tributary. The Skilak Lake outlet and Jim's Landing sites were chosen as control sites as they are located upstream of the majority of development along the Kenai River and would provide relative background levels away from most anthropogenic influence. Jim's Landing is a designated boat launch utilized solely by recreationists using drift-only (non-motorized) boats. All sampling procedures aligned with the ADEC-approved 2019 Quality Assurance Project Plan (KWF, 2019). Results for copper, zinc, calcium, and magnesium concentrations were reported digitally; data entry and management was done in Microsoft Excel and R Studio. Hardness and freshwater CCC values were calculated using ADEC-provided equations shown in Table 1(ADEC 2008). Sample Accuracy and Precision To explore the degree to which an individual grab sample is representative of dissolved copper and zinc

Status of Copper and Zinc Levels Throughout the Kenai River Watershed
8
concentrations, a total of fifteen replicate samples were collected and analyzed from sampling events in 2019-2020. Replicate samples were collected by the same personnel, with identical technique, within five minutes of each other. Relative percent difference (RPD) between replicates was calculated from the resulting values of each metal analyzed and described in context of the QAPP data quality objectives. 2019 Hardness values As standard practice, zinc and copper data is synchronous in space and time with paired calcium and magnesium data used to calculate hardness and associated CCC values. However, for a total of five sites in two sampling events (May 22, 2019 and July 24, 2019), calcium and magnesium data was not available. Thus for these events, CCC criteria were instead calculated using calcium and magnesium results obtained from other sampling events with closest spatial and temporal proximity (see Table 3 for details).
Mapping potential sources of copper and zinc Potential sources on the Kenai River Throughout the summer of 2019, five photography trips were conducted by raft or motorboat along all sections of the Kenai River main stem to document parcels containing potential copper and zinc sources. This task was completed using Ricoh WG-6 digital cameras, which were equipped with GPS and aspect functionality. Two photographers took photos of each parcel with a potential metal source; one photographer was assigned the river-right (RR) bank while the other was assigned the river-left (RL) bank. Photos were taken directly out from the potential source, perpendicular to the bank of the river. Side channels diverting from the mainstem of the Kenai River were floated or boated as well. The geotagged photos are intended to serve as a reference for future work to identify locations and assess potential sources of copper and zinc in greater detail, and also serve as an archival set of observations to compare future photo transects. Potential sources throughout the Kenai River watershed A literature review conducted by KWF in 2017 (Sires 2017b) identified potential sources of copper and zinc throughout the Kenai River watershed, which can be described generally as contributors common to watersheds containing urban and suburban environments (Matthiessen et al. 1999). Potential sources of copper included brake pads/vehicles, pesticides/herbicides, roofing/metal plating, mining activity, boat hull coatings/anti-fouling agents, municipal wastewater discharge, natural mineral deposits, forest fires, air emissions, and decking/pilings. Similarly, potential zinc sources included galvanized metals, tire wear, motor oil/hydraulic fluid, fertilizer/pesticides/fungicides, natural mineral deposits, mining activity, forest fires, and brakes. Using results from the literature review, KWF contracted with St. Mary’s University Geospatial (Winona, MN) to curate and prepare all available regional geospatial data potentially related to nonpoint sources of copper and zinc. All layers found were converted to a consistent projection and geodatabase format so that they may be integrated into a single map. Additionally, gaps in geospatial data availability that would likely be needed to fully assess copper and zinc sources were identified in the report.
Status of Copper and Zinc Levels Throughout the Kenai River Watershed
9
RESULTS
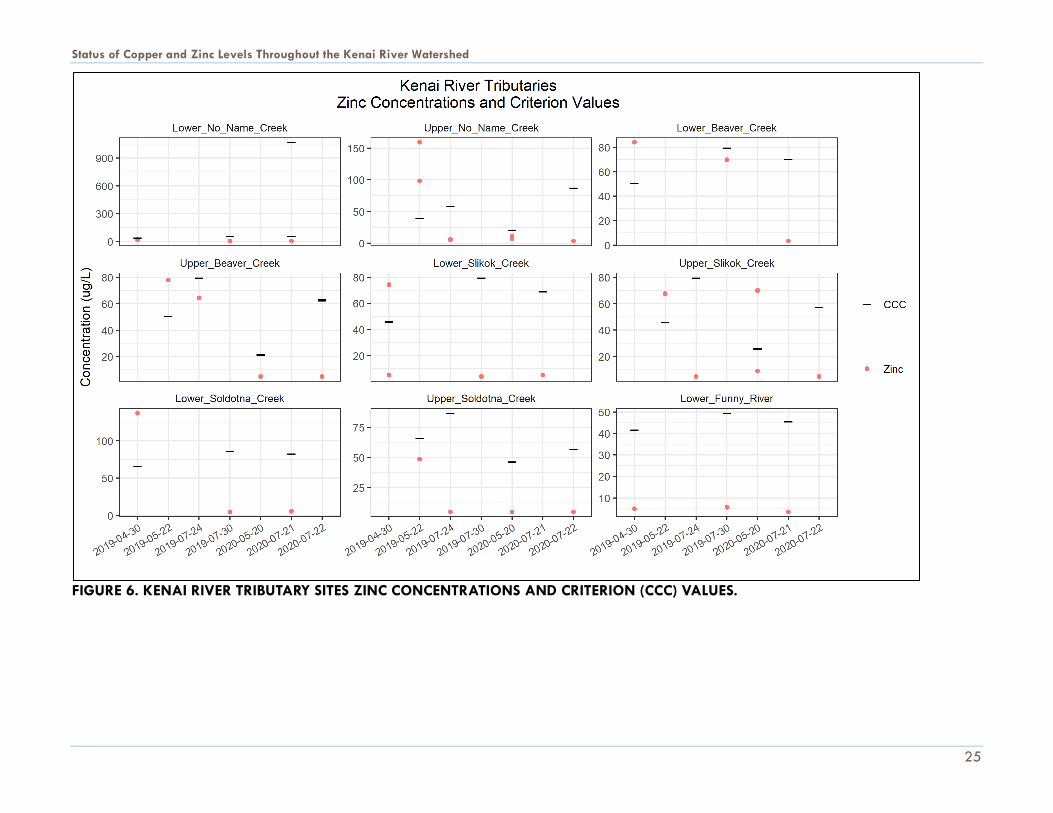
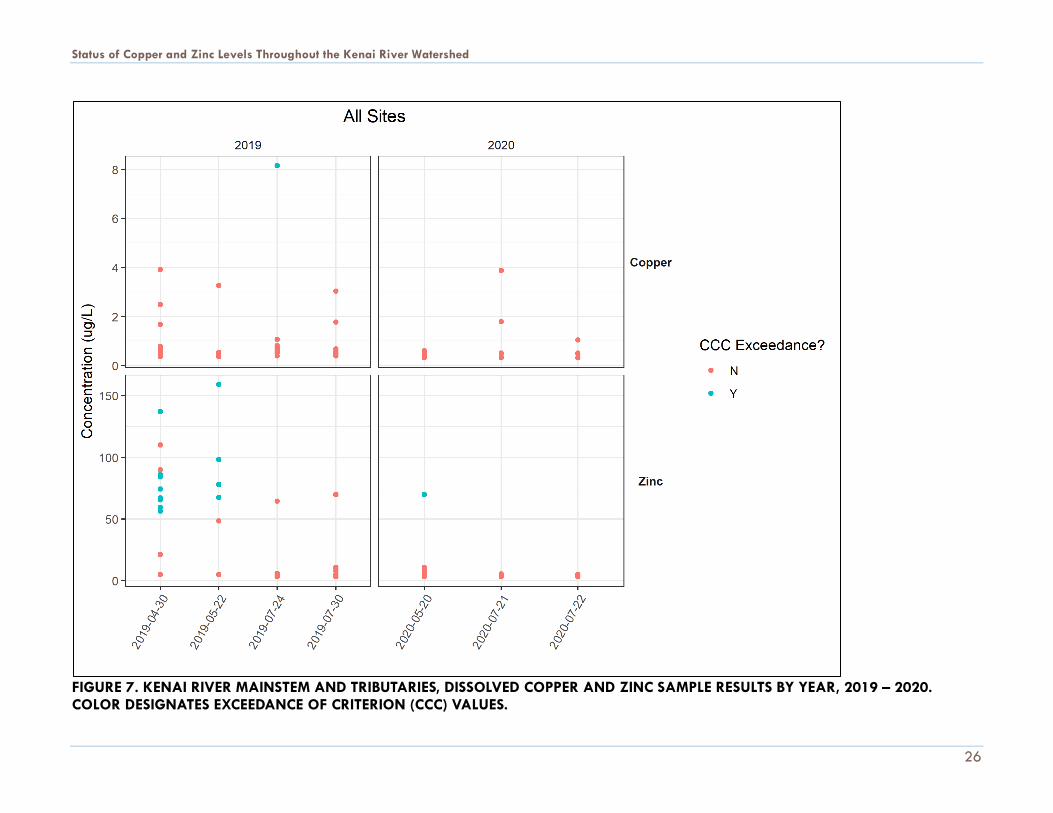
Copper and zinc sampling Note: all metals results are reported as dissolved metal concentrations. Copper Copper levels ranged from a low of undetected to one value that was above the CCC (criterion chronic concentration) value (Figure 3 and Figure 4). The highest observation of 8.16 ug/L was observed in the Kenai River mainstem at the Slikok Creek Confluence on July 24, 2019. It should be noted that the associated CCC value for this sampling event was based on hardness data from another nearby 2019 sampling event on the main stem Kenai River (see Table 3), thus the observation could be indicated as a potential, but unconfirmed, exceedance (see “Copper” in the Discussion section for further consideration). The second greatest copper concentration in the data set, 3.91 µg/L, was observed at Upper Beaver Creek tributary on April 30, 2019, with other elevated observations also made at the City of Kenai Docks (July 21, 2020) and Upper No Name Creek sites (May 22, 2019). Hardness-dependent freshwater CCC criteria for copper ranged from a low of 2.31 µg/L (various sites) to a high of 121.31 µg/L at No Name Creek (July 21, 2020) (Table 2). No confirmed copper exceedances of CCC values were observed during any of the sampling events in 2019-2020. Among all tributary and mainstem sites, the highest copper values observed were in the lower Kenai River region, closer to the developed Kenai/Soldotna area. Copper values > 2.5 µg/L were observed at the City of Kenai Docks mainstem site, in No Name Creek, and in Beaver Creek. All other copper values in the 2019-2020 dataset were below 2.5 µg/L. Zinc Zinc values ranged from a low of undetected to a high of 159.0 µg/L in Upper No Name creek on May 22, 2019 (Figure 5 and Figure 6). Hardness-dependent CCC values for zinc ranged from a low of 21.1 µg/L in Upper No Name Creek on May 20, 2020 to a high of 315.8 µg/L on April 20, 2019 at the City of Kenai Docks. Additionally, two observed zinc CCC values are atypical of historical data:
• Zinc CCC = 1069 µg/L at Lower No Name on July 21, 2020 (Zinc CCC range at this site, 2000 – 2018, is 3.25 – 42.25 µg/L)
• Zinc CCC = 628 µg/L at City of Kenai Docks on April 30, 2019 (Zinc CCC range at this site, 2014 – 2018, is 8.40 – 342.50 µg/L).
Although an exploratory analysis of hardness data 2000 – 2018 indicates possible evidence of marine influence at these sites (Meyer 2021b), the values listed above are still several multiples above the range of those observed 2000- 2018 and are therefore presumed unlikely to be representative of actual conditions. Zinc exceedances of CCC criterion values were observed for a total of twelve samples. Zinc exceedances were observed at tributary sites including Upper No Name Creek, Lower Beaver Creek, Upper Beaver Creek, Lower Slikok Creek, Upper Slikok Creek, and Lower Soldotna Creek (Figure 5). Zinc exceedances in mainstem sites were observed at Cunningham Park, Upstream of Beaver Creek, Pillars, Soldotna Bridge, and Swiftwater Park (Figure 6).

Status of Copper and Zinc Levels Throughout the Kenai River Watershed
10
As with copper, elevated zinc values were observed solely in closer proximity to the developed Kenai/Soldotna area. Zinc exceedances were not observed at the minimally anthropogenically-influenced sites of Jim’s Landing, Skilak Lake Outlet, or Lower Funny River. In the mainstem Kenai River sites, all zinc exceedances observed occurred during the April 30, 2019 sampling event, whereas timing of zinc exceedances in the tributary sites were variable and do not follow a visibly evident pattern. Variation among replicate samples A total of fifteen unique samples had paired copper and zinc replicate samples, from ten unique sites and seven unique dates. A relative percent difference of > 20% among replicate samples was observed in eleven out of thirty values, ranging from 0% - 175% (Table 5), with a mean difference of 38.9 ±13.6% (mean ± standard error) for copper and 34.8 ± 14.3% for zinc. The QAPP (ADEC 2020a) set a relative percent difference threshold for replicate samples of 20%, indicating that these eleven samples did not meet data quality objectives and the results should be flagged, interpreted conservatively, or not included in calculations of summary values (see Discussion).
Mapping potential sources of copper and zinc Potential sources on the Kenai River mainstem In total, 932 photos were taken of river-right parcels and 899 photos of river-left parcels with potential copper and zinc sources. These photos were imported into ESRI’s ArcMap GIS 10.8.1 (ESRI 2020) program and converted to a points shape file. Photos included locations with elevated, light-penetrating walkways; building roofs; impervious surfaces such as roads and parking lots; significant bank erosion; boat launches; bridges; and RV parks. The shape file of geotagged photos is intended to serve as an archival document of potential sources of copper and zinc pollution, and may be useful to compare to similar transects in future years. The photos shape file may be particularly useful in the context of the additional GIS products described below. Potential sources throughout the Kenai River watershed The report from St. Mary’s University of Minnesota Geospatial Services (Robertson et al. 2020), titled, “Kenai River Heavy Metal Pollution Source Data Mining Exercise for the Kenai Watershed Forum: Main Kenai River System”, describes and curates a collection of fourteen data sources potentially useful for identifying sources of zinc and copper pollution. Listed below are all relevant geospatial datasets that were prepared in the report, including:
• Traffic Counts • Bridges, Gates, Culverts • Digital Raster Graphics • Facilities • Fire Locations • Fire Perimeters • Land Cover • Material Sites • Mining Claims

Status of Copper and Zinc Levels Throughout the Kenai River Watershed
11
• Oil and Gas leases • Parcel Boundaries • Railroads • Waterways • Wells
Staff rom Kenai Watershed Forum additionally included and prepared the following map layers:
• National Hydrography Dataset (USGS 2021b) • Transportation Junctions • Roads • River miles of the main stem Kenai River and major tributaries
The above datasets were compiled into ArcGIS file geodatabases provided to ADEC on an external hard drive, and contain potentially relevant information about heavy metal nonpoint pollution sources. Each geodatabase’s download metadata was recorded in an Excel spreadsheet table identifying a link, date of creation, type of potential pollution source, and if the source covers the entire study area. Original datasets were maintained in their native extent in order to encompass all tributaries transporting water into the Kenai River main stem. Geospatial data gaps were also identified in the Robertson et al. 2020 report, and included the following:
• Impervious surfaces • Galvanized metal surfaces • Natural mineral deposits • Snow storage locations • Storm water drainage systems
Additional geospatial data gaps suggested by Kenai Watershed Forum staff include:
• Results from boat count surveys • Fish habitat information
DISCUSSION
Copper and zinc sampling Copper No confirmed copper exceedances of hardness-dependent toxicity criteria were observed throughout the 2019-2020 sampling events. The most elevated copper value (8.16 ug/L) was observed on July 24, 2019 in the Kenai River mainstem at the Slikok Creek confluence and was above the chronic concentration criteria (CCC) of 4.55 ug/L (Table 4). Due to the proximity of potential anthropogenic sources in Slikok Creek, this observation suggests that further monitoring is warranted, including longitudinal survey(s) along with examination of potential point sources. However because the calcium and magnesium data used to generate the CCC value is asynchronyous from the copper/zinc sampling event (Table 3) the
Status of Copper and Zinc Levels Throughout the Kenai River Watershed
12
exceedance is not considered confirmed. Other elevated copper samples include those from Upper No Name creek and Lower Beaver Creek during spring 2019, possibly the product of the rapid flush of nutrients and sediment associated with the spring snow melt freshet (USGS 2019). Other elevated copper samples were also observed at the City of Kenai Docks sites on July 24, 2019 and July 21, 2020. While diagnosing specific source locations of copper was not part of this analysis, creosote pilings such as those sometimes used in dock construction are known sources of copper (EPA 2015). Zinc Zinc exceedances of hardness-dependent CCC values were observed at several sampling locations in 2019-2020, including six of nine tributary sites and five of ten mainstem sites. Zinc exceedances suggested a spatial trend. Exceedances were observed primarily in the lower and estuary sections of the Kenai River (river mile 0 to 23, Figure 1), the segment of river that flows through the highest concentration of development within the Kenai River watershed, while no exceedances were observed at Jim’s Landing, Skilak Lake Outlet, or Lower Funny River, sites which have minimal potential for anthropogenic influence. The sampling event on April 30, 2019, where zinc exceedances were simultaneously observed at three tributary and five main stem sites (Figures 5, 6, and 7), could suggest a region-wide meteorological process such as snowmelt or precipitation that helps to drive the elevated concentrations and warrants further investigation. Variation among replicate samples The project QAPP (ADEC 2020a) requires data verification by examining variation among replicate samples compared to the designated samples and calculating the relative percent difference. In 2019-2020, outcomes revealed that data from some instantaneous grab samples do not meet data quality objectives defined for this project (< 20% RPD) and should not yet be employed to make management decisions. The average difference between replicates for both copper and zinc was in the range of ±35% (Table 5). In two of the fifteen replicate zinc values (Lower Slikok Creek April 30, 2019 and Upper Slikok Creek May 20, 2020), one replicate was above the zinc CCC threshold while the other was below (Figure 6). The issue of sample precision could be addressed with several approaches, some which would involve modifying field and lab protocol and others that would not. One suggestion is to interpret and present CCC thresholds in future analyses in such a way that accounts for the inherent variation of instantaneous grab samples, assigning an error range to each copper and zinc result based on all replicate data available from 2000 – 2020. Current ADEC water quality criteria for copper and zinc do not incorporate error ranges into interpretation of sample values, thus this suggestion would involve modifying regulatory language. Additionally or alternatively, future field efforts may modify field and lab protocol to increase accuracy and precision. Further literature review of how other similar agencies and institutions nationwide have addressed this issue and consultation with other local experts may yield additional solutions and resulting modifications to the quality assurance plan. Potential drivers of copper and zinc exceedances Some examination of trends in metals concentrations in the Kenai River watershed (Guerron Orejuela 2016) and their probable sources (Sires 2017a) has been previously conducted, revealing more frequent

Status of Copper and Zinc Levels Throughout the Kenai River Watershed
13
exceedances in the lower river section relative to the middle and upper sections. However, a conclusive analysis of which factors drive likelihood of toxicity criteria exceedance has yet to be performed. Such an analysis could leverage the uniquely robust twenty-year biannual Kenai River Baseline Water Quality Monitoring data set available through the Water Quality Portal (EPA 2021), along with other detailed meteorological, geographical, and biological data available for the region (EPSCoR 2020). A variety of geographical as well as hydrological factors drive likelihood of water to exceed metals toxicity criteria. Geographical factors may include characteristics such as watershed size, percent of watershed impermeable area, watershed slope, local geological characteristics, quantity of upstream point sources, presence of manmade storm water drainage conveyance structures, and others. Hydrological factors may include precipitation pattern prior to sample date, stream flow volume, annual winter precipitation, and velocity of spring melt conditions. If conducted, results of a multivariate regression approach to conclusively identify predictors of exceedances could allow conservation-minded land owners and managers to most effectively identify locations and/or time periods where mitigation actions will be most effective. Once specific drivers of metals exceedances are identified, managers could work with members of area partnerships to develop site-specific mitigation plans involving strategic solutions such as phytoremediation tactics, riparian restoration efforts, strategic development, wetland preservation, and watershed user and landowner education (Liptan and Santen 2017). Some drivers of exceedances are suggested for 2019-2020 data without the more detailed approach previously discussed. For example, the annual spring melt event (USGS 2019) likely represents an important driver of timing of elevated metals concentrations in spring (e.g. Figure 7), because the meltwater contains months of particulate accumulation collected throughout the winter months (Gouin et al. 2010; Blecken et al. 2012). Additionally, a period of precipitation following a long drought in summer may also be a driver of spikes in metals concentrations, as accumulated particles are flushed into the watershed (Prestes et al. 2006; Lau et al. 2009; Schiff and Tiefenthaler 2011). Research recommendations The results described in this work highlights the strengths and limitations of how instantaneous grab sample data may be applied towards understanding water quality in broader extents of space and time in the Kenai River watershed. Along with other efforts to synthesize and apply the region’s long-term water quality data (Guerron Orejuela 2017), the results support growing evidence of elevated dissolved zinc and copper levels in limited parts of the lower Kenai River watershed region. While the specific factors most responsible for these elevated levels have yet to be fully elucidated, the present study indicates the need for proactive solutions directed towards a.) sampling methodology and interpretation, and b.) applying spatially explicit data to help choose where storm water infrastructure improvements will be most valuable.
Sampling Methodology As described in the results section, the mean percent difference between replicate samples did not meet data quality objectives in the project’s quality assurance plan, indicating a need to investigate ways to ensure that sampling protocols can satisfy data quality objectives in the future. A suggested course of action to address this issue could include a.) reviewing all available KRBWQM replicate sample data from year 2000 – present for spatial and temporal patterns in level of replicate sample variation, and b.) performing a literature review to examine successful methods of how this issue has been addressed in other research and monitoring programs. One additional aspect of the exceedances observed in this study that the current dataset is unable to

Status of Copper and Zinc Levels Throughout the Kenai River Watershed
14
address is the temporal duration of identified exceedances. It is unclear if the grab samples measured during typical sampling procedures represent concentrations that persist for hours, days, or weeks. In order to identify the typical duration of exceedances in watersheds where they are known to occur, it is advisable that metals are monitored throughout an expanded one-year period on a more frequent basis. For example, weekly or bi-weekly monitoring at select sites in the lower watershed region could help to pinpoint temporal drivers of exceedances. The most appropriate site for this expanded monitoring could be identified as those sites which have seen most frequent exceedances throughout the duration of monitoring from 2000 – present. Applying new field sampling techniques could also offer improvements in data quantity, quality, and project cost. For example, some recent evidence indicates conductance (total dissolved ions), which may be continuously monitored with sondes (e.g. Hydrolab), might serve as a proxy for metals concentrations (Morel et al. 2020). A field sampling program employing both traditional grab samples and continuously deployed sondes could provide insight as to which method is most economical and appropriate for long term monitoring efforts. Finally, new knowledge of the characteristics and effects of urban runoff pollution on freshwater aquatic communities are continuously being discovered (Tian et al. 2020), thus regular assessment of water quality monitoring priorities based on updated knowledge is critical.
Applying Data to Prioritize Potential Sites for Storm water Infrastructure Improvement Examination of the long-term Kenai River water quality dataset (2000 – present), as recommended in recent Alaska Department of Environmental Conservation strategy documents (ADEC 2020b) (section 2.4), could reveal if the trends in rising zinc and copper levels at some sites identified from 2010 – 2014 (Guerron Orejuela 2016; Sires 2017b) have changed since the trend was identified. Additionally, a variety of storm water interventions have been applied throughout the lower Kenai River basin to reduce the impact of urban runoff, including sedimentation basins, diffuser outfalls, and rain gardens (City of Soldotna 2016). An examination of the location(s) and installation dates of these interventions and downstream water quality might help reveal if they have been effective in reducing pollutant concentrations. Should an examination of the full temporal extent of copper and zinc data indicate continuing exceedances, the need grows to prioritize locations for potential interventions for both source reduction and runoff mitigation. One approach for this procedure could include a GIS mapping exercise employing both the water quality and geospatial data products described in this report. Generally, this work would consist of 1.) addressing data gaps identified in the mapping results section and 2.) once data gaps are addressed, applying all appropriate geospatial and water quality data towards a spatially explicit model that identifies likelihood of toxicity exceedance within individual HUC12 units (smallest mapped sub-watershed size) in the Lower Kenai River region. At a basic level, a map visualization with HUC 12 units color-coded to indicate numerical count of the total number of potential sources within each could offer a rough visualization of how density of potential sources varies across the landscape. A visual examination of how the pattern of these sources relates to observed trends in zinc and copper from 2000 - present may reveal general areas most appropriate for potential interventions. A more complex approach could include applying an existing watershed model such as SPARROW (SPAtially Referenced Regression On Watershed attributes) (USGS 2021a) to interpolate spatially limited water quality data over a broad geographical area. The intended output of this or another similar model would incorporate geographical and hydrological factors that can affect contaminant loadings, and offer a substantially more robust prioritization tool. After identifying the most relevant sub-watersheds for potential interventions, economic and logistical considerations would ultimately determine which projects are initially feasible.
Status of Copper and Zinc Levels Throughout the Kenai River Watershed
15
Addressing the identified geospatial data gaps would require varying levels of effort for each type. For example, creation of an impervious surfaces layer would involve substantial efforts in heads-up digitizing and ground-truthing fieldwork of impervious surfaces, while including a stormwater facilities map may involve merely digitizing existing data (City of Soldotna 2016) to a geodatabase format. Additionally, if the geospatial products described in this report prove useful in identifying potential pollutant sources, it is recommended that they be updated every five to ten years to account for development and landscape change (EPSCoR 2016). Regarding the photos shapefile of potential sources on the main stem Kenai River generated in this project, use of satellite or drone imagery is a potential avenue for acquiring future images against which to compare past observations. CONCLUSION This document is intended as a draft report addressing the findings from compiled copper and zinc data gathered during April, May, and July sampling events in 2019-2020. While the data collected throughout this study will provide further insight into the current sources and levels of copper and zinc throughout the Kenai River watershed, much of the temporal variation and point sources of these heavy metals remains to be characterized. As a result, the following preliminary study expansions are advised:
1. Perform a basic exploratory data analysis to summarize all available water quality data from 2000 – 2020 and apply results
a. Ensure all data 2000 - present is archived and available for public access through the EPA water quality portal (Meyer 2021a).
b. Examine site-specific trends from 2000 – 2020 to identify spatial and temporal predictors of copper and zinc exceedance
c. Using the identified predictors, choose a subset of watersheds where mitigation actions may be potentially feasible and appropriate
d. Implement restoration and other mitigation efforts in tandem with local partnerships 2. Expand copper and zinc sampling study through increased sampling of Kenai River
mainstem and tributary sites a. Assess fluctuations in copper and zinc levels over the period of one year, particularly at
sites that saw exceedances: i. Tributaries: No Name Creek, Beaver Creek, Slikok Creek, Soldotna Creek ii. Mainstem: from Cunningham Park (RM 6.5) to Swiftwater Park (RM 23)
b. Expand sampling efforts along longitudinal transects in tributaries experiencing exceedances in order to identify areas of concern within each tributary
c. Perform opportunistic sampling at known and suspected discrete sources before, during, and after select precipitation and melt events, at locations that may include storm water outfalls, road crossings, and outlets draining large impervious surfaces.
d. Perform literature review on the topics of sample precision, monitoring for predicted effects of runoff pollution on aquatic organisms, and bioaccumulation of copper and zinc in salmonids and other fishes.
3. Track changes in development throughout the Kenai River watershed to address anthropogenic impact over time
a. Conduct Kenai River photography trips every 5-10 years b. Monitor new development over time in order to conduct annual updates of mapping tool
4. Expand awareness of educational programs for local landowners and watershed user groups including topics such as responsible river use and effective property restoration projects
The Kenai River watershed boasts one of the longest term water quality datasets in the state of Alaska;
Status of Copper and Zinc Levels Throughout the Kenai River Watershed
16
an invaluable resource showing varying levels of copper and zinc that warrant further investigation in order to apply effective solutions. From information to action As stream-adjacent development and subsequent development pressures increase along the Kenai River mainstem and its tributaries (Schoen et al. 2017), study expansion remains a critical step that would lead to effective, strategic mitigation efforts throughout this highly-revered watershed. However, the knowledge gained from the study expansion will have utility only if successful, feasible mitigation strategies can also be demonstrated. A pilot project to install proven green infrastructure that filters many pollutants of concern would be a substantive step towards more widespread community adoption. Visible, proven success stories will encourage land managers and property owners to adopt green infrastructure practices both in mitigation actions and in new designs (City of Homer 2020). Such actions are in alignment with goals outlined in section 4.1in the City of Soldotna 2015 Soldotna Drainage Master Plan:
“Use public facility development and operations to model sustainable design techniques, such as using green areas along roads for stormwater detention and treatment, maximizing retention of native vegetation, reducing the impermeable footprint of new development…” (City of Soldotna 2016).
Specifically, opportunistic monitoring could be performed below known sources or sources of untreated storm water outfall (ADEC, 2011) before, during, and after installation of mitigating infrastructure such as sedimentation basins, diffuser outfalls, rain gardens, bio-swales, or stream bank revegetation. While the study expansions described will help better define the most ecologically significant metals pollution exceedances, even prior to having its results and conclusions, streams may be targeted for mitigation wherever cooperative landowners are willing. DATA AVAILABILITY All data and analysis used to generate this report is available at https://github.com/Kenai-Watershed-Forum/KWF_Metals_2019_2020.
Status of Copper and Zinc Levels Throughout the Kenai River Watershed
17
REFERENCES ADEC. 2008. Alaska Water Quality Criteria Manual for Toxic and Other Deleterious Organic and
Inorganic Substances. Available from https://dec.alaska.gov/media/11546/alaska-water-quality-criteria-manual-for-toxic-and-other-deleterious-organic-and-inorganic-substances.pdf.
ADEC. 2020a. Kenai River Water Quality Monitoring; Multi-Agency Baseline and Metals (Zn/Cu). Available from https://github.com/Kenai-Watershed-Forum/KWF_Metals_2019_2020/blob/main/documents/references/QAPP-2020-KenaiRiverWatershed_ZnCu_FINAL.pdf.
ADEC. 2020b. Alaska Nonpoint Source Water Pollution Prevention and Restoration Strategy. Alaska Department of Environmental Conservation. Available from https://dec.alaska.gov/water/nonpoint-source-control/.
Blecken, G.-T., Rentz, R., Malmgren, C., Öhlander, B., and Viklander, M. 2012. Stormwater impact on urban waterways in a cold climate: variations in sediment metal concentrations due to untreated snowmelt discharge. J. Soils Sediments 12(5): 758–773.
Chapman, G.A. 1978. Toxicities of cadmium, copper, and zinc to four juvenile stages of Chinook salmon and Steelhead. Trans. Am. Fish. Soc. 107(6): 841–847. Wiley.
City of Homer. 2020. Green Infrastructure Planning for the City of Homer. Available from https://arcg.is/184vCy [accessed 16 April 2021].
City of Soldotna. 2016. 2015 Drainage Master Plan. Available from https://www.soldotna.org/home/showpublisheddocument?id=5397.
EPA. 2015, October 9. Overview of wood preservative chemicals. Available from https://www.epa.gov/ingredients-used-pesticide-products/overview-wood-preservative-chemicals [accessed 16 April 2021].
EPA. 2021. National Water Quality Monitoring Council. Available from https://www.waterqualitydata.us/ [accessed 2 May 2021].
EPSCoR. 2016. Developed area change near Kenai and Soldotna, 1950 - 2013. Available from https://ak-nsf-epscor.github.io/kenai-change/kenaiDevelChange.html [accessed 1 May 2021].
EPSCoR. 2020. Datasets - Alaska EPSCoR Central Portal. Available from https://catalog.epscor.alaska.edu/dataset [accessed 15 April 2021].
ESRI. 2020. ArcMap 10.8.1. Redlands, CA. Galvez, F. 1998. Zinc binding to the gills of rainbow trout: the effect of long-term exposure to sublethal
zinc. J. Fish Biol. 52(6): 1089–1104. Wiley. Gerhardt, A. 1993. Review of Impact of Heavy Metals on Stream Invertebrates with Special Emphasis on
Acid Conditions. ” Water, Air, and Soil Pollution 66(3): 289–314. Goldstein, J.N., Woodward, D.F., and Farag, A.M. 1999. Movements of Adult Chinook Salmon during
Spawning Migration in a Metals-Contaminated System, Coeur d’Alene River, Idaho. Trans. Am. Fish. Soc. 128(1): 121–129. Taylor & Francis.
Gouin, T., Wilkinson, D., Hummel, S., Meyer, B., and Culley, A. 2010. Polycyclic aromatic hydrocarbons in air and snow from Fairbanks, Alaska. Atmos. Pollut. Res. 1(1): 9–15.
Guerron Orejuela, E. 2016. Water Quality Assessment of the Kenai River Watershed from July 2000 to July 2014. Kenai Watershed Forum. Available from https://dec.alaska.gov/media/16756/kenai-river-baseline-monitoring-report-final-zncuappendix.pdf.
Guerron Orejuela, E.J. 2017, May 4. Water Quality in Alaska’s Kenai River, United States of America; Past, Present and Future. M.S., University of Salzburg. Available from http://unigis.sbg.ac.at/files/Mastertheses/Full/103370.pdf.
Lau, S.-L., Han, Y., Kang, J.-H., Kayhanian, M., and Stenstrom, M.K. 2009. Characteristics of highway stormwater runoff in Los Angeles: metals and polycyclic aromatic hydrocarbons. Water Environ. Res. 81(3): 308–318.
Liptan, T.W., and Santen, D.J., Jr. 2017. Sustainable Stormwater Management: A Landscape-Driven Approach to Planning and Design. Timber Press.
Status of Copper and Zinc Levels Throughout the Kenai River Watershed
18
Matthiessen, P., Reed, J., and Johnson, M. 1999. Sources and Potential Effects of Copper and Zinc Concentrations in the Estuarine Waters of Essex and Suffolk, United Kingdom. Mar. Pollut. Bull. 38(10): 908–920.
McIntyre, J.K., Baldwin, D.H., Beauchamp, D.A., and Scholz, N.L. 2012. Low-level copper exposures increase visibility and vulnerability of juvenile coho salmon to cutthroat trout predators. Ecol. Appl. 22(5): 1460–1471.
Meyer, B. 2021a. Kenai River Baseline Water Quality Monitoring, Data Query. Available from https://rpubs.com/kwf/krbwqm [accessed 1 May 2021].
Meyer, B. 2021b, May 2. RPubs - Kenai River Ca/Mg Data Exploration. Available from https://rpubs.com/kwf/ca_mg_2020CuZnReport [accessed 2 May 2021].
Morel, C.J., Kaushal, S.S., Tan, M.L., and Belt, K.T. 2020. Developing Sensor Proxies for “Chemical Cocktails” of Trace Metals in Urban Streams. Water 12(10): 2864. Multidisciplinary Digital Publishing Institute. [accessed 15 April 2021].
Prestes, E.C., Anjos, V.E., and Sodré, F.F. 2006. Copper, lead and cadmium loads and behavior in urban stormwater runoff in Curitiba, Brazil. Journal of the Brazilian. SciELO Brasil. Available from https://www.scielo.br/scielo.php?pid=S0103-50532006000100008&script=sci_abstract&tlng=pt.
R Core Team. 2021. R: A Language and Environment for Statistical Computing. R Foundation for Statistical Computing, Vienna, Austria. Available from https://www.R-project.org/.
Robertson, A., Knopf, J., and Loken, J. 2020. Kenai River Heavy Metal Pollution Source Data Mining Exercise for the Kenai Watershed Forum: Main Kenai River System. St. Mary’s University of Minnesota Geospatial Services. Available from https://github.com/Kenai-Watershed-Forum/KWF_Metals_2019_2020/blob/main/documents/references/DataMining_Kenai_Peninsula_StMarys.pdf.
Schiff, K.C., and Tiefenthaler, L.L. 2011. Seasonal flushing of pollutant concentrations and loads in urban Stormwater. J. Am. Water Resour. Assoc. 47(1): 136–142. Wiley.
Schoen, E.R., Wipfli, M.S., Trammell, E.J., Rinella, D.J., Floyd, A.L., Grunblatt, J., McCarthy, M.D., Meyer, B.E., Morton, J.M., Powell, J.E., Prakash, A., Reimer, M.N., Stuefer, S.L., Toniolo, H., Wells, B.M., and Witmer, F.D.W. 2017. Future of pacific salmon in the face of environmental change: Lessons from one of the world’s remaining productive salmon regions. Fisheries 42(10): 538–553. Wiley.
Scott, G.R., and Sloman, K.A. 2004. The effects of environmental pollutants on complex fish behaviour: integrating behavioural and physiological indicators of toxicity. Aquat. Toxicol. 68(4): 369–392.
Sires, J. 2017a. A review of potential zinc and copper pollution sources in the Kenai River watershed. DEC. Available from https://dec.alaska.gov/media/5181/zcliteraturereviewfinal.pdf.
Sires, J. 2017b. Kenai River Watershed Zinc and Copper Pollution: A Summary of Data Analysis, Literature Review Results, And Suggested Actions. DEC. Available from http://www.dec.alaska.gov/media/16761/kenai-river-zinc-and-copper-pollution-study.pdf.
Skidmore, J.F. 1964. Toxicity Of Zinc Compounds to Aquatic Animals, With Special Reference to Fish. Q. Rev. Biol. 39: 227–248.
Tian, Z., Zhao, H., Peter, K.T., Gonzalez, M., Wetzel, J., Wu, C., Hu, X., Prat, J., Mudrock, E., Hettinger, R., Cortina, A.E., Biswas, R.G., Kock, F.V.C., Soong, R., Jenne, A., Du, B., Hou, F., He, H., Lundeen, R., Gilbreath, A., Sutton, R., Scholz, N.L., Davis, J.W., Dodd, M.C., Simpson, A., McIntyre, J.K., and Kolodziej, E.P. 2020. A ubiquitous tire rubber-derived chemical induces acute mortality in coho salmon. Science. doi:10.1126/science.abd6951.
Tierney, K.B., Baldwin, D.H., Hara, T.J., Ross, P.S., Scholz, N.L., and Kennedy, C.J. 2010. Olfactory toxicity in fishes. Aquat. Toxicol. 96(1): 2–26. Elsevier.
USGS. 2019. 2019 Discharge, USGS Conditions for USGS 15266300 Kenai R at Soldotna, AK. Available from https://nwis.waterdata.usgs.gov/ak/nwis/uv?cb_00060=on&cb_00065=on&format=gif_stats&site_no=15266300&period=&begin_date=2019-01-01&end_date=2019-12-19 [accessed 1 May 2021].

Status of Copper and Zinc Levels Throughout the Kenai River Watershed
19
USGS. 2021a. Everything you need to know about SPARROW. Available from https://www.usgs.gov/mission-areas/water-resources/science/everything-you-need-know-about-sparrow?qt-science_center_objects=0 [accessed 1 May 2021].
USGS. 2021b, March 26. National Hydrography Dataset 20200616 for Alaska, FileGDB 10.1 Model Version 2.2.1. Available from https://www.sciencebase.gov/catalog/item/5aa050b6e4b0b1c392e6bf60 [accessed 19 April 2021].

Status of Copper and Zinc Levels Throughout the Kenai River Watershed
20
APPENDIX A: FIGURES
FIGURE 1. DIVISION OF THE KENAI RIVER WATERSHED (LOWER, MIDDLE, AND UPPER KENAI RIVER) AND WATER QUALITY MONITORING SITE LOCATIONS DURING BIANNUAL (2000 – PRESENT) KRBWQM SAMPLING EVENTS.

Status of Copper and Zinc Levels Throughout the Kenai River Watershed
21
FIGURE 2. 2019 - 2020 SAMPLING LOCATIONS. SITES THAT ARE NEWLY INCLUDED IN 2019 – 2020 FIELD SAMPLING ARE NOTED WITH AN ASTERISK (*). POINTS 7 (LOWER SLIKOK CREEK) AND 12 (SLIKOK CONFLUENCE) ARE SUPERIMPOSED AT THIS MAP SCALE.
Site ID Site Name1 City of Kenai Docks2 Cunningham Park3 Jim's Landing4 Lower Beaver Creek5 Lower Funny River6 Lower No Name Creek7 Lower Slikok Creek8 Lower Soldotna Creek9 Pillars10 Poachers Cove11 Skilak Lake Outlet
12* Slikok Confluence13 Soldotna Bridge14 Swiftwater Park
15* Upper Beaver Creek16* Upper No Name Creek17* Upper Slikok Creek18* Upper Soldotna Creek19* Upstream of Beaver Creek

Status of Copper and Zinc Levels Throughout the Kenai River Watershed
22
FIGURE 3. 2019-2020 KENAI RIVER MAINSTEM SITES COPPER CONCENTRATIONS AND CRITERION (CCC) VALUES.

Status of Copper and Zinc Levels Throughout the Kenai River Watershed
23
FIGURE 4. 2019-2020 KENAI RIVER TRIBUTARY SITES COPPER CONCENTRATIONS AND CRITERION (CCC) VALUES.

Status of Copper and Zinc Levels Throughout the Kenai River Watershed
24
FIGURE 5. KENAI RIVER MAINSTEM SITES ZINC CONCENTRATIONS AND CRITERION (CCC) VALUES.
Status of Copper and Zinc Levels Throughout the Kenai River Watershed
25
FIGURE 6. KENAI RIVER TRIBUTARY SITES ZINC CONCENTRATIONS AND CRITERION (CCC) VALUES.
Status of Copper and Zinc Levels Throughout the Kenai River Watershed
26
FIGURE 7. KENAI RIVER MAINSTEM AND TRIBUTARIES, DISSOLVED COPPER AND ZINC SAMPLE RESULTS BY YEAR, 2019 – 2020. COLOR DESIGNATES EXCEEDANCE OF CRITERION (CCC) VALUES.
Status of Copper and Zinc Levels Throughout the Kenai River Watershed
27
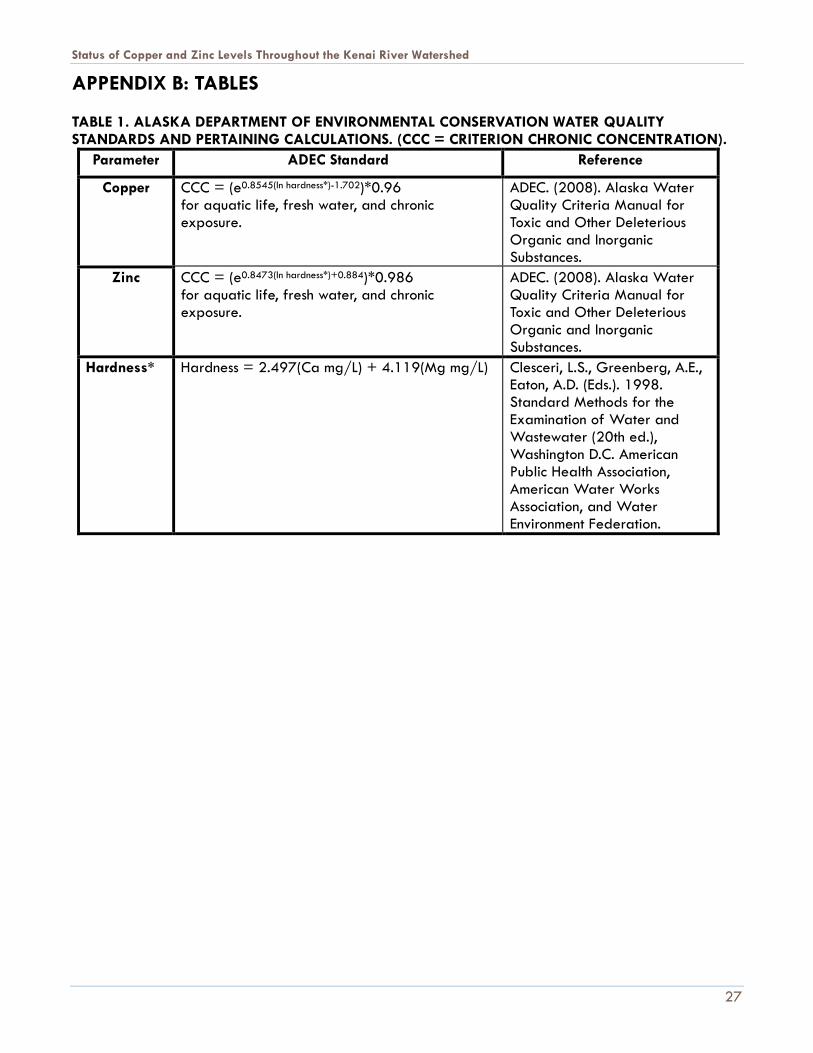
APPENDIX B: TABLES TABLE 1. ALASKA DEPARTMENT OF ENVIRONMENTAL CONSERVATION WATER QUALITY STANDARDS AND PERTAINING CALCULATIONS. (CCC = CRITERION CHRONIC CONCENTRATION).
Parameter ADEC Standard Reference
Copper CCC = (e0.8545(ln hardness*)-1.702)*0.96 for aquatic life, fresh water, and chronic exposure.
ADEC. (2008). Alaska Water Quality Criteria Manual for Toxic and Other Deleterious Organic and Inorganic Substances.
Zinc CCC = (e0.8473(ln hardness*)+0.884)*0.986 for aquatic life, fresh water, and chronic exposure.
ADEC. (2008). Alaska Water Quality Criteria Manual for Toxic and Other Deleterious Organic and Inorganic Substances.
Hardness* Hardness = 2.497(Ca mg/L) + 4.119(Mg mg/L) Clesceri, L.S., Greenberg, A.E., Eaton, A.D. (Eds.). 1998. Standard Methods for the Examination of Water and Wastewater (20th ed.), Washington D.C. American Public Health Association, American Water Works Association, and Water Environment Federation.

Status of Copper and Zinc Levels Throughout the Kenai River Watershed
28
TABLE 2. SAMPLING SITE COORDINATES. Site Habitat Latitude Longitude
Lower No Name Creek Tributary 60.550888 -151.26842 Upper No Name Creek Tributary 60.577846 -151.26859 Lower Soldotna Creek Tributary 60.483364 -151.05766 Upper Soldotna Creek Tributary 60.550828 -150.95833 Lower Beaver Creek Tributary 60.548029 -151.14324 Upper Beaver Creek Tributary 60.641201 -151.08472 Lower Slikok Creek Tributary 60.482318 -151.12705 Upper Slikok Creek Tributary 60.402664 -151.14739 Lower Funny River Tributary 60.489963 -150.86098
City of Kenai Docks Mainstem 60.54368 -151.22294 Cunningham Park Mainstem 60.54081 -151.18278
Upstream of Beaver Creek Mainstem 60.539279 -151.14226 Pillars Mainstem 60.533743 -151.09926
Poacher's Cove Mainstem 60.502005 -151.10697 Soldotna Bridge Mainstem 60.476634 -151.0821
Slikok Creek Kenai River Confluence Mainstem 60.482752 -151.12512 Swiftwater Park Mainstem 60.480338 -151.03085
Jim's Landing Mainstem 60.481392 -150.11502 Skilak Lake Outlet Mainstem 60.467517 -150.50779

Status of Copper and Zinc Levels Throughout the Kenai River Watershed
29
TABLE 3. INSTANCES WHERE ZINC AND COPPER DATA DIFFERS FROM PAIRED CALCIUM AND MAGNESIUM DATA. Copper/Zinc Sample Date
Copper/Zinc Sample Location
Calcium/Magnesium Sample Date
Calcium/Magnesium Sample Location
May 22, 2019 Upper No Name Creek April 30, 2019 Lower No Name Creek May 22, 2019 Upper Beaver Creek April 30, 2019 Lower Beaver Creek May 22, 2019 Upper Slikok Creek April 30, 2019 Lower Slikok Creek May 22, 2019 Upper Soldotna Creek April 30, 2019 Lower Soldotna Creek May 22, 2019 Slikok Creek – Kenai River
Confluence April 30, 2019 Poacher’s Cove
July 30, 2019 Upper No Name Creek July 24, 2019 Upper No Name Creek July 30, 2019 Upper Beaver Creek July 24, 2019 Upper Beaver Creek July 30, 2019 Upper Slikok Creek July 24, 2019 Upper Slikok Creek July 30, 2019 Upper Soldotna Creek July 24, 2019 Upper Soldotna Creek July 30, 2019 Slikok Creek – Kenai River
Confluence July 24, 2019 Poacher’s Cove

Status of Copper and Zinc Levels Throughout the Kenai River Watershed
30
TABLE 4. (PAGE 1 OF 3) COPPER AND ZINC LEVELS AND HARDNESS-DEPENDENT CRITERION STANDARDS.
Copper Zinc
Site name River mile Date
Location on Kenai
River
Hardness (mg/L) Result (ug/L) Standard:
CCC (ug/L) Result (ug/L) Standard: CCC (ug/L)
Lower No Name Creek
4/30/2019 Tributary 32.59 0.668 J 4.40 21.3 39.92 7/30/2019 Tributary 51.22 0.451 J 6.48 5.53 J 58.56 7/21/2020 Tributary 49.86 0.5 U 6.33 5 U 57.24
Upper No Name Creek
5/22/2019 Tributary 32.59 0.53 J 4.40 98.1 39.92 7/24/2019 Tributary 50.85 0.39 J 6.44 5.12 J 58.20 5/20/2020 Tributary 15.58 0.606 J 2.34 10.9 21.36 7/22/2020 Tributary 82.32 1.04 9.71 3.46 J 87.53
Lower Beaver Creek
4/30/2019 Tributary 43.06 3.91 5.58 84.1 50.55 7/30/2019 Tributary 73.65 1.77 8.83 69.9 79.66 7/21/2020 Tributary 63.36 0.509 J 7.77 3.27 J 70.12
Upper Beaver Creek
5/22/2019 Tributary 43.06 0.5 U 5.58 77.80 50.55 7/24/2019 Tributary 73.65 1.07 8.83 64.40 79.66 5/20/2020 Tributary 15.7 0.5 U 2.36 5 U 21.5 7/22/2020 Tributary 56.16 0.5 U 7.01 5 U 63.31
Lower Slikok Creek
4/30/2019 Tributary 38.45 0.783 J 5.07 74.4 45.93 7/30/2019 Tributary 73.58 0.684 J 8.83 4.01 J 79.60 7/21/2020 Tributary 62.29 0.5 J 7.66 5 U 69.12
Upper Slikok Creek
5/22/2019 Tributary 38.45 0.5 U 5.07 67.60 46.22 7/24/2019 Tributary 73.58 0.53 J 8.83 5U 79.60 5/20/2020 Tributary 20.19 0.431 J 2.92 69.9 26.61 7/22/2020 Tributary 49.82 0.5 U 6.33 5 U 57.20
Lower Soldotna
Creek
4/30/2019 Tributary 58.94 0.597 J 7.30 137 65.96 7/30/2019 Tributary 81.39 0.424 J 9.62 5 U 86.70 7/21/2020 Tributary 77.10 0.5 U 9.19 5.52 J 82.81
Upper Soldotna
Creek
5/22/2019 Tributary 58.94 0.5 U 7.30 48.50 65.96 7/24/2019 Tributary 81.39 0.81 J 9.62 5U 86.70 5/20/2020 Tributary 38.91 0.5 U 5.12 5 U 46.39 7/22/2020 Tributary 49.78 0.5 U 6.32 5 U 57.16
Copper, zinc exceedances based on water quality criteria for aquatic life for fresh water (chronic exposure) established by Alaska Department of Environmental Conservation
CCC = criterion chronic concentration (freshwater) () = duplicate sample
J = quantitation is an estimate U = analyzed but not detected
Values in parentheses are duplicate samples

Status of Copper and Zinc Levels Throughout the Kenai River Watershed
31
TABLE 4 (PAGE 2 OF 3). COPPER AND ZINC LEEVLS AND HARDNESS-DEPENDENT STANDARDS FOR SAMPLING EVENTS ON THE KENAI RIVER MAINSTEM AND TRIBUTARIES.
Copper Zinc
Site name River mile Date
Location on Kenai
River
Hardness (mg/L) Result (ug/L) Standard:
CCC (ug/L) Result (ug/L) Standard: CCC (ug/L)
Lower Funny River
4/30/2019 Tributary 34.41 0.363 J 4.61 5 U 41.80 7/30/2019 Tributary 42.01 0.514 J 5.47 5.63 J 49.50 7/21/2020 Tributary 38.13 0.495 J 5.03 3.53 J 45.60
City of Kenai Docks 1.5
4/30/2019 Mainstem 842.68 2.49 70.9 89.9 628.18 7/30/2019 Mainstem 74.98 0.562 J 8.97 5 U 80.87 7/21/2020 Mainstem 50.23 3.88 6.37 4.16 J 57.60
Cunningham Park 6.5
4/30/2019 Mainstem 36.84 0.751 J 4.89 65.6 44.29 7/30/2019 Mainstem 33.74 0.428 J 4.53 5 U 41.12 7/21/2020 Mainstem 33.23 0.334 J 4.47 3.59 J 40.58
Upstream of Beaver Creek
10.1 4/30/2019 Mainstem 34.23 0.66 J 4.59 67.1 41.62 7/30/2019 Mainstem 33.62 0.497 J 4.52 10.7 40.99 7/21/2020 Mainstem 31.16 0.5 U 4.24 5 U 38.43
Pillars 12.5 4/30/2019 Mainstem 33.90 0.681 J 4.55 86 41.28 7/30/2019 Mainstem 33.58 0.452 J 4.52 8.14 J 40.94 7/21/2020 Mainstem 30.83 0.5 U 4.20 5 U 38.08
Poachers Cove 18
4/30/2019 Mainstem 34.53 0.47 J 4.62 5 U 41.92 7/30/2019 Mainstem 33.87 0.42 J 4.55 5 U 41.25 7/21/2020 Mainstem 29.96 0.5 U 4.10 5 U 37.17
Slikok Creek-Kenai
River Confluence
19.00
5/22/2019 Mainstem 34.53 0.42 J 4.62 5U 41.92 7/24/2019 Mainstem 34.87 8.16 4.55 3.55 J 41.25 5/20/2020 Mainstem 28.31 0.387 J 3.9 5 U 35.43 7/22/2020 Mainstem 50.1 0.515 J 6.36 5 U 57.47
Soldotna Bridge 21
4/30/2019 Mainstem 33.49 0.716 J 4.50 56.4 40.85 7/30/2019 Mainstem 33.58 0.493 J 4.52 5 U 40.94 7/21/2020 Mainstem 30.33 0.348 J 4.14 5 U 37.57
Swiftwater Park 23
4/30/2019 Mainstem 34.11 0.462 J 4.58 59.6 41.49 7/30/2019 Mainstem 33.33 0.398 J 4.49 3.49 J 40.69 7/21/2020 Mainstem 30.08 0.359 J 4.11 5 U 37.30
Copper, zinc exceedances based on water quality criteria for aquatic life for fresh water (chronic exposure) established by Alaska Department of Environmental Conservation
CCC = criterion chronic concentration (freshwater) () = duplicate sample
J = quantitation is an estimate U = analyzed but not detected
Values in parentheses are duplicate samples

Status of Copper and Zinc Levels Throughout the Kenai River Watershed
32
TABLE 4 (PAGE 3 OF 3). COPPER AND ZINC LEEVLS AND HARDNESS-DEPENDENT STANDARDS FOR SAMPLING EVENTS ON THE KENAI RIVER MAINSTEM AND TRIBUTARIES.
Copper Zinc
Site name River mile Date
Location on Kenai
River
Hardness (mg/L) Result (ug/L) Standard:
CCC (ug/L) Result (ug/L) Standard: CCC (ug/L)
Skilak Lake Outlet 50.00
5/22/2019 Mainstem 32.72 0.37 J 4.42 5U 40.06 7/24/2019 Mainstem 33.20 0.70 4.47 5U 40.56 5/20/2020 Mainstem 28.68 0.341 J 3.95 3.41 J 35.83 7/22/2020 Mainstem 33.59 0.313 J 4.52 5 U 40.95
Jim's Landing 70.00
5/22/2019 Mainstem 42.94 0.5 U 5.57 5U 50.43 7/24/2019 Mainstem 40.07 0.64 5.25 5U 47.56 5/20/2020 Mainstem 37.7 0.472 J 4.98 5 U 45.16 7/22/2020 Mainstem 42.77 0.496 J 5.55 5 U 50.26
Copper, zinc exceedances based on water quality criteria for aquatic life for fresh water (chronic exposure) established by Alaska Department of Environmental Conservation
CCC = criterion chronic concentration (freshwater) () = duplicate sample
J = quantitation is an estimate U = analyzed but not detected
Values in parentheses are duplicate samples

Status of Copper and Zinc Levels Throughout the Kenai River Watershed
33
TABLE 5. RELATIVE DIFFERENCE LEVELS (RPD) OF DUPLICATE SAMPLES BY SITE AND DATE. River Mile* Site Date Parameter RPD (%) >20% Trib Lower_No_Name_Creek 7/30/2019 Copper 148.32% Y Trib Lower_No_Name_Creek 7/21/2020 Copper 112.66% Y 1.5 City_of_Kenai_Docks 4/30/2019 Copper 38.85% Y 19 Lower_Slikok_Creek 4/30/2019 Copper 44.12% Y 19 Slikok_Creek_Kenai_River_Confluence 5/20/2020 Copper 3.95% 19 Slikok_Creek_Kenai_River_Confluence 7/22/2020 Copper 2.96% 50 Skilak_Lake_Outlet 5/20/2020 Copper 4.19% 70 Jims_Landing 5/20/2020 Copper 5.44% Trib Upper_No_Name_Creek 5/22/2019 Copper 144.21% Y Trib Upper_No_Name_Creek 7/24/2019 Copper 44.00% Y Trib Upper_Beaver_Creek 5/20/2020 Copper 0.00% Trib Upper_No_Name_Creek 5/20/2020 Copper 19.76% Trib Upper_Slikok_Creek 5/20/2020 Copper 14.82% Trib Upper_Soldotna_Creek 5/20/2020 Copper 0.00% Trib Upper_Beaver_Creek 7/22/2020 Copper 0.00% Trib Lower_No_Name_Creek 7/30/2019 Zinc 4.06% Trib Lower_No_Name_Creek 7/21/2020 Zinc 28.57% Y 1.5 City_of_Kenai_Docks 4/30/2019 Zinc 20.11% Y 19 Lower_Slikok_Creek 4/30/2019 Zinc 174.81% Y 19 Slikok_Creek_Kenai_River_Confluence 5/20/2020 Zinc 0.00% 19 Slikok_Creek_Kenai_River_Confluence 7/22/2020 Zinc 0.00% 50 Skilak_Lake_Outlet 5/20/2020 Zinc 37.81% 70 Jims_Landing 5/20/2020 Zinc 0.00% Trib Upper_No_Name_Creek 5/22/2019 Zinc 47.37% Trib Upper_No_Name_Creek 7/24/2019 Zinc 11.94% Trib Upper_Beaver_Creek 5/20/2020 Zinc 0.00% Trib Upper_No_Name_Creek 5/20/2020 Zinc 42.90% Y Trib Upper_Slikok_Creek 5/20/2020 Zinc 153.97% Y Trib Upper_Soldotna_Creek 5/20/2020 Zinc 0.00% Trib Upper_Beaver_Creek 7/22/2020 Zinc 0.00%
Overall mean difference (mean ± standard error): • Copper: 38.9 ±13.6% • Zinc : 34.8 ± 14.3%
* Refers to river mile of the main stem Kenai River