status and management of the forester kangaroo in tasmania...
TRANSCRIPT
Status and Managementof the Forester Kangaroo
in Tasmania
2000
Zoë Tanner and Greg Hocking
STATUS AND MANAGEMENT OF THEFORESTER KANGAROO IN TASMANIA, 2000
Zoë Tanner and Greg Hocking
NATURE CONSERVATION REPORT 2001/02
Status and Management of theForester Kangaroo in Tasmania 2000
Zoë Tanner and Greg Hocking2001
The views and opinions expressed in this report are those of the authors and do not necessarilyrepresent those of the Department of Primary Industries, Water and Environment.
ISSN 1441-0680
Published by the Nature Conservation Branch, Department of Primary Industries, Water andEnvironmentGPO Box 44aHobart 7000
Copyright©2001 Crown in right of State of Tasmania
Apart from fair dealing for the purposes of private study, research, criticism or review, aspermitted under the Copyright Act, no part may be reproduced by any means without writtenpermission.
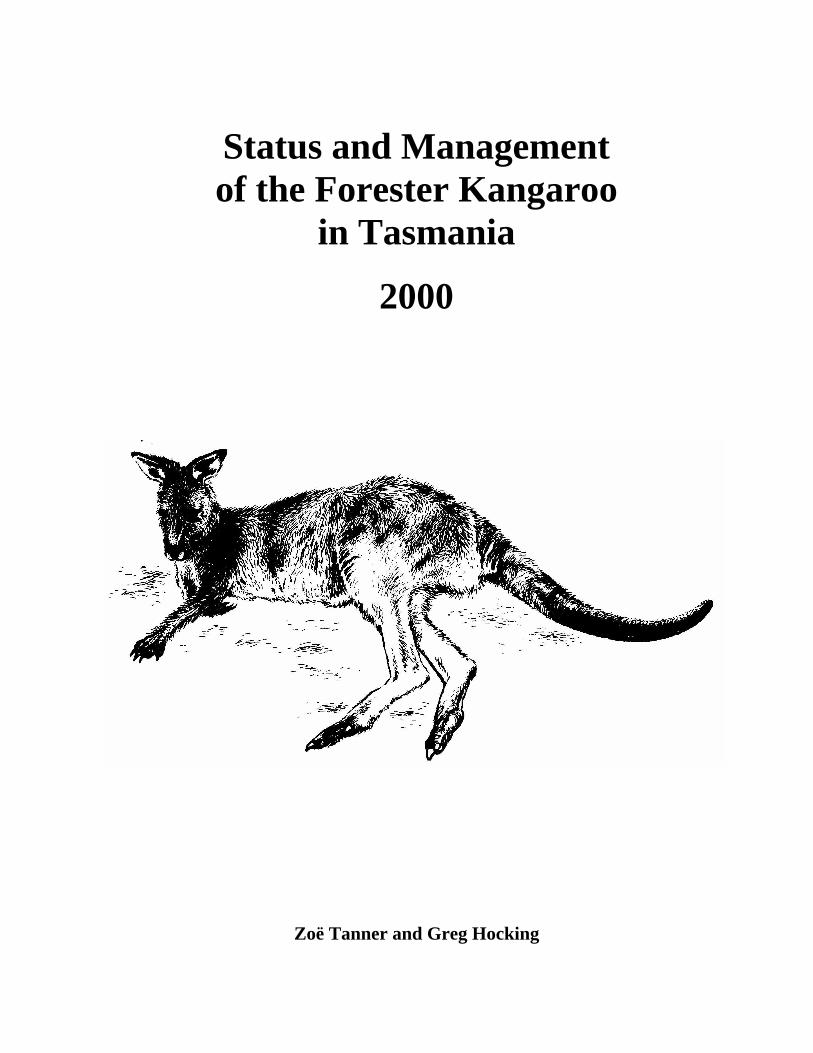
Cover Illustration: Forester kangaroo (Macropus giganteus tasmaniensis) reclining on grass(Geoff Lennox).
Cite as: Tanner, Z. and Hocking, G.J. (2001). Status and Management of the Forester Kangarooin Tasmania, 2000. Nature Conservation Report 2001/02. Department of Primary Industries,Water and Environment.
Status and management of the forester kangaroo in Tasmania
CONTENTS
1 INTRODUCTION.............................................................................................. 1
2 HISTORY ........................................................................................................... 2
2.1 Distribution and habitat prior to European settlement............................................................... 2
2.2 Impact of European settlement...................................................................................................... 2
3 HISTORY OF MANAGEMENT ...................................................................... 4
3.1 Legal protection............................................................................................................................... 4
3.2 Control of poisons............................................................................................................................ 4
3.3 Enforcement activities..................................................................................................................... 4
3.4 Establishment of Mt William National Park ................................................................................ 4
3.5 Management of population increase.............................................................................................. 5
Trap and release program........................................................................................................6
Introduction of a culling program...........................................................................................7
Monitoring ..............................................................................................................................7
4 THE CURRENT PROBLEM ........................................................................... 8
4.1 Impact of forester kangaroos on agriculture................................................................................ 8
4.2 Impact of agriculture on forester kangaroos................................................................................ 8
5 LANDOWNER INFORMATION AND OPINIONS ..................................... 9
5.1 Introduction ..................................................................................................................................... 9
5.2 Methods ............................................................................................................................................ 9
5.3 Results and Discussion .................................................................................................................... 9
Estimating the forester kangaroo range ..................................................................................9
Perceptions of population trends...........................................................................................10
Impact of forester kangaroos on farms within their range....................................................10
Landowner comments on management and conservation of forester kangaroos in the future
...............................................................................................................................................10
5.4 Relationship between landowners and the DPIWE ................................................................... 11
Status and management of the forester kangaroo in Tasmania
6 THE FIELD SURVEY .................................................................................... 13
6.1 Introduction ................................................................................................................................... 13
6.2 Methods .......................................................................................................................................... 13
6.3 Transect locations.......................................................................................................................... 14
6.4 Analysis .......................................................................................................................................... 16
6.5 Results ............................................................................................................................................ 17
Population Trends .................................................................................................................21
Culling levels ........................................................................................................................21
Population Trends versus Culling Levels and Rainfall.........................................................22
6.6 Discussion....................................................................................................................................... 23
Population Densities .............................................................................................................23
Population Trends .................................................................................................................23
Influences on Population Trends ..........................................................................................23
6.7 Summary ......................................................................................................................................... 24
7 THREE HUMMOCK ISLAND AND RELATED ISSUES......................... 25
7.1 Background.................................................................................................................................... 25
Forester kangaroos on Three Hummock Island ....................................................................25
The situation at Maria Island ................................................................................................25
7.2 Methods .......................................................................................................................................... 26
7.3 Results ............................................................................................................................................ 26
Number of kangaroos............................................................................................................26
Weather conditions ...............................................................................................................26
7.4 Discussion....................................................................................................................................... 27
8 RECOMMENDATIONS FOR MANAGEMENT OF FORESTERKANGAROOS IN TASMANIA ......................................................................... 29
8.1 Monitoring program ..................................................................................................................... 29
8.2 Culling program ............................................................................................................................ 29
8.3 Management in the Midlands....................................................................................................... 30
8.4 Management in the Northeast...................................................................................................... 30
8.5 Three Hummock Island ................................................................................................................ 31
8.6 Looking to the future .................................................................................................................... 31
Status and management of the forester kangaroo in Tasmania
9.1 Monitoring ..................................................................................................................................... 32
9.2 Culling program ............................................................................................................................ 32
9.3 Mt William National Park and Northeast................................................................................... 32
9.4 Three Hummock Island ................................................................................................................ 33
10 ACKNOWLEDGMENTS ............................................................................. 34
11 REFERENCES................................................................................................ 35
Appendix 1 - Questionnaire ................................................................................ 37
Appendix 2 - Maps of distribution according to questionnaire respondents 379
Appendix 3 – Landowners’ comments for management and conservation offorester kangaroos in the future ......................................................................... 40
Appendix 4 - Evaluation of methods used in field survey ................................ 41
Appendix 5 - Maps of transect locations............................................................ 46

Status and management of the forester kangaroo in Tasmania
1 INTRODUCTION
The forester kangaroo, Macropus giganteus tasmaniensis (Le Souef 1923), is generallyrecognised as the Tasmanian subspecies of the eastern grey kangaroo, Macropus giganteusgiganteus (Shaw 1790), which is widespread throughout eastern Australia. On the Australianmainland, the eastern grey kangaroo inhabits heathland, shrubland, woodland and open forest ofthe coast, mountains, slopes and plains. Less than 1% of the species’ current total range occursin Tasmania (Pearse and Wapstra 1988), where forester kangaroos are restricted to the flatterand drier areas in the eastern half of the state, below 1000 metres. The forester kangaroo isTasmania’s largest marsupial, and only species of kangaroo, but its status is currently insecuredue to a number of factors.
The forester kangaroo suffered a massive decline in numbers between the early 1800s and the1950s (Pearse and Wapstra 1988), and now inhabits only 10% of its pre-European range(Hocking & Driessen 1996) (Fig. 1). The original decrease in range was due to the shooting offorester kangaroos for human consumption and dog meat, which began with the arrival of whitesettlers in Tasmania in the early 1800s. This was exacerbated by the loss and fragmentation ofhabitat, due to clearing of land for agriculture. This practice has resulted in the isolation andreduction of populations, and is an ongoing process. Although the species' status has improvedsince its lowest point in the 1950s, activities such as land clearance and poaching continue tothreaten the viability of the forester kangaroo in Tasmania.
This study aimed to determine the current status of the forester kangaroo in Tasmania by:
1. Obtaining information from landowners regarding the range of forester kangaroos and trendsin local populations.
2. Investigating the trends of the last twenty years, during which time this agency has beenmonitoring numbers. This part of the study involved on-ground surveys of forester kangaroonumbers.
Status and management of the forester kangaroo in Tasmania
2 HISTORY
2.1 Distribution and habitat prior to European settlement
The former range of forester kangaroos has been reconstructed by Wapstra (1976) and Barkerand Caughley (1990) using two sources:
1. The diaries of George Augustus Robinson (edited by Plomley 1966), who travelled the stateon foot between 1827 and 1834, making extensive observations on Tasmania’s wildlife.
2. Vegetation maps, which allow an estimate of the distribution of dry sclerophyll forest andheathland, habitats suitable for the forester kangaroo (Jackson, 1965).
From Robinson’s diaries, it is clear that forester kangaroos were abundant in the Northeast, theMidlands, and the eastern part of the Central Plateau, but absent from the western part of thestate. Where forester kangaroos were abundant along the coast, they were observed on heath orgrassy plains, whilst inland, they were abundant on marshes. The forester kangaroo reached itshighest densities in the coastal areas of the Northeast, and in some of the eastern river valleys,notably those of the Macquarie and South Esk (Barker and Caughley 1990).
Suitable areas, where forester kangaroos could have occurred in the past, included the Midlands,the upper Derwent Valley, parts of the Central Plateau, the East Coast, and the Northeast (Barkerand Caughley 1990). Excluding areas of wet sclerophyll forest and rainforest, this area iscomprised of about 2.6 million hectares. Much of this habitat is of a very low carrying capacityfor forester kangaroos (Wapstra 1976).
Fire has been important in maintaining forester kangaroo habitat because it promotes growth ofthose plants eaten by kangaroos, and if used regularly, prevents dense regrowth of scrub andheathland, which hinders movement of kangaroos (Pearse and Wapstra 1988). Prior to, andduring European settlement, the Aborigines burnt the countryside regularly (Plomley 1966).This practice was continued by European graziers to provide feed for their sheep and cattle andis still used on bush runs.
2.2 Impact of European settlement
The first confirmed sighting of forester kangaroos in Tasmania was recorded in 1798 by Flindersat Green Island in Port Dalrymple in the Tamar Valley (Flinders 1814, cited in Barker &Caughley 1990). Soon after the arrival of Europeans in Tasmania in 1803, the range of foresterkangaroos began to decrease. By the end of 1808, overhunting had made it difficult to findforester kangaroos close to the settlements of Hobart and Port Dalrymple (Barker and Caughley1990).
Settlement was limited to the lower Derwent and Tamar Valleys until the early 1820s, when thepastoral industry expanded, and the lowland woodlands and forests in the eastern half of thestate were settled for grazing. Land grants were made along the banks of the main rivers, whichhad been burnt by Aborigines to encourage grasslands (Barker and Caughley 1990). Thegrasslands enhanced the forester kangaroo’s habitat, but also made these places ideal for grazingsheep, resulting in the settlers killing forester kangaroos to prevent competition. By 1844, theDerwent Valley, Midlands and much of the East Coast had been settled. Later, extensive areas
Status and management of the forester kangaroo in Tasmania
ground during the winter months (Barker and Caughley 1990). The grazing of sheep in foresterkangaroo habitat increased, and forested refuge areas were removed to promote grasses,breaking up a continuous distribution of habitat.
By 1850, the forester kangaroo had declined to the extent that comments were made on itsscarcity (Barker and Caughley 1990). In 1852, Louisa Anne Meredith noted that “[the forester]kangaroo has become in all inhabited districts an extinct animal... So many idle vagabonds havebeen in the constant habit of roaming about with packs of twenty or thirty huge dogs each, toprocure kangaroo skins for sale, that the forest species is now rarely seen” (Ellis 1979).
Forester kangaroos were hunted for sport and to provide meat. Dogs were necessary for huntingin early years, as the colony was initially undersupplied and dependent on ammunition beingimported from overseas. They became a problem, becoming feral and attacking both wildlifeand the settlers’ stock (Barker & Caughley 1990).
From the 1870s, forester kangaroos were also affected by rabbit control. Trails of poisoned baitscontaining strychnine or phosphorus were laid, and packs of dogs were taken on to the paddocksand runs and allowed to hunt (Pearse and Wapstra 1988). Populations of forester kangaroos andother native herbivores declined. Previous removal of refuge areas had broken the populationsup into small groups, and hunting, poison, and dogs wiped out many of these.
Thus, by the early 1900s, as a result of hunting and to a lesser extent land clearance, the specieswas in serious decline (Wapstra 1976). By 1950, forester kangaroos were to be found in onlytwo areas: the Midlands and the Northeast of Tasmania (Pearse and Wapstra 1988). Little isknown about the rate of decline. Wapstra (1976) assumes it to be a gradual process keepingpace with land alienation, and estimated the range of the forester, at the time, to be about 140-000 hectares, or 5.4% of its range at the time of European settlement.
Status and management of the forester kangaroo in Tasmania
3 HISTORY OF MANAGEMENT
3.1 Legal protection
Forester kangaroos received partial protection under the Game Protection Act 1879, which madeit an offence to hunt them between 1 August and 30 January of the following year. Later, underthe Game Protection Act 1898, forester kangaroos were listed as fully protected (Pearse andWapstra 1988). Forester kangaroos have remained fully protected since that time, and are nowprotected under the National Parks and Wildlife Act 1970, and can only be culled legally under acrop protection permit issued by the Director of the Parks and Wildlife Service.
In 1970, a House of Representatives Select Committee on Wildlife Conservation was set up tolook at wildlife conservation in Australia (Anon. 1972). Kangaroos were of immediate concern,and an interim report was produced on this subject (Anon. 1971). This report concluded that ofthe large kangaroos, only the Tasmanian forester kangaroo was under threat. This threat arosefrom habitat destruction.
In 1974, a report prepared by State and Commonwealth wildlife authorities listed the foresterkangaroo as second priority in a list of 13 species of macropods urgently in need of having anarea of their habitat reserved (Burbidge 1977).
3.2 Control of poisons
The killing of kangaroos as a side-effect of rabbit eradication subsided after 1952, when thecontrol over the use of poisons became the responsibility of the Department of Agriculture,which introduced compound 1080 to replace other poisons. Although 1080 poison is capable ofkilling forester kangaroos (McIlroy 1982), field observations have indicated that the strength ofthe poison in baits used to poison rabbits is not usually sufficient to kill foresters (Pearse andWapstra 1988). The use of 1080 declined after 1956 when the myxomatosis virus wasintroduced to the state. Today, 1080 is still used to control browsing rabbits, wallabies andpossums on crops and forest plantations. Recently, reports have been received of 1080 killingforester kangaroos in the Northeast.
3.3 Enforcement activities
Illegal shooting of foresters is thought to be a contributing factor to the species' decline inTasmania. In the late 1960s, a concerted policing effort was carried out, and between 1967 and1969, 32 people were convicted of a total of 60 charges concerning the illegal culling of foresterkangaroos (Pearse and Wapstra 1988). This had a positive effect, with a decrease in the numberof offenders detected. Forester kangaroo protection remains a high priority of enforcementactivities.
3.4 Establishment of Mt William National Park
Because of its remoteness and relatively poor soils, the Northeastern part of the state did notundergo pastoral development until the early 1970s. Prior to 1970, forester kangaroos were
Status and management of the forester kangaroo in Tasmania
generally low. In the early 1970s, a large pastoral company acquired 50 000 ha of land, andbegan developing improved pasture to run sheep and cattle. Development created a mosaic ofbush and pasture, and generally improved the carrying capacity of the land for foresterkangaroos.
The Parks and Wildlife Service succeeded in setting aside a reserve in 1973, now known as MtWilliam National Park. The park reserved a representative sample of the range of naturalcommunities in the Northeast of the state, but its carrying capacity for forester kangaroos waslow. Further additions to the Park, which increased its area to 10 595 ha, did little to improvethe situation.
Because the pastoral company’s land holdings were large, the manager was reasonably tolerantof the increase in the number of forester kangaroos, and the future of the population seemedassured. However, in 1977, the company put up for sale about half of its holdings, whichincluded all of the forester kangaroo habitat with a high carrying capacity. It was predicted thatthe new landowners would undertake extensive clearing, which would destroy forester kangaroorefuge areas. Thus, a further 3 217 ha of land adjacent to Mt William National Park waspurchased, increasing the size of the park to 13 812 ha. The new area included 1 000 ha ofimproved pasture, which was maintained with superphosphate until the late 1980s, when lack offunds led to the discontinuation of this practice.
Many landowners in the Northeast district reported in 1976 that a decline of forester numbershad occurred in that area in the previous 10-20 years, which was likely to be a result of largescale land clearing during that time, resulting in fragmentation of habitat (Wapstra, 1976).There has recently been further anecdotal evidence of the population's decline in the Northeastregion (Cronin 1998), which was disputed by other sources which claim that forester kangaroosare increasing in the region. It is likely that forester kangaroos are being increasingly attractedto areas of developed pasture and crops where they are more easily seen, and therefore appearmore common. However, habitat is declining due to little regeneration within the National Parkand clearing of forest on private land, leading to a drop in numbers. Thus, the Mt WilliamNational Park and general Northeast region provided one of the focal points for the currentstudy.
3.5 Management of population increase
By 1970, the remnant populations in the Midlands had increased in both size and range (Pearseand Wapstra 1988), and were damaging fences and feeding on crops and improved pastures incompetition with domestic stock. Landowners requested that the number of forester kangaroosbe reduced.
Rather than cull the forester kangaroos, the PWS decided to attempt to increase the range of thespecies by live-trapping problem animals and releasing them in suitable habitat no longeroccupied by forester kangaroos.
Status and management of the forester kangaroo in Tasmania
Trap and release program
Landowners with suitable release sites were contacted by the PWS, and permission obtained torelease forester kangaroos on their properties. Not all landowners approached agreed to takeforester kangaroos, because some regarded them as a potential pest (Pearse and Wapstra 1988).Cage traps were used to trap the animals where they had forced holes through netting fences onwell-established runs. Once trapped, animals were tagged and transported in trailers to therelease sites. Between 1971 and 1978, 2038 forester kangaroos were trapped. Over 1900forester kangaroos were released, with mortality of trapped animals being low. For example, in1977 and 1978, 94% of trapped animals were released, healthy, into the wild (Pearse andWapstra 1988).
Releases were made at 18 locations (Fig. 2), and surveys were carried out at most sites todetermine success of the operation. Freycinet National Park failed as a release site, probablybecause the area of suitable habitat was too small to support a viable population. On the CentralPlateau, the forester kangaroos encountered heavy snowfalls shortly after their release in earlywinter, and the animals did not survive (Pearse and Wapstra 1988). At all but these two sites(Freycinet and the Central Plateau), the release was successful, and resident breedingpopulations were established (Pearse and Wapstra 1988), but populations do not necessarilyremain to this day.
At Kempton, the population increased to such a density that permits were issued to twolandowners to shoot 75 animals in 1978 and 1979. However, at present, the Kemptonpopulation appears to be declining (see Section 5). Another successful release site was AsbestosRange National Park (Now Narawntapu National Park), where the population had increased toabout 200 by 1987, but has now decreased to as few as fifty animals.
On Maria Island, 45 animals were released during 1969 and 1970 on an area of pasture andgrassland cleared and developed by former settlers. This population had increased to about 2000by 1985, and began to have a serious impact on the native vegetation. The population continuesto increase, and is managed by a long-term culling regime.
The release program caused some concern among landowners, as when released, some animalsmoved to adjacent properties where owners objected to their presence. It remains an issuebetween landowners and the agency today, as several landowners believe that forester kangarooswere released onto their property without their permission, or even knowledge. However, thiscan be explained by the fact that foresters have been known to move up to 10km in search ofbetter habitat (Pearse and Wapstra, 1988), and thus have moved onto neighbouring propertiesfrom legitimate release sites.
Opposition reached a peak in 1975 when a number of landowners in the Western Tiers area,where three adjacent properties had agreed to the release of forester kangaroos, requested thatthe program cease. This request was supported by two rural municipal councils. Following aseries of meetings, it was agreed that if there was a possibility that forester kangaroos mightmove from the release site to a neighbouring property, the neighbours’ approval would first haveto be gained. This made it difficult to find appropriate sites, and no more animals were trappedafter 1978.
Overall, the release program was successful in increasing the forester’s range, thus giving itgreater security (Pearse and Wapstra 1988).
Status and management of the forester kangaroo in Tasmania
Introduction of a culling program
In the late 1970s, farmers in areas where forester kangaroos were causing damage began tocriticise management provisions, particularly the refusal of the PWS to undertake quick andeffective control by shooting. This criticism raised the concern that the relationship between thePWS and landowners was poor, and that confrontation might result. This relationship remainsan issue, and will be discussed in later sections of this report.
As a result of a meeting between the PWS and landowners, it was decided that shooting shouldbe introduced as a control measure. Publicity over this decision was well received, and attractedno adverse comment (Pearse and Wapstra, 1988). In the first year, 1976, Wildlife Rangersundertook all the shooting, but in 1977, a system was introduced where landowners and theiragents could shoot forester kangaroos under permit. This latter system is still in place today. Inresponse to an application, a DPIWE wildlife officer assesses the property, and recommendshow many animals can be shot under permit. The permit specifies the number of foresterkangaroos to be shot, and the landowner is issued with a plastic self-locking tag to be placed onthe carcass of each forester kangaroo shot. The tag, which must remain with the skin, acts as adeterrent to illegal shooters, and aids in their detection. An annual quota is set for each district,and permits issued in accordance with the quota.
Some landowners are not content with the current crop protection system (see Section 5), andthere are reports of landowners culling animals without permits if the permits are too difficult toobtain.
Monitoring
Since 1980, forester kangaroo population trends in the Midlands of Tasmania have beenregularly monitored using a system of line transect surveys. Since 1983, this has also occurredin the Northeast of Tasmania. The results of these surveys have been used each year indetermining the number of forester kangaroos to be culled under crop protection permits in eacharea.
In conjunction with the 1999 field survey, a questionnaire was sent out to landowners. Theresults of the questionnaire were used to choose areas to establish additional transects, and toformulate management prescriptions for the forester kangaroo. The results also extendedknowledge of the forester kangaroo's range, and the conflict issues between landowners andforester kangaroos. The field surveys and questionnaire survey will be further detailed inSections 5 and 6 respectively.
Status and management of the forester kangaroo in Tasmania
4 THE CURRENT PROBLEM
The relationship between forester kangaroos and agriculture is the most important issuepertaining to the survival of forester kangaroos, as most of the current range is on private land.
4.1 Impact of forester kangaroos on agriculture
Conflict between the forester kangaroo and landowners arises because foresters graze on cropsand improved pasture and damage fences. Quantitative data on damage caused to pastures andcrops in local situations is not available. However, mobs of forester kangaroos feeding in openpaddocks can be more obvious than wallabies and deer, making it appear as if foresters causemore damage than other grazing animals.
Damage to fences allows stock to stray within and between properties, wallabies and rabbits toenter crops and pasture, and requires labour and materials to effect repairs.
4.2 Impact of agriculture on forester kangaroos
Threats to the survival of the forester kangaroo posed by agriculture include:
1. Land clearing and pasture improvement.
Land clearing and pasture improvement can result in fragmentation of populations, reducingtotal numbers and increasing vulnerability of sub-populations.
Improvement of land through topdressing of existing pastures, establishment of pastures, orplanting crops is a significant investment, so landowners may become less tolerant of foresterkangaroos. This is likely to more than offset the advantage to the forester kangaroos of theprovision of a superior food source.
2. Fragmentation of ownership.
Many of the larger properties in Northeast Tasmania have been subdivided into smallerholdings. Land development is often an economic necessity for smaller holdings, and thedensity of foresters tolerated on larger holdings may not be acceptable on smaller holdings forfinancial reasons. Also, additional fencing between holdings may be a hazard for foresterkangaroos, as they can get caught in fencing wire.
3. Unsustainable culling
Unsustainable culling of populations of forester kangaroos as competitors for crops and pasturesplaces pressure on those populations.
However, it is important to recognise that the survival of the forester in its remaining range is inpart due to the goodwill and efforts of individual landowners.
Status and management of the forester kangaroo in Tasmania
5 LANDOWNER INFORMATION AND OPINIONS
5.1 Introduction
In 1999, a questionnaire (Appendix 1) was sent out to landowners and managers (from here on,the term “landowners” is used) in order to:
1. Determine more accurately the range of the forester kangaroo.2. Ascertain landowner perceptions of population trends.3. Establish what impact the foresters are having on properties within their range.4. Gather ideas on how the forester kangaroo could be better managed and conserved in the
future.
5.2 Methods
Landowners within the range of the forester kangaroo were identified using the Department ofPrimary Industries, Water and Environment (DPIWE) Land Information Services database.Many properties had multiple titles, resulting in multiple questionnaires being sent to somelandowners. Thus, it was difficult to ascertain how many individual landowners receivedquestionnaires, but this is estimated to be about 280. Respondents were given the option toremain anonymous, but only 3% chose to do so, with a further 2% withholding their name butgiving the property name. There were no reminder notices sent out, but a follow-up letter wassent to twenty of the 158 respondents to ask for further comments on the crop protection permitsystem.
5.3 Results and Discussion
Of the 280 questionnaires sent out, 158 were returned (56%), covering properties with a totalarea of over 311 000 hectares. The response of landowners was very positive, with only 14% ofthose respondents with forester kangaroos on their land reacting negatively to the species. Fiftypercent of respondents with forester kangaroos on their property liked them as long as they arekept at an acceptable level, and 36% of respondents with forester kangaroos were positivetowards them without conditions.
Estimating the forester kangaroo range
Of the respondents, 36% had never had foresters on their property; 11% had foresters in the past;and 53% currently have forester kangaroos on their property (this 53% covers 85% ofrespondents' land). It was found that the range was larger than expected, indicating that theextent of properties surveyed by questionnaire was not large enough to encompass all of the landon the borders of the forester kangaroo range. The distribution of forester kangaroos revealedby this survey is mapped in Appendix 2. It proved impractical to gather information from eachrespondent about exact localities of kangaroos within their properties, so information has beengeneralised to cover the entire property, rather than just those parts where kangaroos actuallyoccur.
Status and management of the forester kangaroo in Tasmania
Perceptions of population trends
Landowners with forester kangaroos on their properties (53% of respondents) were asked howthe numbers had changed in the last five years. Fifty five percent of respondents in the Nileregion said that numbers had increased, 23% said numbers had remained constant, 18% thoughtnumbers had decreased, and the remainder were unsure (Graph 1). In the Ross area, 29% ofrespondents stated that foresters have increased, 36% said numbers had remained stable, 17%said that numbers had decreased, and the remainder were unsure (Graph 2). In the Northeast,only 20% (i.e. 3 respondents) suggested there had been an increase in this period. Sixty percentsaid that numbers had stayed the same, and 20% were unsure. None felt that there had been adecrease (Graph 3).
In the Kempton area, where forester kangaroos were released in the 1970s, all respondents feltthat numbers had decreased. Sixteen percent of Kempton respondents (4 individuals) currentlyhave forester kangaroos on their properties, though the numbers are declining, and a further 20%(5 individuals) have had them in the past, but not any longer.
Impact of forester kangaroos on farms within their range
The 53% of respondents who had forester kangaroos on their property were asked what damage,if any, these animals cause. Many respondents recorded two or three types of damage, but over20% said that there was no noticeable damage. The types of damage listed by landowners, andthe numbers of landowners who listed them (only those landowners with kangaroos on theirproperties) are as follows:
♦ damage fences, usually by breaking or stretching the wire (70%)♦ eat improved pasture (55%)♦ damage/eat crops (29%)♦ damage establishing trees (1%)♦ drink stock water (1%)♦ disturb stock when feeding (1%)♦ disturb lambing sheep (1%)♦ transfer weed seed and disease between properties (1%)♦ cause damage to cars on the road (1%)
Landowner comments on management and conservation of forester kangaroos in thefuture
Landowners’ suggestions for the future management and conservation of the forester kangaroohave been summarised into 38 general statements, which are listed in Appendix 3. The morecommon suggestions are listed below.
1. Twenty four percent suggested something similar to the current management system, inwhich the forester kangaroo is protected, but culling is allowed, in order to achieveacceptable numbers.
Status and management of the forester kangaroo in Tasmania
2. Fourteen percent suggested that forester kangaroos should be protected on, or restricted to,Crown Land or National Parks, while 8% thought that forester kangaroos should beprotected on, or restricted to, unimproved grazing land or bush.♦ There are considerable difficulties associated with restricting kangaroos to any area, even
if the philosophy was acceptable to other landowners, the DPIWE and the community.
3. Ten percent said that they would like to see a sustainable number of kangaroos protected.♦ This is consistent with the aims of this agency.
4. Five percent would like to see the populations supplemented, or have animals introduced toother parts of the State, while 6% would like to have the forester kangaroo range restricted toits present boundaries.
♦ The DPIWE does not intend to relocate forester kangaroos.
5. Five percent suggested that landowners should be financially compensated for havingforester kangaroos on their properties.
♦ See paragraph on the Wildlife Credits Fund Project Proposal in section on Management.
6. Five percent would like to see forester kangaroos managed by way of a Property BasedGame Management Plan with the DPIWE.
♦ See Management section, which proposes revisions to crop protection permits for cullingkangaroos.
In addition, several landowners have suggested that the current culling system does not meettheir needs, and some landowners have pointed out that management of the forester kangarooneeds to be workable for landowners so that people are not tempted to do the wrong thing.Landowners said that permits are not issued fast enough, or for a long enough period to dealwith the problem at hand, and there is too much administration involved in acquiring permitsand distributing them to shooters.
Several landowners would like to be able to manage their own forester kangaroo populationswithout involvement from the DPIWE. However, as forester kangaroos are wholly protected,the agency is responsible for enforcing the legislation, and therefore permits are required. Theproposed changes to the permit system should satisfy the needs of most landowners, withoutcompromising the responsibilities of the DPIWE or the conservation of the forester kangaroo.
5.4 Relationship between landowners and the DPIWE
The landowners’ positive response to the questionnaire shows an interest in the issue of foresterkangaroo management and a willingness to co-operate with the agency. It is significant that30% of respondents (covering 56% of respondents' land) have Property Based GameManagement Plans with the DPIWE.
The agency is fortunate that such a large proportion of people involved has shown interest andco-operation, and is taking advantage of this by making an increased effort to co-operate withlandowners. Over the last few years, public consultation has become a crucial management toolfor dealing with environmental and social issues, and it is no longer appropriate for decisions tobe made without consultation with the people who will be affected. The initial contact via thequestionnaire has the potential to form the beginnings of a strong relationship between some of
Status and management of the forester kangaroo in Tasmania
the landowners/managers and the agency. For example, some of the respondents, who showed aparticular interest in the management of the forester kangaroo, were asked to supply furthersuggestions for revisions to the Crop Protection Permit policies.
The relationship between landowners and the DPIWE remains one of the most pertinent issuesto successful conservation and management of the forester kangaroo in Tasmania.
Status and management of the forester kangaroo in Tasmania
6 THE FIELD SURVEY
6.1 Introduction
Assessing trends in the population and culling levels are important elements of managing apopulation that is regularly culled (Southwell et al. 1995), such as the forester kangaroo.Southwell (1989) recommends that the line transect count method, with observers walking alongrandomly or independently located transects, is potentially the most accurate transecting methodfor estimating macropod population density.
Line transect counts of macropod populations are best suited to sparsely or moderately woodedcountry, as dense shrubby vegetation hinders inconspicuous movement by the observer,potentially forewarning the kangaroos of his or her approach and allowing kangaroos to moveaway unseen and unheard. Line transects are also best suited to populations of low to moderatedensity, because with dense populations, animals fleeing from the observer may cause othersfurther along the line to flee unseen (chain flushings) or these animals may be confused withuncounted animals (Southwell 1989). For both these reasons, the Tasmanian population offorester kangaroos is an ideal subject for the line transect method: they occur in moderatelywooded country, and occur at a moderate density. It is not possible to undertake aerial surveysin Tasmania, because much of the forester kangaroo habitat is at least lightly wooded, soanimals are not visible from the air.
In assessing the conservation requirements of the forester kangaroo, population size per se is ofless significance than trends in population size and range (Wapstra 1976). The key to successfulmanagement of the population is to find a balance between damage mitigation culling andconservation of forester kangaroos. Exact numbers need not be known to establish such abalance. In fact, exact numbers would prove somewhat meaningless, except to use incomparisons with populations on the mainland of Australia. The method used here isinappropriate for determining an actual density of forester kangaroos, but gives a reliable indexof trends in the population. However, total numbers are of interest to many farmers whose landsupports populations of forester kangaroo. To find a reasonable estimate of density, it would benecessary to design a survey specifically for this purpose. The benefits of this activity areunlikely to outweigh the costs (see Appendix 4), especially since the accuracy of densityestimations is often questioned (McNamara 1986).
6.2 Methods
Three core regions where forester kangaroo populations occur were identified in the late 1970s,and the long-term study areas used for the transects were established within these areas (Fig. 3):♦ Nile region (established in 1980)♦ Ross region (1980)♦ Northeast region (Mt William National Park and surrounding private) (1983)
In 1999, three additional areas were surveyed to provide baseline data and allow comparisonwith the long-term areas (Fig. 3):♦ West of Campbell Town♦ South of Avoca♦ North of Gladstone
Status and management of the forester kangaroo in Tasmania
Forester kangaroos are grazing animals that prefer grassland, woodland and open forest. Theysometimes move into cleared country to feed, but generally remain within 500 metres of forestedges. Areas with substantial tree or shrub cover are avoided. Suitable habitat can thus bebroadly described by a combination of topographic and vegetation criteria.
The Tasmap 1:100 000 map series was used to position the transects for the long-term studyareas. Information from the questionnaires helped to decide where to establish the additionalstudy areas in 1999, which were based on the Tasmap 1:25 000 map series.
Six to eight transects between 5 and 12 km in length were established at each study area,designed to traverse the core forester kangaroo range within each population. The transects ranon either west-east gridlines (Ross and Campbell Town); north-south gridlines (Avoca andGladstone); or on a south-west to north-east orientation (Nile and Northeast). Surveys wererepeated on 2 to 3 successive days. During each survey, all transects were surveyed on foot eachday. Each observer, unaccompanied, surveyed two transects per day. The transects were walkedat an average speed of 3-4 km/hr, commencing at around 9 am and being completed by 4 pm.The Tasmap 1:25 000 series maps, and compasses, were used for navigation.
All native and feral mammal species seen were noted together with the following information:
♦ Number of individuals.♦ Sex of each animal.♦ Whether individual was juvenile or adult, determined by size.♦ Distance from the observer to the animals as measured by range-finders (“Ranging-1200”
paralax rangefinder up to 1999; and two Bushnell Compact 600 laser rangefinders in 1999).♦ Angle between the line of the transect and the sighting.♦ Vegetation in which the sighting occurred.♦ Activity of the animal when sighted.
Ross and Nile transects were carried out yearly between 1980 and 1986; biennially between1986 and 1994, and were not repeated again until 1999. Transects in the Northeast were carriedout annually between 1983 and 1986, and repeated in 1993, 1999 and 2000. Surveys took placebetween July and September.
6.3 Transect locations
The locations of transects are shown in Fig. 3. The Midlands region (encompassing the Rossand Campbell Town study areas in the south, and the Nile and Avoca study areas in the north) isall under private ownership and used for grazing sheep and cattle. The grazing properties in theMidlands are generally large by Tasmanian standards (2 000 - 10 000 hectares). They consist ofcleared paddocks of improved pasture and bush runs with extensive areas of open forest. TheNortheast region (encompassing the Northeast study area and the Gladstone study area) ismostly under private ownership, though the Mt William National Park comprises about 14 000ha. The balance of the Northeast population is covered by two large properties, making up 30-000 ha. The areas of forest in the Northeast are less extensive than those of the Midlands, andmany of those that are present have a dense understorey of heathy shrub species.
Status and management of the forester kangaroo in Tasmania
NileThe Nile Plateau forms the northern core range for forester kangaroos in the Midlands, and is anarea of approximately 105km2 of woodland and open forest with a grassy understorey,surrounded by improved pasture. Eight transects were surveyed three times by four people overthree consecutive days (Appendix 5, Map1).
RossThe Ross area forms the southern core range for forester kangaroos in the Midlands. The areacovers 216km2, and is composed of woodland and open forest with a grassy understorey,interspersed with patches of improved pasture. It is bounded to the west by cleared pasture land,and to the east by denser forest unsuitable for forester kangaroos. Eight transects were surveyedby four people three times over three consecutive days (Appendix 5, Map 2).
NortheastThe long-term study area in the Northeast covers 80km2, and comprises the northern section ofMt William National Park, and the private property surrounding it to the north and west. Itconsists of woodland, open forest, heathland and scrub, with some areas of improved pasture.Eight transects were surveyed three times by four people over three consecutive days except in1999, when six transects were surveyed twice by three people over 2 consecutive days(Appendix 5, Map 3).
Campbell TownSix transects of 7-8 km each were placed along east-west gridlines, running west from AshbyRoad (Appendix 5, Map 4). The transects, covering 96 km2 of open forest and woodland with agrassy understorey, crossed several properties and were surveyed by three people on twoconsecutive days in July 1999.
AvocaFour transects of 6-7 km each were placed on north-south gridlines, running south of Esk MainRoad (Appendix 5, Map 5). The transects were surveyed in July 1999 (by two groups of twopeople) only once, as no forester kangaroos were sighted. Four more transects were proposedfor the second day (see map), but were not undertaken due to bad weather.
GladstoneThis area is mostly covered by improved pasture, crops and heathland, but there are also sectionsof scrub and open forest present, more fragmented than those in the Midlands. In July 1999, twotransects of 10 km each were undertaken in the Aberfoyle Hills area (Appendix 5, Map 6) bytwo groups of two people. The transects were designed so as to utilise only half a day, so thattransport time from Hobart could be included in a two-day trip. Also, there appeared only to befew, if any, stretches of wooded habitat large enough to undertake long transects, like those inthe Midlands. The Gladstone transects were undertaken only once, as the second day wasutilised to undertake a reconnoiter on a neighbouring property, where not enough suitable habitatwas found for daytime line transect surveys. However, both of these areas could potentially besurveyed by standardized spotlight surveys to gain an index of abundance. This option wasexamined by accompanying local shooters who pointed out where forester kangaroos are mostabundant in the evenings (Appendix 5, Map 7).
Status and management of the forester kangaroo in Tasmania
6.4 Analysis
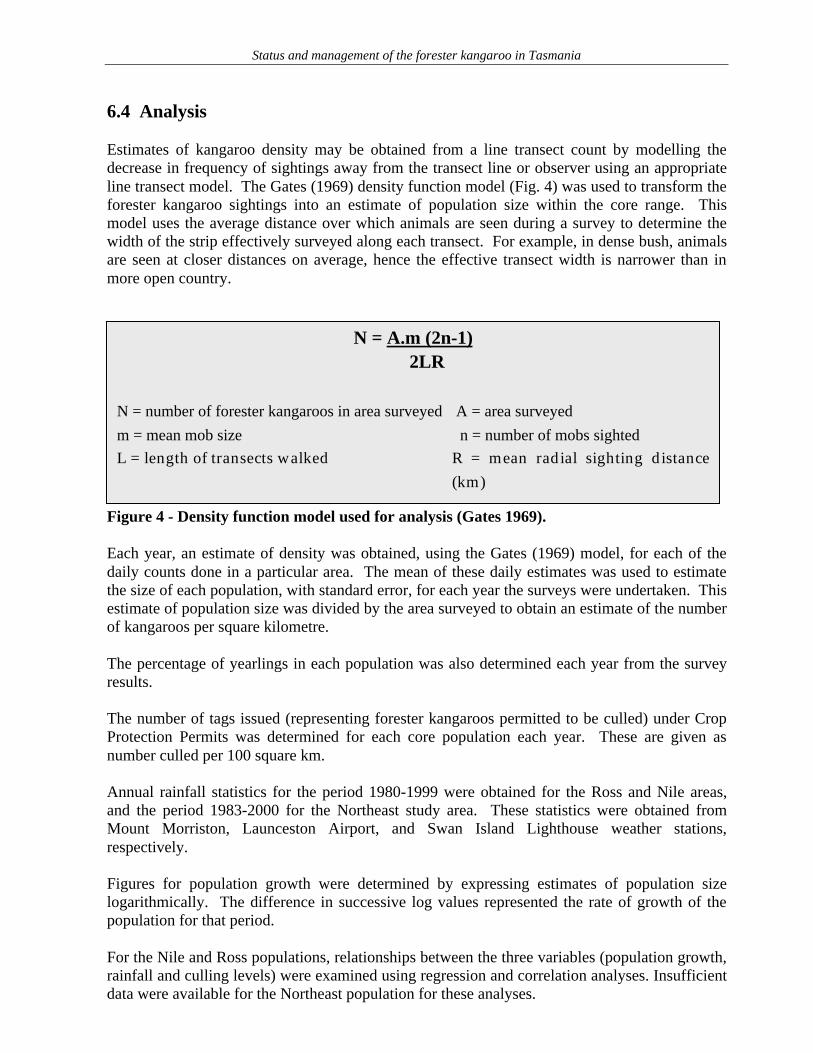
Estimates of kangaroo density may be obtained from a line transect count by modelling thedecrease in frequency of sightings away from the transect line or observer using an appropriateline transect model. The Gates (1969) density function model (Fig. 4) was used to transform theforester kangaroo sightings into an estimate of population size within the core range. Thismodel uses the average distance over which animals are seen during a survey to determine thewidth of the strip effectively surveyed along each transect. For example, in dense bush, animalsare seen at closer distances on average, hence the effective transect width is narrower than inmore open country.
Figure 4 - Density function model used for analysis (Gates 1969).
Each year, an estimate of density was obtained, using the Gates (1969) model, for each of thedaily counts done in a particular area. The mean of these daily estimates was used to estimatethe size of each population, with standard error, for each year the surveys were undertaken. Thisestimate of population size was divided by the area surveyed to obtain an estimate of the numberof kangaroos per square kilometre.
The percentage of yearlings in each population was also determined each year from the surveyresults.
The number of tags issued (representing forester kangaroos permitted to be culled) under CropProtection Permits was determined for each core population each year. These are given asnumber culled per 100 square km.
Annual rainfall statistics for the period 1980-1999 were obtained for the Ross and Nile areas,and the period 1983-2000 for the Northeast study area. These statistics were obtained fromMount Morriston, Launceston Airport, and Swan Island Lighthouse weather stations,respectively.
Figures for population growth were determined by expressing estimates of population sizelogarithmically. The difference in successive log values represented the rate of growth of thepopulation for that period.
For the Nile and Ross populations, relationships between the three variables (population growth,rainfall and culling levels) were examined using regression and correlation analyses. Insufficientdata were available for the Northeast population for these analyses.
N = A.m (2n-1) 2LR
N = number of forester kangaroos in area surveyed A = area surveyed
m = mean mob size n = number of mobs sighted
L = length of transects walked R = mean radial sighting distance
(km)
Status and management of the forester kangaroo in Tasmania
Regression analysis was used to examine the relationships between rainfall and numbers culledand rainfall and population growth (SAS Institute Inc. 1989). Time lags between occurrence andeffect were examined by performing several different analyses using different time scales. Onlythe period 1980-1986 could be analysed in this way, as it was the only period in whichinformation on population growth was available in consecutive years. The results for theseanalyses are presented in the form of the coefficient of determination, r2. This is a measure ofthe proportion of the total variation in the dependent variable explicable by its linear relationshipwith the independent variable.
Correlation analysis was used to examine the relationships between numbers culled andpopulation growth. This was undertaken in Microsoft Excel (Microsoft Corporation 1997). Theresults of these analyses are presented in the form of the Pearson correlation co-efficient (r).
6.5 Results
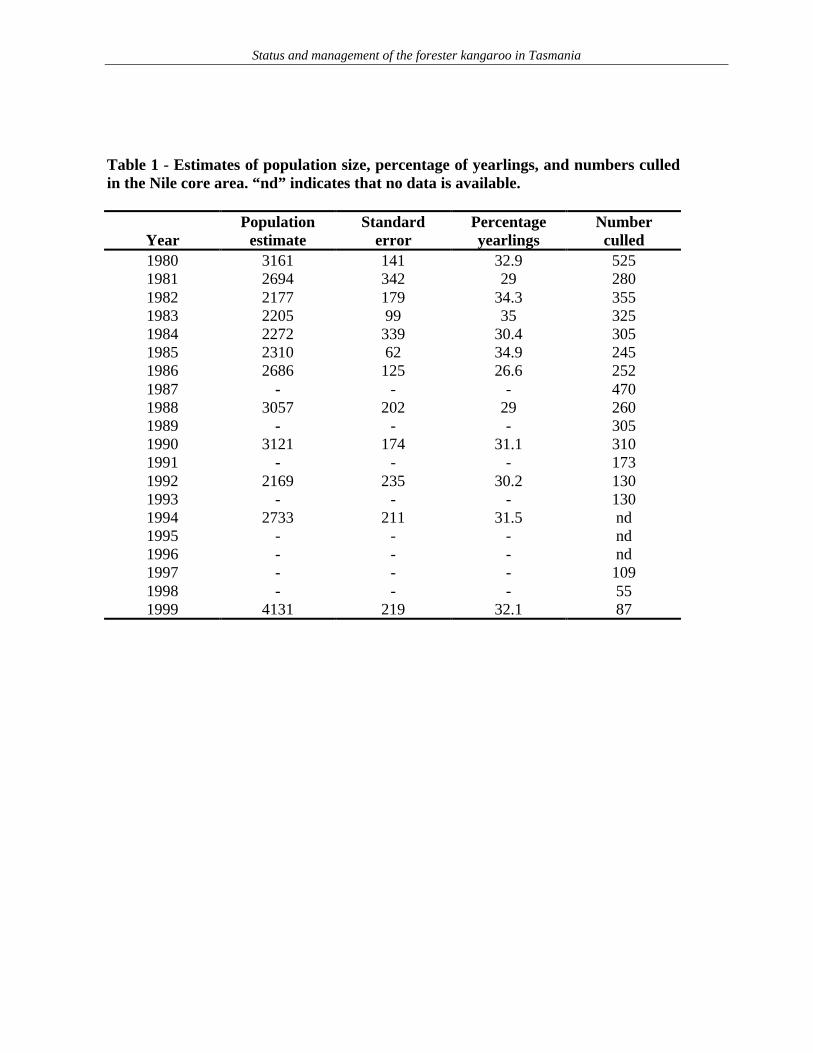
Estimates of population size, percentage of yearlings in the population, and numbers culled inthe Nile and Ross forester kangaroo populations between 1980 and 1999 are given in Tables 1and 2. Table 3 gives the same information for the Northeast between 1983 and 1999. Trends inpopulation size (expressed as the number of animals per km2), numbers culled per km2 andrainfall are given in the accompanying graphs (Graphs 4-6). A comparison of the relativedensity of kangaroos in each population is given in Graph 7.
During 1999, most of the transects were sampled on three consecutive days, and the precision ofpopulation estimates obtained was high, with a coefficient of variation equal to approximately7% at Nile and 8% at Ross indicating that population fluctuations of as little as 30% should bedetectable (Caughley 1979). However, the coefficient of variation for the Northeast was muchhigher, at 18%. Southwell (1989) found that low density populations require more effort insampling than high density populations, which may be the reason for the low precision for thisarea.
Status and management of the forester kangaroo in Tasmania
Table 1 - Estimates of population size, percentage of yearlings, and numbers culledin the Nile core area. “nd” indicates that no data is available.
Population Standard Percentage NumberYear estimate error yearlings culled1980 3161 141 32.9 5251981 2694 342 29 2801982 2177 179 34.3 3551983 2205 99 35 3251984 2272 339 30.4 3051985 2310 62 34.9 2451986 2686 125 26.6 2521987 - - - 4701988 3057 202 29 2601989 - - - 3051990 3121 174 31.1 3101991 - - - 1731992 2169 235 30.2 1301993 - - - 1301994 2733 211 31.5 nd1995 - - - nd1996 - - - nd1997 - - - 1091998 - - - 551999 4131 219 32.1 87
Status and management of the forester kangaroo in Tasmania
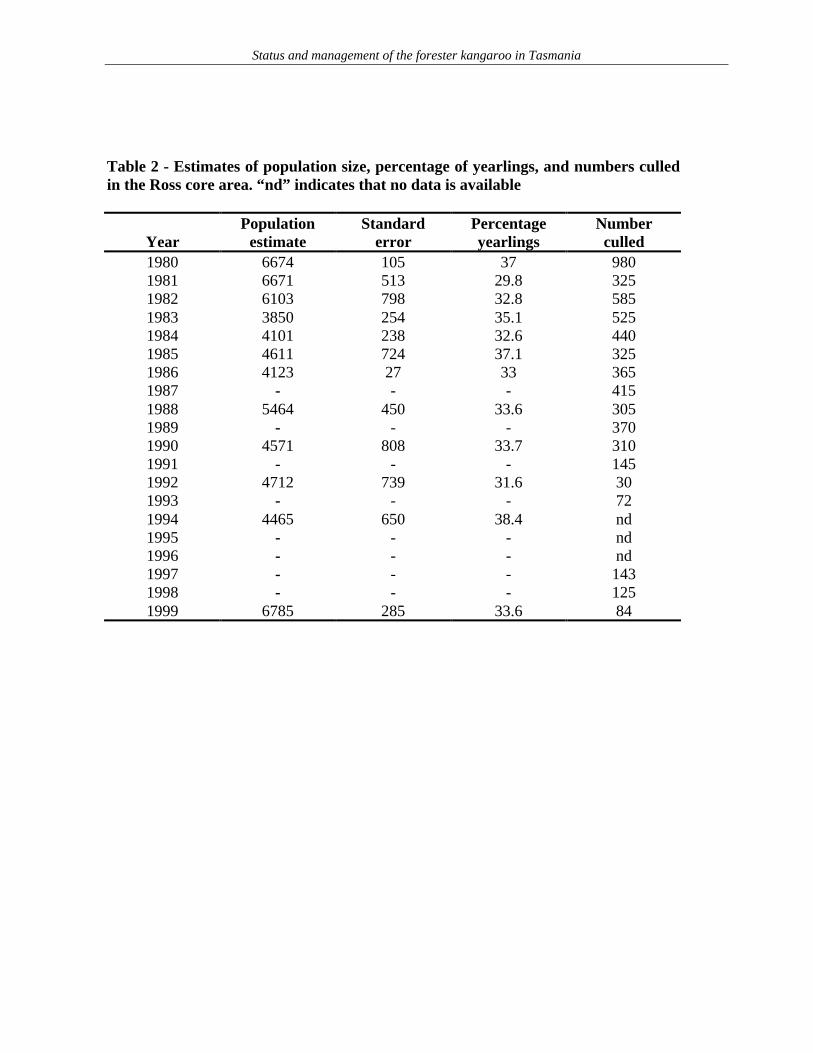
Table 2 - Estimates of population size, percentage of yearlings, and numbers culledin the Ross core area. “nd” indicates that no data is available
Population Standard Percentage NumberYear estimate error yearlings culled1980 6674 105 37 9801981 6671 513 29.8 3251982 6103 798 32.8 5851983 3850 254 35.1 5251984 4101 238 32.6 4401985 4611 724 37.1 3251986 4123 27 33 3651987 - - - 4151988 5464 450 33.6 3051989 - - - 3701990 4571 808 33.7 3101991 - - - 1451992 4712 739 31.6 301993 - - - 721994 4465 650 38.4 nd1995 - - - nd1996 - - - nd1997 - - - 1431998 - - - 1251999 6785 285 33.6 84
Status and management of the forester kangaroo in Tasmania
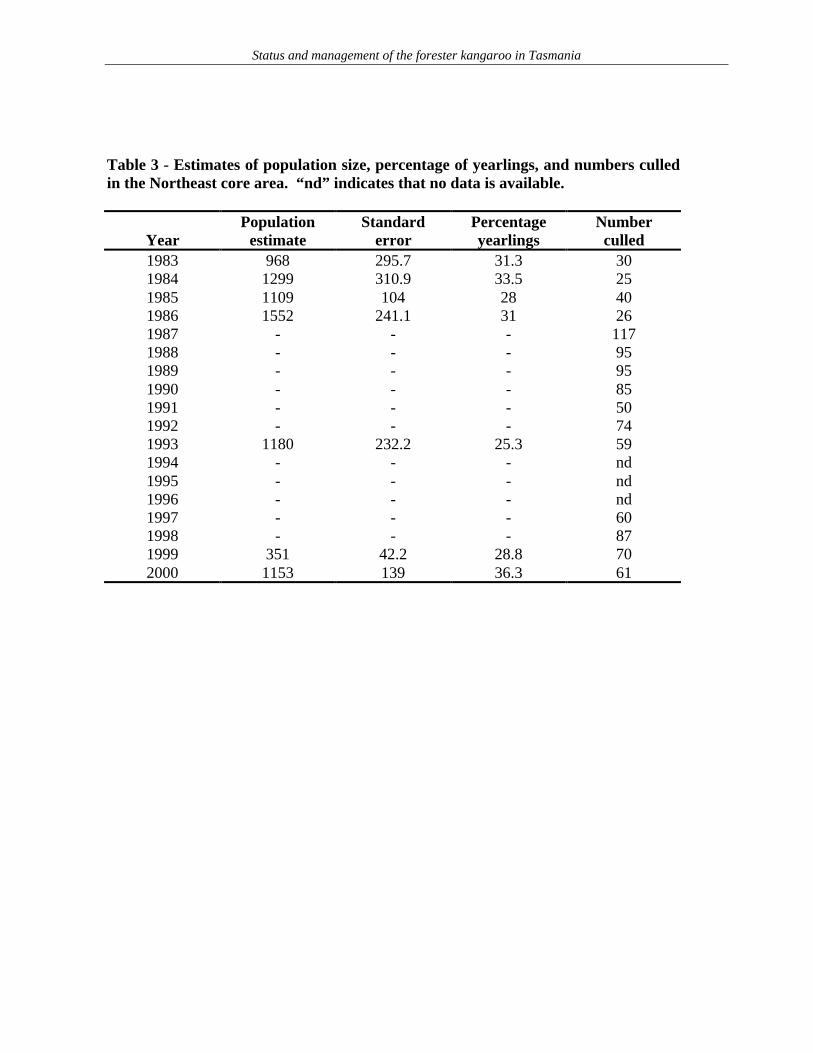
Table 3 - Estimates of population size, percentage of yearlings, and numbers culledin the Northeast core area. “nd” indicates that no data is available.
Population Standard Percentage NumberYear estimate error yearlings culled1983 968 295.7 31.3 301984 1299 310.9 33.5 251985 1109 104 28 401986 1552 241.1 31 261987 - - - 1171988 - - - 951989 - - - 951990 - - - 851991 - - - 501992 - - - 741993 1180 232.2 25.3 591994 - - - nd1995 - - - nd1996 - - - nd1997 - - - 601998 - - - 871999 351 42.2 28.8 702000 1153 139 36.3 61
Status and management of the forester kangaroo in Tasmania
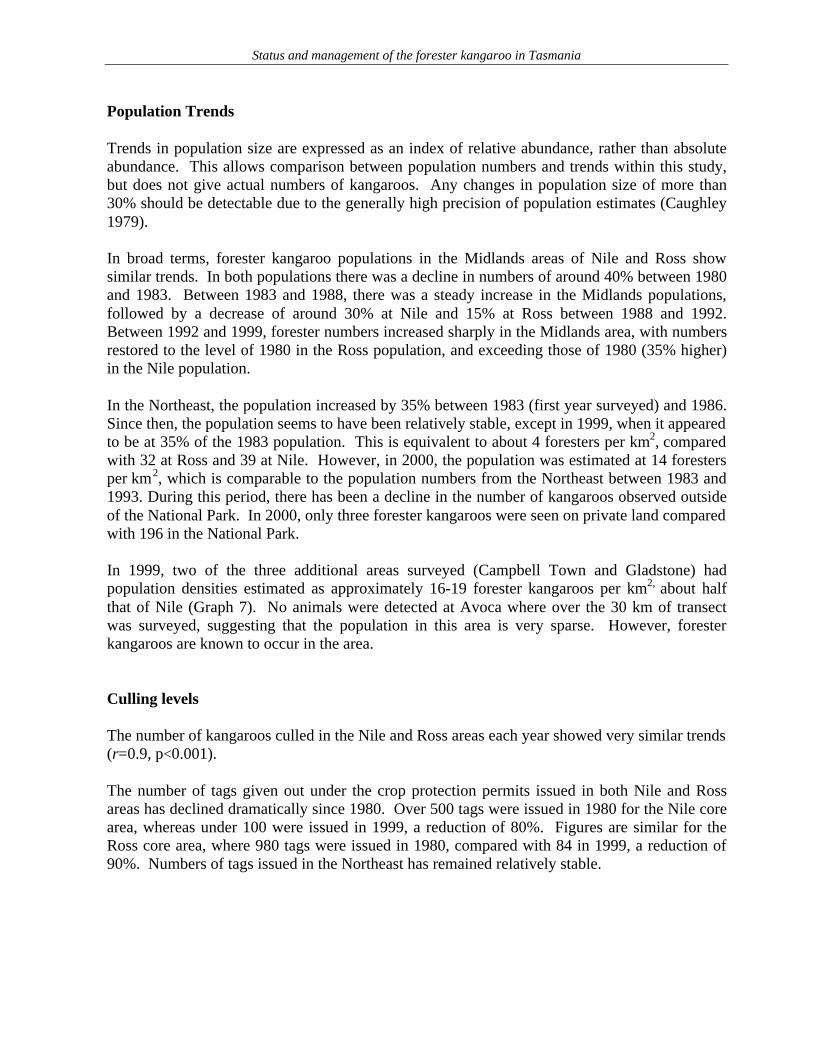
Population Trends
Trends in population size are expressed as an index of relative abundance, rather than absoluteabundance. This allows comparison between population numbers and trends within this study,but does not give actual numbers of kangaroos. Any changes in population size of more than30% should be detectable due to the generally high precision of population estimates (Caughley1979).
In broad terms, forester kangaroo populations in the Midlands areas of Nile and Ross showsimilar trends. In both populations there was a decline in numbers of around 40% between 1980and 1983. Between 1983 and 1988, there was a steady increase in the Midlands populations,followed by a decrease of around 30% at Nile and 15% at Ross between 1988 and 1992.Between 1992 and 1999, forester numbers increased sharply in the Midlands area, with numbersrestored to the level of 1980 in the Ross population, and exceeding those of 1980 (35% higher)in the Nile population.
In the Northeast, the population increased by 35% between 1983 (first year surveyed) and 1986.Since then, the population seems to have been relatively stable, except in 1999, when it appearedto be at 35% of the 1983 population. This is equivalent to about 4 foresters per km2, comparedwith 32 at Ross and 39 at Nile. However, in 2000, the population was estimated at 14 forestersper km2, which is comparable to the population numbers from the Northeast between 1983 and1993. During this period, there has been a decline in the number of kangaroos observed outsideof the National Park. In 2000, only three forester kangaroos were seen on private land comparedwith 196 in the National Park.
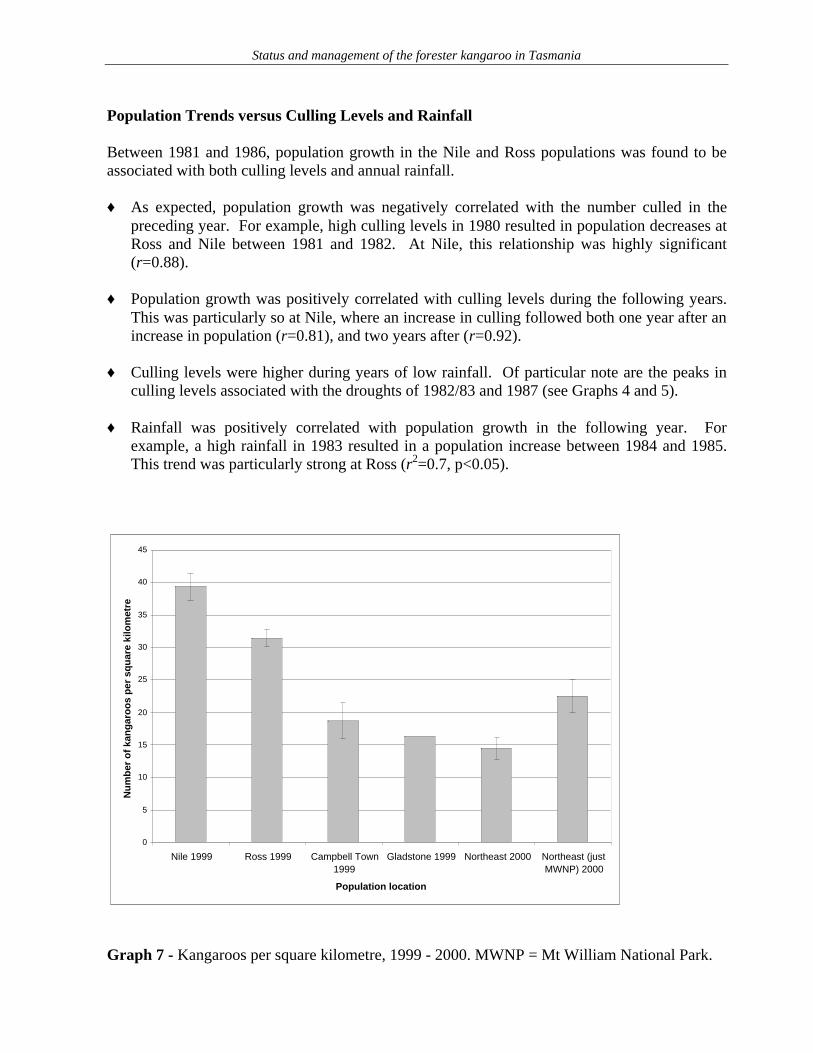
In 1999, two of the three additional areas surveyed (Campbell Town and Gladstone) hadpopulation densities estimated as approximately 16-19 forester kangaroos per km2, about halfthat of Nile (Graph 7). No animals were detected at Avoca where over the 30 km of transectwas surveyed, suggesting that the population in this area is very sparse. However, foresterkangaroos are known to occur in the area.
Culling levels
The number of kangaroos culled in the Nile and Ross areas each year showed very similar trends(r=0.9, p<0.001).
The number of tags given out under the crop protection permits issued in both Nile and Rossareas has declined dramatically since 1980. Over 500 tags were issued in 1980 for the Nile corearea, whereas under 100 were issued in 1999, a reduction of 80%. Figures are similar for theRoss core area, where 980 tags were issued in 1980, compared with 84 in 1999, a reduction of90%. Numbers of tags issued in the Northeast has remained relatively stable.
Status and management of the forester kangaroo in Tasmania
Population Trends versus Culling Levels and Rainfall
Between 1981 and 1986, population growth in the Nile and Ross populations was found to beassociated with both culling levels and annual rainfall.
♦ As expected, population growth was negatively correlated with the number culled in thepreceding year. For example, high culling levels in 1980 resulted in population decreases atRoss and Nile between 1981 and 1982. At Nile, this relationship was highly significant(r=0.88).
♦ Population growth was positively correlated with culling levels during the following years.This was particularly so at Nile, where an increase in culling followed both one year after anincrease in population (r=0.81), and two years after (r=0.92).
♦ Culling levels were higher during years of low rainfall. Of particular note are the peaks inculling levels associated with the droughts of 1982/83 and 1987 (see Graphs 4 and 5).
♦ Rainfall was positively correlated with population growth in the following year. Forexample, a high rainfall in 1983 resulted in a population increase between 1984 and 1985.This trend was particularly strong at Ross (r2=0.7, p<0.05).
Graph 7 - Kangaroos per square kilometre, 1999 - 2000. MWNP = Mt William National Park.
0
5
10
15
20
25
30
35
40
45
Nile 1999 Ross 1999 Campbell Town1999
Gladstone 1999 Northeast 2000 Northeast (justMWNP) 2000
Population location
Nu
mb
er o
f ka
ng
aro
os
per
sq
uar
e ki
lom
etre
Status and management of the forester kangaroo in Tasmania
6.6 Discussion
Population DensitiesMarked differences were observed in the relative density of forester kangaroo populations indifferent areas. The highest densities of 30-40 kangaroos per km2 were observed in the coreMidlands populations at Ross and Nile where densities were up to twice those in the Northeastand Gladstone study areas and higher than found in Mt William National Park (15-20 per km2).This difference is attributed to the better grazing conditions available in the grassy forests andwoodlands of the Midlands compared with the heathy forests and heathlands of northeasternTasmania.
By comparison, Southwell et al. (1997) estimated the density of eastern grey kangaroos in theeastern highlands of northern New South Wales and Queensland to be approximately 5 per km2.However, within this extensive area ground surveys of the type undertaken in Tasmania haverevealed populations of eastern grey kangaroos with densities comparable to those found inTasmania.
Population TrendsThe survey results provide evidence of a recovery in forester kangaroo numbers in the Ross andNile areas since 1992. This was associated with the policy of restricting culling levels, whichapplied from 1991 onwards. At Nile, this trend was likely to have been reinforced by theapprehension in 1994 of several poachers involved in the illegal taking of forester kangaroos.
In contrast, kangaroo numbers in the Northeast study area have remained fairly stable atapproximately 14 foresters per km2 between the early 1980s and 2000. The low estimateobtained during the 1999 survey of 4 foresters per km2 is considered questionable andattributable to inexperienced observers rather than reduced kangaroo numbers.
The proportion of yearlings in the three core areas has remained remarkably constant, at around30%, over the survey period. This contrasts markedly with the situation elsewhere in Australiawhere droughts have resulted in massive mortality among yearlings. For this reason, theTasmanian forester kangaroo population does not undergo the large fluctuations in numberswhich characterise kangaroo populations in drier parts of Australia (Hocking 1991). Mostimportantly, this lack of variation in the proportion of yearlings in the population suggests thatbreeding and survival of young are not significantly affected by rainfall.
Influences on Population TrendsCulling levels, have been identified as the major factor impacting on forester kangaroopopulation trends.
As expected, population growth was negatively correlated with the number of kangaroos culledin the preceding year. The population decline observed in the Midlands during the 1980s isattributed to high culling levels.
Culling levels, as measured by the number of tags distributed, in the Nile core area between1980 and 1990 accounted for 12% of the estimated population during that period, whereasbetween 1990 and 1999, culling accounted for only about 3% of the estimated population.Between 1980 and 1990, culling levels for the Ross population accounted for about 7% of theestimated population, and between 1990 and 1999, culling accounted for only 2% of the
Status and management of the forester kangaroo in Tasmania
population. Research undertaken elsewhere in Australia indicates that culling levels of up to20% are sustainable in grey kangaroo populations.
Culling levels were positively correlated with the level of population growth during thepreceding year. Thus, landowners react to high levels of kangaroos by requesting more cullingtags.
The level of culling was also influenced by rainfall. Although this relationship is notstatistically significant, high numbers of permits were requested in years of below averagerainfall. Low rainfall impacts on kangaroo populations in two ways, both of which increase thedemand by farmers for culling:1. Less native food is available, so that animals move from bush areas on to pasture in search of
food.2. Food available to stock is reduced, thereby increasing competition with kangaroos.
Changing land-use may mean that conflict with forester kangaroos may change. With the declineof the wool market, an intensification of farming in Tasmania can be expected. Increased use ofland for cropping is likely to result in forester kangaroos being attracted to the high-value cropsto feed, leading to more pressure to cull.
The level of poaching, although unknown, has been of concern for a number of years. Theresults of this study indicate that the amount of poaching is not currently so great as to produce adeclining population. It appears that poaching may have a significant effect on populationgrowth, however, as the population at Nile seems to have grown rapidly at some stage betweenthe 1994 and 1999 surveys, coinciding with the apprehension of two poachers in 1997.
6.7 Summary
Forester kangaroo populations at Ross and Nile suffered a decrease during the 1980s and early1990s, due to the high levels of culling which occurred in that period. These two populationshave now recovered from the decline in numbers. The Northeast population has remainedrelatively stable over the survey period (1983-2000), excluding the survey results from 1999,which appear to be an anomaly. Numbers of kangaroos on private land in the Northeast studysite, however, appear to be declining.
Forester kangaroo population growth has been determined by culling levels. Demand fromfarmers for culling is higher when kangaroo numbers are higher and during periods of lowrainfall when competition with stock for feed is greater.
Although there was a significant relationship between rainfall and population growth, it appearsthat forester kangaroos in Tasmania are not especially susceptible to drought, as the number ofyearlings has remained stable over the study period.
Status and management of the forester kangaroo in Tasmania
7 THREE HUMMOCK ISLAND AND RELATED ISSUES
7.1 Background
Forester kangaroos on Three Hummock Island
Approximately twelve forester kangaroos were introduced to Three Hummock Island, on thenorthwest coast of Tasmania, in 1975. The island is approximately 80 square km, and it isestimated that there are now 400-600 foresters on the island (R. Alliston, pers. comm. and S.Cronin, pers. comm.). Three Hummock Island has been a nature reserve since 1977, and iscurrently the focus for a modest ecotourism business "Three Hummock Island Escape", whichbrought 114 people to the island in 1999 and 123 in 2000.
A draft management plan for Three Hummock Island (Wilmott 1999) proposes that foresterkangaroos be "removed" from the Island, in order to allow a more natural ecosystem to re-establish. The management plan does not detail the method for removal, but given that the costof translocating these animals would be enormous, and translocation sites limited, it can beassumed that the proposal is to cull the animals.
Other than philosophical reasons, the main argument for removing forester kangaroos fromThree Hummock Island is a concern that a similar situation may arise to that at Maria Island, asdiscussed below.
The situation at Maria Island
Between 1969 and 1971, 45 forester kangaroos were introduced to Maria Island. By 1985, theforester kangaroo population was estimated at 2000 animals. This corresponds to a rate ofincrease of 27% per annum, which is similar to the Maximum Rate of Increase calculated for thewestern grey kangaroo in Kinchega National Park (Bayliss 1985).
The population crashed during the autumn/winter of 1987, and there was a major public outcryover what was widely seen as negligence on the part of the PWS in allowing this situation todevelop. Selective culling of sick and distressed animals was carried out in 1987, minimisingboth suffering to the affected animals, and concern to the public visiting the island, whileallowing natural processes to operate on the population, as far as possible.
However, by 1991, numbers had built back up to 1987 levels. In 1993, a vegetation survey wasundertaken, which found that browsing and grazing by macropods was having an unacceptableimpact on vegetation, causing regeneration failure of many trees, shrubs and herbs in grassyforest and heathland communities, and erosion problems along the foreshore and watercourses(Hocking 1998). A long-term and sustained culling program was introduced in 1994, whichaimed to reduce macropods to levels that did not cause significant damage to the vegetation ofthe Island. In the winter of 1994, 724 forester kangaroos were shot; less than 50% of thepopulation. Since then, numbers shot have been much lower (338 in 1995; 37 in 1997; 267 in1998; 25 in 1999 and 5 in 2000), but culling will need to be maintained so as to control damageby macropods.
Status and management of the forester kangaroo in Tasmania
7.2 Methods
A survey of the forester kangaroo population on Three Hummock Island was undertaken inOctober 1999. It proved impractical to obtain a population estimate, as much of the island iscovered in dense scrub. The only easily traversable parts of the island are those with improvedpasture or dune grasses and their associated communities. Two transect surveys wereestablished through this habitat in order to obtain an index of density.
Transect 1 originated at the homestead, and followed a bearing of 15 degrees magnetic north tothe secondary sand dune at the southwest end of West Telegraph Beach, where it changeddirection, and ran parallel to the coast, ending at the beach (Map 7, Appendix 5). This transectwas approximately 1.5 km in length. Transect 2 ran through a region known as Arizona Run,following the road, as marked on Map 7 (Appendix 5).
Another density index was taken by counting the forester kangaroos in the paddock between thetwo houses (marked on Map 7, Appendix 5) at dusk. This was done by standing in the middle ofthe paddock, just as it was almost too dark to see (7:30 pm in mid-October), and counting allkangaroos.
7.3 Results
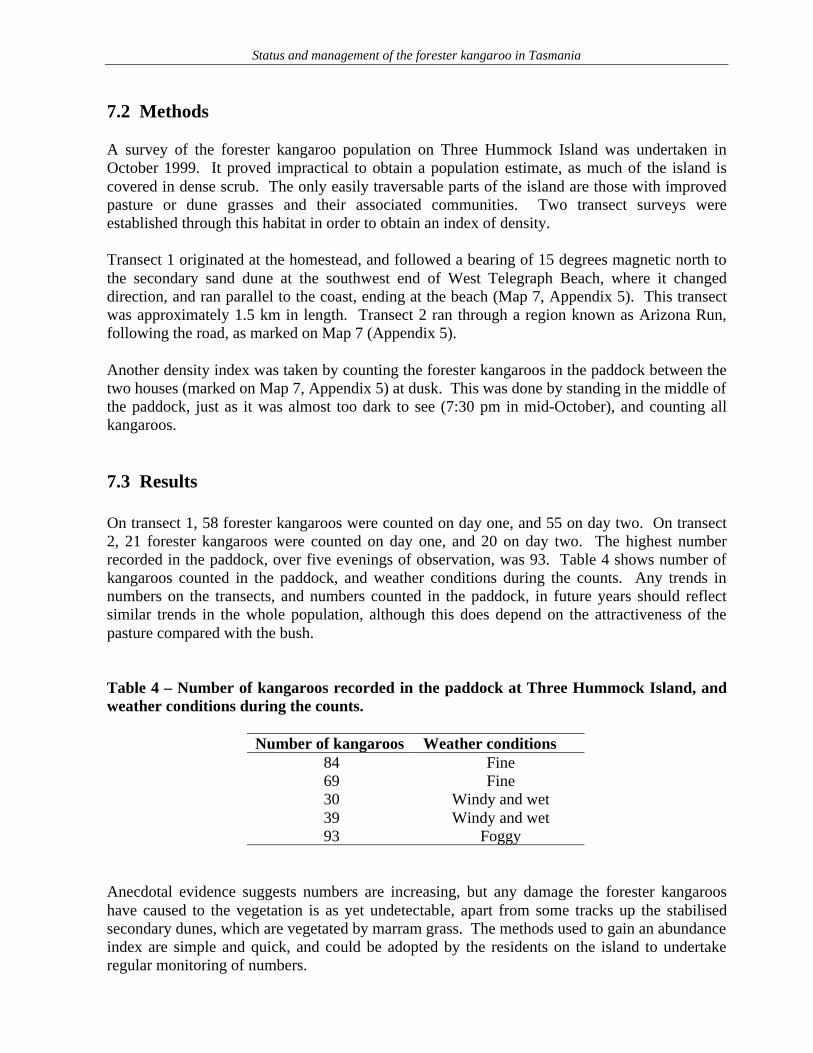
On transect 1, 58 forester kangaroos were counted on day one, and 55 on day two. On transect2, 21 forester kangaroos were counted on day one, and 20 on day two. The highest numberrecorded in the paddock, over five evenings of observation, was 93. Table 4 shows number ofkangaroos counted in the paddock, and weather conditions during the counts. Any trends innumbers on the transects, and numbers counted in the paddock, in future years should reflectsimilar trends in the whole population, although this does depend on the attractiveness of thepasture compared with the bush.
Table 4 – Number of kangaroos recorded in the paddock at Three Hummock Island, andweather conditions during the counts.
Number of kangaroos Weather conditions84 Fine69 Fine30 Windy and wet39 Windy and wet93 Foggy
Anecdotal evidence suggests numbers are increasing, but any damage the forester kangarooshave caused to the vegetation is as yet undetectable, apart from some tracks up the stabilisedsecondary dunes, which are vegetated by marram grass. The methods used to gain an abundanceindex are simple and quick, and could be adopted by the residents on the island to undertakeregular monitoring of numbers.
Status and management of the forester kangaroo in Tasmania
7.4 Discussion
A number of reasons have been put forward for eradicating the forester kangaroo population onThree Hummock Island. These include:
1. The introduction of forester kangaroos to the Three Hummock Island Nature Reserve was anunsound management decision at the time, and would certainly not be acceptable today,when nature reserves are viewed as natural environments with minimal human interference.
2. A situation similar to that at Maria Island may arise. That is, native vegetation could bedamaged by pressure from large numbers of macropods, thereby threatening conservationvalues of the island. Furthermore, the sight of large numbers of dead and starving animals asa result of a boom-and-bust cycle may distress visitors to the island.
3. The forester kangaroo may provide competition for the Tasmanian pademelon, Thylogalebillardierii, the only other macropod on the island. The pademelon is thought to have beenre-introduced to the island in 1900 (Hope 1973), but this may have been a supplement to anelusive population that had not become extinct. Although it may not be the originalpopulation, the species is probably native to the island (Hope 1973). However, it is doubtfulthat the pademelon population is threatened by forester kangaroos, as pademelons have out-competed forester kangaroos at other sites where they occur together.
There are several arguments against eradication of the kangaroo population:
1. Although introduction of forester kangaroos to the island is now considered an unsoundmanagement decision, the population continues to serve its original purposes as a reservepopulation to be drawn upon if the Tasmanian populations were to decline, and to providegenetic diversity.
2. A situation comparable to that at Maria Island is unlikely to occur, because the vegetationutilised by foresters on Three Hummock Island is largely introduced pasture and marramgrass, so that any damage to vegetation is unlikely to have a significant effect on theconservation values of the island. As yet, there is little sign of any damage to the vegetation,except on the stabilised secondary dunes where there are tracks through the marram grass,about 500 mm wide. There is no sign of any further erosion, such as dune blowouts,resulting from the tracks. The forester kangaroos appear to be in good health, and theimproved pasture on the island is thriving, although it was seen at its best (in mid-spring).
3. There are few other places in Tasmania where forester kangaroos can be observed at suchclose quarters in the wild. It is a good opportunity for visitors to Tasmania, and evenholidaying Tasmanians, to get a closer look at this Australian icon. Education of this sort islikely to lead to a better awareness and interest of conservation issues in general.
4. Most of the island is very densely vegetated, making eradication very difficult, timeconsuming and costly, particularly in terms of person-time. It must be considered that theremay be higher priorities for utilising the time of those DPIWE staff capable of shootingforesters, such as removing feral cats, goats, pigs and rabbits from other areas in Tasmania.
Status and management of the forester kangaroo in Tasmania
5. Since sheep were removed from the island in 1998, forester kangaroos have played anessential role in keeping the improved pasture under control, which dramatically reduces therisk of wildfire. Wildfire is a major issue for both the heritage values of the area, and theenvironmental values.
6. The proposal to eradicate forester kangaroos from Three Hummock Island is likely to be metwith opposition from conservation groups and individuals, and may also be viewedunfavourably by the general public. Unless there is proof that there are adverse effects onthe conservation values of the island, it is unlikely that these concerns will be allayed.
Status and management of the forester kangaroo in Tasmania
8 RECOMMENDATIONS FOR MANAGEMENT OF FORESTERKANGAROOS IN TASMANIA
8.1 Monitoring program
Monitoring population trends in the three core populations is vital to help the DPIWE to decideupon appropriate management regimes for the forester kangaroo. At present, in years when thelong-term surveys are run, at least 27 person-days are spent undertaking field work (3 peoplespending 3 days in each of 3 regions), and at least 6 person-days are spent preparing for the fieldtrips and analysing the data. This is a significant outlay of time, and it can be difficult to findpeople to participate in surveys. These large demands on resources have resulted in a five-yeargap between the last surveys and those undertaken in 1999. It is therefore recommended thatonly one of the three areas is monitored each year, rotating areas so that each one is monitoredevery three years.
In addition to the Campbell Town area, two more areas could be established and monitoredregularly to form a more comprehensive coverage of the forester kangaroo range. This wouldmean that instead of using single spotlight counts to decide how many permits to provide (whichtends to be unreliable), the DPIWE would have a better idea of trends and status of populationsin each area, on which a more well-founded decision could be based. However, areas that areunsuitable for transects, such as some properties in the Gladstone area, could possibly bemonitored for trends in forester population using more intensive standardised spotlight counts.
To improve repeatability of the surveys in future years, starting times and directions travelledshould be more standardised than they are at present, so that time of day has a smaller effect oncounts. Beginning in 1999, accurate bearings are now recorded so that in the future, aperpendicular model can be used to gain less biased estimates. The data will also continue beanalysed with a radial model to compare pre-1999 trends with post-1999 trends.
8.2 Culling program
It is recommended that an annual quota of tags be supplied to each landowner who requests apermit. Landowners will have 6 months to use tags. The number of tags distributed will bebased on the number allocated to that property in recent years, adjusted for any trends shown bythe field surveys. The total number of tags for a region will not exceed 10% of the populationestimated for that region. This will result in faster issuing of permits to landowners, althoughnumber of tags distributed will not necessarily increase. If additional tags are requiredthroughout the year, they may be applied for, and provided on the basis of a property inspectionincluding a spotlight survey, as currently occurs.
Landowners with Property Based Game Management Plans will have tags issued for a 12 monthperiod, to fit in with their permits for culling other animals such as deer and wallaby. This mayencourage landowners to develop Property Based Game Management Plans with the DPIWE,which will allow more support and advice to reach these landowners, providing moreopportunity for education on avoiding problems with forester kangaroos.
These three changes (making the process faster, co-ordinating forester kangaroo permits withother permits, and allowing more time for tags to be utilised) should satisfy the needs of most
Status and management of the forester kangaroo in Tasmania
landowners who responded to the questionnaire without compromising the responsibility of theagency to protect the species.
8.3 Management in the Midlands
All forester kangaroos in this region occur on privately owned land. To conserve the population,a balance must be maintained between the conservation requirements of the population, andreducing the problems that the forester kangaroos cause on private property. To be successfulwith this, it is crucial for the DPIWE, to form and maintain co-operative relationships with thoselandowners with forester kangaroos on their properties. Most landowners appear to be interestedin the welfare of this species, and it is of utmost importance that landowners are encouraged andprovided with advice and support regarding alternative ways to deal with forester problems.One way to do this is to continue to develop Property Based Game Management Plans forproperties in this region.
8.4 Management in the Northeast
The long-term survival of the forester kangaroo in the Northeast outside the Mount WilliamNational Park was predicted by Wapstra (1976) to be doubtful, due to the expected continuationof land clearing. Wapstra (1976) asserted that this was likely to result in further fragmentationof populations, possibly resulting in non-viable population levels. Unfortunately, this predictionappears to have become reality at least for the private land surveyed during this project. Duringtwo days of surveying the area in 1999, no forester kangaroos were seen on the privateproperties adjacent to the park, which form a substantial part of the transects. Only 3 foresterswere seen in this area in 2000. This may partly be due to the fragmentation of one of theseproperties, resulting in further clearing of refuges in the area.
Overall, however, numbers within the area surveyed have remained relatively stable in the last18 years, although there appeared to be a serious decrease in 1999, followed by a return tonormal levels in 2000. The density of kangaroos in the Northeast is considerably lower than inthe Midlands populations, and by no means could the Northeast population be said to bethriving. This could be partly due to the decline of the improved pasture in the national park,which has not been fertilized since the late 1980s.
The national park has significant value in that it provides long term security of habitat, thoughits significance in terms of numbers carried is at present limited. It is not appropriate for thepasture improvement program to be reinstated, as this would not be in accordance with theagency’s policy of discouraging exotic species in National Parks. Thus, fire managementremains an important aspect of management of the national park, as fire encourages regenerationof grasses, which provide food for forester kangaroos. An area of 4 600 ha was burnt patchily in1996 and 1997. The northern end of the national park is one of the next areas to be burnt, whichshould be beneficial to the kangaroos, as they inhabit this area in preference to the rest of thepark.
Status and management of the forester kangaroo in Tasmania
8.5 Three Hummock Island
In order to decide whether or not forester kangaroos should be removed from the island, furtherresearch needs to be undertaken. The vegetation on the island should be regularly monitored toenable adverse changes to be detected before any damage becomes irreversible, and the foresterkangaroo population should be monitored for health and trends in numbers. If substantialadverse effects are caused by an excess of forester kangaroos, it may be appropriate to eradicatethe species from Three Hummock Island, or initiate a long-term culling program similar to thatat Maria Island. Adverse effects may include damage to native flora; erosion of dunes/soils;threatening the Tasmanian pademelon population; and creating a boom-and-bust cycle, resultingoccasionally in large numbers of dead forester kangaroos, which may distress visitors to theisland.
8.6 Looking to the future
Recently, the DPIWE and the Midlands Bushweb Project have proposed the introduction of a“Wildlife Credits Fund Project”. This project would be an incentive scheme for private landmanagers for the conservation of native wildlife. The scheme would work by allowing theecosystem services that wildlife provides to be given an economic value, which would raise thestatus of wildlife from an economic threat to an economic benefit. Essentially, landownerswould be financially supported in managing their land for the conservation of wildlife. Thisfinancial support could come from: higher premiums for fauna-friendly products; wildlife credits(similar to carbon credits); sponsorship; and/or eco-tourism. The proposal is currently underconsideration for funding, and a prospectus is being developed. This project could possibly havemajor implications for the conservation of forester kangaroos in the future.
Status and management of the forester kangaroo in Tasmania
9 RECOMMENDATIONS IN SUMMARY
9.1 Monitoring
1. Monitoring of the core populations in the Ross, Nile and Northeast regions using transectsurveys should continue, with at least one core region monitored per year.
2. In addition to the Campbell Town transects, two further study areas should be established, inorder to get a better idea of trends in a broader area. One of these additional study areasshould be in the Northeast, where spotlighting could be substituted for transect surveys. Onenon-core region should be surveyed each year, beginning with the Northeast in the year2000.
3. The current field survey methods should be maintained in order to obtain population trends,rather than altering the method in order to get more accurate numbers. However, bearings(between the transect and the kangaroo) should be recorded accurately so that aperpendicular model can be used to estimate trends in the future.
4. Start times and points should be standardised to minimise the effects of time of day onnumbers of foresters counted.
5. Standardised spotlight counts of forester kangaroos should be investigated at “CapePortland” and “Rushy Lagoon”, and undertaken annually until trends become evident.
9.2 Culling program
6. An annual quota of tags will be distributed to those landowners who apply for permits. Thenumber of tags will be based on numbers given in previous years, and will depend on trendsas understood from transect surveys. Total number of tags distributed in each region will notexceed 10% of the estimated total population in that region. Those landowners with aProperty Based Game Management Plan will be given permits valid for twelve months inconjunction with other permits.
7. Additional tags beyond quota can be applied for, and will be considered. The decision willbe based on spotlight surveys of the property conducted on application for additional tags.
8. Education and support should be offered to landowners with regard to preventing conflictwith forester kangaroos, especially those landowners who plan to convert more pasture tocrops.
9.3 Mt William National Park and Northeast
9. The northern section of Mt William National Park should be subjected to a regenerationburn.
10. Enforcement activities aimed at minimising illegal taking of forester kangaroos should beincreased in the Northeast.
Status and management of the forester kangaroo in Tasmania
9.4 Three Hummock Island
11. Vegetation monitoring should be undertaken on Three Hummock Island in order to ascertainwhat the forester kangaroo impacts are.
12. An annual forester count could be undertaken by the lessees on Three Hummock Island, withtheir agreement. This count would be undertaken in the paddock, as described in themethods section, taking the maximum number over five or more evenings.
13. If impacts of forester kangaroos on Three Hummock Island are found to threatenconservation values of the island, culling or eradication should be considered.
Status and management of the forester kangaroo in Tasmania
10 ACKNOWLEDGMENTS
Steve Cronin provided much information and support, and his cheerful assistance in the fieldwas invaluable. Nick Mooney, Kris Clauson, Yuzuru Hyakatake, Christina Fischer, DavidJames, Jim Nelson, John Hayward, Luke Bond, Adam Smith, and Christopher and DanielHocking also gave up time to assist with fieldwork. Luke Bond and Graham Hall providedassistance with liaising with landowners.
Rob Alliston supplied information on the kangaroos at Three Hummock Island, and was agracious host. Steven Moore and Dave Probert kindly provided assistance with spotlighting.Sincere thanks go to Frank and Prue O’Connor, Barry Thorold, Hew and Jane Mills and MichaelGreen who generously provided accomodation during field trips and supplied informationregarding forester kangaroos on their properties. A number of other landowners and managersallowed access to their properties and some of them have done so for many years. The time andeffort contributed by all of these people, and also the 158 people who returned thequestionnaires, is greatly appreciated.
Graham Hall contributed a lot of time providing comments on the report, and Steve Cronin,Brett de Hayr and Fiona Lockett also made valuable comments on the text.
Status and management of the forester kangaroo in Tasmania
11 REFERENCES
Anon. (1971) Conservation and commercial exploitation of kangaroos. Interim report from theHouse of Representatives Select Committee and Wildlife Conservation, November 1971.Commonwealth Printing Office, Canberra.
Barker, R.D. and G. Caughley (1990) Distribution and abundance of kangaroos (Marsupialia:Macropodidae) at the time of European contact: Tasmania. Australian Mammalogy 13:157-166.
Bayliss, P. (1985) The population dynamics of red and western grey kangaroos in arid NewSouth Wales, Australia. I. Population trends and rainfall. Journal of Animal Ecology, 54: 111-125.
Burbidge A.A. (ed.) (1977) The status of kangaroos and wallabies in Australia. AustralianGovernment Printing Service, Canberra.
Caughley, G. (1979) Design for aerial census, Aerial Surveys of Fauna Populations, pp15-23.Australian Government Publishing Service, Canberra.
Cronin, S. (1998) Status and Management Priorities for the Forester Kangaroo in Tasmania: aFeasibility Study for a Community Based Conservation Project. Unpublished report.
Ellis, V.R. (1979) Louisa Anne Meredith: a tigress in exile. Blubber Head Press, Hobart.
Gates, C.E. (1969) Simulation study of estimators for the line transect sampling method.Biometrics 25: 317-328.
Hocking, G. (1991) An Assessment of Forester Kangaroo Surveys in the Midlands, 1980-1990.Unpublished report.
Hocking, G. (1998) Report on kangaroo and wallaby culling, Maria Island 1994 to 1998.Unpublished report.
Hocking, G.J. and M.M. Driessen (1996) Mammals of Northeast Tasmania. Records of theQueen Victoria Museum and Art Gallery, 103:163-168.
Hope, J.H. (1973) Mammals of the Bass Strait Islands. In: Bass Strait, it's coastal islands.Proceedings of the Royal Society of Victoria, 85:163-195.
Jackson, WD (1965) Vegetation. In: Atlas of Tasmania. Lands and Survey Department,Hobart.
McIlroy, JC (1982) The sensitivity of Australian animals to 1080 poison. III marsupial andeutherian herbivores. Australian Wildlife Research 9: 487-503.
McNamara, K (1986) Managing kangaroos: striking a balance. Landscope 2(1): 26-30.
Microsoft Corporation (1997) Microsoft Excel®1997 SR-2.
Status and management of the forester kangaroo in Tasmania
Pearse, RJ and JE Wapstra (1988) Conservation and Management of the Eastern GreyKangaroo, Macropus Giganteus, of Tasmania. Unpublished report.
Plomley, NJB (1966) (Ed.) Friendly mission: the Tasmanian journals of George AugustinusRobinson, 1829-1834. Tasmanian History Research Association.
SAS Institute Inc. (1989) SAS/STAT Users Guide, Version 6, Vol. 1 & 2. Carey, N.C, SASInstitute Inc.
Southwell, C (1989) Techniques for monitoring the abundance of kangaroo and wallabyPopulations. In: Kangaroos, Wallabies and Rat-kangaroos (eds P Jarman and I Hume). SurreyBeatty and Sons Limited, New South Wales, Australia.
Southwell, C (1994) Evaluation of walked line transect counts for estimating macropod density.Journal of Wildlife Management 58(2): 348-356.
Southwell, CJ; SC Cairns; R Palmer; R Delaney; and R Broers (1997) Abundance of largemacropods in the eastern highlands of Australia. Wildlife Society Bulletin 25(1): 125-132.
Southwell, C; KE Weaver; SC Cairns; AR Pople; AN Gordon; NW Sheppard and R Broers(1995) Abundance of macropods in north-eastern New South Wales, and the logistics of broad-scale ground surveys. Wildlife Research, 22:757-66.
Southwell, C and K Weaver (1993) Evaluation of analytical procedures for density estimationfrom line transect data: data grouping, data truncation and the unit of analysis, WildlifeResearch, 20: 433-444.
Wapstra (1976) Forester Kangaroo in Tasmania: Status and Management 1976, WildlifeDivision Technical Report 76/1, National Parks and Wildlife Service Tasmania.
Wilmott, G (1999) Three Hummock Island Nature Reserve Management Plan, draft(unpublished). Parks and Wildlife Service Tasmania.

Status and management of the forester kangaroo in Tasmania
Appendix 1 - QUESTIONNAIRE
Your Details (This section is optional. Confidentiality is assured)
1. Name:........................................................................................................... 2. If you are interested in being further involved, please provide your phone
number:................. ¨ I would be happy to be contacted by the Project Officer ¨ Please send me results of the questionnaire 3. Employment category (please tick all applicable boxes for this question)
Owner ¨ Farm Manager ¨ Other............................................... 4. Do you live on the property?
Yes ¨ No ¨ Other........................................................
Property Details (When showing areas, please show whether hectares or acres are used.)
5. Property name (optional):............................................................................... 6. Nearest Town:................................................................................................ 7. Total size of the property:............................................................................... 8. What do you farm?......................................................................................... 9. How much of your holding is either permanent pasture or cropping
land?............ 10. How much of your holding is either run country or unimproved pasture?.......... 11. How much of your holding is normally in crop?..............................................
12. Is your property covered by a Property-based Game Management Plan?
Yes ¨ No
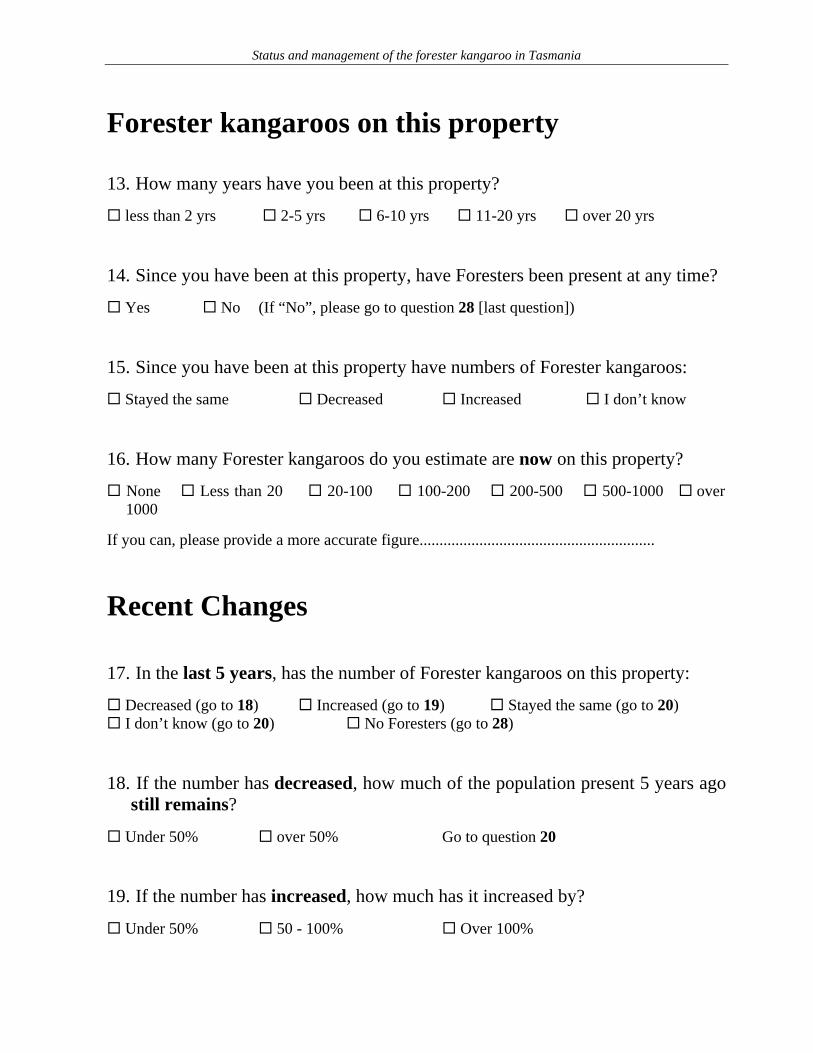
Status and management of the forester kangaroo in Tasmania
Forester kangaroos on this property 13. How many years have you been at this property?
less than 2 yrs ¨ 2-5 yrs ¨ 6-10 yrs ¨ 11-20 yrs ¨ over 20 yrs
14. Since you have been at this property, have Foresters been present at any time?
Yes ¨ No (If “No”, please go to question 28 [last question])
15. Since you have been at this property have numbers of Forester kangaroos:
Stayed the same ¨ Decreased ¨ Increased ¨ I don’t know
16. How many Forester kangaroos do you estimate are now on this property?
None ¨ Less than 20 ¨ 20-100 ¨ 100-200 ¨ 200-500 ¨ 500-1000 ¨ over1000
If you can, please provide a more accurate figure...........................................................
Recent Changes
17. In the last 5 years, has the number of Forester kangaroos on this property:
Decreased (go to 18) ¨ Increased (go to 19) ¨ Stayed the same (go to 20) I don’t know (go to 20) ¨ No Foresters (go to 28)
18. If the number has decreased, how much of the population present 5 years ago
still remains?
Under 50% ¨ over 50% Go to question 20
19. If the number has increased, how much has it increased by?
Under 50% ¨ 50 - 100% ¨ Over 100%
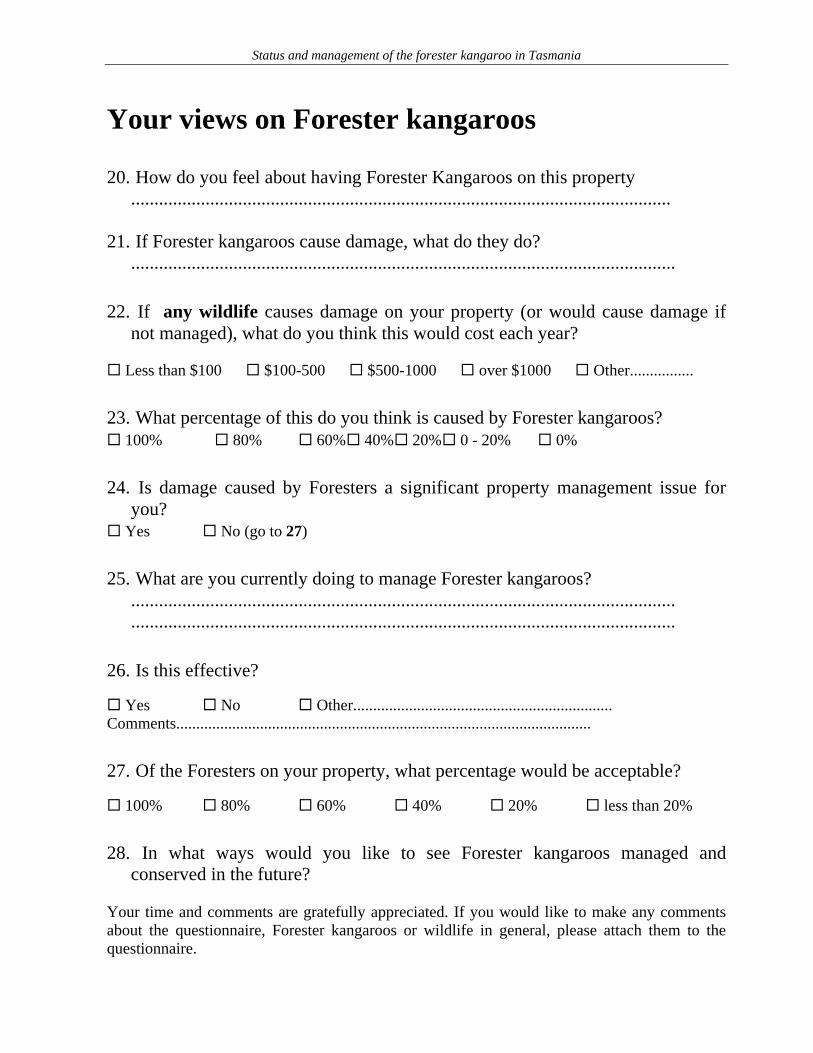
Status and management of the forester kangaroo in Tasmania
Your views on Forester kangaroos 20. How do you feel about having Forester Kangaroos on this property
.................................................................................................................... 21. If Forester kangaroos cause damage, what do they do?
.....................................................................................................................
22. If any wildlife causes damage on your property (or would cause damage if
not managed), what do you think this would cost each year?
Less than $100 ¨ $100-500 ¨ $500-1000 ¨ over $1000 ¨ Other................
23. What percentage of this do you think is caused by Forester kangaroos? 100% ¨ 80% ¨ 60%¨ 40%¨ 20%¨ 0 - 20% ¨ 0%
24. Is damage caused by Foresters a significant property management issue for
you? Yes ¨ No (go to 27)
25. What are you currently doing to manage Forester kangaroos?
.....................................................................................................................
.....................................................................................................................
26. Is this effective?
Yes ¨ No ¨ Other.................................................................Comments........................................................................................................
27. Of the Foresters on your property, what percentage would be acceptable?
100% ¨ 80% ¨ 60% ¨ 40% ¨ 20% ¨ less than 20%
28. In what ways would you like to see Forester kangaroos managed and
conserved in the future?
Your time and comments are gratefully appreciated. If you would like to make any commentsabout the questionnaire, Forester kangaroos or wildlife in general, please attach them to thequestionnaire.
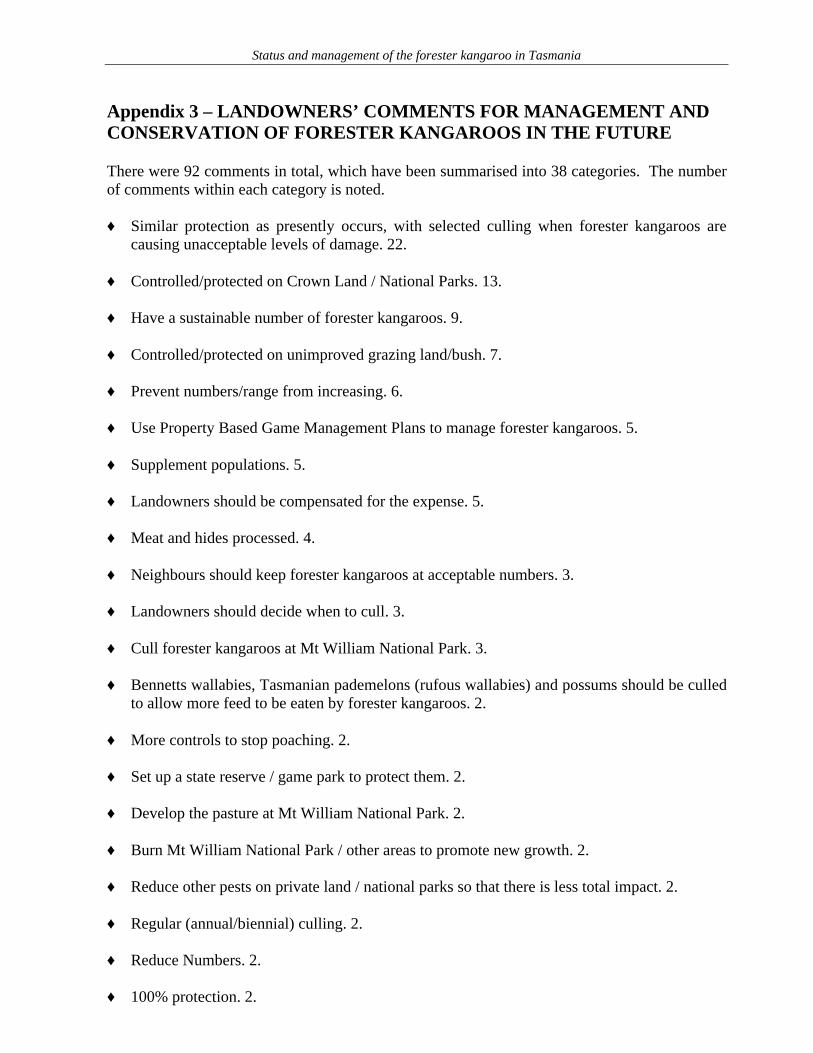
Status and management of the forester kangaroo in Tasmania
Appendix 3 – LANDOWNERS’ COMMENTS FOR MANAGEMENT ANDCONSERVATION OF FORESTER KANGAROOS IN THE FUTURE
There were 92 comments in total, which have been summarised into 38 categories. The numberof comments within each category is noted.
♦ Similar protection as presently occurs, with selected culling when forester kangaroos arecausing unacceptable levels of damage. 22.
♦ Controlled/protected on Crown Land / National Parks. 13.
♦ Have a sustainable number of forester kangaroos. 9.
♦ Controlled/protected on unimproved grazing land/bush. 7.
♦ Prevent numbers/range from increasing. 6.
♦ Use Property Based Game Management Plans to manage forester kangaroos. 5.
♦ Supplement populations. 5.
♦ Landowners should be compensated for the expense. 5.
♦ Meat and hides processed. 4.
♦ Neighbours should keep forester kangaroos at acceptable numbers. 3.
♦ Landowners should decide when to cull. 3.
♦ Cull forester kangaroos at Mt William National Park. 3.
♦ Bennetts wallabies, Tasmanian pademelons (rufous wallabies) and possums should be culledto allow more feed to be eaten by forester kangaroos. 2.
♦ More controls to stop poaching. 2.
♦ Set up a state reserve / game park to protect them. 2.
♦ Develop the pasture at Mt William National Park. 2.
♦ Burn Mt William National Park / other areas to promote new growth. 2.
♦ Reduce other pests on private land / national parks so that there is less total impact. 2.
♦ Regular (annual/biennial) culling. 2.
♦ Reduce Numbers. 2.
♦ 100% protection. 2.
Status and management of the forester kangaroo in Tasmania
♦ Advice from DPIWE. 2.
♦ Leave them as they are. 1.
♦ Licensed farming. 1.
♦ Improve fencing to keep them out of pasture. 1.
♦ Prevent forester kangaroos from being subjected to mass culling. 1.
♦ Retain more native grassland. 1.
♦ DPIWE assist in control of numbers. 1.
♦ Discussion with DPIWE on one-to-one basis or in small groups. 1.
♦ Sponsor pride in landowners who have forester kangaroos. 1.
♦ Make more landowners aware of Land For Wildlife. 1.
♦ Culled by Field and Game shooters. 1.
♦ Breeding program. 1.
♦ Tighter control over shooting. 1.
♦ Crop protection permits needs to be workable/easy to obtain so people are not forced to dothe wrong thing. 1.
♦ Educate public to take an interest in conservation. 1.
♦ Use DPIWE money for disease control of livestock. 1.
♦ Should be confined to areas that have traditionally been their habitat. 1.
Appendix 4 - EVALUATION OF METHODS USED IN FIELD SURVEY
Status and management of the forester kangaroo in Tasmania
Appropriate Measure of Abundance
There are three ways in which abundance can be measured (Southwell 1989):
1. As population size. This measure has a biological meaning only when the population has adistinct boundary.
2. As absolute density (the number of animals per unit area).3. As a density index. i.e., some measurable correlate of absolute density.
The accuracy of the surveys in this study, in estimating an absolute density, is open to question.Differential visibility (eg depending on mob size) as well as other potential biases mean thatestimates of absolute density should be used with caution. Other studies using this method ofsurvey suggest that an accuracy of around 30% can be expected (Southwell 1989).
Provided an appropriate index is used, relative indices of densities can be just as effective asmeasurements of absolute density in monitoring abundance (Southwell 1989). A density indexis appropriate for this study, as population trends are just as useful as absolute densities formaking sound management decisions. Since relative indices are far cheaper and easier to obtain(Southwell 1989), use of absolute estimates for monitoring would be wasteful of time andresources. Even though measurement of absolute density may be desirable (e.g. for comparingdensities to populations on the mainland of Australia), it is not beneficial enough to justify thecost.
The data from this study could not be used to obtain absolute densities, because the method useddoes not meet the assumptions of line transect surveys closely enough. However, failing theseassumptions does not invalidate estimation of a density index. As long as the method remainsconstant between surveys, the counts will still provide a valid density index for populationmonitoring (Southwell 1989).
Line Transect Assumptions
The three main assumptions for line transects are as follows:1. Animals on the line must never be missed (it is not of concern if all animals are not seen, as
long as those directly on the line are seen).2. Animals must not move large distances away from or toward the transect line before being
sighted, and animals must not be counted twice.3. Distances and angles must be measured accurately.
Kangaroos are not likely to move far before being seen if within the observer’s visual field.However, they are highly mobile and tend to avoid approaching humans, so that there is a highpossibility of undetected movement beyond the observer’s visual field, consequently resulting inthe violation of the first two assumptions. The failure of these two assumptions is exaggeratedby the method used in this study, because rather than walking 1 km per hour as has beensuggested (Southwell et al. 1997), we walked at the faster speed of 3-4 km per hour, whichmeans that it is likely that more noise is made, flushing the animals before they are seen, andless animals are likely to be seen, as more effort is required to navigate obstacles. The distanceswalked in our survey were also a possible cause for failure of all assumptions, due to tiredness(differential between observers) towards the end of the transect, making observations less likelyand measurements less accurate. Through a pilot study, Southwell et al. (1995) found that a
Status and management of the forester kangaroo in Tasmania
maximum of 10 km of transect could be walked consistently in a day, considering day length,ease of walking, time getting to and from a base to transects, speaking to landholders, and thecumulative fatigue of walking transects over several consecutive days. However, the routecould be up to 5 km from vehicular access, meaning an extra 10 km would be walked.
As densities of kangaroos increase beyond 30 kangaroos per km2, a density dependent negativebias is increasingly evident as the result of movement by animals in response to surveyors(Southwell et al. 1995). The relatively low density of forester kangaroos in most areas inTasmania means that the flushing of one animal/cluster is unlikely to cause flushing of others(chain flushing). Also, macropods tend to move away from the transect line at obtuse ratherthan acute angles, thus reducing duplicate sightings (Southwell 1994). However, in the coreregion at Nile, animals could be as abundant as 39 kangaroos per km2, which implies that therecould be a density dependent negative bias due to chain flushing. However, numbers may not bethis large, as the model used (Gates 1969) model is positively biased by about 30% (C.Southwell, pers. comm.).
Reactive movement can also lead to violation of the assumption relating to accuracy of distancesand angles. However, this is not such a problem in the areas studied here, as there are manylandmarks so that if an animal is flushed, distances and angles can be taken from a stationaryobject nearby the original position, such as a tree.
Repeatability and Precision
Accuracy is not an essential quality of an abundance index, but repeatability and precision aremore important (Southwell 1989). Repeatability depends on the variations in the conditions ofcounting, and precision is related to random errors associated with sampling. If the samplingeffort is inadequate, then abundance estimates will be imprecise and inferences about thepopulation can not be made with confidence (Southwell 1989).
Many factors are known to affect counts of macropods, including time of day, temperature,cloud cover and vegetation density. Because so many factors affect countability, it is difficult todetermine how repeatable counts of macropods are. Sightability is most affected by time of day,and possibly weather, through feeding and resting activities and related habitat use (Southwell etal. 1995). During the middle of the day, macropods generally rest, whereas in wet weather,macropods extend their feeding activity through the midday period (Southwell et al. 1995). Theeffects of many factors of countability can be negated by strict standardization of countingprocedures, but some factors are beyond control. Lighting and weather conditions can changewithin days and between days, and the ability to standardize for such variables is limited,especially in climates like Tasmania’s. It is sensible to standardize within limits and then ignorevariation beyond these limits. In future years, starting times and directions travelled should bemore standardised than they are at present, so that time of day has a smaller effect on counts.Unfortunately, there is no practical solution to standardising weather conditions.
Ideally, one attempts to obtain a very precise estimate of abundance (very low coefficient ofvariation) so that real trends are not masked by large sampling errors. However, this usuallyrequires a very large effort in counting, and a reasonable compromise between precision andeffort must be met. The effort required to obtain an estimate of specified precision is thesampling intensity. During this study, the transects were usually repeated three times, and theprecision of population estimates obtained was high, with a coefficient of variation equal to
Status and management of the forester kangaroo in Tasmania
approximately 7% at Nile and 8% at Ross indicating that population fluctuations of as little as30% should be detectable. However, the coefficient of variation for the Northeast is muchhigher, at 18%. Southwell (1989) found that low density populations require more effort insampling than high density populations, which may be the reason for the low precision for thisregion.
Placement of Transects and Stratification
One of the most important aspects in the design of a transect survey is the placement of transectswithin the survey area. Strict random placement is ideal theoretically, but impracticallogistically. The overriding practical principle for unbiased sampling is that the distribution oftransects is independent of the distribution of animals being surveyed. The transects for thisstudy were placed systematically. Because they are parallel and equally spaced, the design isunbiased (Southwell 1989).
Another important part of survey design is stratification. If the distribution of animals in asurvey area is clumped, the most precise estimate of density is obtained by dividing the area intostrata within which distribution is homogeneous and combining densities measured separately ineach strata (Southwell 1989). However, this is not as important for a density index, as long asthe strata remain constant. It does become a problem in determining a density index if the strataare altered from one year to the next, preventing repeatability. For example, if a large area ofwoodland is cleared, or some forest is burnt, visibility will be altered, and a greater proportion ofthe population will be sighted.
Estimators
To obtain an estimate of density from the data provided by the survey, one must have a model orestimator relating the data to true density. There are two types of estimators: radial andperpendicular. Radial models merely require the shortest distance between the animal andobserver, whereas for perpendicular models, bearings and radial distances are used to obtainperpendicular distances. During this study, until 1999, bearings were grouped into three levels,rather than being recorded accurately (ungrouped). Thus, it is not possible to transform theradial distances into perpendicular distances, so a radial model must be used. The Gates (1969)model has been used to obtain estimates of density for this study. Southwell (1994) found thismodel to be the most biased (positively) of all models, radial and perpendicular. Thus,population estimates in this study are likely to be overestimated, unless a negative bias hasoutweighed the positive bias. Beginning in 1999, accurate bearings are now recorded so that inthe future, a perpendicular model can be used to gain less biased estimates. The data will alsocontinue be analysed with a radial model to compare pre-1999 trends with post-1999 trends.
Analytical Unit
Because forester kangaroos aggregate into mobs, to ensure correct estimation of variance, thecluster should theoretically be the unit of measurement and analysis (Southwell and Weaver1993). Density is then calculated as the product of cluster density and mean cluster size. Adisadvantage of using clusters as the analytical unit is that the number of clusters detected willbe less than the number of individuals detected, and small sample sizes can lead to unreliable
Status and management of the forester kangaroo in Tasmania
estimation of density. Thus Southwell and Weaver (1993) prefer to use individuals as the basisof analysis, despite their aggregating into clusters, and risk unreliable estimation of variance.
Because this model assumes a non-clumped distribution of animals and forester kangaroos areclumped into mobs, calculations have been based on mobs, rather than individuals. Southwelland Weaver (1993) point out that it is difficult to obtain perpendicular distances for individualanimals within a cluster (i.e. mob) in the wild, as animals tend to flush when sighted.