statspune 1 methods of abundance estimation why count? concern about conservation lion / tiger...
TRANSCRIPT

STATSPUNE
1
Methods of abundance estimation
•Why count?•Concern about conservation
•Lion / tiger
•Assessment of resource base•Timber/ NTFP
•Assessment of threat to humans•Blackbuck count- farmers•Elephant count-villagers
•Estimating population and its growth•Estimate age – sex composition•Compare population with carrying capacity
A.P.Gore S.A.Paranjpe

STATSPUNE
2
•Non- standard methods•Waterhole census•Dung pile count•Bird count based on calls•Pugmarks method
•Standard methods•Capture- recapture•Nearest neighbor•Line transect
A.P.Gore S.A.Paranjpe

Estimation ofTiger Populationusing Pugmarks
A.P.Gore S.A.Paranjpe
• Pugmark - a single tiger paw print as a tracing / photograph taken from fixed height
•Pugmark Track Set – a series of paw prints from the same individual
A.P.Gore S.A.Paranjpe

STATSPUNE
5
Traditional method
•Locate pugmarks•Trace them onto paper•Record time and place•Visual comparison•Eliminate repeats•What is left is the count
• Criticism•No validation•No oscillation in count•Very low count of cubs•Subjective•Identifiability - questionable
A.P.Gore S.A.Paranjpe

STATSPUNE
6
• Pad
– 1. Area
– 2. Major axis
– 3. Minor axis
• Pug
– 4. Length
– 5. Width
• Distance
– 6. Toe 1 centre to Toe 2 centre
– 7. Toe 2 centre to Toe 3 centre
– 8. Toe 3 centre to Toe 4 centre
– 9. Pad centre to Toe 1 centre
– 10. Pad centre to Toe 2 centre
– 11. Pad centre to Toe 3 centre
– 12. Pad centre to Toe 4 centre
How to improve?Quantify shape and size
A.P.Gore S.A.Paranjpe

Pick parameters - of distances between centres of pad & toes using the previously measured centre X/Y's
A.P.Gore S.A.Paranjpe

STATSPUNE
8
•Establish objective criteria
•Factors possibly affecting a pugmark print•Substrate•Operator•Sex of animal•Locality•Inter-individual variation•Intra-individual variation
How to use measurements?
A.P.Gore S.A.Paranjpe

STATSPUNE
9
Experiments
•Substrate- same animal different substrates : Coimbatore•3 substrates- fine soil, wet mud, sand•Two animals only•ANOVA for each variable•Most variables show no effect
•Operators- same trail different operators: Melghat•Single trail•6 operators•3 prints each•ANOVA for each variable•Most varibles show no effect
A.P.Gore S.A.Paranjpe

STATSPUNE
10
•Sex- Pune, Coimbatore
•5 animals- 2 males, 3 females
•Several prints on each (total 100)
•Logistic regression : P= prob( a given animal is a female)
•3 measurements significant
•Pad center- Toe 1 center distance(X1)
•Pad center- Toe 2 center distance (X2)
•Toe 1 center- Toe 4 center distance (X3)
•Ln(p/(1-p)) =56.06 – 2.76X1 –3.56X2 –1.1X3A.P.Gore S.A.Paranjpe
STATSPUNE
11
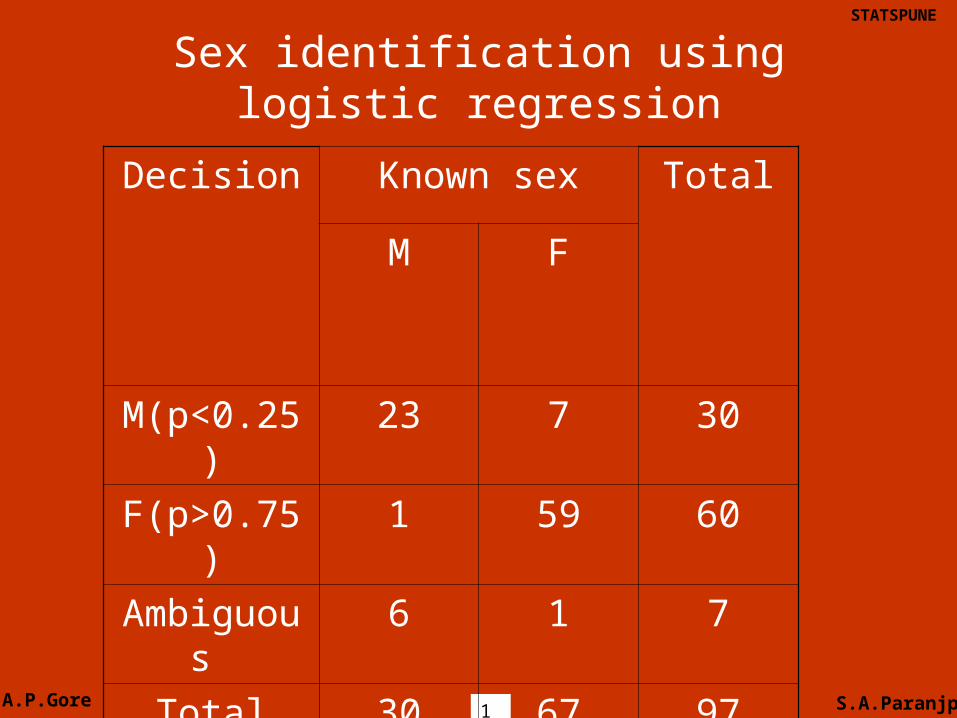
Sex identification using logistic regression
Decision Known sex Total
M F
M(p<0.25) 23 7 30
F(p>0.75) 1 59 60
Ambiguous 6 1 7
Total 30 67 97
A.P.Gore S.A.Paranjpe
STATSPUNE
12
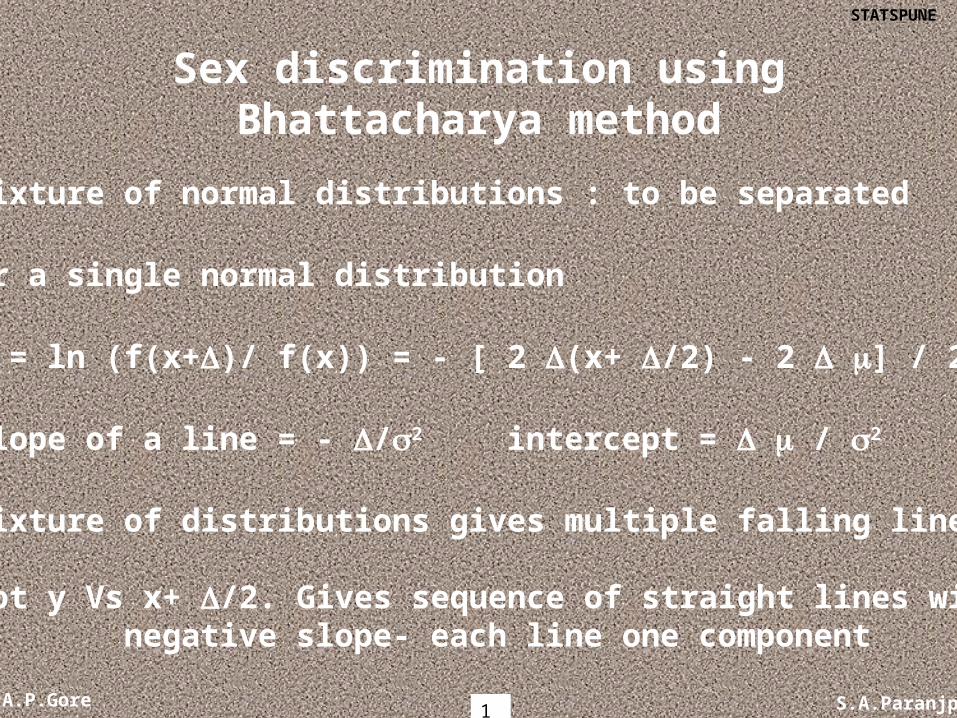
Sex discrimination using Bhattacharya method
• Mixture of normal distributions : to be separated
•For a single normal distribution
• Y = ln (f(x+)/ f(x)) = - [ 2 (x+ /2) - 2 ] / 2 2
• Slope of a line = - /2 intercept = / 2
• Mixture of distributions gives multiple falling lines
•Plot y Vs x+ /2. Gives sequence of straight lines with negative slope- each line one component
A.P.Gore S.A.Paranjpe

STATSPUNE
13
Histogram of mixture of two normal distributions
0
10
20
30
40
Bhattacharya plot
-1
-0.5
0
0.5
1
-2 0 2 4 6
A.P.Gore S.A.Paranjpe
STATSPUNE
14
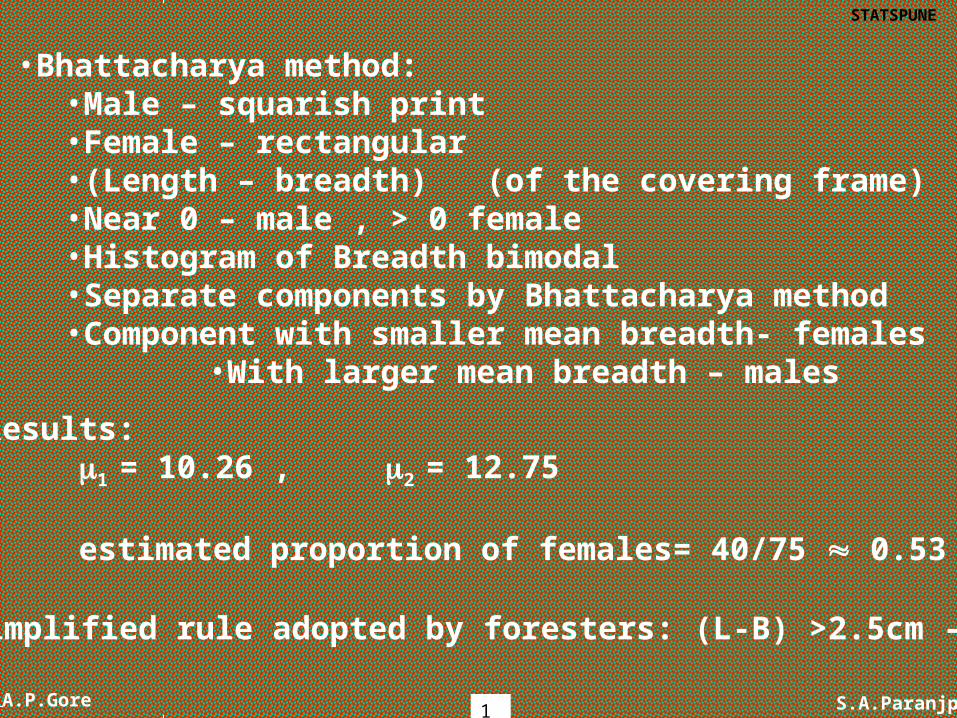
•Bhattacharya method: •Male – squarish print•Female – rectangular•(Length – breadth) (of the covering frame)•Near 0 – male , > 0 female•Histogram of Breadth bimodal•Separate components by Bhattacharya method•Component with smaller mean breadth- females
•With larger mean breadth – males
Results:1 = 10.26 , 2 = 12.75
estimated proportion of females= 40/75 0.53
Simplified rule adopted by foresters: (L-B) >2.5cm - female
A.P.Gore S.A.Paranjpe

STATSPUNE
15
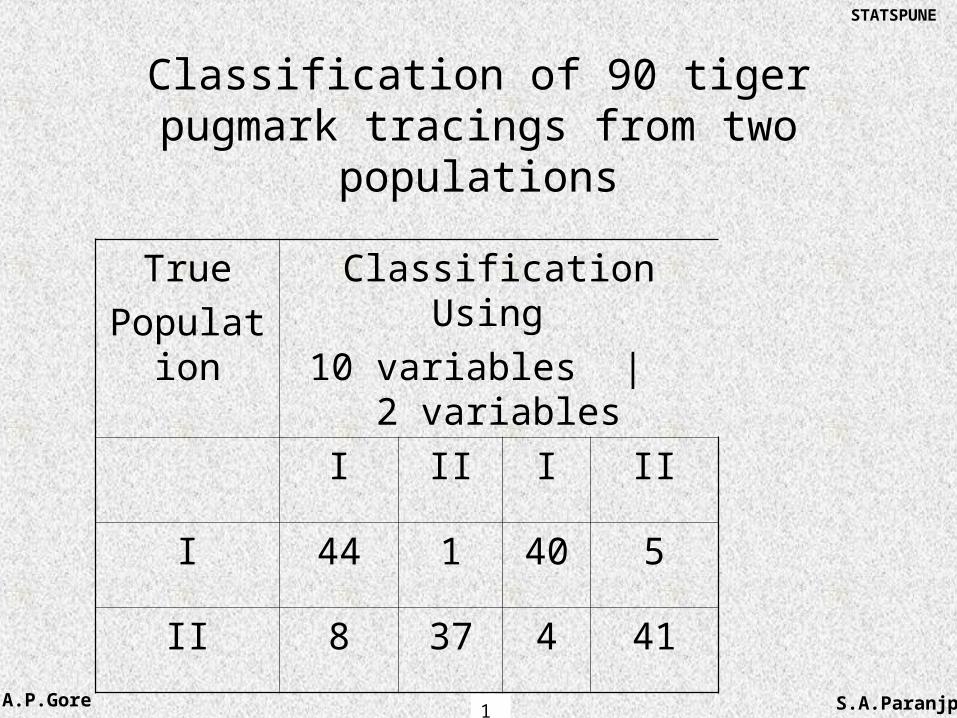
•Locality - field data from project tiger: Melghat and Kanha
•90 prints each
•Half data used for calibration
•Discriminant analysis
•Half data used for validation
•Initially 10 variables used
•Variables tested for redundancy
•Two variables adequate•Toe1C- Toe2C distance•Toe1C- Toe3C distance
A.P.Gore S.A.Paranjpe
STATSPUNE
16
Classification of 90 tiger pugmark tracings from two populations
True
Population
Classification Using
10 variables | 2 variables
I II I II
I 44 1 40 5
II 8 37 4 41
A.P.Gore S.A.Paranjpe

STATSPUNE
17
Does this help in estimating Tiger number?
•No.
•All analysis so far – macro level only
•Key question- •How many distinct tigers in a set of n pugmark tracings?
•An intuitive approach:•Compare known intra individual variation with observed inter pugmark variation.•How to assess intra individual variation?•Analyze multiple tracings from the same trail.
A.P.Gore S.A.Paranjpe

STATSPUNE
18
An intuitive algorithm
•X1, X2,…, Xn : n vectors ( n pugmarks) of order p
•X i Follows normal distribution• with mean vector i
•Var- cov matrix (assumed to be known)
•Number of distinct tigers k (unknown)
•Step 1 - H0 : k = 1 ( only one tiger)
•Tn = sum[ (Xi –Xbar)’ -1 (Xi –Xbar)]
•Reject H0 if T large .Then try k=2
A.P.Gore S.A.Paranjpe

STATSPUNE
19
An intuitive algorithm(cont.)
• H0 : k=2• Omit one vector Xi which causes max reduction in Tn
• Check if Tn-1(i) = sum[ (Xi –Xbar)’ -1 (Xi –Xbar)] is small
• If yes, two tigers. Otherwise continue omitting.
• Process terminates when homogeneous subgroups identified
• Each subgroup – one tiger• confidence statement?
•Not available in standard literature.
•Recent algorithm developed by Chatterjee and Samanta(1999)•Not testedA.P.Gore S.A.Paranjpe

Foresters’ current approach Discriminant Analysis
• Establish the parameters fit for consideration to facilitate individual identity
• Multiple Group Discriminant Analysis done using SPSS Systat (unitwise)
• Canonical Scores Plot from data generated by tracings/ digital photographs in SPSS Sigma ScanPro
• Number of distinct pugmarks ascertained unitwise
• If all tracks from each foot are grouped into 2 groups (eg. A & B) : then these sets are from 2 different tigers
• Equal mixing (overlap) may indicate a single animal
• 75% to 80% correct grouping is acceptable
A.P.Gore S.A.Paranjpe
STATSPUNE
21
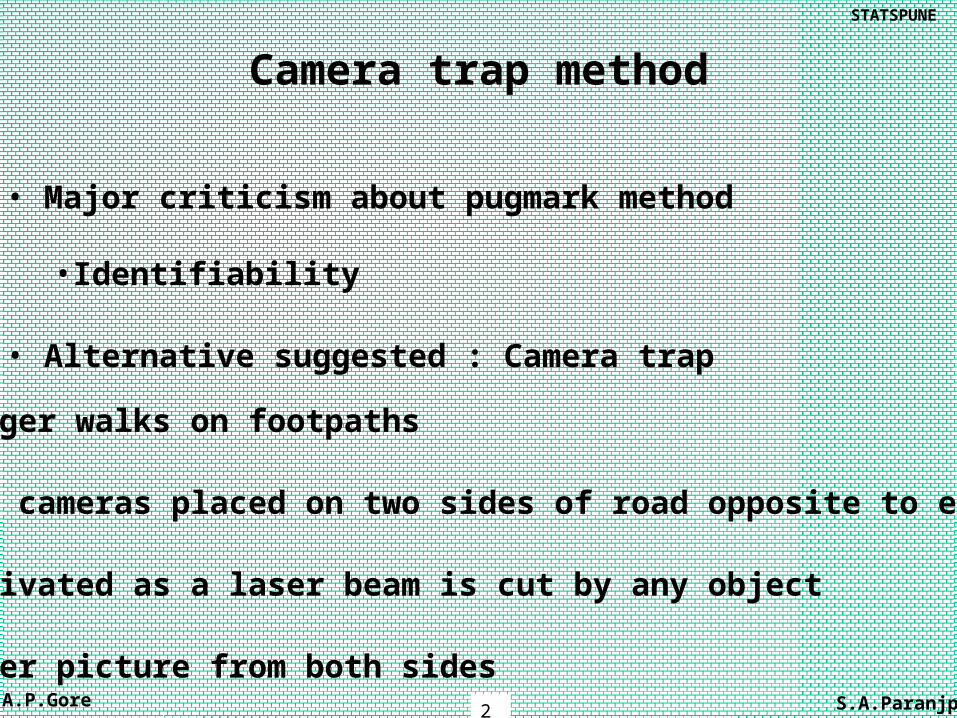
Camera trap method
• Major criticism about pugmark method
•Identifiability
• Alternative suggested : Camera trap
• Tiger walks on footpaths
•Two cameras placed on two sides of road opposite to each other
•Activated as a laser beam is cut by any object
•Tiger picture from both sides
A.P.Gore S.A.Paranjpe
STATSPUNE
22
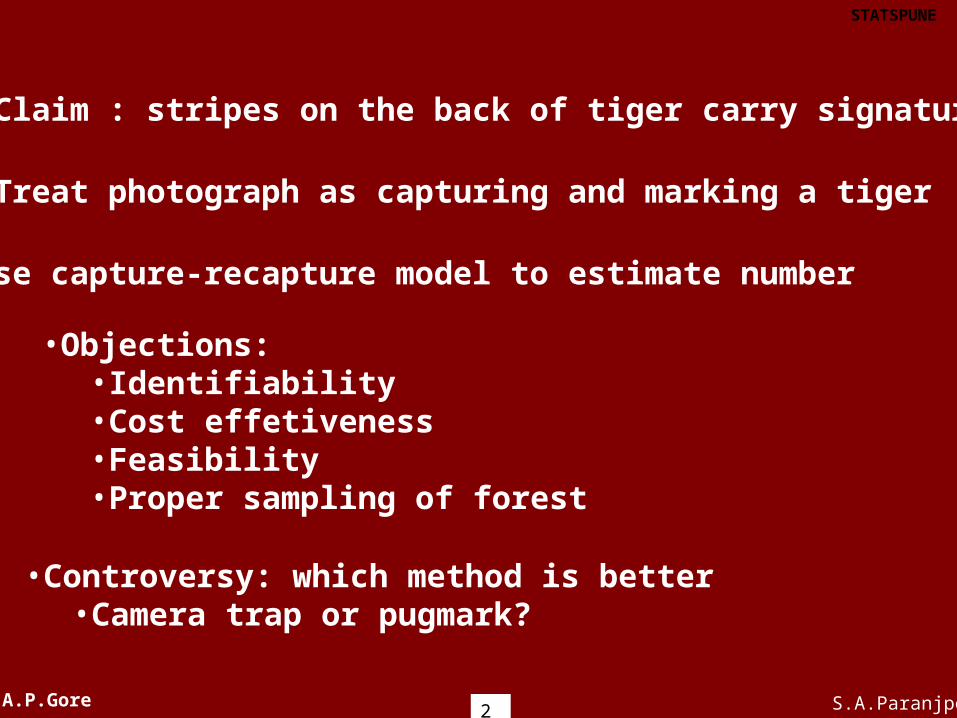
• Claim : stripes on the back of tiger carry signature
• Treat photograph as capturing and marking a tiger
•Use capture-recapture model to estimate number
•Controversy: which method is better•Camera trap or pugmark?
•Objections:•Identifiability•Cost effetiveness•Feasibility•Proper sampling of forest
A.P.Gore S.A.Paranjpe

STATSPUNE
23
Comparison Camera trap Vs Pugmark
•IdentityBased on picture based on pugmarkOcular comparison numerical comparison
•Intra individual variabilityNot measurable measurable
•CostExpensive inexpensiveEquipment intensive labor intensive
•SuitabilityNot suited for low density low density –no limitationUnsuitable for rugged terrain unsuitable for swamps
A.P.Gore S.A.Paranjpe
STATSPUNE
24
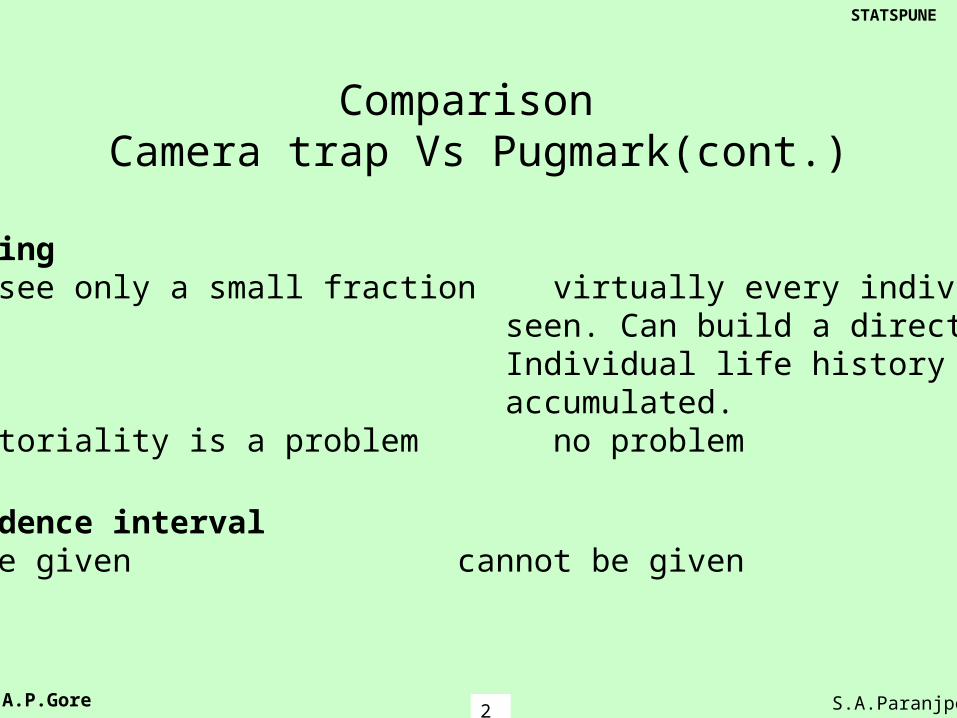
Comparison Camera trap Vs Pugmark(cont.)
•Sampling•Will see only a small fraction virtually every individual
seen. Can build a directory.Individual life history can beaccumulated.
•Territoriality is a problem no problem
•Confidence interval•Can be given cannot be given
A.P.Gore S.A.Paranjpe