stats and the flat fee - basf
TRANSCRIPT

Statistics and the Flat Fee
Joshua LenonLawyer in Residence
Clio


Statistics and the Flat Fee
Joshua LenonLawyer in Residence
Clio

Agenda
• Tracking Data• Data Sources in Clio• Control Charts• Flat Fees• Questions

TRACKING DATA

The question is not “how big is your data?”,
it is “what are you are doing
with your data?”- Dave Fowler; Entrepreneur.com
Are you generating trackable data?

What Data Do Lawyers Track?
• Hours• Rates• Types of Cases• Lengths of Cases• Case Resolution Outcomes• Clients’ Legal Histories• Amounts Billed• Payments Received

Ways to Generate Data
• Bills Sent • Tracking Time
• Custom Fields
• Expenses
• Consistency

What Can Lawyers Determine?
• Financial Health of Firm• Profitability of Clients Over Time• Average Earnings Per Case by
Practice Area• Profitability of Practice Areas Per
Effort• Productivity of Associates• Projected Workload by Case Type

01/01/20140
1
2
3
4
5
6
7
8
9
Time
Time

01/01/2014 01/08/20140
5
10
15
20
25
30
35
40
45
Time
Time

01/01/2014 01/08/2014 02/01/20140
20
40
60
80
100
120
140
160
180
Time
Time

01/01/2014 01/08/2014 02/01/2014 06/23/20140
200
400
600
800
1000
1200
Time
Time

01/01/2014 01/08/2014 02/01/2014 06/23/20140
200
400
600
800
1000
1200
TimeCriminalCivilAdmin

How Big Is Your Data?
A lawyer tracking 20 hours a week would have 4,640 pieces of data, since 2010.
Track 5 types of activities and you have 23,200 pieces of data.
Track 4 practice areas and you have 92,800 pieces of data.

DATA SOURCES IN CLIO
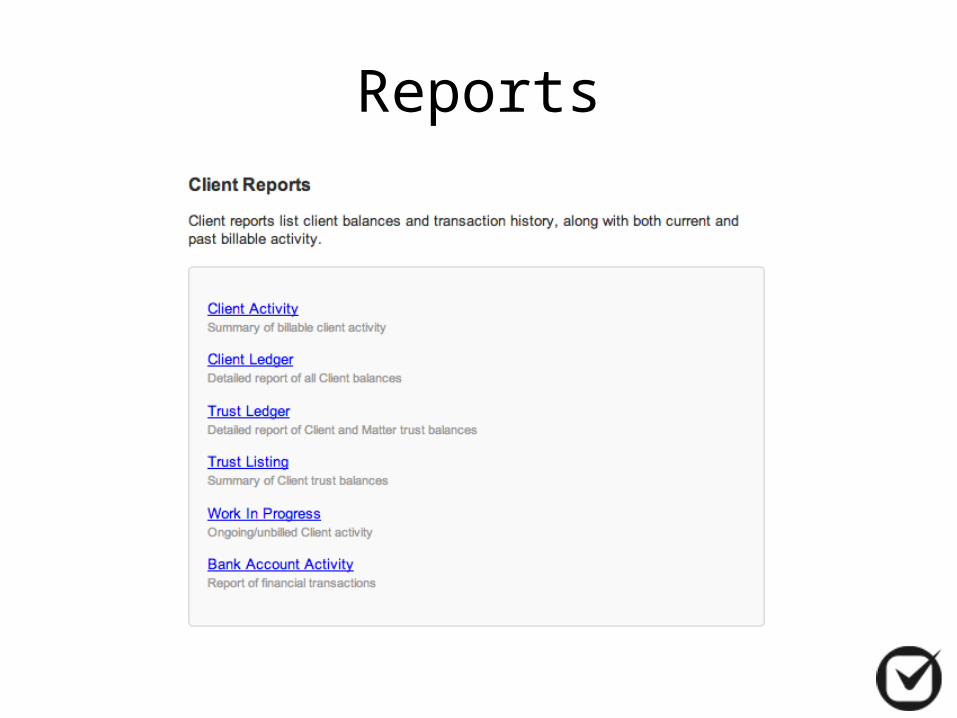
Reports

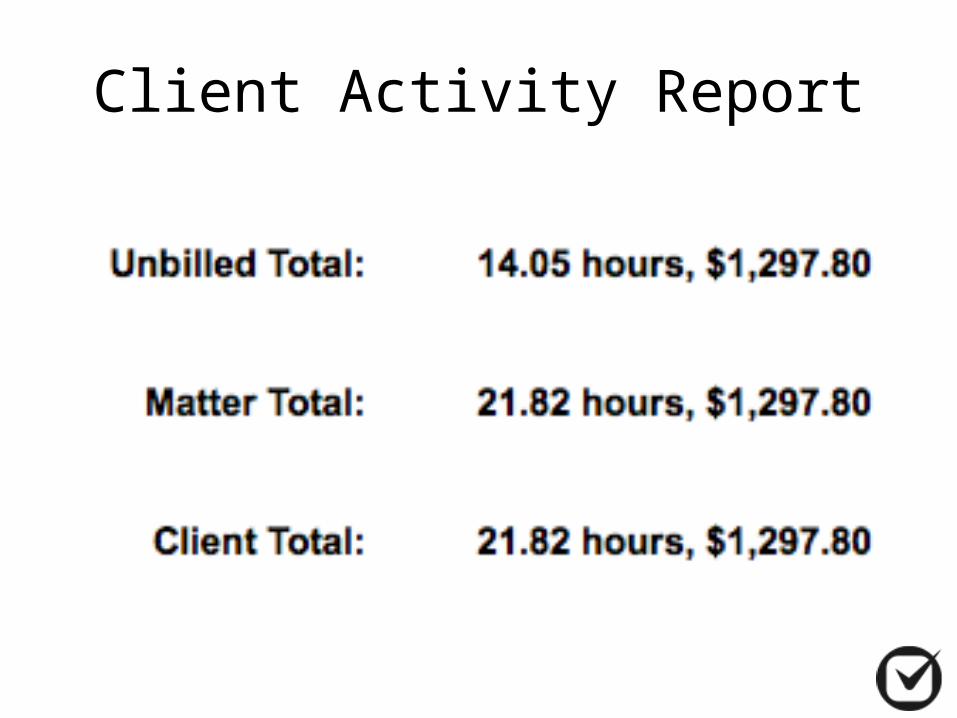
Client ActivityReport

Client Activity Report

CONTROL CHARTS

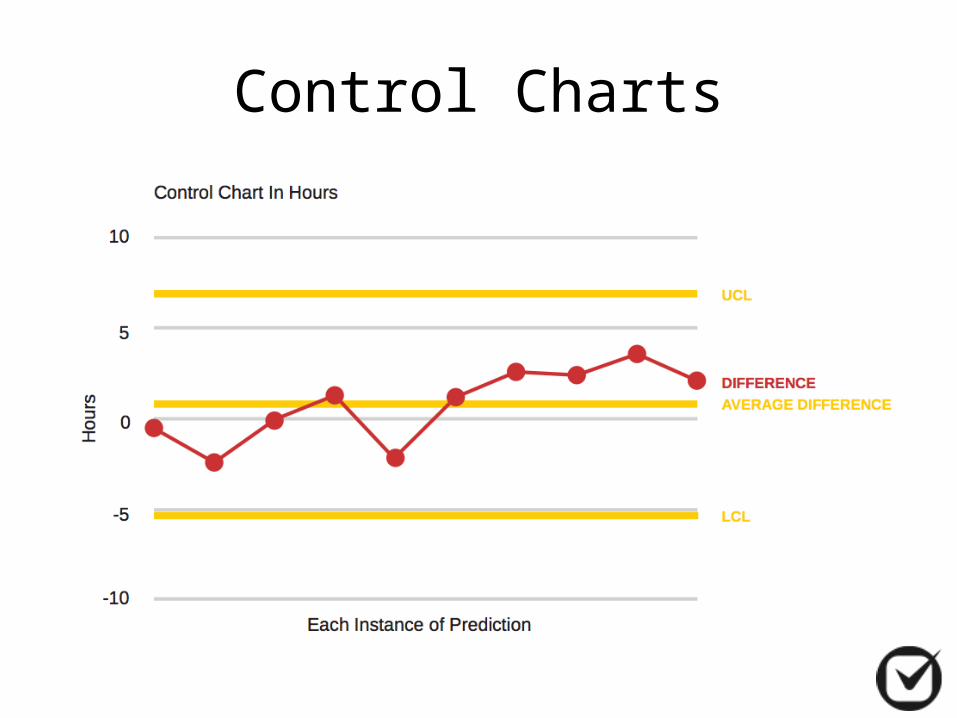
Control Charts
If analysis of the control chart indicates that the process is
currently under control (i.e., is stable, with variation only coming
from sources common to the process), then no corrections or
changes to process control parameters are needed or desired.
Control Charts
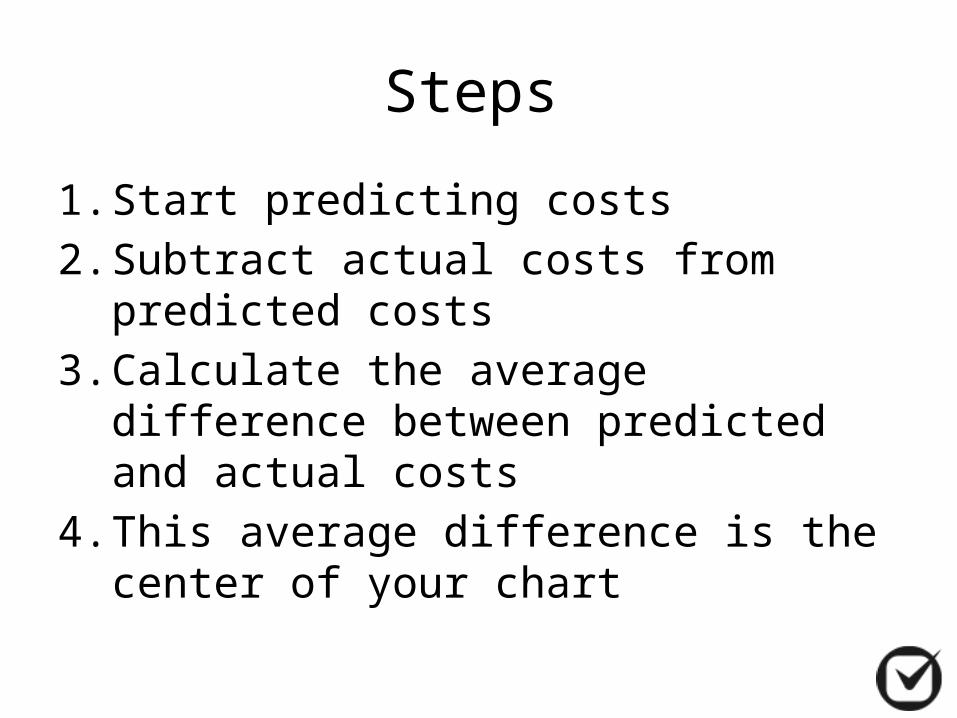
Steps
1. Start predicting costs2. Subtract actual costs from predicted
costs3. Calculate the average difference
between predicted and actual costs4. This average difference is the center
of your chart

Control Charts

Steps Continued
5. Calculate the Moving Range (MR) by subtracting the difference between each successive data points.
Ex.: Pt.1 – Pt. 2Pt. 2 –
Pt. 3Pt. 3 –
Pt. 4
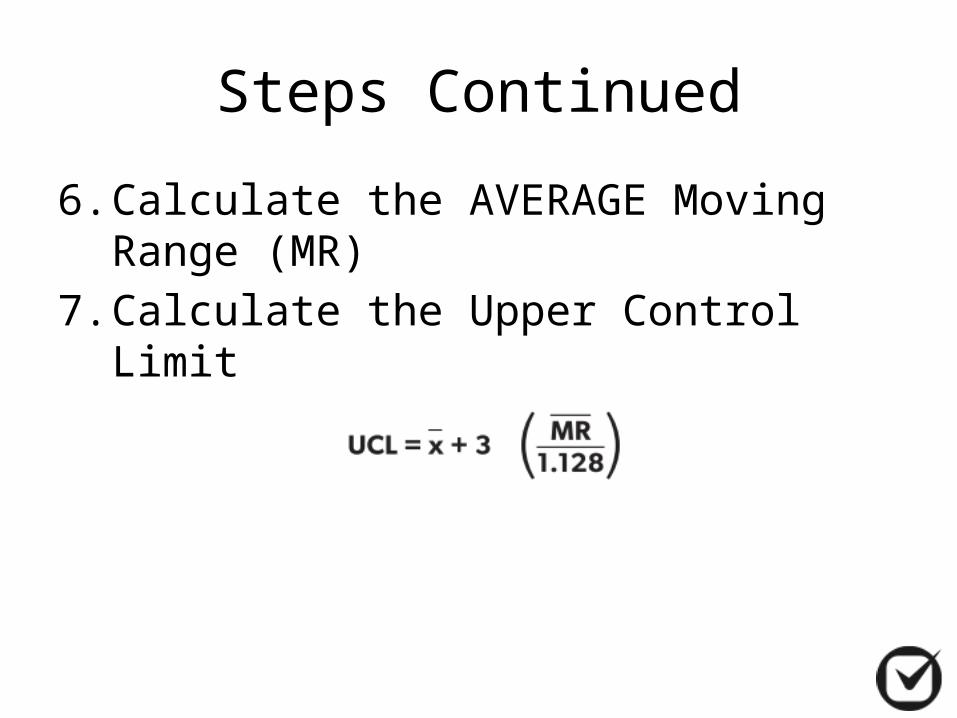
Steps Continued
6. Calculate the AVERAGE Moving Range (MR)
7. Calculate the Upper Control Limit

Control Charts

Last Steps
8. Calculate the Lower Control Limit
9. Graph everything on a chart

Control Charts

FLAT FEES
Hours vs. Billing
You should run a control chart for both hours and
billing.
Client Activity Report

Control Charts

Further Help
Goclio.com/Resources

QUESTIONS?
