statistics: unlocking the power of data lock 5 exam 2 review stat 101 dr. kari lock morgan 11/13/12...
TRANSCRIPT

Statistics: Unlocking the Power of Data Lock5
Exam 2 Review
STAT 101
Dr. Kari Lock Morgan
11/13/12
Review of Chapters 5-9
Statistics: Unlocking the Power of Data Lock5
Exam 2In class Thursday 11/15
Cumulative, covering chapters 1-9 (but not 8.2 or 9.2… everything we have done so far in the course)
Closed book, but allowed 2 double-sided pages of notes prepared by you
You will need a calculator, and will need to know how to compute p-values for normal, t, chi-square, and F distributions using your calculator
Practice exam and solutions to review problems available under documents on the course webpage

Statistics: Unlocking the Power of Data Lock5
• Tuesday• Prof Morgan, 1 – 2:30 pm, Old Chem 216
• Wednesday• Prof Morgan, 2 – 3 pm, Old Chem 216• Prof Morgan, 4:30 – 5:30 pm, Old Chem 216• Heather, 8 – 9pm, Old Chem 211A
• Thursday• Prof Morgan, 1 – 2:30 pm, Old Chem 216
• Also, the Stat Education Center in Old Chem 211A is open Sunday – Thurs 4pm – 9pm with stat majors and stat PhD students available to answer questions
Office Hours This Week
Statistics: Unlocking the Power of Data Lock5
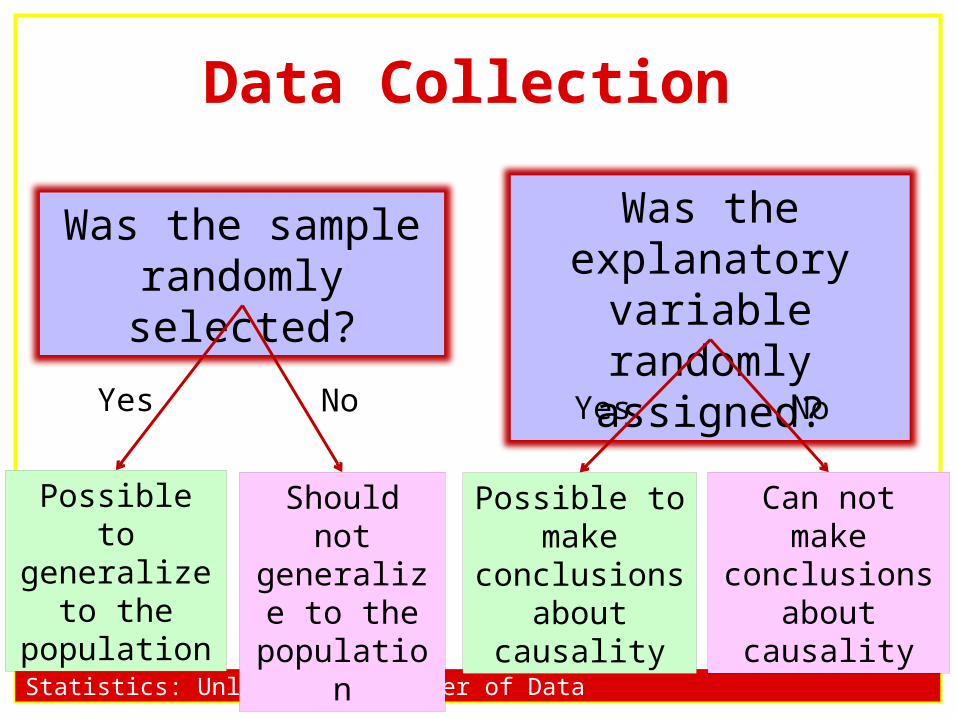
Was the sample randomly selected?
Possible to generalize to
the population
Yes
Should not generalize to
the population
No
Was the explanatory variable randomly
assigned?
Possible to make
conclusions about causality
Yes
Can not make conclusions
about causality
No
Data Collection

Statistics: Unlocking the Power of Data Lock5
Variable(s) Visualization Summary StatisticsCategorical bar chart,
pie chartfrequency table,
relative frequency table, proportion
Quantitative dotplot, histogram,
boxplot
mean, median, max, min, standard deviation,
z-score, range, IQR,five number summary
Categorical vs Categorical
side-by-side bar chart, segmented bar chart
two-way table, difference in proportions
Quantitative vs Categorical
side-by-side boxplots statistics by group, difference in means
Quantitative vs Quantitative
scatterplot correlation,simple linear regression
Statistics: Unlocking the Power of Data Lock5
Confidence Interval
• A confidence interval for a parameter is an interval computed from sample data by a method that will capture the parameter for a specified proportion of all samples
• A 95% confidence interval will contain the true parameter for 95% of all samples

Statistics: Unlocking the Power of Data Lock5
• How unusual would it be to get results as extreme (or more extreme) than those observed, if the null hypothesis is true?
• If it would be very unusual, then the null hypothesis is probably not true!
• If it would not be very unusual, then there is not evidence against the null hypothesis
Hypothesis Testing

Statistics: Unlocking the Power of Data Lock5
• The p-value is the probability of getting a statistic as extreme (or more extreme) as that observed, just by random chance, if the null hypothesis is true
• The p-value measures evidence against the null hypothesis
p-value

Statistics: Unlocking the Power of Data Lock5
Hypothesis Testing
1.State Hypotheses
2.Calculate a test statistic, based on your sample data
3.Create a distribution of this test statistic, as it would be observed if the null hypothesis were true
4.Use this distribution to measure how extreme your test statistic is

Statistics: Unlocking the Power of Data Lock5
Distribution of the Sample Statistic
1.Sampling distribution: distribution of the statistic based on many samples from the population
2.Bootstrap Distribution: distribution of the statistic based on many samples with replacement from the original sample
3.Randomization Distribution: distribution of the statistic assuming the null hypothesis is true
4.Normal, t,2, F: Theoretical distributions used to approximate the distribution of the statistic
Statistics: Unlocking the Power of Data Lock5
Sample Size Conditions
• For large sample sizes, either simulation methods or theoretical methods work
• If sample sizes are too small, only simulation methods can be used
Statistics: Unlocking the Power of Data Lock5
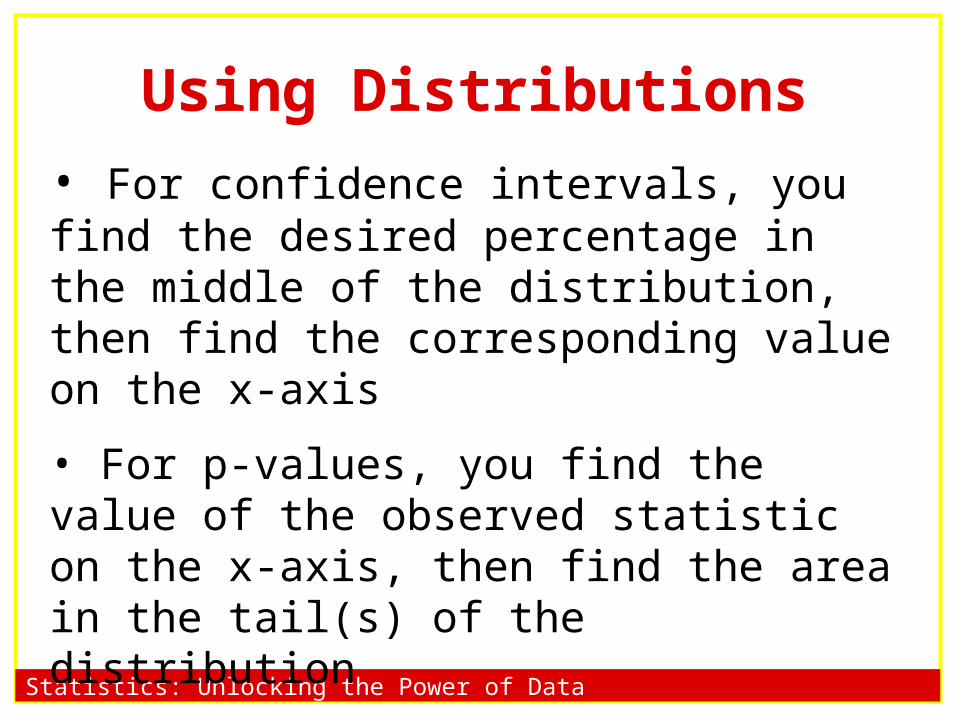
• For confidence intervals, you find the desired percentage in the middle of the distribution, then find the corresponding value on the x-axis
• For p-values, you find the value of the observed statistic on the x-axis, then find the area in the tail(s) of the distribution
Using Distributions
Statistics: Unlocking the Power of Data Lock5
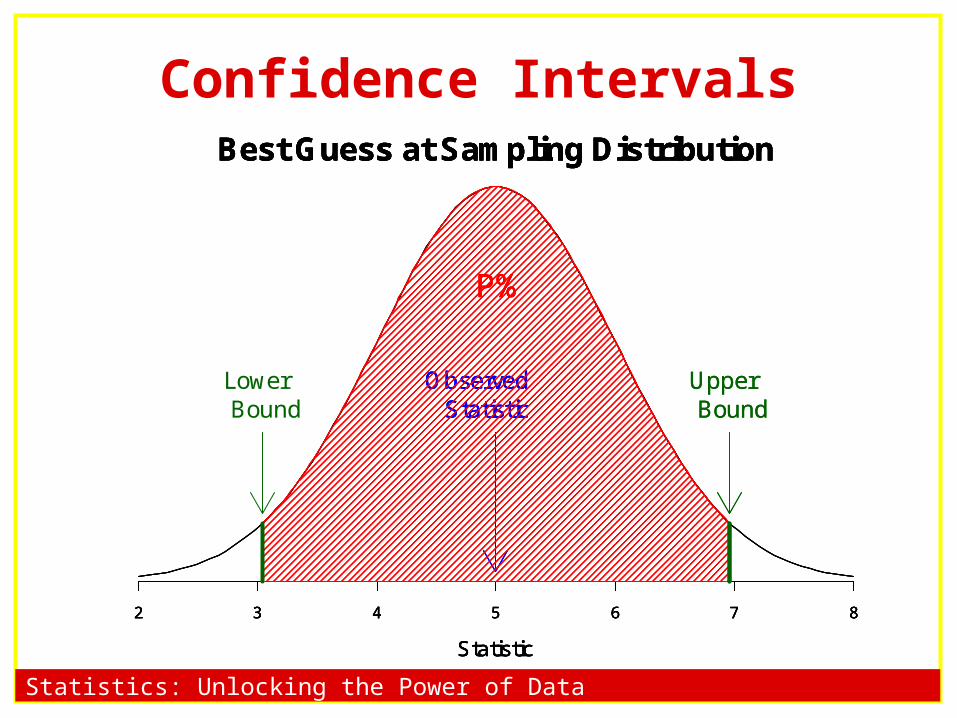
Confidence IntervalsBest Guess at Sampling Distribution
Statistic
2 3 4 5 6 7 8
Best Guess at Sampling Distribution
Statistic
2 3 4 5 6 7 8
Observed Statistic
Best Guess at Sampling Distribution
Statistic
2 3 4 5 6 7 8
Observed Statistic
P%
Best Guess at Sampling Distribution
Statistic
2 3 4 5 6 7 8
Observed Statistic
P%P%P%
Upper BoundUpper Bound
Lower Bound

Statistics: Unlocking the Power of Data Lock5
Confidence IntervalsN(0,1)
-3 -2 -1 0 1 2 3
N(0,1)
-3 -2 -1 0 1 2 3
P%
N(0,1)
-3 -2 -1 0 1 2 3
P% z*
*sample statistic z SE Return to original scale with

Statistics: Unlocking the Power of Data Lock5
Hypothesis TestingDistribution of Statistic Assuming Null
Statistic
-3 -2 -1 0 1 2 3
Observed Statistic
Distribution of Statistic Assuming Null
Statistic
-3 -2 -1 0 1 2 3
Distribution of Statistic Assuming Null
Statistic
-3 -2 -1 0 1 2 3
Observed Statistic
p-value
Statistics: Unlocking the Power of Data Lock5
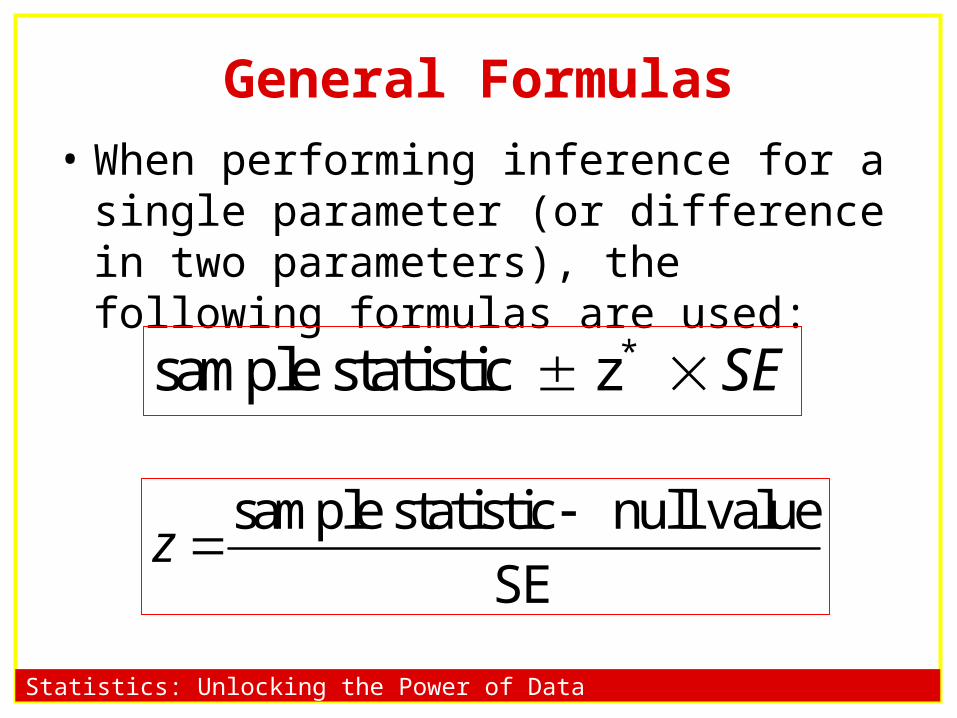
General Formulas• When performing inference for a single
parameter (or difference in two parameters), the following formulas are used:
sample statistic null value
SEz
*sample statistic z SE
Statistics: Unlocking the Power of Data Lock5
General Formulas• For proportions (categorical variables), the
normal distribution is used
• For inference involving any quantitative variable (means, correlation, slope), the t distribution is used

Statistics: Unlocking the Power of Data Lock5
Standard Error
• The standard error is the standard deviation of the sample statistic
• The formula for the standard error depends on the type of statistic (which depends on the type of variable(s) being analyzed)
Statistics: Unlocking the Power of Data Lock5
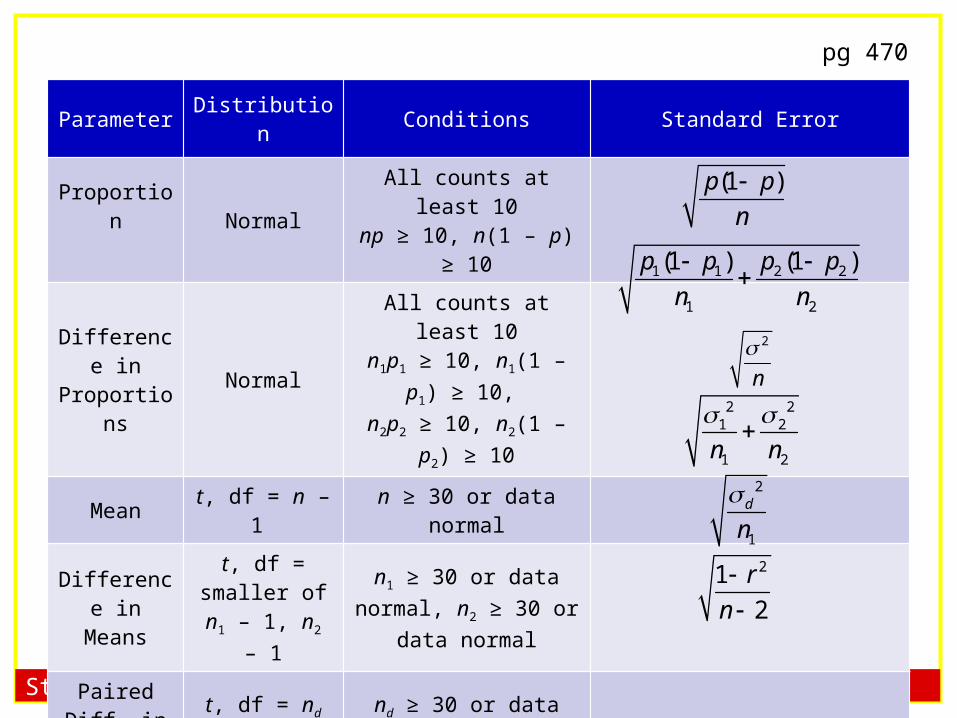
Parameter Distribution Conditions Standard Error
ProportionNormal
All counts at least 10np ≥ 10, n(1 – p) ≥ 10
Difference in Proportions
NormalAll counts at least 10
n1p1 ≥ 10, n1(1 – p1) ≥ 10, n2p2 ≥ 10, n2(1 – p2) ≥ 10
Mean t, df = n – 1 n ≥ 30 or data normal
Difference in Means
t, df = smaller of n1 – 1, n2 – 1
n1 ≥ 30 or data normal, n2 ≥ 30 or data normal
Paired Diff. in Means
t, df = nd – 1 nd ≥ 30 or data normal
Correlationt, df = n – 2 n ≥ 30
(1 )p p
n
2
n
1 1
1
2 2
2
(1 ) (1 )p p p p
n n
2 21 2
1 2n n
2
1
d
n
21
2
r
n
pg 470
Statistics: Unlocking the Power of Data Lock5
Multiple Categories• These formulas do not work for categorical
variables with more than two categories, because there are multiple parameters
• For one or two categorical variables with multiple categories, use 2 tests
• For testing for a difference in means across multiple groups, use ANOVA
Statistics: Unlocking the Power of Data Lock5
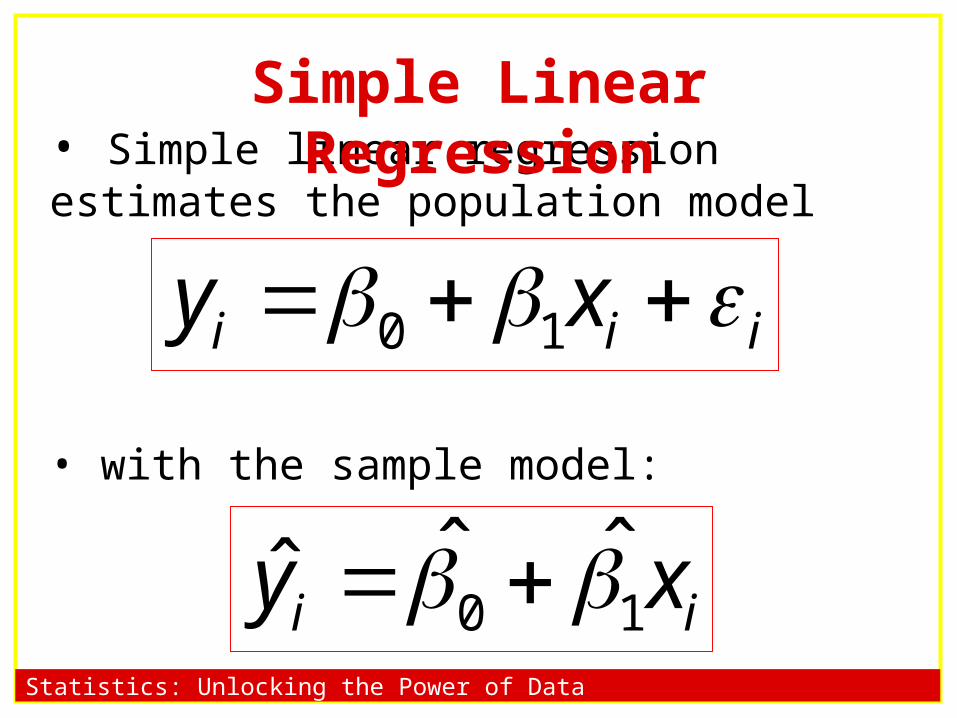
• Simple linear regression estimates the population model
• with the sample model:
Simple Linear Regression
0 1i i iy x
0 1ˆ ˆˆi iy x
Statistics: Unlocking the Power of Data Lock5
Simple Linear Regression• Inference for the slope can be done using
Statistics: Unlocking the Power of Data Lock5
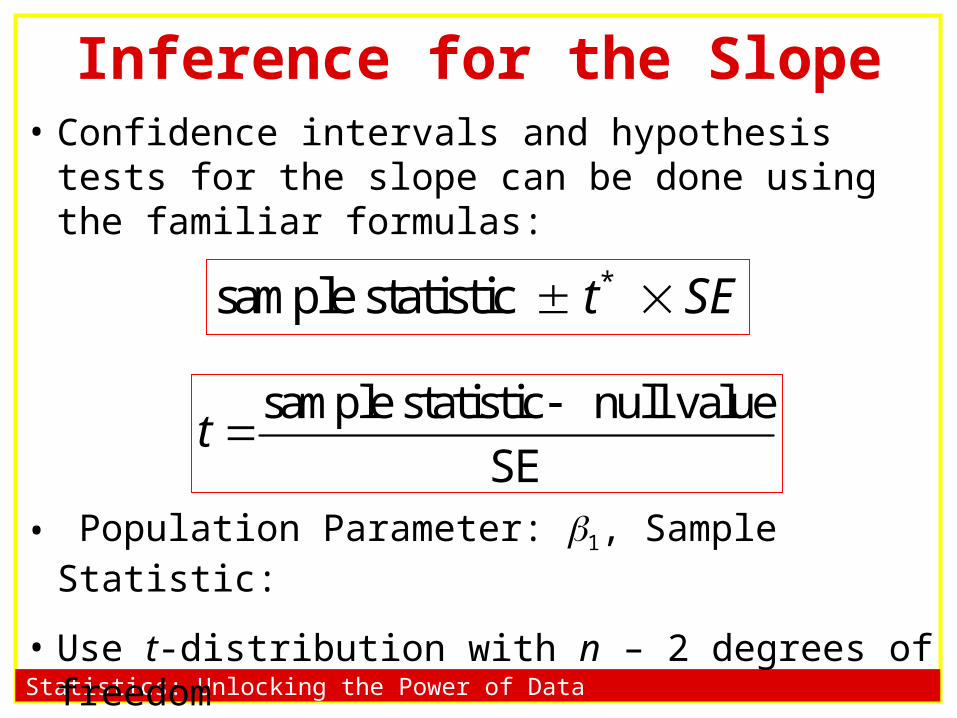
• Confidence intervals and hypothesis tests for the slope can be done using the familiar formulas:
• Population Parameter: 1, Sample Statistic:
• Use t-distribution with n – 2 degrees of freedom
Inference for the Slope
sample statistic null value
SEt
*sample statistic t SE

Statistics: Unlocking the Power of Data Lock5
• A confidence interval has a given chance of capturing the mean y value at a specified x value (the point on the line)
• A prediction interval has a given chance of capturing the y value for a particular case at a specified x value (the actual point)
Intervals

Statistics: Unlocking the Power of Data Lock5
Inference based on the simple linear model is only valid if the following conditions hold:
1) Linearity2) Constant Variability of Residuals3) Normality of Residuals
Conditions for SLR
Statistics: Unlocking the Power of Data Lock5
Inference Methods
http://prezi.com/c1xz1on-p4eb/stat-101/