statistics: two issues how to actually learn things about the data –different ways of summarizing...
TRANSCRIPT

Statistics: Two Issues• How to actually learn things about the data
– Different ways of summarizing data– And of identifying patterns
• How to convince other people of things you want them to believe– Both how to do it, and …– How not to be a victim of people doing it– How to Lie With Statistics

Descriptive Stats• Summing up data
– Mean aka average: Sum of values/number of values– Median: The number in the middle– What are the advantages of each?
• Consider the average, cubical, cardboard box– We have five boxes– 1’x1’x1’, 2’x2’x2’, … 5’x5’x5’– What are the average height, width, and depth of a box?
– What is the average volume of a box?
– Do they correspond?
– What if we use median?
(1+2+3+4+5)/5=3=average height, width, depth
(1cubic ft+8+27+64+125)/5=225/5=45
3x3x3=27<45

Mean v Median• The mean
– depends on how we measure the variable, the median does not– is sensitive to large outliers, the median is not– The median ignores how far anything is above or below the median
• Consider two income distributions– A: $5000, $5001, $5002– B: $4999, $5000, $10,000– Which has the higher median? Mean? Which measure is more interesting?
• On the other hand—suppose you believe some of your numbers are wrong– In case B, a typo converts $10,000 to $100,000– Messes up the mean, doesn’t affect the median
• Or suppose you have ordering, but no natural quantitative measure– Comparing chess players, say– You could use their rating, average it, but …– Which player is average then depends on just how ratings are calculated– Which player is median only depends on the rating getting the order right

Histogram• Visual portrayal of frequency: the idea
– Divide the range into equal units
– Heights from 5’ to 5’3”, from 5’ 3” to 5’6”, from …
– How many observations in each unit?
– Graph.
– But … what do equal units mean?
• Again consider my cubic boxes– This time lots of them—1’, 1.1’,1.2’ …
– With different numbers of different sizes, so a histogram might be interesting. But …
– By edge size, we ask how many boxes of sizes 1’-1.5’, 1.5’-2’, etc.
– By volume, how many 1 cubic foot to 2 cubic feet, 2 to 3, ….
– Will the two histograms look the same?

Does it matter how you measure things?
• How do the results differ?– Increasing from 1’ to 1.5’ increases volume from 1 cubic foot to
27/8=3.375– From 1.5 to 2 increases volume from 3.375 to 8. – So the relative sizes of the intervals is different for the different
methods– Making the pattern of the frequency distribution different.– If it were uniform the first way, it would look like an increasing
frequency the second way
• This is a general problem– We are interested in some characteristic, such as “size of box”– Often it can be measured in different ways– Some statistical summaries will depend on how you measure it– Cube size by length of edge vs by volume– Give different averages, different histograms, the same median
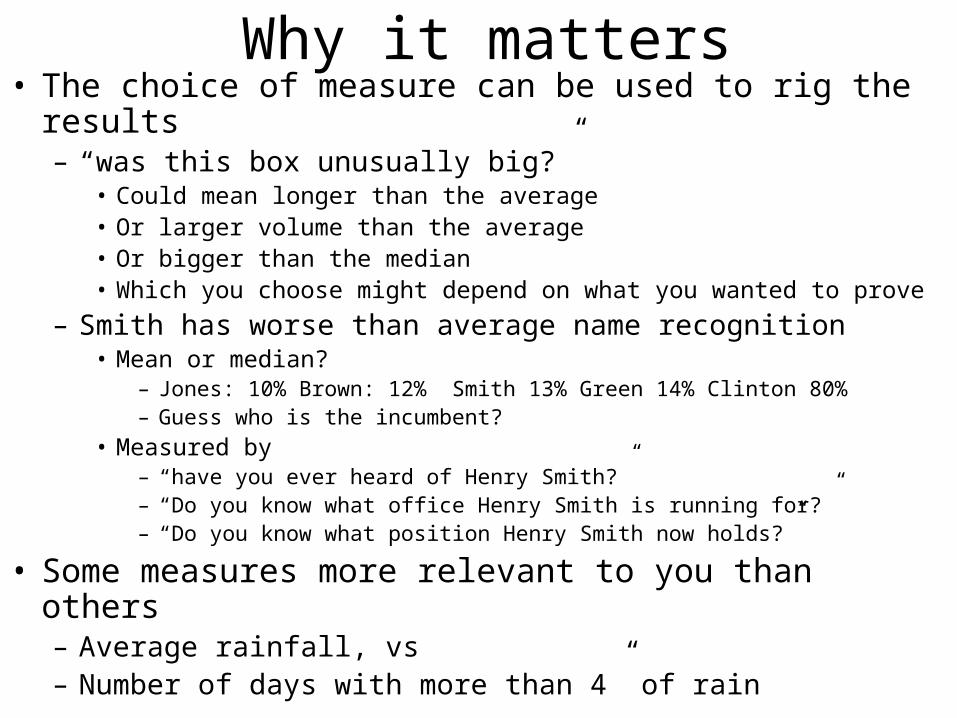
Why it matters• The choice of measure can be used to rig the results
– “was this box unusually big?”• Could mean longer than the average• Or larger volume than the average• Or bigger than the median• Which you choose might depend on what you wanted to prove
– Smith has worse than average name recognition• Mean or median?
– Jones: 10% Brown: 12% Smith 13% Green 14% Clinton 80%– Guess who is the incumbent?
• Measured by– “have you ever heard of Henry Smith?”– “Do you know what office Henry Smith is running for?”– “Do you know what position Henry Smith now holds?”
• Some measures more relevant to you than others– Average rainfall, vs– Number of days with more than 4” of rain
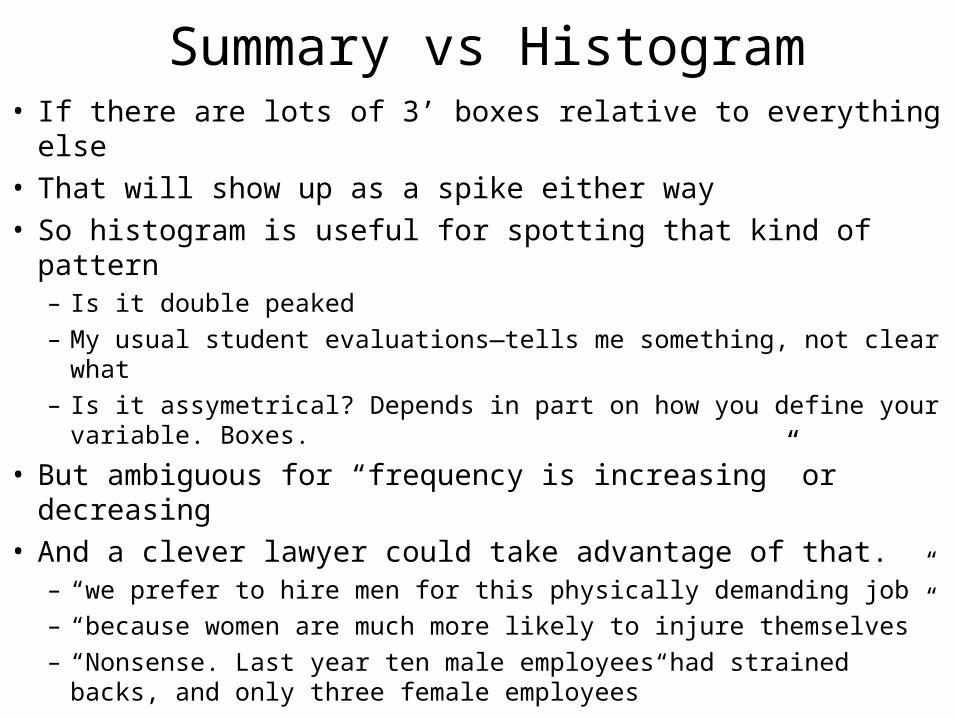
Summary vs Histogram• If there are lots of 3’ boxes relative to everything else• That will show up as a spike either way• So histogram is useful for spotting that kind of pattern
– Is it double peaked
– My usual student evaluations—tells me something, not clear what
– Is it assymetrical? Depends in part on how you define your variable. Boxes.
• But ambiguous for “frequency is increasing” or decreasing• And a clever lawyer could take advantage of that.
– “we prefer to hire men for this physically demanding job”
– “because women are much more likely to injure themselves”
– “Nonsense. Last year ten male employees had strained backs, and only three female employees”

Real World Example• In 2008, auto death rates per capita a record law
– 9% below the rate for 2007– ““While a number of factors have helped lower the rate, it is our experience that public
education coupled with visible enforcement of safety laws can be one of the most effective ways to change behaviors and save lives.”Also contributing to the lower rate are improved vehicle safety features and greater visibility and enforcement of important traffic safety laws, including laws related to seat belt use, child passengers, impaired driving and teen driving.”
• Suppose you want to know what this really means– Should you support “public education combined with …”– Should regulated insurance companies be forced to cut their
rates?– Should … any legal issue for which this might be an
argument
• What questions should you ask?– What else might the data reflect?– What do they imply?– How do we find out?

Suggestions?• Possible reasons for the decline
• Ways of checking them
• Why reasons matter--different implications– For public policy– For insurance rates– For …

Ways of Fooling or Being Fooled
• Have the vertical axis start well above zero, to magnify changes
10090
501000

My Highschool Textbook• From 1920 to 1930, farm income fell 40%. Presidents Harding and Coolidge did
nothing.
Select your (very nonrandom) sample
•Look at the figures for these eight states. In the five where voting machines without paper trails were used, Bush did better in the election than in the pre-election polls. In the other three he didn’t. Obviously the election was rigged.
Pick your endpoints
192019241928HardingCoolidgeJudicial Salaries, Inflation adjusted
Over the past ten years, judicial salaries, adjusted for inflation, have fallen more than 20%
A Justice Tells Us
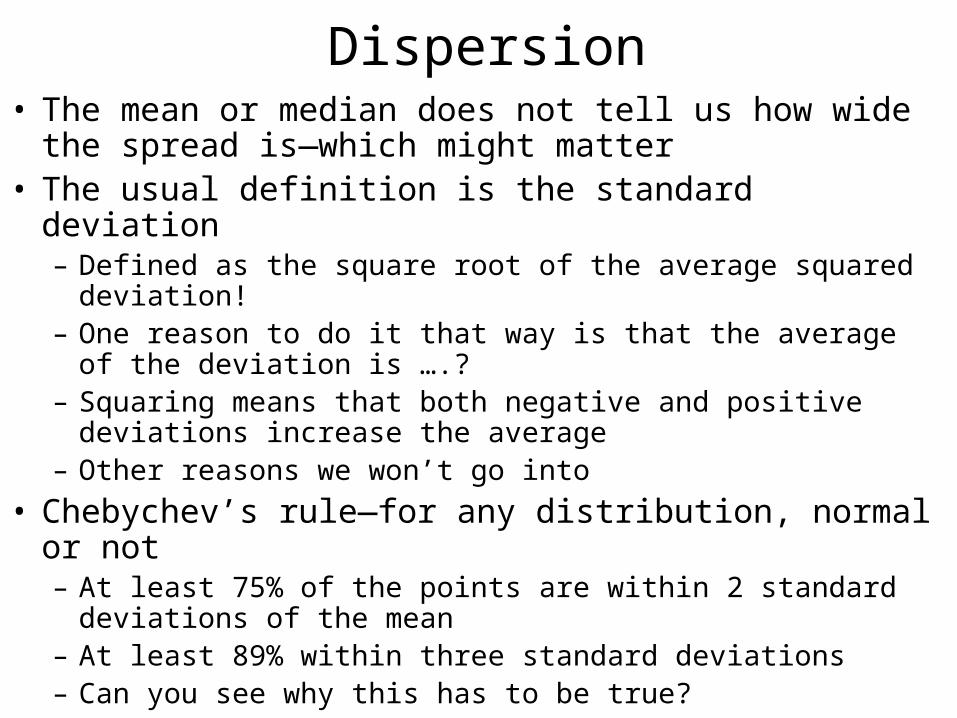
Dispersion• The mean or median does not tell us how wide the spread is
—which might matter• The usual definition is the standard deviation
– Defined as the square root of the average squared deviation!– One reason to do it that way is that the average of the deviation is
….?– Squaring means that both negative and positive deviations increase
the average– Other reasons we won’t go into
• Chebychev’s rule—for any distribution, normal or not– At least 75% of the points are within 2 standard deviations of the
mean– At least 89% within three standard deviations– Can you see why this has to be true?

Normal Distribution• A particular family of distributions (“bell curve)
– Where once you know the mean and the standard deviation
– you know the distribution
• Which many real world distributions approximate– And which has characteristics that are known and useful
– About 68% within one stdev, 95% within two, 99.7% within three
• If you know the mean IQ is 100 and the stdev is 15, just how special is your IQ 150 kid?
• Z score table is the continuous version of that rule– Z score is the number of standard deviations from the mean.
– Table tells you how likely it is that the Z score is that high or higher
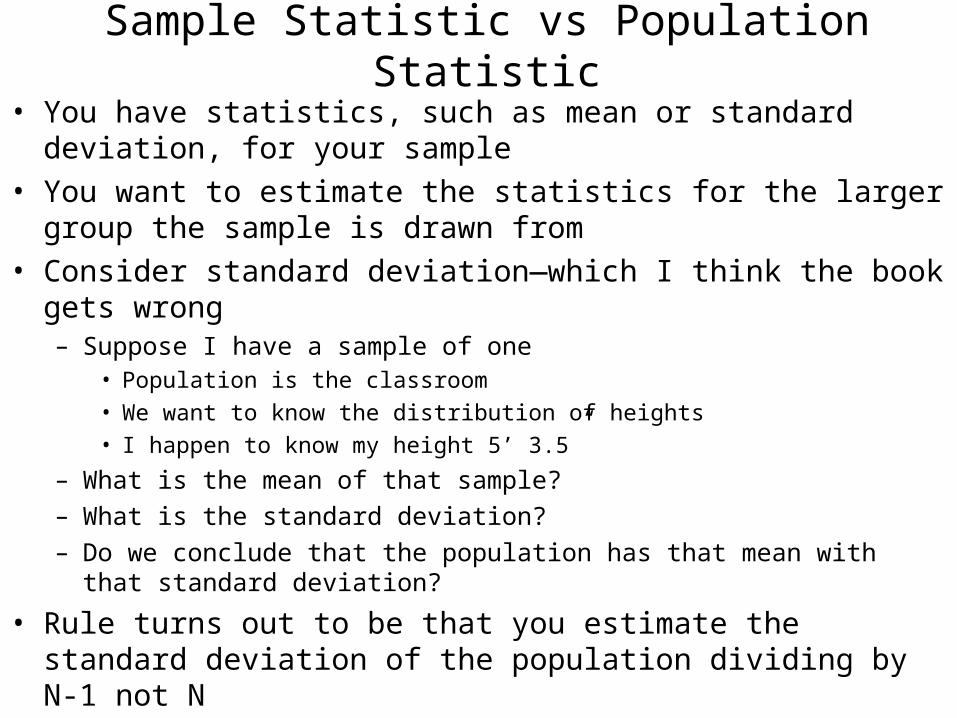
Sample Statistic vs Population Statistic
• You have statistics, such as mean or standard deviation, for your sample
• You want to estimate the statistics for the larger group the sample is drawn from
• Consider standard deviation—which I think the book gets wrong– Suppose I have a sample of one
• Population is the classroom
• We want to know the distribution of heights
• I happen to know my height 5’ 3.5”
– What is the mean of that sample?
– What is the standard deviation?
– Do we conclude that the population has that mean with that standard deviation?
• Rule turns out to be that you estimate the standard deviation of the population dividing by N-1 not N

Review• Different ways of summarizing a bunch of data
– Mean vs median– Histogram– Standard deviation: Chebychev's rule– Some ways may be deceptive, deliberately or not
• Normal Distributions– Bell curve shape– All normal distributions are the same except for two parameters
• Mean—where the center is• Standard Deviation—how much it is stretched out
– So if you know how many standard deviations from the mean an observation is• You can look up on a table how likely it is to be at least that far from the mean
– If you are confident about your mean and standard deviation, tells how atypical this sample is– If your observation is very unlikely, perhaps you are wrong about the mean and/or standard deviation
• Warren Buffet as a five sigma event• Which will get us into hypothesis testing
– Lots of distributions aren't normal, but …• If we are looking at the average of a sample from a distribution• The Central Limit Theorem tells us that the distribution of averages• Approaches a normal distribution as the size of the sample increases

Estimation v Hypothesis testing• One use of statistics is to test a hypothesis
– Does legalizing concealed carry reduce crime?– Does capital punishment deter?– Does the defendant firm discriminate against women?– Does mercury in vaccines cause Autism?– Does an extra semester of torts increase bar passage?
• The other is to estimate population characteristics– How many people will vote for Obama vs McCain?– What is the average height of an adult American?– You want to know not only the average but
• The standard deviation, or other measures of the distribution
• And you want to know how sure you are that your result is correct
• The margin of error of this poll is …

Sample vs Population• You want to know average height and standard deviation for law
school students
• You measure the students in one class.– Calculate their mean and
– Standard deviation
• What does that tell you about law students at SCU?– If it is a random sample, gives an estimate of the mean
– But too low a figure for standard deviation, because
– If the sample, on average, is high, so is its mean
– So the deviation from sample mean is less than from true mean.
• What about students at SCU? The Country? The World?

Sources of Error• One problem with samples is sampling error
– When you select ten students,
– by chance they might be taller or shorter than average
• Another is bias: Was this a random sample? – If you are measuring age, not height, and select students in this class
– Since it isn't taken by first years
– Your sample is biased towards older students
– Famous example—telephone poll that showed Dewey would win
• A third is validity: Are these facts true?– If you test age by asking people their age when their friends are around
• In some populations people prefer to exaggerate their age
• In others to make it look smaller
– Similarly for asking about adultery in the presence of a spouse
– Or drug use when the questioner knows the name of the respondent
• Note that bias and invalidity may be either accidental or deliberate

Sampling error• You are looking at only a subset of the population
– If you pick three students at random– No reason to expect their height to be higher or lower than the average
for all students– But not likely to be identical
• The bigger the sample, the smaller that problem– As the size of the sample increases– Its mean gets closer and closer to the population average
• Terminology: “statistic” vs “parameter”– The average height of all SCU law students a parameter– The average of the ones you sampled a statistic– We are using statistics to estimate parameters

Sampling bias• You selected your sample somehow
– If it predictably differs from the population– That biases your results. For instance– What is wrong with each of these?
• Estimate support for a bill by constituents’ letters• Estimate importance of travel opportunities by polling a class on
international trade• Jury pool by calling home numbers of eligible adults between
12 and 5 on weekdays• Estimate percentage of rotten apples by looking at the ones at
the top of the crate.• Estimate support for Ron Paul by an online poll

Controlling for Bias• Suppose you can’t get a random sample
– Sampling SCU law students, but …– You are only around in the daytime– And easiest to sample those in your classes
• You can try to correct for the bias– Suppose 20% of students are part-time, but …– Only 5% of your sample are– Let each of them count as five in your calculations
• 25/125 = 20/100• So part-time students are now the right fraction
– Similarly for fraction of women, 1st, 2nd, 3rd year
• What is the risk in this procedure?

Sampling validity• How you ask a question affects the answer
– Sometimes because people lie– Sometimes because wording is suggestive
• Should we let anyone who wants to carry a concealed handgun?
• Should we let people carry concealed handguns to protect themselves from criminals?
– Some people may say one thing on paper, another face to face
• You can use this to get the result you want– Do you support Bill Clinton’s wife Hilary or …– Do you support Senator Clinton?
• And you would like to know if other people are doing so• Harvard questionaire

Hypothesis Testing• The basic logic of confidence results
– You have a null hypothesis—this coin is fair
– You have a sample—say the result of flipping the coin ten times. 7 heads.
• You want to decide whether the null hypothesis is true– In the background there is an alternative hypothesis
– Which is relevant to how you test the null hypothesis
– For instance—this coin is not fair, but I don't know in which direction
• You ask: If the null hypothesis is true, how likely is a result at least this far from what it predicts in the direction the alternative predicts– For example, if the coin is fair
– How likely is it that the result of my experiment would be this far from 50/50?
• Suppose the answer is that if the coin is fair, the chance of being this far off 50/50 is less than .05 (i.e. 5%)
• You then say that the null hypothesis is rejected at the .05 level

What does it mean?• Does this mean that
– the null hypothesis has less than .05 chance of being true?
– The alternative hypothesis has at least 95% chance of being true?
• Experiment– Null hypothesis: Coin in my pocket is an ordinary fair coin
– Alternative—coin is double headed
– Flip the coin once—comes up heads
– Probability of a result that far in that direction is .5
– Do we conclude that the probability that the coin is double headed is .5?
• What's wrong with the (common) misunderstanding– .05 is the probability of our result if the null hypothesis is true
– not the probability it is true if we get that result
– very few random coins are double headed
– So the combined chance that the coin is fair and it came up heads (about .5)
– is much higher than the combined chance that it is double headed (say one in a million) and came up heads (one in one)
• So after one head–even three–we still think the odds are it is a fair coin

To Restate• Confidence level says how strong this piece of
evidence against the null hypothesis is– but not how likely the null hypothesis is to be true– analogously, it might be that a witness identification has
only one chance in four of being wrong by chance– but if you have a solid alibi, you still get acquitted
• "Statistically significant" doesn't mean "important" it means "unlikely to occur by chance– suppose I take a random coin and flip it 10,000 times– the result will prove it isn't a fair coin to a very high level
of significance
• Even if it is "unfair" only by .501 vs .499 probability

Digression• How likely is it that a bridge deal will be 13 spades to one player, 13
hearts to another, …?– How about any other deal?– So why, in the first case, do we conclude that someone stacked the deck?
• Suppose a coin is fair• Flip it 100 times. Heads 53 times. What question do you ask?
– How likely is it that a fair coin will come up 53/47? Not very. Coin must not be fair?
– But you get the same answer for 52/48. Any single outcome rather unlikely– Ask instead, how likely is it that the evidence against a fair coin is at least this
strong, i.e.• At least 53 heads or at least 53 tails• Pretty likely
– That is a two tailed test. The null hypothesis is a fair coin, and if unfair you don’t know which way
– If you somehow knew the coin was either fair or weighted towards heads, use a one tailed test—how likely is it that I will get at least 53 heads out of 100.

Everything is Unlikely• Any particular series of heads and tails with coins, any particular
bridge deal
• But "some sequence that ends up 50/50" is more likely than any particular sequence
• And if your suspicion is a weighted coin, the question isn't– How likely is this result with a fair coin (very unlikely, whatever the result) but
– How likely is a result at least this far from the mean with a fair coin
– Since any result far from the mean inclines you to reject the "fair coin" hypothesis
• And your real question is "how likely am I to reject that hypothesis if it is true?"

Normal Distribution and z• Suppose you know the distributions of heights is
normal– With mean 70” – Standard deviation 3”– And the criminal was less than 5’4” tall
• The suspect is 5’3”. How good evidence is that?– How likely is it that a random person– Would be less than 5’4”?
• 5’4” is 6” under the mean, stdev=3, z=-2– How many people are that far below the mean of a normal
distribution?– Look up z=-2 on p. 525: .0228– So about 2% of people are at least that short
For practice, try it with other heights, stdev, mean

Central Limit Theorem• Population mean M, standard Deviation • Take a sample of size N
– The average of the sample is an unbiased estimate of M
– The StDev calculated from the sample (dividing by N-1 instead of N) is an unbiased estimate of
• Suppose you repeated the experiment many times.• Each time you get an average value• The standard deviation of those averages is /N • So the bigger N, the closer the sample mean is to the population mean
• Why does this matter?– To test the hypothesis that the population mean is 10
– You take a sample of size 16, calculate mean 8, =2• How likely is it that your sample mean would be that far off if the hypothesis is true?• Compare the deviation (2) with the standard deviation• Not of a sample of one but of the mean of a sample of 16 /16=.5, so four standard deviations off. Unlikely.

A Law School Version• Are law students unusually tall?• Take samples of 1000 people, 100 law students, • Average height 70”, stdev 3”
– For the law students, average height is 71”– Is that good evidence?
• What is the standard deviation– Of the mean of 100 observations (law students?)– Given that the stdev of one observation is 3”?
• Central limit theorem: StDev of mean =stdev/√n– 3/ √100=.3, so z=1/.3=3.3– Probability of z that big is?

Specification Search• How to make a fortune giving investment advice
– Find the names of 8000 potential customers
– Create two versions of an investment newsletter, send them out• One has innocuous advice--and bonds are going up next month
• The other has innocuous advice--and bonds are going down next month
• Wait a month, cross off half the names
– And repeat
– The fourth month you have 1000 convinced customers
• How to prove that Diet Coke causes cancer– Take a sample of 1000 people
– Ask each what things he consumes, does he have cancer
– Find that the relation between diet coke and cancer
– Is significant at the .05 level
• The book offers two more examples
• You get the problem without even trying to make it happen
• But nowadays, there are programs designed to try: A specification search
• Why you web your data and let other people play with it

Correlation is Not Causation• Facts don't speak for themselves.• Consider Peltzman's analysis of the effect of requiring
seatbelts (and some other things)– Before the requirement, say, 40% of crashes were fatal, after 30%– After the requirement, 10,000 crashes/year.– So the requirement saved 1000 lives/year– What is the hidden assumption in this argument?– Why might it be wrong?
• Suppose you want to know whether the death penalty deters murder– How might you find out?– Compare murder rates in states with and without? What is wrong
with that approach?– Is there a better way?

Kinds of errors• Hypothesis: The defendant is guilty
– He is guilty, and we convict him– He is innocent, and we acquit him– He guilty and we acquit him– He is innocent and we convict him
Type I Error
Type II Error
Type I: Reject a true hypothesis
Type II: Fail to reject a false hypothesis
• Note that which error is which– Depends on which we call our null hypothesis– Is it guilt or innocence?
• You can trade off one error against the other– In the law--standard of proof– Statistics--how high a confidence level you require