statistics on research and innovation
TRANSCRIPT

Statistics on Research and Innovation
Update 2015

2
CONTENTS
Foreword .................................................................................................................................................................................................................................................................. 4
5. Policy and financial measures for science and technology ............................................................................................................................................................... 5
Figure 5.1 - EU FP7 funding to R&S in some OECD countries, 2008-2012 .................................................................................................................................................................... 6
Figure 5.2 -EU structural funds for research, technology, development, innovation allocated to some EU countries, 2007-2013 ................................................... 7
Figure 5.3 - Sectoral distribution of the number of venture capital investment in high-tech industries in Italy, 2013........................................................................... 8
Figure 5.4 - Venture capital investment in high-tech industries on total investment in high-tech industries in Italy, 2006-2013 .................................................... 9
Figure 5.5 - Venture capital investment in some OECD and non-OECD countries, 2012 ..................................................................................................................................... 10
Figure 5.6 - Venture capital investment on GDP by stage of development in some OECD countries, 2012 ................................................................................................ 11
6. R&D personnel in Italy .................................................................................................................................................................................................................................12
Table 6.1 - R&D personnel in Italy, 2007-2012 ....................................................................................................................................................................................................................... 13
Figure 6.1 - R&D personnel by institutional sector in Italy, 2000-2012 ...................................................................................................................................................................... 14
Figure 6.2 - Researchers in some OECD and non-OECD countries, 2012 .................................................................................................................................................................... 15
Figure 6.3 - Researchers by sector of performance in some OECD and non-OECD countries, 2011 .............................................................................................................. 16
Figure 6.4 - Researchers per 1000 employees in some OECD and non-OECD countries, 2012 ......................................................................................................................... 17
Figure 6.5 - Human resources in science and technology on total employment in some OECD and non-OECD countries, 2011 ..................................................... 18
7. Patents ................................................................................................................................................................................................................................................................19
Figure 7.1 - Triadic patents filed (EPO, JPO) and granted (USPTO) in some OECD and non-OECD countries, 2012 ............................................................................. 20
Figure 7.2 - Patent grants with the Patent Cooperation Treaty (PCT) in some OECD and non-OECD countries, 2013 ....................................................................... 21
Figure 7.3 - High-tech patent applications to the EPO in some OECD countries, 2011 ........................................................................................................................................ 22
Figure 7.4 - Patents, trademarks and industrial designs filed at EC Offices in some OECD and non-OECD countries, 2010-2012 ................................................. 23
Figure 7.5 - Top two technologies patented by technology fields on total patent applications in some OECD and non-OECD countries, 2009-2011 ......... 24
Figure 7.6 - Patents citing non-patent literature by technology field in some OECD and non-OECD countries, 2007-2012 ............................................................. 25

3
8. Publications ......................................................................................................................................................................................................................................................26
Figure 8.1 - Scientific publications by Italian authors in the most important international journals, 2000-2011 ................................................................................ 27
Figure 8.2 - Scientific publications by Italian authors in several disciplines on the Italian total, 2011 ...................................................................................................... 28
Figure 8.3 - Scientific publications by Italian authors in several disciplines on the world total of each discipline, 2011 ................................................................... 29
Figure 8.4 - Scientific articles by authors of some OECD and non-OECD countries on the world total, 2011 ........................................................................................... 30
Figure 8.5 - Top cited publications in international collaboration as a percentage of scientific publications in some OECD and non-OECD countries,
2003-2011 .................................................................................................................................................................................................................................................................................................... 31
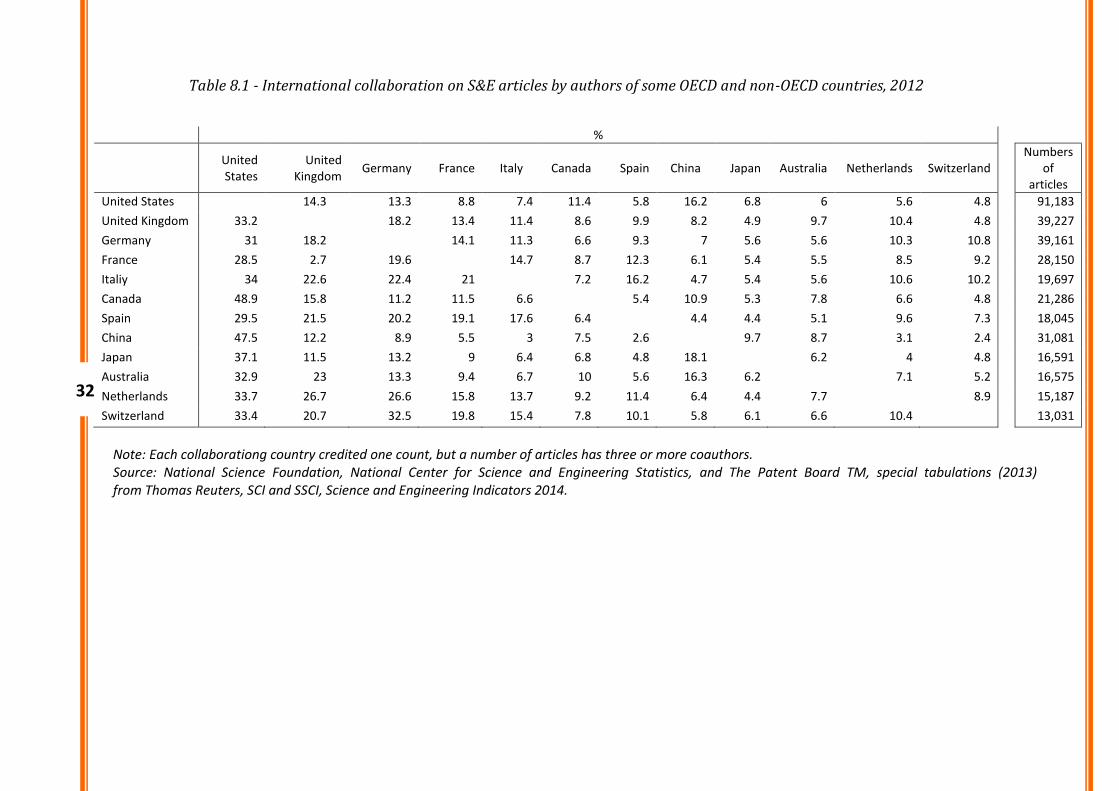
Table 8.1 - International collaboration on S&E articles by authors of some OECD and non-OECD countries, 2012 ............................................................................. 32
9. International trade of technology ............................................................................................................................................................................................................33
Figure 9.1 - TBP payments and receipts in some OECD countries, 2012 ..................................................................................................................................................................... 34
Figure 9.2 - TBP payments over R&D expenditure in some OECD countries, 2012 ................................................................................................................................................ 35
Figure 9.3 - Trade by groups of Italian high-tech products, 2009 and 2012 ............................................................................................................................................................ 36
Figure 9.4 - Italian export market shares over total OECD exports in some high-tech manufacturing sectors, 2005-2013 .............................................................. 37
Figure 9.5 - Trade of high-tech goods in some OECD countries, 2011.......................................................................................................................................................................... 38

4
English edition
Statistics on Research and Innovation - 2015
FOREWORD
The National Research Council (CNR) continues updating the publication “Statistics on Research and Innovation – ITALY” that has been edited by the
Institute of research on firms and development (CERIS), 2010.
The publication can be considered a work in progress, which presents selected data, as soon as they are available, as well as tables and figures with new
indicators on science, technology and innovation.
For a long time the Rome research unit of the Research Institute of Sustainable Economic Growth-IRCRES (former CERIS) has been carrying out an activity
of documentation and elaboration of indicators and data concerning the sector of science and technology. Anna Maria Scarda (IRCRES-CNR associate)
handled the selection and construction of the most relevant indicators, with the contribution of Mario De Marchi and the technical assistance of Enrico
Viarisio of the Turin headquarter of IRCRES, who cooperates in collecting and elaborating the data and in drawing up graphs and tables.
For enquiries about the publication, please contact:
Anna Maria Scarda ([email protected]),
Mario De Marchi ([email protected]),
Enrico Viarisio ([email protected]).

5
5. POLICY AND FINANCIAL MEASURES FOR SCIENCE AND TECHNOLOGY

6
Figure 5.1 - EU FP7 funding to R&S in some OECD countries, 2008-2012
Note: Financial contribution refers to retained proposals Source: European Commission, Innovation Union Competitiveness Report 2013
489
634
666
800
861
961
1,561
1,595
2,615
2,624
3,071
3,879
5,223
6,028
17.8
8.3
11.2
11.2
11.6
11.6
15.2
21.1
21.3
18.5
15.5
8.6
16.9
8.2
0 1,000 2,000 3,000 4,000 5,000 6,000 7,000
Ireland
Israel
Norway
Finland
Denmark
Austria
Switzerland
Belgium
Netherlands
Spain
Italia
France
United Kingdom
Germany
ITALY
% on GERDMillion euros

7
Figure 5.2 -EU structural funds for research, technology, development, innovation allocated to some EU countries, 2007-2013
Source: European Commission, Innovation Union Competitiveness Report 2013
3.5
1.5
2.2
1.2
3.4
3.2
4.7
4.1
3.3
4.6
13.3
11.5
0 1,000 2,000 3,000 4,000 5,000 6,000 7,000 8,000 9,000 10,000
Ireland
Denmark
Belgium
Netherlands
Austria
Sweden
Finland
United Kingdom
France
Germany
Spain
Italia
Poland
Million euros % on civil GBAORD 2007-2011
..
ITALY
8
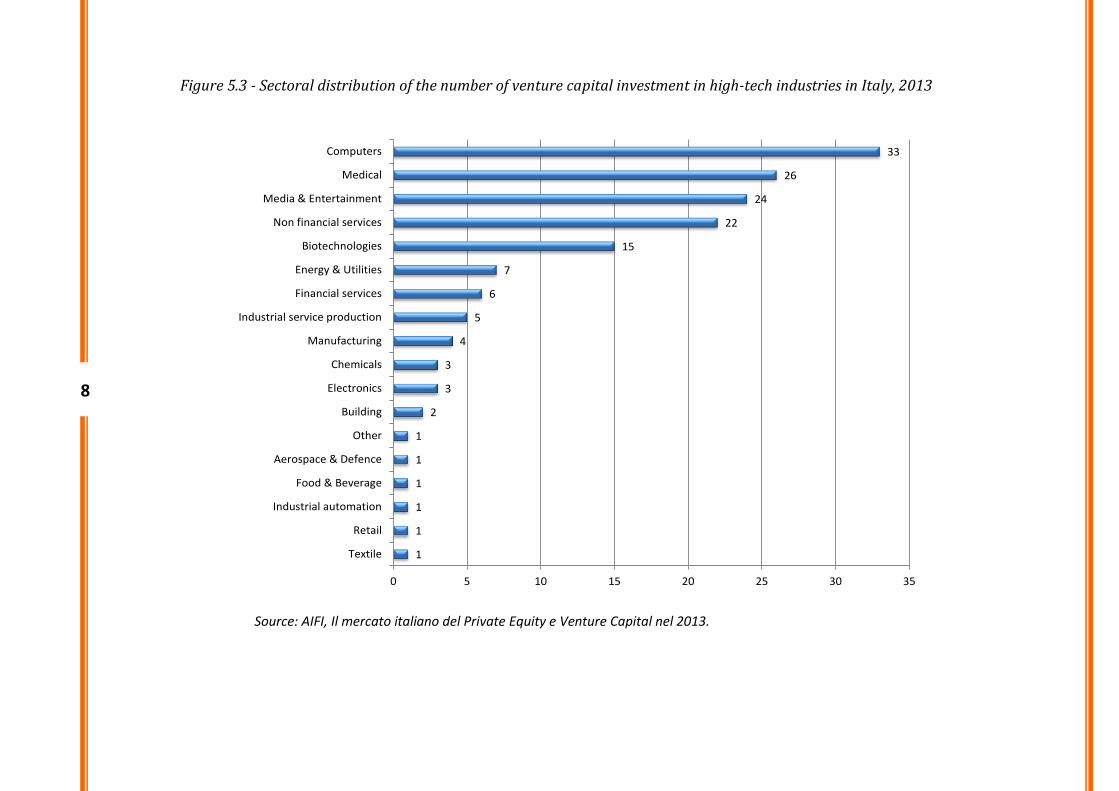
Figure 5.3 - Sectoral distribution of the number of venture capital investment in high-tech industries in Italy, 2013
Source: AIFI, Il mercato italiano del Private Equity e Venture Capital nel 2013.
1
1
1
1
1
1
2
3
3
4
5
6
7
15
22
24
26
33
0 5 10 15 20 25 30 35
Textile
Retail
Industrial automation
Food & Beverage
Aerospace & Defence
Other
Building
Electronics
Chemicals
Manufacturing
Industrial service production
Financial services
Energy & Utilities
Biotechnologies
Non financial services
Media & Entertainment
Medical
Computers

9
Figure 5.4 - Venture capital investment in high-tech industries on total investment in high-tech industries in Italy, 2006-2013
Source: AIFI, Il mercato italiano del Private Equity e Venture Capital nel 2013
7
4 4
21
37
8
26 2628
30
2426
24
32
4042
0
5
10
15
20
25
30
35
40
45
2006 2007 2008 2009 2010 2011 2012 2013
% on the total amount % on the total number

10
Figure 5.5 - Venture capital investment in some OECD and non-OECD countries, 2012
Note: (a) 2011
Source: OECD, Entrepreneurship at a Glance 2013
9.3
11.7
43.5
91.7
101.6
101.7
113.5
115.9
143.4
148.1
209.5
226.5
285.6
331.3
606.9
706.2
710.5
867.0
929.1
1,406.0
1,553.6
26,652.4
0 5,000 10,000 15,000 20,000 25,000 30,000
Russia(a)
Poland
Austria
Italia
Finland
Denmark
Ireland
Belgium
Norway
Spain
Switzerland
Netherlands
Sweden
Australia
korea
Germany
France
Israel
United Kingdom
Canada (a)
Japan (a)
United States
ITALY
Million US dollars

11
Figure 5.6 - Venture capital investment on GDP by stage of development in some OECD countries, 2012
Note: (a) 2011
Source: OECD, Entrepreneurship at a Glance 2013
0.0 0.5 1.0 1.5 2.0 2.5 3.0 3.5 4.0
Italy
Austria
Spain
Germany
Australia
Belgium
Japan (a)
France
Norway
Netherlands
Denmark
Switzerland
United Kingdom
Finland
Ireland
Sweden
Canada (a)
United States
Israel
Early stage Later stage
ITALY
% on GDP

12
6. R&D PERSONNEL IN ITALY

13
Table 6.1 - R&D personnel in Italy, 2007-2012
FTE units
2007 2008 2009 2010 2011 2012
Research sectors Researchers Other
personnel
Researchers Other
personnel
Researchers Other
personnel
Researchers Other
personnel
Researchers Other
personnel
Researchers Other
personnel
Public administrations 17,291 18,183 15,554 18,522 16,678 17,086 17,496 17,169 18,780 17,373 20,499 17,352
Universities (a) 38,860 32,203 39,809 32,665 43,067 31,883 43,470 28,828 43,828 29,895 45,223 30,984
Private non-profit
institutions (b) 3,978 4,102 3,894 4,028 3,953 4,092 4,162 2,295 3,735 2,005 3,906 2,053
Firms 32,871 60,899 36,509 70,134 38,143 71,626 38,298 73,915 39,808 72,670 41,067 79,095
Total 93,000 115,387 95,766 125,349 101,841 124,687 103,426 122,207 106,151 121,943 110,695 129,484
(a) Corrections of data on personnel engaged in research activities in some non-profit organizations has led to a sharp decline in 2010 data on staff researcher compared to 2009. Source: Istat

14
Figure 6.1 - R&D personnel by institutional sector in Italy, 2000-2012
Source: Istat
0
20,000
40,000
60,000
80,000
100,000
120,000
140,000
2000 2001 2002 2003 2004 2005 2006 2007 2008 2009 2010 2011 2012
Public administration and universities Firms and private non-profit institutions
of which researchers (public administration and universities) of which researchers (firms and non-profit institutions)
FTE units

15
Figure 6.2 - Researchers in some OECD and non-OECD countries, 2012
Source: OECD, Main Science and Technology Indicators, 2014-2
15.2
27.2
37.1
37.9
40.0
42.7
48.6
49.8
58.4
106.2
130.2
157.4
249.1
251.4
288.9
338.6
447.6
656.7
1,252.9
1,318.1
0 200 400 600 800 1,000 1,200 1,400
Ireland
Norway
Austria
Denmark
Finland
Belgium
Sweden
Israel
Netherlands
Italy
Spain
Canada
France
United Kingdom
Korea
Germany
Russia
Japan
United States
China
ITALY
FTE thousand units

16
Figure 6.3 - Researchers by sector of performance in some OECD and non-OECD countries, 2011
Note: (a) 2010
Note: (b) 2009
Source: OECD Science Technology and Industry Indicators Scoreboard 2013
0 10 20 30 40 50 60 70 80 90 100
Korea
Japan
Austria (b)
China
Denmark
Sweden
Canada (a)
Ireland
France (a)
Germany (b)
Finland
Netherlands (a)
Russia
Norway
Belgium (b)
Italy
Spain
United Kingdom
Business enterprise Government Higher education Private non-profit
ITALY
%

17
Figure 6.4 - Researchers per 1000 employees in some OECD and non-OECD countries, 2012
Note: (a) 2011
Source: OECD, Main Science and Technology Indicators, 2014-2
1.8
4.5
6.2
6.9
8.1
8.4
8.6
8.7
8.8
8.8
9.3
9.6
9.6
10
10.2
10.4
10.6
12.8
12.8
14.9
15.9
17.4
0 2 4 6 8 10 12 14 16 18 20
China
Italy
Russia
Spain
Netherlands
Germany
Ireland
United Kingdom
Canada
United States (a)
Austria
Belgium
France
Japan
Singapore
Norway
Sweden
Korea
Taiwan
Denmark
Finland
Israel
ITALY
%
18
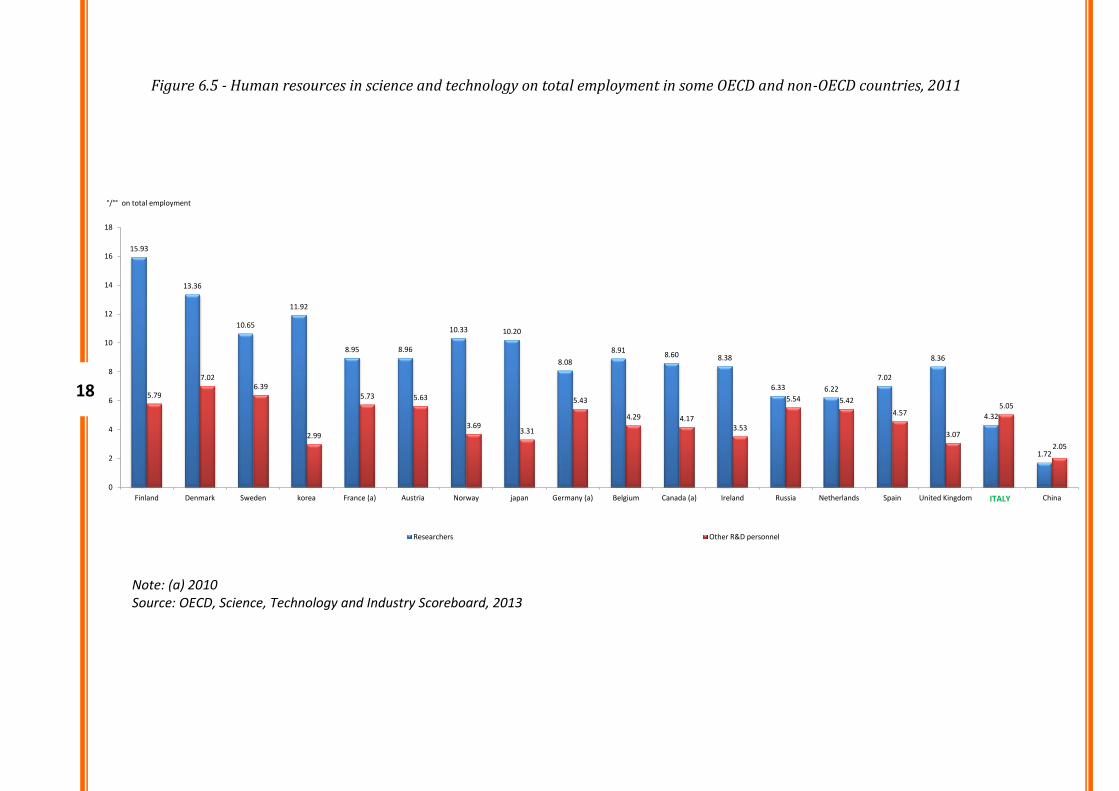
Figure 6.5 - Human resources in science and technology on total employment in some OECD and non-OECD countries, 2011
Note: (a) 2010 Source: OECD, Science, Technology and Industry Scoreboard, 2013
15.93
13.36
10.65
11.92
8.95 8.96
10.33 10.20
8.08
8.918.60 8.38
6.33 6.22
7.02
8.36
4.32
1.72
5.79
7.026.39
2.99
5.73 5.63
3.693.31
5.43
4.29 4.173.53
5.54 5.42
4.57
3.07
5.05
2.05
0
2
4
6
8
10
12
14
16
18
Finland Denmark Sweden korea France (a) Austria Norway japan Germany (a) Belgium Canada (a) Ireland Russia Netherlands Spain United Kingdom italia China
Researchers Other R&D personnel
ITALY
°/°° on total employment
19
7. PATENTS

20
Figure 7.1 - Triadic patents filed (EPO, JPO) and granted (USPTO) in some OECD and non-OECD countries, 2012
Note: OECD Secretariat estimates. Source: OECD, Main Science and Technology Indicators, 2014-2
556
696
700
783
1,145
1,716
1,851
2,555
2,878
5,468
13,765
15,391
0 2,000 4,000 6,000 8,000 10,000 12,000 14,000 16,000
Canada
Italia
Sweden
Netherlands
Switzerland
United Kingdom
China
France
korea
Germany
United States
Japan
ITALY
Number

21
Figure 7.2 - Patent grants with the Patent Cooperation Treaty (PCT) in some OECD and non-OECD countries, 2013
Note: (a) 2012 Source: WIPO Indicators 2014 Edition
3,635
4,752
4,756
5,127
5,235
5,575
6,550
6,564
8,114
10,368
11,405
13,858
17,112
23,833
31,638
127,330
207,688
277,079
277,835
0 50,000 100,000 150,000 200,000 250,000 300,000
Ukraine
New Zeland
South Africa
Algeria
United Kingdom
Singapore
DPR of Korea (a)
Hong Kong
Italia
Mexico
France
Germany
Australia
Canada
Russia
Korea
China
Japan
United States
number of patents
ITALY

22
Figure 7.3 - High-tech patent applications to the EPO in some OECD countries, 2011
Source: EUROSTAT database
3.7
4.8
5.3
5.4
9.7
13.7
20.8
21.0
21.1
23.7
24.7
25.4
30.5
32.9
34.9
36.5
36.6
37.2
38.4
47.6
57.5
0 10 20 30 40 50 60 70
New Zeland
Spain
Australia
Italy
Norway
United Kingdom
Austria
United States
Ireland
Canada
Belgium
France
Germany
Israel
Japan
Switzerland
Denmark
Netherlands
Korea
Finland
Sweden
ITALY
number per million inhabitants

23
Figure 7.4 - Patents, trademarks and industrial designs filed at EC Offices in some OECD and non-OECD countries, 2010-2012
Source: OECD Science Technology and Industry Scoreboard 2013
0 20 40 60 80 100 120 140 160
Australia
Israel
Poland
Finland
Denmark
Canada
Belgium
Austria
China
Sweden
Korea
Spain
Switzerland
Netherlands
Italy
United Kingdom
France
Japan
Germany
United States
Patents Trademarks Designs
thousands
ITALY

24
Figure 7.5 - Top two technologies patented by technology fields on total patent applications in some OECD and non-OECD countries, 2009-2011
Source: OECD Science Technology and Industry Scoreboard 2013
32.9
12.29.0 9.2
5.8
8.1
8.26
9.6
18.9
7.9 6.1
16.6
10.396.8 8.9
6.912.11
5.5
7.28.1
8.97.9
7.5 6.3
0
10
20
30
40
50
60
70
80
90
100
China India Canada United States Japan Germany Korea Brazil United Kingdom France Italy Russia
Others Civil engineering Handling & logistics Telecommunications Transport Semiconductors
Electrical machinery Medical technology Organic chemistry Pharmaceuticals Computer technology Digital communication
17,679 27,89652,680107,645132,2478,3365,033 9,39721,76116,5821,726 2,778
ITALY
%
Total PCT filings, 2009-11

25
Figure 7.6 - Patents citing non-patent literature by technology field in some OECD and non-OECD countries, 2007-2012
Source: OECD Science Technology and Industry Scoreboard 2013
0
5
10
15
20
25
30
Canada China Netherlands United Kingdom Sweden France United States Switzerland Japan Korea Germany Italy
Chemistry Electrical engineering Instruments Mechanical engineering Other fields
ITALY
138,80628,308129,30230,622 24,057
% on the total number of patents Number of patents submitted to the EPO
18,33812,584 26,36412,072 27,073
18.338
207,71050,844
26
8. PUBLICATIONS

27
Figure 8.1 - Scientific publications by Italian authors in the most important international journals, 2000-2011
Source: National Science Foundation, National Center for Science and Engineering Statistics, and The Patent Board TM, special tabulations (2013) from Thomas Reuters, SCI and SSCI, Science and Engineering Indicators 2014.
21,40922,093 22,483
23,76524,759 24,663
25,80526,561 26,854 26,770
26,348 26,503
0
5,000
10,000
15,000
20,000
25,000
30,000
2000 2001 2002 2003 2004 2005 2006 2007 2008 2009 2010 2011
number of articles

28
Figure 8.2 - Scientific publications by Italian authors in several disciplines on the Italian total, 2011
Source: National Science Foundation, National Center for Science and Engineering Statistics, and The Patent Board TM, special tabulations (2013) from Thomas Reuters, SCI and SSCI, Science and Engineering Indicators 2014.
7,317
4,812
3,365
3,095
2,670
1,520
778
757
720
585
448
296
140
27.6
18.2
12.7
11.7
10.1
5.7
2.9
2.8
2.7
2.2
1.7
1.1
0.5
0 1,000 2,000 3,000 4,000 5,000 6,000 7,000 8,000
Medical sciences
Biological sciences
Physics
Chemistry
Engineering
Geosciences
Mathematics
Agricultural sciences
Social sciences
Astronomy
Psychology
Computer sciences
Life sciences
% on the Italian total
N. of articles: 26.503
Number

29
Figure 8.3 - Scientific publications by Italian authors in several disciplines on the world total of each discipline, 2011
Source: National Science Foundation, National Center for Science and Engineering Statistics, and The Patent Board TM, special tabulations (2013) from Thomas Reuters, SCI and SSCI, Science and Engineering Indicators 2014.
3.2
1.4
5.5
4.3
4.0
1.9
2.1
3.3
3.0
3.1
2.7
3.0
4.0
0 20,000 40,000 60,000 80,000 100,000 120,000 140,000 160,000 180,000 200,000
Computer sciences
Life sciences
Astronomy
Mathematics
Agricultural sciences
Psychology
Social sciences
Geosciences
Engineering
Physics
Chemistry
Biological sciences
Medical sciences
% of Italy on the world total
N. of articles: 827.705
Number

30
Figure 8.4 - Scientific articles by authors of some OECD and non-OECD countries on the world total, 2011
Source: National Science Foundation, National Center for Science and Engineering Statistics, and The Patent Board TM, special tabulations (2013) from Thomas Reuters, SCI and SSCI, Science and Engineering Indicators 2014.
1
1
1.1
1.2
1.6
1.7
1.8
1.9
2.5
2.7
2.8
3.1
3.2
3.5
3.8
5.6
5.6
5.7
10.9
25.7
0 5 10 15 20 25 30
Turkey
Iran
Sweden
Switzerland
Brasil
Russia
Taiwan
Netherlands
Australia
India
Spain
Korea
Italia
Canada
France
Germany
United Kingdom
Japan
China
United States
ITALY
%

31
Figure 8.5 - Top cited publications in international collaboration as a percentage of scientific publications in some OECD and non-OECD countries, 2003-2011
Source: OECD Science Technology and Industry Scoreboard 2013
10.7
12.3
14.0
9.39.7
11.1
10.5 10.4
8.38.6
8.07.6
6.7
5.5
8.8
7.0
2.8
5.0
7.0
5.15.3
5.0 5.14.6
4.0
2.52.3
1.3
0.0
2.0
4.0
6.0
8.0
10.0
12.0
14.0
16.0
Switzerland Netherlands United States Germany Sweden United Kingdom Canada Australia France Italy Spain Korea Japan China
Domestic leading author Other leading author
%
ITALY
32
Table 8.1 - International collaboration on S&E articles by authors of some OECD and non-OECD countries, 2012
%
United States
United Kingdom
Germany France Italy Canada Spain China Japan Australia Netherlands Switzerland
Numbers of
articles
United States 14.3 13.3 8.8 7.4 11.4 5.8 16.2 6.8 6 5.6 4.8
91,183
United Kingdom 33.2 18.2 13.4 11.4 8.6 9.9 8.2 4.9 9.7 10.4 4.8
39,227
Germany 31 18.2 14.1 11.3 6.6 9.3 7 5.6 5.6 10.3 10.8
39,161
France 28.5 2.7 19.6 14.7 8.7 12.3 6.1 5.4 5.5 8.5 9.2
28,150
Italiy 34 22.6 22.4 21 7.2 16.2 4.7 5.4 5.6 10.6 10.2
19,697
Canada 48.9 15.8 11.2 11.5 6.6 5.4 10.9 5.3 7.8 6.6 4.8
21,286
Spain 29.5 21.5 20.2 19.1 17.6 6.4 4.4 4.4 5.1 9.6 7.3
18,045
China 47.5 12.2 8.9 5.5 3 7.5 2.6 9.7 8.7 3.1 2.4
31,081
Japan 37.1 11.5 13.2 9 6.4 6.8 4.8 18.1 6.2 4 4.8
16,591
Australia 32.9 23 13.3 9.4 6.7 10 5.6 16.3 6.2 7.1 5.2
16,575
Netherlands 33.7 26.7 26.6 15.8 13.7 9.2 11.4 6.4 4.4 7.7 8.9
15,187
Switzerland 33.4 20.7 32.5 19.8 15.4 7.8 10.1 5.8 6.1 6.6 10.4
13,031
Note: Each collaborationg country credited one count, but a number of articles has three or more coauthors. Source: National Science Foundation, National Center for Science and Engineering Statistics, and The Patent Board TM, special tabulations (2013) from Thomas Reuters, SCI and SSCI, Science and Engineering Indicators 2014.

33
9. INTERNATIONAL TRADE OF TECHNOLOGY

34
Figure 9.1 - TBP payments and receipts in some OECD countries, 2012
Source: OECD, MSTI, vol. 2014/2
-83,957
-54,727-49,154
-30,878
-12,535-5,623
-27,383
-12,432 -10,592 -12,587 -12,807
-2,451-8,848 -7,911
-4,518-11,052 -8,274
122,586
69,082
52,133
40,17136,963 34,102
28,725
20,46416,126 14,507 13,842 13,237
10,094 8,078 7,998 5,311 4,905
-100,000
-50,000
0
50,000
100,000
150,000
United States Germany Ireland Netherlands United Kingdom Japan Switzerland Sweden Spain Belgium Italy Israel Finland Denmark Austria Korea Australia
Payments Receipts
million US dollars
ITALY

35
Figure 9.2 - TBP payments over R&D expenditure in some OECD countries, 2012
Note: (a) 2011
Source: OECD, MSTI, vol. 2014/2
2.8
18.5
22.4
22.5
26.3
29.4
39.4
48.6
53.8
61.6
69.7
81.2
100.8
112.5
138.7
190.6
1,404.7
0 200 400 600 800 1,000 1,200 1,400 1,600
Japan
United States
Israel
Korea
Australia (a)
United Kingdom
Austria
Italy
Germania
Spain
Sweden
Denmark
Finland
Belgium
Switzerland
Netherlands
Ireland
ITALY
%

36
Figure 9.3 - Trade by groups of Italian high-tech products, 2009 and 2012
Source: Servizio Statistico Nazionale - Istat, Commercio estero e attività internazionali delle imprese 2014
11,149
-14,850
15,305
-17,522
8,854
-20,968
11,240
-22,615
3,757
-1,863
4,695
-1,883
-25,000
-20,000
-15,000
-10,000
-5,000
0
5,000
10,000
15,000
20,000
Pharmaceutical and chemical products Computers, electronic and optical instruments Aero and spacecrafts and related machinery
2009 2012
million euros(2005 constant prices)

37
Figure 9.4 - Italian export market shares over total OECD exports in some high-tech manufacturing sectors, 2005-2013
Source: OECD, Main Science and Technology Indicators, 2013-2, 2014-2
4.74.5
4.3
3.8
3.63.8
4.0
4.3
4.8
1.2
0.9 0.91.1
0.8 0.8
1.0
0.7 0.7
2.1
1.71.9
2.32.2 2.1
2.0 2.0 1.9
0
1
2
3
4
5
6
2005 2006 2007 2008 2009 2010 2011 2012 2013
Pharmaceuticals Computers, electronics, optics Aerospace
%

38
Figure 9.5 - Trade of high-tech goods in some OECD countries, 2011
Source: EUROSTAT, Science, technology and innovation in Europe, 2013
0
20,000
40,000
60,000
80,000
100,000
120,000
140,000
160,000
Belgium Czech Republic Germany Spain France Italia Hungary Netherlands Austria Sweden United Kingdom Ireland
Imports Exports
ITALY
Millions euros