statistics of imported foods monitoring for fy 2012 · 2 statistics of imported foods monitoring,...
TRANSCRIPT

(Attachment 2)
Contact: Quarantine Management Office, Policy Planning and Communication Division, Department of Food Safety, Pharmaceutical and Food Safety Bureau, Ministry of Health, Labour and Welfare (extension 2470, 2464)
Statistics of Imported Foods Monitoring for FY 2012
August 2013
Department of Food Safety, Pharmaceutical and Food Safety Bureau, Ministry of Health, Labour and Welfare

2
Statistics of Imported Foods Monitoring, for FY 2012 The present report summarizes situations of imported foods in FY 2012 such as the number and volume on a declaration basis, number of inspections, and number of violations against the Food Sanitation Law (Law No.233, 1947, referred to as ‘the Law’ hereinafter). 1. Declaration, Inspection and Violation by Year (Table 1 and Fig. 1)
The total number of imported foods (foods, additives, equipment, containers and packages or toys (referred to as ‘the food (s)’ correctively hereinafter) in FY 2012 was 2,181,495, and was 32,155,854 tons in volume on a declaration. Inspections were conducted for 223,380 products, accounting for 10.2% of all those declared, consisting of 62,432 administrative inspections (2.9% of all declared products), 168,475 inspections by registered inspection organizations (7.7%: including 82,448 ordered inspections), and 4,273 inspections by foreign official laboratories (0.2%). For 1,053 accounting for 0.04% of all declared products, measures such as reshipment, disposals, or diversion to non-food use were taken.
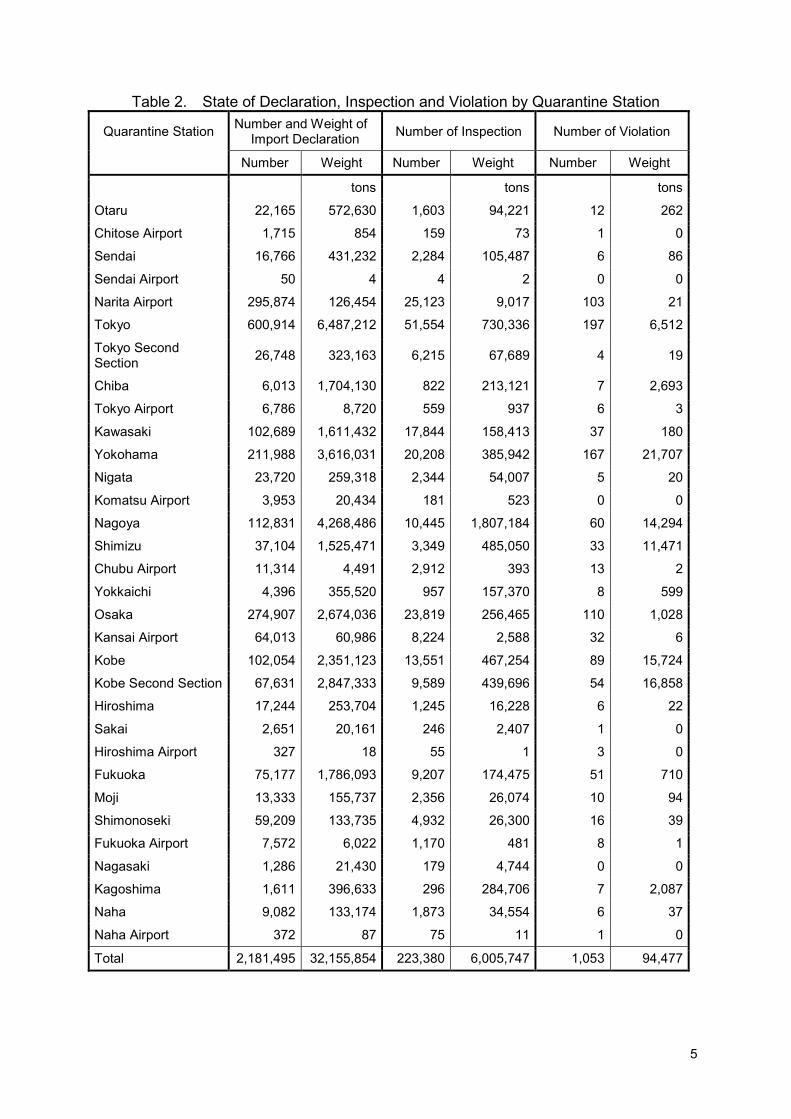
2. Declaration, Inspection and Violation by Quarantine Station (Table 2) For the number of declarations, the highest was 600,914 in Tokyo (27.5% of all declared products), followed by 295,874 in Narita Airport (13.6%), 274,907 in Osaka (12.6%), 211,988 in Yokohama (9.7%), 112,831 in Nagoya (5.2%), 102,689 in Kawasaki (4.7%), 102,054 (4.7%) in Kobe, and 75,177 in Fukuoka (3.4%).
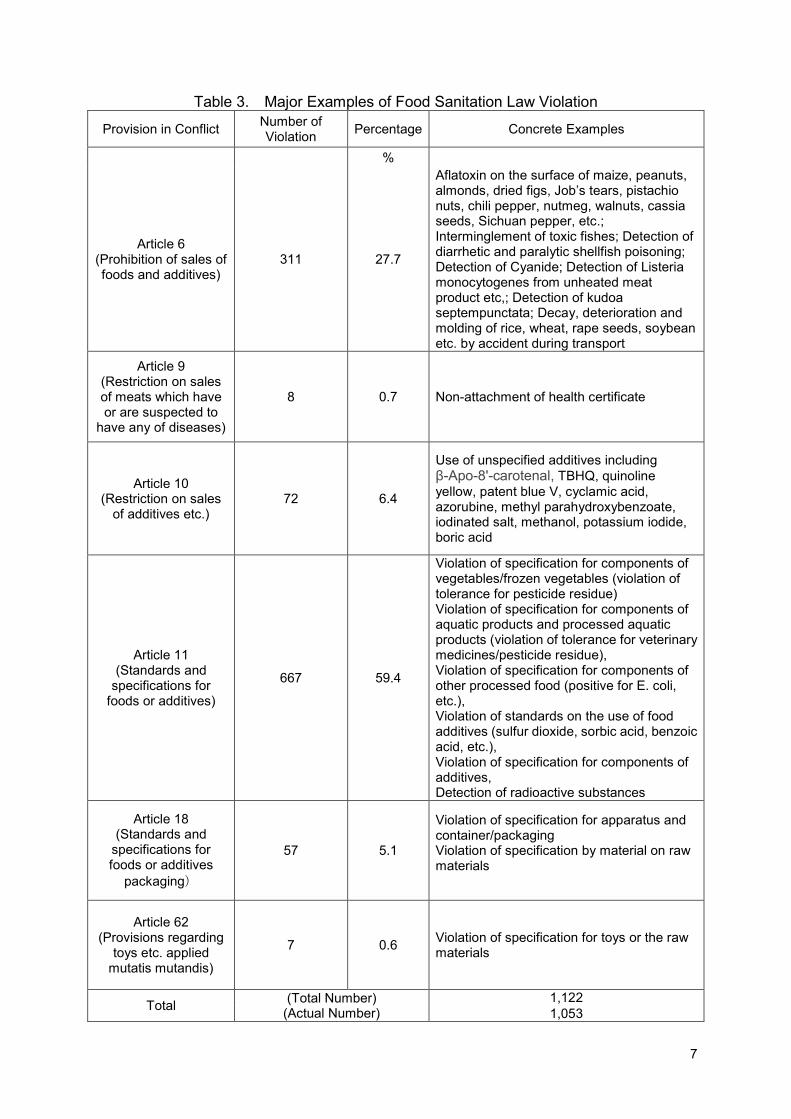
3. Major Violations against the Food Sanitation Law (Table 3 and Fig. 2)
Total number of violations was 1,053 (gross number: 1,122), consisting of 667 against Article 11 (59.4% of the gross number), 311 against Article 6 (27.7%), 72 against Article 10 (6.4%), 57 against Article 18 (5.1%), 8 against Article 9 (0.7%), and 7 against Article 62 (0.6%), in descending order.
3
4. Declaration, Inspection and Violation by Product (Table 4 and Fig. 3) For the number of declarations by product, beverage including alcohol accounts for the highest, 193,397 (8.9% of all declared products), followed by tableware, 172,893 (7.9%), preparations of vegetables (other than processed mushroom, spices, processed herb and tea), 163,324 (7.5%), fresh meat (including internal organs), 161,324 (7.4%), other tools and apparatus, 128,331 (5.9%), and processed fish product, 99,656 (4.6%). Cereals have the highest number of violations with 161 (15.3% of the total number of violations), followed by processed aquatic animal product (other than fish and shellfish) 139 (13.2%), seeds and nuts 74 (7.0%), preparations of vegetables (other than processed mushroom, spices, processed herb and tea) 63 (6.0%), and vegetables 50 (4.7%).
5. Declaration, Inspection and Violation by Country of Origin (Table 5 and Fig.
4) China accounts for the highest with 650,431 (29.8% of all declared products), followed by the US with 234,245 (10.7%), France, 210,978 (9.7%), Thailand, 155,770 (7.1%), Korea, 146,982 (6.7%), and Italy, 105,950 (4.9%) for the number of declarations by country of origin. China accounts for the highest with 221 (21.0% of the total number of violations), followed by US with 190 (18.0%), Socialist Republic of Viet Nam with 103 (9.8%), Thailand with 84 (8.0%), and India with 63 (6.0%) for the number of violations by country of origin.

4
Table 1. State of Declaration Inspection and Violation by Year
Item
Year
Number of Declaration
Year-to- year
Comparison
Weight of Imports
Total Number of Inspection (Note 1)
Percentage (Note 2)
Breakdown of Inspection
Number of Violation
Percentage (Note 2) Breakdown of
Inspection Percentage
(Note 2)
By Registered Inspection
Agency (Note 3,4)
Percentage (Note 2)
By Foreign Official
Laboratories
Percentage (Note 2)
% Thousandtons
% % % % %
1965 94,986 12,765 5,574 5.9 679 0.7
1975 246,507 20,775 21,461 8.7 1,634 0.7
1981 346,711 110.4 23,057 39,026 11.3 20,887 6.0 20,528 5.9 964 0.3
1982 319,617 92.2 21,484 34,447 10.8 17,012 5.3 20,215 6.3 569 0.2
1983 334,829 104.8 21,924 32,835 9.8 16,100 4.8 19,623 5.9 413 0.1 469 0.1
1984 364,227 108.8 22,465 36,062 9.9 16,762 4.6 22,263 6.1 853 0.2 444 0.1
1985 384,728 105.6 22,665 39,817 10.3 14,892 3.9 26,054 6.8 1,904 0.5 308 0.1
1986 477,016 124.0 22,284 57,553 12.1 20,451 4.3 37,434 7.8 4,127 0.9 558 0.1
1987 550,568 115.4 22,055 72,115 13.1 26,774 4.9 44,944 8.2 6,332 1.2 572 0.1
1988 655,806 119.1 21,924 99,659 15.2 24,306 3.7 58,663 8.9 23,905 3.6 1,000 0.2
1989 682,182 104.0 21,866 123,294 18.1 23,613 3.5 70,033 10.3 38,974 5.7 956 0.1
1990 678,965 99.5 21,731 119,345 17.6 25,091 3.7 59,063 8.7 47,674 7.0 993 0.1
1991 720,950 106.2 23,704 120,701 16.7 30,102 4.2 67,063 9.3 38,411 5.3 968 0.1
1992 779,460 108.1 25,035 124,572 16.0 45,632 5.9 72,789 9.3 21,377 2.7 1,051 0.1
1993 848,319 108.8 25,462 124,578 14.7 43,960 5.2 72,396 8.5 19,242 2.3 798 0.1
1994 963,359 113.6 30,594 132,659 13.8 48,446 5.0 74,619 7.7 21,252 2.2 1,126 0.1
1995 1,052,030 109.2 28,268 141,128 13.4 60,787 5.8 74,634 7.1 19,760 1.9 948 0.1
1996 1,117,044 106.2 26,068 119,630 10.7 60,142 5.4 62,385 5.6 6,385 0.6 781 0.1
(17,777)
1997 1,182,816 105.9 28,906 98,774 8.4 41,922 3.5 55,675 4.7 6,395 0.5 775 0.1
(33,440)
1998 1,276,994 108.0 29,150 104,918 8.2 48,439 3.8 55,911 4.4 6,553 0.5 881 0.1
(34,677)
1999 1,404,110 110.0 28,928 108,515 7.7 49,289 3.5 62,276 4.4 4,111 0.3 948 0.1
(37,013)
2000 1,550,925 110.5 30,034 112,281 7.2 52,244 3.4 63,789 4.1 3,796 0.2 1,037 0.1
(37,484)
2001 1,607,011 103.6 32,508 109,733 6.8 45,353 2.8 66,620 4.1 4,861 0.3 992 0.1
(40,138)
2002 1,618,880 100.7 33,202 136,087 8.4 63,689 3.9 78,327 4.8 6,379 0.4 972 0.1
(47,333)
2003 1,683,176 104.0 34,162 170,872 10.2 70,233 4.2 107,257 6.4 5,957 0.4 1,430 0.1
(64,967)
2004 1,791,224 106.4 34,270 188,904 10.5 65,119 3.6 127,294 7.1 6,181 0.3 1,143 0.1
(81,839)
2005 1,864,412 104.1 33,782 189,362 10.2 66,147 3.5 125,083 6.7 7,919 0.4 935 0.1
(73,589)
2006 1,859,281 99.7 34,096 198,936 10.7 61,811 3.3 139,991 7.5 6,953 0.4 1,530 0.1
(87,779)
2007 1,797,086 96.7 32,261 198,542 11.0 58,299 3.2 144,846 8.1 5,818 0.3 1,150 0.1
(94,598)
2008 1,759,123 97.9 31,551 193,917 11.0 58,706 3.3 140,878 8.0 6,208 0.4 1,150 0.1
(95,490)
2009 1,821,269 103.5 30,605 231,638 12.7 56,518 3.1 184,726 10.1 5,925 0.3 1,559 0.1
(110,308)
2010 2,001,020 109.9 31,802 247,047 12.3 57,359 2.9 195,954 9.8 6,200 0.3 1,376 0.1
(118,721)
2011 2,096,127 104.8 33,407 231,776 11.1 58,941 2.8 180,023 8.6 5,546 0.3 1,257 0.1
(99,117)
2012 2,181,495 104.1 32,156 223,380 10.2 62,432 2.9 168,475 7.7 4,273 0.2 1,053 0.0
(82,448)
Note 1: The values are determined by subtracting duplication from the total number of inspections implemented by administrative agency, registered inspection agency and foreign official laboratories.
Note 2: Proportion to the Number of Declaration Note 3: Values in parentheses are the number of compulsory inspection implemented by registered inspection agency. Note 4: Including local hygienic laboratory
5
Table 2. State of Declaration, Inspection and Violation by Quarantine Station
Quarantine Station Number and Weight of Import Declaration Number of Inspection Number of Violation
Number Weight Number Weight Number Weight
tons tons tons
Otaru 22,165 572,630 1,603 94,221 12 262
Chitose Airport 1,715 854 159 73 1 0
Sendai 16,766 431,232 2,284 105,487 6 86
Sendai Airport 50 4 4 2 0 0
Narita Airport 295,874 126,454 25,123 9,017 103 21
Tokyo 600,914 6,487,212 51,554 730,336 197 6,512
Tokyo Second Section 26,748 323,163 6,215 67,689 4 19
Chiba 6,013 1,704,130 822 213,121 7 2,693
Tokyo Airport 6,786 8,720 559 937 6 3
Kawasaki 102,689 1,611,432 17,844 158,413 37 180
Yokohama 211,988 3,616,031 20,208 385,942 167 21,707
Nigata 23,720 259,318 2,344 54,007 5 20
Komatsu Airport 3,953 20,434 181 523 0 0
Nagoya 112,831 4,268,486 10,445 1,807,184 60 14,294
Shimizu 37,104 1,525,471 3,349 485,050 33 11,471
Chubu Airport 11,314 4,491 2,912 393 13 2
Yokkaichi 4,396 355,520 957 157,370 8 599
Osaka 274,907 2,674,036 23,819 256,465 110 1,028
Kansai Airport 64,013 60,986 8,224 2,588 32 6
Kobe 102,054 2,351,123 13,551 467,254 89 15,724
Kobe Second Section 67,631 2,847,333 9,589 439,696 54 16,858
Hiroshima 17,244 253,704 1,245 16,228 6 22
Sakai 2,651 20,161 246 2,407 1 0
Hiroshima Airport 327 18 55 1 3 0
Fukuoka 75,177 1,786,093 9,207 174,475 51 710
Moji 13,333 155,737 2,356 26,074 10 94
Shimonoseki 59,209 133,735 4,932 26,300 16 39
Fukuoka Airport 7,572 6,022 1,170 481 8 1
Nagasaki 1,286 21,430 179 4,744 0 0
Kagoshima 1,611 396,633 296 284,706 7 2,087
Naha 9,082 133,174 1,873 34,554 6 37
Naha Airport 372 87 75 11 1 0
Total 2,181,495 32,155,854 223,380 6,005,747 1,053 94,477

6
0
10
20
30
40
50
60
70
80
90
100
110
120
130
140
150
160
170
180
190
200
210
220
1975 1976 1977 1978 1979 1980 1981 1982 1983 1984 1985 1986 1987 1988 1989 1990 1991 1992 1993 1994 1995 1996 1997 1998 1999 2000 2001 2002 2003 2004 2005 2006 2007 2008 2009 2010 2011 2012
0
5
10
15
20
25
30
35
40
45
50
55
60
65
Number of Declaration
Weight of imports
Wei
ght o
f Im
ports
(mill
ion
tons
))
Num
ber o
f Dec
lara
tion
(ten
thou
sand
)
(year)
Figure 1. Changes in Number and Weight of Import Declaration by Year
(Year)
Num
ber o
f Dec
lara
tion
(ten
thou
sand
)
Wei
ght o
f Im
ports
(mill
ion
tons
)
Number of Declaration
Weight of imports
7
Table 3. Major Examples of Food Sanitation Law Violation
Provision in Conflict Number of Violation Percentage Concrete Examples
%
Article 6 (Prohibition of sales of foods and additives)
311 27.7
Aflatoxin on the surface of maize, peanuts, almonds, dried figs, Job’s tears, pistachio nuts, chili pepper, nutmeg, walnuts, cassia seeds, Sichuan pepper, etc.; Interminglement of toxic fishes; Detection of diarrhetic and paralytic shellfish poisoning; Detection of Cyanide; Detection of Listeria monocytogenes from unheated meat product etc,; Detection of kudoa septempunctata; Decay, deterioration and molding of rice, wheat, rape seeds, soybean etc. by accident during transport
Article 9 (Restriction on sales of meats which have or are suspected to
have any of diseases)
8 0.7 Non-attachment of health certificate
Article 10 (Restriction on sales
of additives etc.) 72 6.4
Use of unspecified additives including β-Apo-8'-carotenal, TBHQ, quinoline yellow, patent blue V, cyclamic acid, azorubine, methyl parahydroxybenzoate, iodinated salt, methanol, potassium iodide, boric acid
Article 11 (Standards and
specifications for foods or additives)
667 59.4
Violation of specification for components of vegetables/frozen vegetables (violation of tolerance for pesticide residue) Violation of specification for components of aquatic products and processed aquatic products (violation of tolerance for veterinary medicines/pesticide residue), Violation of specification for components of other processed food (positive for E. coli, etc.), Violation of standards on the use of food additives (sulfur dioxide, sorbic acid, benzoic acid, etc.), Violation of specification for components of additives, Detection of radioactive substances
Article 18 (Standards and
specifications for foods or additives
packaging)
57 5.1
Violation of specification for apparatus and container/packaging Violation of specification by material on raw materials
Article 62 (Provisions regarding
toys etc. applied mutatis mutandis)
7 0.6 Violation of specification for toys or the raw materials
Total (Total Number) (Actual Number)
1,122 1,053

8
Provision in Conflict Number of Violation
Percentage (%)
Article 6 311 27.7 Article 9 8 0.7 Article 10 72 6.4 Article 11 667 59.4 Article 18 57 5.1 Article 62 7 0.6 Total 1,122 100.0
Figure 2. Composition of Violations by Article
Total number of violation:
1,122 Actual number:
1,053 8
72
667
57
311
7
Article 10
Article 9
Article 6 Article 18
Article 11
Article 62

9
Table 4. Number of Declaration, Inspection and Violation by Item
Certification of Items Number and Weight of Import
Declaration Number of Inspection Number of Violation
Number Weight Number Weight Number Weight
tons tons tons
Livestock food 163,380 1,998,065 8,390 42,195 10 1
Fresh meat (including internal organs) 161,324 1,968,096 8,385 42,095 10 1
Beef 69,018 575,284 6,115 19,804 8 1
Water buffalo meat 0 0 0 0 0 0
Pork 57,623 942,227 618 8,695 2 1
Boar meat 0 0 0 0 0 0
Horsemeat 1,981 5,308 750 1,516 0 0
Mule 0 0 0 0 0 0
Mutton and lamb 1,751 16,750 121 1,374 0 0
Goat meat 24 250 1 19 0 0
Rabbit meat 170 37 11 6 0 0
Other flesh 58 104 8 23 0 0
Chicken 22,719 423,071 598 10,621 0 0
Domestic duck 4,589 3,994 88 22 0 0
Turkey 121 632 2 5 0 0
Other fowl 3,270 440 73 10 0 0
Milk 0 0 0 0 0 0
Bird eggs 29 829 3 89 0 0
Other fresh livestock food 2,027 29,140 2 12 0 0
Processed livestock food 163,931 1,082,491 28,800 244,285 42 43
Meat product 48,210 471,917 17,152 175,827 29 40
Dried meat product 791 2,039 207 782 0 0
Unheated meat product 5,821 3,252 1,952 969 23 23
Designated heated meat product 0 0 0 0 0 0
Heated meat product (heating after packaging) 4,121 30,479 1,637 14,339 1 0
Heated meat product (packaging after heating) 37,477 436,147 13,356 159,736 5 17
Other meat product 0 0 0 0 0 0
Milk and dairy product 91,760 429,578 2,966 13,146 9 1
Milk and cream in liquid state 136 2,396 43 458 0 0
Condensed/concentrated milk 10 182 1 7 0 0
Powdered milk 558 15,117 105 3,085 0 0
Fermented milk and lactobacillus drink 115 157 34 44 0 0
Butter 1,462 10,011 153 3,329 1 0
Cheese and cheese curd 76,886 239,497 1,801 2,566 5 1
Ice cream 1,556 8,940 345 1,168 3 0
Food made of milk as main material 5,676 93,945 190 1,192 0 0
Other dairy product 5,361 59,333 294 1,297 0 0
Processed egg product 1,907 28,372 122 1,364 0 0
Hen egg product 1,324 23,695 61 941 0 0
Other processed egg product 583 4,677 61 423 0 0
Flesh and fowl preparations 1,818 26,939 36 280 0 0
Meat extract 141 1,488 9 54 0 0
Blood preparations 18 123 0 0 0 0
Other flesh and fowl preparations 1,659 25,328 27 226 0 0
Other processed livestock product 20,236 125,683 8,524 53,668 4 2
Frozen food (other than meat product) 15,581 80,785 7,811 45,956 1 2
Tightly-packaged food pasteurized by pressing and heating 535 5,286 51 90 1 0
Honey 2,929 38,190 475 7,306 0 0
Royal Jelly 219 438 55 121 1 0
Propolis 335 99 52 9 0 0
Other processed livestock food 637 886 80 185 1 0
Aquatic food 120,053 1,042,027 9,913 97,763 59 811
Fish 83,375 727,635 4,913 27,883 6 15
Freshwater fish 2,654 7,080 2,058 4,467 3 2
Bonito, tuna, mackerel 40,642 303,258 77 1,600 0 0
Horse mackerel, yellowtail, dolphinfish 1,392 25,576 20 335 0 0
Sea bass, sea bream, croaker 4,419 19,040 111 744 0 0
Herring, sardine 491 27,584 27 903 0 0
Codfish 729 19,251 31 1,136 0 0
Flatfish, sole 3,756 33,798 1,236 3,693 1 2
Grouper 150 80 66 36 0 0
Barracuda 174 420 4 13 0 0
Snapper 73 181 20 45 0 0
Globefish 322 5,383 322 5,383 1 10
Other fish 28,573 285,984 941 9,526 1 1
Shellfish 11,652 56,108 1,821 35,758 10 274
Bivalve 8,802 51,235 1,750 35,641 10 274
Snail 2,850 4,873 71 117 0 0
Aquatic animals 18,884 196,970 3,040 33,405 43 522
Lobster, prawn, shrimp 12,039 97,393 2,734 30,089 42 521
Crab 3,382 30,564 169 1,688 0 0
Other crustacean 15 5 2 0 0 0
Other aquatic animals 3,448 69,009 135 1,628 1 1
Seaweed 486 5,459 23 129 0 0
Sea tangle 0 0 0 0 0 0
Laver 2 0 0 0 0 0
Wakame 195 5,392 7 125 0 0
Agar-agar 6 1 1 0 0 0
Other seaweed 283 66 15 4 0 0
Other aquatic food 5,656 55,854 116 590 0 0
Processed aquatic food 198,285 1,230,514 34,417 202,346 200 889
Processed fish product 99,656 725,294 9,704 52,104 49 194
Sliced/shucked fresh fish (including frozen food) 35,925 230,989 2,284 12,713 17 83
Dried fish product 4,642 23,158 535 1,863 0 0
Processed and cooked fish 5,867 41,825 381 1,821 0 0
Frozen food 40,133 176,899 5,480 24,454 25 69
Tightly-packaged food pasteurized by pressing and heating 1,328 14,943 131 767 0 0
Fish meat kneaded products 9,775 227,582 741 9,785 7 43
Other processed fish product 1,986 9,897 152 701 0 0
Processed shellfish product 9,388 52,548 4,382 37,680 10 70
Sliced/shucked fresh shellfish (including frozen food) 5,186 12,417 1,842 6,712 2 4

10
Table 4. Number of Declaration, Inspection and Violation by Item
Certification of Items Number and Weight of Import
Declaration Number of Inspection Number of Violation
Number Weight Number Weight Number Weight
Dried shellfish 124 287 49 159 0 0
Processed and cooked shellfish 1,028 9,249 535 7,035 0 0
Frozen food 2,145 25,331 1,638 20,604 5 34
Tightly-packaged food pasteurized by pressing and heating 169 940 137 873 3 32
Other processed shellfish product 736 4,324 181 2,298 0 0
Processed aquatic animal product (other than fish and shellfish) 74,797 391,238 19,150 107,859 139 625
Sliced/shucked fresh aquatic animals (including frozen food) 29,722 154,835 7,411 45,325 42 211
Dried aquatic animal product 2,877 15,152 800 4,776 4 22
Processed and cooked aquatic animals 7,188 52,770 943 6,587 8 13
Frozen food 33,880 159,394 9,858 50,750 84 377
Tightly-packaged food pasteurized by pressing and heating 64 60 10 17 0 0
Fish meat kneaded products 244 564 71 153 1 1
Other processed aquatic animal product 822 8,464 57 250 0 0
Processed seaweed product 10,546 44,736 574 2,100 1 0
Dried seaweed 7,483 24,311 232 729 1 0
Salted seaweed 1,141 11,287 25 244 0 0
Seaweed boiled down in soy sauce 877 3,528 126 424 0 0
Agar-agar 294 1,631 64 218 0 0
Other processed seaweed product 751 3,978 127 485 0 0
Processed aquatic animal egg product 3,898 16,697 607 2,603 1 0
Processed fish egg product 3,892 16,694 606 2,603 1 0
Processed shellfish egg product 0 0 0 0 0 0
Processed other aquatic animal egg product 6 3 1 0 0 0
Agricultural food 194,841 18,407,431 36,427 4,744,323 347 91,486
Cereals 8,747 10,025,320 3,809 4,102,195 161 87,479
Non-glutinous rice 1,031 636,058 374 168,967 27 700
Glutinous rice 63 11,176 26 3,892 1 2
Other rice 1 0 1 0 0 0
Barley 118 236,689 16 11,077 4 44
Wheat 495 5,165,215 115 319,529 20 277
Rye 48 4,765 5 197 0 0
Oat 57 790 2 3 0 0
Other oats 5 5 2 2 0 0
Maize 5,532 3,872,611 2,831 3,585,369 102 85,971
Buckwheat 892 89,746 84 7,082 2 399
Indian millet 32 279 6 113 0 0
Job’s tears 317 5,622 317 5,622 5 86
Other miscellaneous cereals 156 2,364 30 340 0 0
Pulses 9,876 2,703,611 2,587 84,149 39 827
Peanuts 1,326 26,672 1,326 26,672 24 478
Soybean 4,794 2,518,107 396 25,176 8 233
Adzuki beans 2,655 128,954 703 29,114 5 92
Broad bean 204 5,337 16 377 0 0
Pea 478 13,115 28 727 0 0
Other pulses 419 11,426 118 2,083 2 24
Vegetables 91,477 874,841 15,642 167,190 50 152
Cruciferous vegetables 9,641 79,503 716 4,848 4 1
Potato, yam, taro 900 26,449 68 1,283 0 0
Cucurbitaceous vegetables 3,021 117,446 71 1,805 0 0
Vegetables of the asteraceae 6,903 62,089 398 2,527 1 0
Mushroom 8,348 8,442 2,351 1,723 1 0
Umbelliferous vegetables 5,553 89,427 2,709 73,022 7 34
Solanaceous vegetables 16,729 43,277 1,754 5,499 7 14
Liliaceae vegetables 27,176 412,454 5,819 72,226 2 19
Other vegetables 13,206 35,753 1,756 4,256 28 84
Fruits 65,144 1,832,286 6,747 115,486 23 165
Stone fruits 5,955 13,645 252 358 0 0
Citrus fruits 16,535 331,443 942 17,147 4 88
Pomaceous fruits 243 2,132 7 85 0 0
Tropical fruits 25,153 1,385,390 4,321 93,325 9 62
Berry fruits 9,836 36,967 805 1,930 5 2
Other fruits 7,422 62,709 420 2,640 5 13
Nuts and seeds 19,207 2,971,337 7,641 275,304 74 2,864
Nuts 4,389 64,942 3,247 47,121 20 279
Oil seeds (for extraction of cooking oil) 1,103 2,412,079 508 74,986 11 578
Coffee bean 11,747 395,276 2,655 84,856 2 40
Cacao bean 985 54,580 888 51,809 32 1,629
Other nuts and seeds 983 44,459 343 16,530 9 337
Other agricultural food 390 36 1 0 0 0
Processed agricultural food 347,768 3,486,974 47,443 466,598 176 898
Preparations of cereals 55,570 501,948 4,178 45,851 13 30
Rice flour 1,724 89,212 229 31,007 0 0
Oat flour 2,228 45,407 97 1,195 0 0
Flour of miscellaneous cereals 482 5,973 56 376 0 0
Boiled cereals in water 1,907 46,127 74 1,358 0 0
Noodles (other than frozen food) 25,073 185,300 1,319 3,704 3 5
Bread (other than frozen food) 765 601 119 43 1 0
Frozen food 16,497 89,452 1,772 5,844 7 7
Tightly-packaged food pasteurized by pressing and heating 637 8,507 69 665 1 17
Other preparations of cereals 6,257 31,368 443 1,658 1 1
Preparations of pulses 16,774 295,069 4,834 64,748 18 138
Pulses flour 469 26,429 27 285 0 0
Peanuts preparations 3,468 56,943 3,465 56,943 17 114
Roasted/fried pulses (other than peanuts) 359 2,183 62 388 0 0
Bean jam 5,686 75,339 527 3,910 0 0
Boiled beans (including boiled aduzki) 2,858 13,705 312 1,173 1 25
Processed soybean (other than listed above) 241 247 26 50 0 0
Frozen food 1,060 5,734 215 1,269 0 0
Tightly-packaged food pasteurized by pressing and 467 2,057 30 77 0 0

11
Table 4. Number of Declaration, Inspection and Violation by Item
Certification of Items Number and Weight of Import
Declaration Number of Inspection Number of Violation
Number Weight Number Weight Number Weight heating
Other preparations of pulses 2,166 112,431 170 653 0 0
Preparations of vegetables (other than processed mushroom, spices, processed herb and tea) 163,324 1,708,917 22,405 191,801 63 380
Dried vegetables 6,560 43,944 1,745 7,990 6 18
Flour 1,124 27,779 107 1,196 0 0
Salted vegetables (including in brine) 8,127 131,370 597 7,747 1 5
Preserved vegetables 41,483 144,338 2,396 6,209 6 9
Boiled vegetables in water 24,307 235,331 1,818 9,521 1 7
Puree and paste 3,684 161,961 172 2,223 1 21
Frozen food 60,833 822,741 13,908 149,939 42 316
Tightly-packaged food pasteurized by pressing and heating 1,297 5,932 227 758 3 4
Other preparations of vegetables 15,909 135,520 1,435 6,218 3 0
Processed mushroom product 9,816 41,749 2,602 7,300 3 4
Dried mushroom (including flour) 4,107 8,571 1,802 3,430 2 4
Salted mushroom (including in brine) 571 4,668 20 180 0 0
Boiled mushroom in water 3,006 19,332 387 2,138 1 0
Frozen food 637 4,616 161 1,002 0 0
Tightly-packaged food pasteurized by pressing and heating 692 2,230 90 251 0 0
Other processed mushroom product 803 2,331 142 299 0 0
Processed wild grass product and spices 12,727 41,481 2,735 15,108 18 28
Allspice 24 164 4 26 0 0
Cinnamon 339 406 24 23 0 0
Laurel 112 218 4 10 0 0
Saffron 77 1 4 0 0 0
Clove 87 299 11 50 0 0
Chili pepper 1,271 10,397 1,270 10,388 6 2
Nutmeg 86 490 86 490 3 19
Paprika 187 900 35 82 0 0
Peppers 1,513 8,284 116 513 0 0
Mustards 250 4,648 21 227 0 0
Curry powder 90 45 27 21 1 1
Other processed wild grass product and spices 8,691 15,629 1,133 3,278 8 6
Tea 17,924 37,208 1,715 9,392 10 44
Non-fermented tea 2,223 5,435 199 878 0 0
Semi-fermented tea 2,591 15,418 722 7,491 8 44
Fermented tea 13,110 16,356 794 1,022 2 0
Preparations of fruits 36,401 378,987 5,719 44,756 43 120
Dried fruits (including powdered fruits) 5,968 56,737 1,293 7,949 18 105
Temporarily stored fruits 1,493 29,450 201 3,618 0 0
Preserved fruits 4,930 14,755 484 1,400 3 2
Syruped fruits 10,727 213,668 1,206 21,600 5 6
Jam and marmalade 5,349 10,435 1,139 2,084 7 0
Frozen food 3,355 14,106 823 4,143 5 6
Tightly-packaged food pasteurized by pressing and heating 128 1,466 9 41 0 0
Other preparations of fruits 4,451 38,370 564 3,921 5 1
Preparations of nuts and seeds 19,787 198,985 1,871 8,339 3 14
Roasted/fried nuts and seeds (other than coffee bean and cacao bean) 1,575 4,920 332 779 2 14
Paste 1,019 2,231 314 403 0 0
Syruped nuts and seeds 931 8,131 135 881 0 0
Coffee product 8,645 15,628 371 288 0 0
Cocoa product 4,042 144,807 171 3,395 0 0
Frozen food 229 2,980 62 711 0 0
Tightly-packaged food pasteurized by pressing and heating 1,523 10,074 181 528 0 0
Other preparations of nuts and seeds 1,823 10,214 305 1,353 1 0
Starch 1,182 163,766 256 73,211 1 136
Tapioca starch 493 117,312 178 68,757 1 136
Sago starch 131 17,207 11 1,584 0 0
Cornstarch 59 468 10 133 0 0
Potato starch 105 14,970 13 1,337 0 0
Sweet potato starch 26 9 1 1 0 0
Wheat starch 46 873 4 77 0 0
Chemically modified starch 214 11,299 18 935 0 0
Other starch 108 1,629 21 386 0 0
Other processed agricultural food 14,263 118,863 1,128 6,094 4 3
Substitute for tea 4,848 6,752 301 633 0 0
Vegetable protein 1,890 38,037 91 894 0 0
Prepared flour 3,939 34,308 246 862 0 0
Frozen food 852 6,109 184 2,476 1 0
Tightly-packaged food pasteurized by pressing and heating 50 354 10 15 0 0
Other processed agricultural food, not elsewhere classified 2,684 33,303 296 1,214 3 3
Other foods 207,327 1,558,735 25,537 118,756 112 171
Soup, stew and seasonings (other than frozen food) 49,190 1,073,768 3,967 63,446 23 7
Soup 4,632 18,265 342 714 1 0
Stew 211 1,442 16 48 0 0
Sauce 6,635 26,788 628 1,196 2 0
Fermented soybean paste 995 7,567 27 107 0 0
Gochujang 1,085 2,708 94 221 0 0
Soy sauce 476 2,378 43 205 1 2
Fish sauce 988 3,578 76 309 1 0
Ketchup 648 6,510 29 199 1 0
Mustard preparations 866 2,958 121 131 0 0
Chili pepper preparations 1,544 3,188 216 376 2 0
Vinegar 2,448 3,418 376 423 1 1
Sugar 487 10,206 66 794 0 0
Saccharides 15,543 403,010 824 6,962 7 1
Salts 2,342 546,991 86 49,977 0 0
Other seasonings 10,290 34,763 1,023 1,784 7 2

12
Table 4. Number of Declaration, Inspection and Violation by Item
Certification of Items Number and Weight of Import
Declaration Number of Inspection Number of Violation
Number Weight Number Weight Number Weight
Oils and fats (other than dairy products) 12,849 116,727 709 2,807 6 3
Oils and fats from land animals 274 1,879 3 7 0 0
Oils and fats from aquatic animals 92 622 10 1 1 1
Oils and fats from vegetables 10,643 87,627 585 1,989 4 1
Modified oils and fats 1,840 26,600 111 809 1 1
Cakes (other than frozen food) 95,034 125,712 12,145 15,448 36 38
Western-style cake 87,139 105,113 11,056 13,373 34 27
Japanese-style cake 4,255 13,850 355 815 1 11
Other cake 3,640 6,749 734 1,261 1 0
Frozen food 27,691 151,350 6,490 32,604 29 114
Tightly-packaged food pasteurized by pressing and heating 3,246 11,693 498 1,383 4 1
Health food 11,741 14,088 1,276 786 6 1
Health food derived from vegetables 6,144 8,344 777 436 3 1
Health food derived from animals 1,072 1,969 103 91 0 0
Health food derived from microorganisms 835 267 28 5 0 0
Other health foods 3,690 3,509 368 254 3 0
Other foods, not elsewhere classified 7,576 65,396 452 2,283 8 7
Beverages 232,885 1,802,963 7,861 62,319 31 90
Soft drinks 33,980 1,042,398 3,763 52,519 17 88
Mineral waters 9,783 502,297 394 10,419 0 0
Frozen fruits drinks 211 2,330 54 369 0 0
Fruits juice for raw material 6,001 298,359 812 25,370 3 37
Other soft drinks 17,985 239,412 2,503 16,360 14 51
Powdered soft drinks 5,508 15,950 816 1,933 13 2
Alcoholic beverages 193,397 744,614 3,282 7,867 1 0
Grape must and malt 1,212 47,389 13 576 0 0
Spirits 16,972 87,112 780 654 0 0
Fruits wine 151,995 260,136 1,286 1,947 0 0
Beer 7,402 41,292 130 896 0 0
Other alcoholic beverages 15,816 308,685 1,073 3,794 1 0
Food additives 48,126 664,329 1,892 23,081 17 86
Sweetener 1,435 51,859 99 555 1 0
Color additive 1,101 797 150 122 0 0
Preservative 226 1,557 18 126 0 0
Thickening agent for stabilization 8,674 268,307 425 8,491 4 1
Antioxidant 998 11,168 103 1,046 0 0
Coloring agent 10 2 0 0 0 0
Bleaching agent 5 200 0 0 0 0
Fungicide/insecticide 0 0 0 0 0 0
Gum base 312 4,669 14 154 0 0
Sour agent 2,069 42,707 104 2,037 0 0
Seasoning 3,792 115,337 265 4,431 4 19
Emulsifying agent 1,083 7,940 60 236 0 0
Reinforcement 659 2,899 62 172 1 1
Flavoring agent 20,010 7,606 201 127 1 0
Agent for manufacturing process 5,103 139,298 341 5,259 6 66
Bitter agent 530 229 7 1 0 0
Enzyme 1,105 2,476 13 3 0 0
Brightener 52 204 5 28 0 0
Other additives 962 7,076 25 296 0 0
Tools and apparatus 399,251 724,433 17,260 2,579 54 2
Tableware 172,893 251,503 10,516 1,612 28 1
Tableware made of glass, ceramics or enamel 104,186 88,502 8,061 1,038 10 0
Tableware made of plastic 28,363 31,270 1,501 312 16 0
Tableware made of rubber 926 319 130 2 0 0
Tableware made of metal 8,781 3,646 32 1 2 0
Tableware made of wood, bamboo or rattan 11,773 100,464 25 141 0 0
Tableware made of paper, cloth or leather 1,126 3,541 4 1 0 0
Tableware made of stone 381 165 0 0 0 0
Others 17,357 23,595 763 117 0 0
Cookware 83,721 132,845 1,824 265 8 0
Cookware made of glass, ceramics or enamel 5,956 12,030 369 71 4 0
Cookware made of plastic 15,780 14,084 581 49 3 0
Cookware made of rubber 4,186 2,173 279 8 0 0
Cookware made of metal 23,118 30,624 9 4 0 0
Cookware made of wood, bamboo or rattan 2,833 2,974 1 0 0 0
Cookware made of paper, cloth or leather 829 1,474 1 5 0 0
Cookware made of stone 345 333 0 0 0 0
Others 30,674 69,151 584 129 1 0
Machines and apparatus for food manufacture 14,306 33,198 375 42 1 0
Machines and apparatus for food manufacture made of glass, ceramics or enamel 104 3,659 4 0 0 0
Machines and apparatus for food manufacture made of plastic 1,858 4,874 179 7 1 0
Machines and apparatus for food manufacture made of rubber 1,088 4,211 118 1 0 0
Machines and apparatus for food manufacture made of metal 6,737 7,006 3 1 0 0
Machines and apparatus for food manufacture made of wood, bamboo or rattan 175 3,770 0 0 0 0
Machines and apparatus for food manufacture made of paper, cloth or leather 92 19 0 0 0 0
Machines and apparatus for food manufacture made of stone 71 183 0 0 0 0
Others 4,181 9,475 71 34 0 0
Other tools and apparatus 128,331 306,888 4,545 659 17 1
Other tools and apparatus made of glass, ceramics or enamel 4,686 16,064 424 156 1 0
Other tools and apparatus made of plastic 44,140 86,145 2,296 352 13 0
Other tools and apparatus made of rubber 13,435 20,742 896 31 1 0
Other tools and apparatus made of metal 9,796 17,688 20 0 0 0
Other tools and apparatus made of wood, bamboo or rattan 1,679 3,891 1 0 0 0
Other tools and apparatus made of paper, cloth or leather 2,089 5,264 2 5 0 0

13
Table 4. Number of Declaration, Inspection and Violation by Item
Certification of Items Number and Weight of Import
Declaration Number of Inspection Number of Violation
Number Weight Number Weight Number Weight
Other tools and apparatus made of stone 221 148 0 0 0 0
Others 52,285 156,945 906 114 2 0
Container and package 18,631 91,959 664 987 0 0
Container and package made of glass, ceramics or enamel 463 2,274 90 156 0 0
Container and package made of plastic 11,249 47,899 473 763 0 0
Container and package made of rubber 50 41 7 4 0 0
Container and package made of metal 1,725 15,214 7 18 0 0
Container and package made of wood, bamboo or rattan 629 5,232 1 14 0 0
Container and package made of paper, cloth or leather 1,254 9,495 0 0 0 0
Container and package made of stone 0 0 0 0 0 0
Others 3,261 11,804 86 33 0 0
Toys 87,017 65,934 4,776 515 5 1
Toys touched with mouth of infants 1,808 343 108 5 0 0
Accessory toys, transfer pictures and tumble dolls 79,967 60,914 4,562 491 5 1
Toys in combination 5,242 4,677 106 19 0 0 Total 2,181,495 32,155,854 223,380 6,005,747 1,053 94,477

14
Weight of
imports (tons) Percentage (%) Livestock food, processed
livestock food 3,080,556 9.6% Aquatic food,
processed aquatic food 2,272,541 7.1% Agricultural food, processed
agricultural food 21,894,404 68.1% Other foods 1,558,735 4.8% Beverages 1,802,963 5.6% Food additives 664,329 2.1% Tools and apparatus 724,433 2.3% Container and package 91,959 0.3% Toys 65,934 0.2% Total 32,155,854 100.0%
Figure 3. Composition of Weight of Imports by Classification of Items
Food additives 664,329
Beverages 1,802,963
Other foods 1,558,735
Tools and apparatus 724,433
Container and package 91,959 Toys
65,934
Livestock food, processed livestock food
Aquatic food, processed aquatic food
3,080,556
2,272,541
Weight of imports (tons)
32,155,854
21,894,404
Agricultural food, processed agricultural food
15
State of Declaration, Inspection and Violation of Top 5 Countries by Item (on a weight basis)
Certification of Items Top 5 Countries
Number and Weight of Import Declaration Number of Inspection Number of Violation
Number Weight Number Weight Number Weight Livestock food
001Fresh meat (including internal organs) 001Beef
Australia 34,582 337,630 351 3,752 0 0 U.S.A. 24,149 151,725 5,313 13,526 7 1 New Zealand 4,024 36,126 89 890 0 0 Mexico 3,505 29,284 22 326 0 0 Canada 1,510 12,749 243 982 0 0
003 Pork U.S.A. 25,097 417,634 197 2,761 0 0 Canada 10,675 204,787 108 1,876 0 0 Denmark 7,524 115,390 136 1,998 0 0 Mexico 5,490 60,087 43 492 0 0 Chile 2,840 35,531 44 457 0 0
005 Horsemeat Canada 1,269 2,945 585 1,224 0 0 Mexico 274 995 47 28 0 0 Argentina 268 899 44 187 0 0 Brazil 19 231 0 0 0 0 Italy 92 207 44 72 0 0
007 Mutton and lamb Australia 1,138 10,719 76 868 0 0 New Zealand 530 5,946 42 505 0 0 Iceland 9 77 0 0 0 0 Hungary 74 8 3 0 0 0
008 Goat meat Australia 24 250 1 19 0 0
009 Rabbit meat Spain 15 17 2 1 0 0 Italy 97 12 3 2 0 0 Hungary 57 8 6 2 0 0 France 1 0 0 0 0 0
010 Other flesh Canada 14 31 2 15 0 0 New Zealand 27 31 1 3 0 0 People’s Republic of China 2 25 0 0 0 0 Australia 12 13 4 3 0 0 U.S.A. 3 3 1 1 0 0
011 Chicken Brazil 18,599 385,581 485 9,114 0 0 U.S.A. 1,167 26,620 52 1,091 0 0 Philippines 1,732 6,790 21 192 0 0 Thailand 127 1,655 2 23 0 0 Chile 94 1,633 1 24 0 0
012 Domestic duck France 3,869 1,477 78 17 0 0 Hungary 644 1,390 10 6 0 0 Brazil 43 776 0 0 0 0 Canada 25 230 0 0 0 0 U.S.A. 8 121 0 0 0 0
013 Turkey U.S.A. 33 437 0 0 0 0 France 74 72 1 0 0 0 Chile 7 58 0 0 0 0 Hungary 5 33 1 5 0 0 Brazil 2 32 0 0 0 0
014 Other fowl Hungary 841 220 17 1 0 0 France 2,343 207 56 9 0 0 United Kingdom 78 9 0 0 0 0 Australia 4 3 0 0 0 0 Chile 2 1 0 0 0 0
003 Bird eggs U.S.A. 29 829 3 89 0 0
004 Other fresh livestock food Canada 224 5,135 0 0 0 0 U.S.A. 219 4,362 0 0 0 0 Spain 156 3,468 0 0 0 0 Poland 148 3,050 0 0 0 0 United Kingdom 119 2,626 0 0 0 0
Processed livestock food 005 Meat product
015 Dried meat product People’s Republic of China 185 1,032 93 643 0 0 Thailand 116 344 11 20 0 0 Argentina 25 191 3 9 0 0 New Zealand 58 181 13 44 0 0 Australia 113 151 31 36 0 0
016 Unheated meat product Italy 4,083 1,888 1,380 601 13 20 Spain 1,211 695 459 203 10 3 New Zealand 68 377 9 46 0 0 Canada 42 91 35 70 0 0 U.S.A. 131 86 21 21 0 0
018 Heated meat product (heating after packaging) People’s Republic of China 1,693 17,534 1,153 12,544 0 0 U.S.A. 491 5,164 67 550 0 0 Denmark 219 3,380 43 505 0 0 Korea 238 1,787 47 252 0 0 Thailand 221 1,499 35 166 0 0
019 Heated meat product (packaging after heating) Thailand 17,796 223,645 1,350 11,834 0 0

16
Certification of Items Top 5 Countries Number and Weight of
Import Declaration Number of Inspection Number of Violation
Number Weight Number Weight Number Weight People’s Republic of China 15,053 180,124 11,519 145,666 4 17 U.S.A. 2,814 22,346 175 1,191 0 0 Brazil 235 2,889 41 400 0 0 Chile 80 1,826 6 135 0 0
006 Milk and dairy product 021 Milk and cream in liquid state
Australia 33 1,305 4 199 0 0 Netherlands 20 831 6 156 0 0 Belgium 7 224 3 97 0 0 Korea 12 14 6 0 0 0 United Kingdom 33 13 10 2 0 0
022 Condensed/concentrated milk Germany 10 182 1 7 0 0
023 Powdered milk
Australia 127 3,394 19 583 0 0 New Zealand 82 2,613 27 1,046 0 0 Germany 74 2,486 8 164 0 0 U.S.A. 117 2,462 13 251 0 0 France 58 1,622 10 227 0 0
024 Fermented milk and lactobacillus drink U.S.A. 57 146 16 42 0 0 Greece 56 11 17 3 0 0 United Kingdom 2 0 1 0 0 0
025 Butter New Zealand 87 4,857 18 2,197 0 0 Netherlands 37 2,289 9 632 0 0 Australia 26 1,777 8 444 0 0 U.S.A. 16 884 3 3 0 0 France 1,260 143 93 16 1 0
026 Cheese and cheese curd Australia 2,929 100,049 80 862 0 0 New Zealand 1,616 65,152 9 143 0 0 U.S.A. 2,252 27,210 83 382 0 0 Germany 1,031 9,367 42 82 0 0 France 48,108 8,550 997 390 0 0
027 Ice cream New Zealand 368 5,199 49 571 1 0 Belgium 429 1,124 43 84 0 0 Korea 195 840 43 184 0 0 Australia 65 704 20 142 0 0 France 132 381 24 49 0 0
028 Food made of milk as main material Singapore 1,008 40,171 9 295 0 0 Australia 564 20,171 13 397 0 0 New Zealand 670 13,583 14 152 0 0 Netherlands 252 4,058 14 58 0 0 Korea 89 3,632 0 0 0 0
029 Other dairy product Singapore 761 31,187 15 488 0 0 Korea 205 16,742 5 232 0 0 Australia 125 5,272 4 220 0 0 New Zealand 181 3,223 10 137 0 0 Netherlands 29 1,102 2 98 0 0
007 Processed egg product 030 Hen egg product
U.S.A. 495 10,046 33 670 0 0 Netherlands 162 3,257 1 18 0 0 Italy 132 2,837 2 44 0 0 Mexico 93 1,817 1 0 0 0 India 117 1,719 4 35 0 0
031 Other processed egg product People’s Republic of China 237 2,730 40 349 0 0 Thailand 198 1,790 4 52 0 0 Taiwan 111 153 14 21 0 0 Philippines 31 2 1 0 0 0 Socialist Republic of Viet Nam 2 2 1 1 0 0
008 Flesh and fowl preparations 032 Meat extract
U.S.A. 49 565 5 42 0 0 France 37 529 1 0 0 0 Australia 17 236 0 0 0 0 Brazil 7 77 0 0 0 0 Papua New Guinea 6 27 0 0 0 0
033 Blood preparations Netherlands 16 123 0 0 0 0 Germany 2 0 0 0 0 0
034 Other flesh and fowl preparations India 149 6,070 6 12 0 0 People’s Republic of China 488 3,852 5 53 0 0 France 229 2,928 3 60 0 0 Canada 86 2,535 0 0 0 0 U.S.A. 177 2,484 1 8 0 0
009 Other processed livestock product 035 Frozen food (other than meat product)
People’s Republic of China 11,566 65,522 7,235 44,657 0 0 Thailand 3,931 15,204 548 1,278 1 2 Philippines 20 28 5 7 0 0 France 22 14 7 4 0 0 Netherlands 2 8 2 8 0 0
036 Tightly-packaged food pasteurized by pressing and heating
People’s Republic of China 248 2,920 25 81 0 0 Thailand 228 2,337 12 2 0 0 Korea 44 27 5 6 0 0 Malaysia 12 2 6 1 0 0 Taiwan 3 0 3 0 1 0
037 Honey
17
Certification of Items Top 5 Countries Number and Weight of
Import Declaration Number of Inspection Number of Violation
Number Weight Number Weight Number Weight People’s Republic of China 685 29,165 119 5,878 0 0 Argentina 87 2,343 11 320 0 0 Canada 158 2,116 21 146 0 0 Myanmar 39 908 3 59 0 0 Hungary 63 870 14 221 0 0
038 Royal Jelly People’s Republic of China 148 410 36 116 0 0 Taiwan 33 12 10 2 0 0 Thailand 20 11 6 4 1 0 U.S.A. 6 3 1 0 0 0 Australia 6 2 1 0 0 0
039 Propolis U.S.A. 27 47 7 1 0 0 Brazil 247 45 37 8 0 0 Australia 26 4 3 0 0 0 United Kingdom 8 2 0 0 0 0 People’s Republic of China 9 1 3 0 0 0
040 Other processed livestock food Australia 182 332 6 5 1 0 People’s Republic of China 96 281 41 159 0 0 Indonesia 39 73 5 6 0 0 U.S.A. 43 65 6 4 0 0 United Kingdom 33 56 1 2 0 0
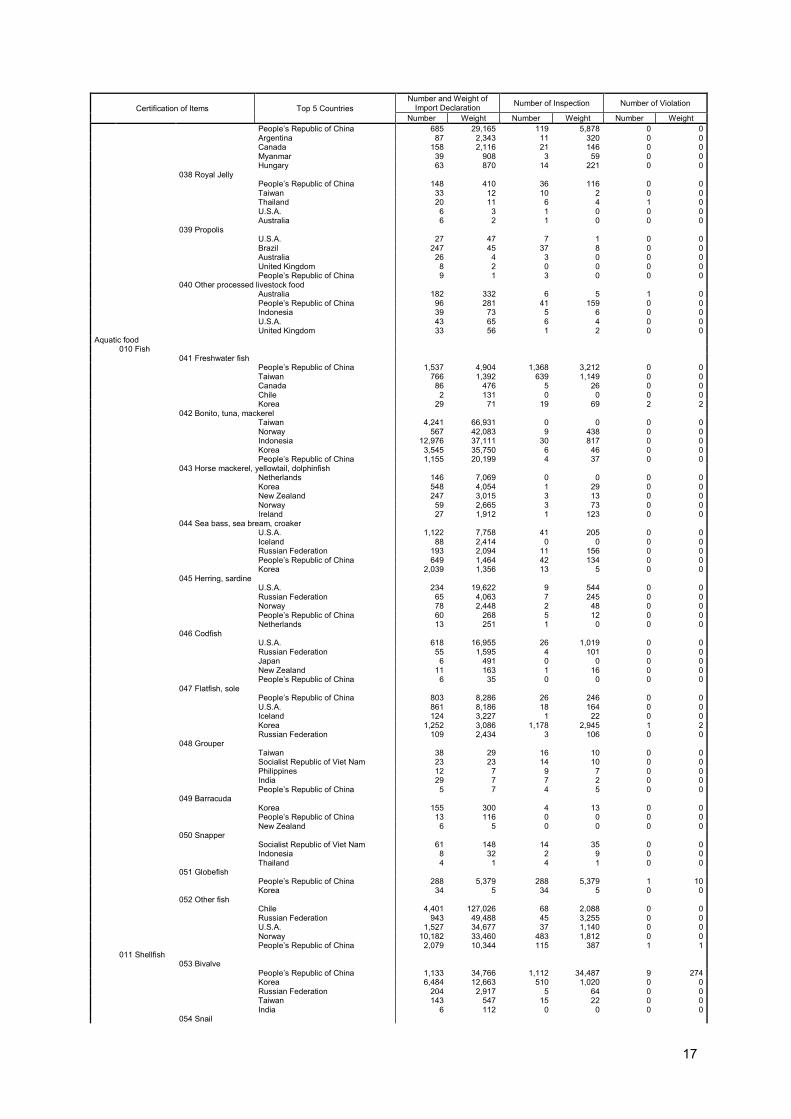
Aquatic food 010 Fish
041 Freshwater fish People’s Republic of China 1,537 4,904 1,368 3,212 0 0 Taiwan 766 1,392 639 1,149 0 0 Canada 86 476 5 26 0 0 Chile 2 131 0 0 0 0 Korea 29 71 19 69 2 2
042 Bonito, tuna, mackerel Taiwan 4,241 66,931 0 0 0 0 Norway 567 42,083 9 438 0 0 Indonesia 12,976 37,111 30 817 0 0 Korea 3,545 35,750 6 46 0 0 People’s Republic of China 1,155 20,199 4 37 0 0
043 Horse mackerel, yellowtail, dolphinfish Netherlands 146 7,069 0 0 0 0 Korea 548 4,054 1 29 0 0 New Zealand 247 3,015 3 13 0 0 Norway 59 2,665 3 73 0 0 Ireland 27 1,912 1 123 0 0
044 Sea bass, sea bream, croaker U.S.A. 1,122 7,758 41 205 0 0 Iceland 88 2,414 0 0 0 0 Russian Federation 193 2,094 11 156 0 0 People’s Republic of China 649 1,464 42 134 0 0 Korea 2,039 1,356 13 5 0 0
045 Herring, sardine U.S.A. 234 19,622 9 544 0 0 Russian Federation 65 4,063 7 245 0 0 Norway 78 2,448 2 48 0 0 People’s Republic of China 60 268 5 12 0 0 Netherlands 13 251 1 0 0 0
046 Codfish U.S.A. 618 16,955 26 1,019 0 0 Russian Federation 55 1,595 4 101 0 0 Japan 6 491 0 0 0 0 New Zealand 11 163 1 16 0 0 People’s Republic of China 6 35 0 0 0 0
047 Flatfish, sole People’s Republic of China 803 8,286 26 246 0 0 U.S.A. 861 8,186 18 164 0 0 Iceland 124 3,227 1 22 0 0 Korea 1,252 3,086 1,178 2,945 1 2 Russian Federation 109 2,434 3 106 0 0
048 Grouper Taiwan 38 29 16 10 0 0 Socialist Republic of Viet Nam 23 23 14 10 0 0 Philippines 12 7 9 7 0 0 India 29 7 7 2 0 0 People’s Republic of China 5 7 4 5 0 0
049 Barracuda Korea 155 300 4 13 0 0 People’s Republic of China 13 116 0 0 0 0 New Zealand 6 5 0 0 0 0
050 Snapper Socialist Republic of Viet Nam 61 148 14 35 0 0 Indonesia 8 32 2 9 0 0 Thailand 4 1 4 1 0 0
051 Globefish People’s Republic of China 288 5,379 288 5,379 1 10 Korea 34 5 34 5 0 0
052 Other fish Chile 4,401 127,026 68 2,088 0 0 Russian Federation 943 49,488 45 3,255 0 0 U.S.A. 1,527 34,677 37 1,140 0 0 Norway 10,182 33,460 483 1,812 0 0 People’s Republic of China 2,079 10,344 115 387 1 1
011 Shellfish 053 Bivalve
People’s Republic of China 1,133 34,766 1,112 34,487 9 274 Korea 6,484 12,663 510 1,020 0 0 Russian Federation 204 2,917 5 64 0 0 Taiwan 143 547 15 22 0 0 India 6 112 0 0 0 0
054 Snail

18
Certification of Items Top 5 Countries Number and Weight of
Import Declaration Number of Inspection Number of Violation
Number Weight Number Weight Number Weight Korea 1,528 3,351 10 11 0 0 India 22 445 3 72 0 0 Australia 360 280 6 10 0 0 People’s Republic of China 181 196 8 1 0 0 Chile 23 175 0 0 0 0
012 Aquatic animals 055 Lobster, prawn, shrimp
Indonesia 2,012 18,427 66 625 1 0 India 1,407 17,696 958 13,012 32 426 Argentina 650 13,587 134 2,336 0 0 Socialist Republic of Viet Nam 691 6,398 691 6,398 4 50 Russian Federation 252 5,845 24 609 0 0
056 Crab Russian Federation 2,138 26,621 81 1,422 0 0 Bahrain 78 1,227 3 35 0 0 People’s Republic of China 520 1,182 33 58 0 0 Canada 70 375 10 103 0 0 U.S.A. 25 363 2 36 0 0
057 Other crustacean Japan 2 5 0 0 0 0 Korea 10 0 0 0 0 0 Philippines 2 0 1 0 0 0 Myanmar 1 0 1 0 0 0
058 Other aquatic animals Mauritania 514 22,843 4 103 0 0 Morocco 702 15,777 8 106 0 0 Russian Federation 712 9,067 0 0 0 0 U.S.A. 193 5,382 3 117 0 0 People’s Republic of China 157 2,533 21 221 1 1
013 Seaweed 060 Laver
Korea 2 0 0 0 0 0 061 Wakame
People’s Republic of China 108 3,244 6 106 0 0 Korea 86 2,138 1 19 0 0 Japan 1 10 0 0 0 0
062 Agar-agar Philippines 6 1 1 0 0 0
063 Other seaweed Socialist Republic of Viet Nam 201 55 14 4 0 0 Korea 75 11 0 0 0 0 Philippines 7 1 1 0 0 0
014 Other aquatic food Russian Federation 838 27,805 11 134 0 0 U.S.A. 2,718 19,989 35 140 0 0 Canada 183 2,293 6 61 0 0 Iceland 103 2,273 3 107 0 0 People’s Republic of China 1,333 917 54 118 0 0
Processed aquatic food 015 Processed fish product
064 Sliced/shucked fresh fish (including frozen food) People’s Republic of China 16,395 117,416 814 5,081 0 0 Chile 2,903 54,048 233 3,992 4 62 Socialist Republic of Viet Nam 3,888 16,446 363 1,161 1 3 Thailand 3,151 11,044 114 406 0 0 Norway 3,916 9,559 190 597 0 0
065 Dried fish product People’s Republic of China 1,090 7,495 153 806 0 0 Indonesia 732 5,937 50 362 0 0 Socialist Republic of Viet Nam 877 3,032 189 443 0 0 Philippines 343 2,678 15 4 0 0 Thailand 685 2,290 74 217 0 0
066 Processed and cooked fish Thailand 2,368 25,081 141 838 0 0 Indonesia 687 6,046 14 148 0 0 Philippines 892 4,492 51 77 0 0 People’s Republic of China 606 3,636 84 514 0 0 Socialist Republic of Viet Nam 81 1,125 15 118 0 0
067Fish: Frozen food People’s Republic of China 30,697 144,354 4,361 21,297 15 65 Thailand 5,511 18,211 422 1,106 0 0 Socialist Republic of Viet Nam 2,062 6,216 342 1,004 1 3 Chile 424 3,087 57 304 0 0 Philippines 551 1,437 56 82 0 0
068 Fish: Tightly-packaged food pasteurized by pressing and heating
Thailand 909 10,832 97 567 0 0 Philippines 288 2,508 18 86 0 0 Indonesia 99 1,443 6 44 0 0 People’s Republic of China 17 105 9 70 0 0 India 9 50 1 1 0 0
069 Fish meat kneaded products U.S.A. 2,181 94,067 81 2,379 0 0 Thailand 3,503 46,380 272 1,650 1 1 India 1,147 28,385 34 708 0 0 Socialist Republic of Viet Nam 900 15,976 135 1,642 1 1 People’s Republic of China 581 13,423 150 2,078 5 40
070 Other processed fish product Thailand 259 3,582 18 213 0 0 People’s Republic of China 581 3,002 58 309 0 0 Socialist Republic of Viet Nam 275 1,126 24 74 0 0 Indonesia 67 786 5 64 0 0 U.S.A. 17 367 1 0 0 0
016 Processed shellfish product 071 Sliced/shucked fresh shellfish (including frozen food)
People’s Republic of China 863 5,358 524 3,300 1 3 Korea 3,876 4,866 1,286 3,321 1 1 Canada 51 794 2 26 0 0

19
Certification of Items Top 5 Countries Number and Weight of
Import Declaration Number of Inspection Number of Violation
Number Weight Number Weight Number Weight Russian Federation 48 497 2 3 0 0 Socialist Republic of Viet Nam 98 242 6 15 0 0
072 Dried shellfish People’s Republic of China 58 223 45 152 0 0 Thailand 54 41 2 1 0 0 U.S.A. 7 21 1 4 0 0 Socialist Republic of Viet Nam 1 2 1 2 0 0 New Zealand 1 0 0 0 0 0
073 Processed and cooked shellfish People’s Republic of China 558 7,916 470 6,850 0 0 Turkey 10 193 0 0 0 0 Senegal 15 152 0 0 0 0 Korea 117 132 30 114 0 0 Australia 83 124 3 3 0 0
074 Shellfish: Frozen food People’s Republic of China 1,531 19,810 1,458 19,320 4 32 Chile 102 1,133 36 381 0 0 New Zealand 76 942 17 164 0 0 Canada 50 834 12 196 0 0 Socialist Republic of Viet Nam 114 774 17 52 0 0
075 Shellfish: Tightly-packaged food pasteurized by pressing and heating
People’s Republic of China 138 920 135 873 3 32 Thailand 23 19 1 0 0 0 Australia 8 1 1 0 0 0
076 Other processed shellfish product People’s Republic of China 190 3,024 137 2,143 0 0 U.S.A. 54 459 5 24 0 0 Korea 412 296 23 64 0 0 Australia 12 276 2 0 0 0 Indonesia 27 85 3 1 0 0
017 Processed aquatic animal product (other than fish and shellfish) 077 Sliced/shucked fresh aquatic animals (including frozen food)
People’s Republic of China 8,434 47,776 2,544 14,513 8 37 Thailand 6,030 29,232 437 1,467 0 0 Socialist Republic of Viet Nam 3,881 27,487 3,538 25,217 22 135 India 842 10,618 167 1,937 3 29 Indonesia 1,643 10,143 78 293 6 8
078 Dried aquatic animal product People’s Republic of China 1,972 13,092 636 3,990 0 0 Thailand 308 765 39 84 0 0 Socialist Republic of Viet Nam 106 563 79 523 4 22 Taiwan 81 267 17 58 0 0 India 27 159 3 17 0 0
079 Processed and cooked aquatic animals Russian Federation 743 18,209 100 2,486 0 0 People’s Republic of China 3,022 13,760 424 1,842 3 4 Canada 593 4,925 59 559 0 0 Korea 982 3,523 66 217 1 0 U.S.A. 158 2,618 47 655 0 0
080 Aquatic animals: Frozen food Thailand 14,633 61,447 1,406 5,472 19 71 People’s Republic of China 9,380 50,966 2,588 13,847 13 44 Socialist Republic of Viet Nam 5,710 30,922 5,366 29,369 39 213 Indonesia 2,650 10,235 244 840 5 16 Korea 782 1,777 106 232 4 0
081 Aquatic animals: Tightly-packaged food pasteurized by pressing and heating
People’s Republic of China 21 52 8 17 0 0 Korea 37 6 0 0 0 0 Malaysia 1 1 0 0 0 0 Spain 4 0 1 0 0 0 Thailand 1 0 1 0 0 0
082 Aquatic animals: Fish meat kneaded products People’s Republic of China 144 400 37 97 0 0 Socialist Republic of Viet Nam 50 86 19 42 0 0 Thailand 31 53 9 13 1 1 Korea 12 23 6 1 0 0 Peru 2 2 0 0 0 0
083 Other processed aquatic animal product Thailand 188 3,579 1 23 0 0 People’s Republic of China 202 1,843 22 165 0 0 Malaysia 58 970 0 0 0 0 Socialist Republic of Viet Nam 101 736 11 33 0 0 Indonesia 49 540 1 15 0 0
018 Processed seaweed product 084 Dried seaweed
People’s Republic of China 2,529 14,663 121 524 1 0 Korea 4,660 7,252 101 182 0 0 Chile 107 799 7 3 0 0 Morocco 39 777 1 14 0 0 Indonesia 32 304 0 0 0 0
085 Salted seaweed People’s Republic of China 426 7,612 10 143 0 0 Korea 591 3,315 5 94 0 0 Tonga 7 160 0 0 0 0 Brazil 7 89 0 0 0 0 Japan 3 43 0 0 0 0
086 Seaweed: Seaweed boiled down in soy sauce People’s Republic of China 877 3,528 126 424 0 0
087 Agar-agar Chile 73 813 8 52 0 0 Korea 125 317 27 46 0 0 Morocco 8 192 1 24 0 0 Indonesia 23 120 3 28 0 0 People’s Republic of China 48 101 19 33 0 0
088 Other processed seaweed product

20
Certification of Items Top 5 Countries Number and Weight of
Import Declaration Number of Inspection Number of Violation
Number Weight Number Weight Number Weight People’s Republic of China 532 3,458 105 438 0 0 Korea 148 326 16 46 0 0 Chile 4 72 0 0 0 0 United Kingdom 6 60 0 0 0 0 U.S.A. 4 47 0 0 0 0
019 Processed aquatic animal egg product 089 Processed fish egg product
People’s Republic of China 1,688 7,914 111 367 0 0 U.S.A. 442 2,768 325 1,546 0 0 Korea 760 2,050 82 170 0 0 Canada 111 1,009 3 14 0 0 Peru 51 998 0 0 0 0
091 Processed other aquatic animal egg product People’s Republic of China 1 2 0 0 0 0 Taiwan 1 1 0 0 0 0 Hong Kong 4 0 1 0 0 0
Agricultural food 020 Cereals
092 Non-glutinous rice U.S.A. 385 310,392 100 36,954 3 23 Thailand 207 172,811 76 68,354 18 471 Australia 125 76,856 33 16,880 1 3 People’s Republic of China 213 46,816 99 17,921 1 1 Socialist Republic of Viet Nam 31 28,278 31 28,278 4 203
093 Glutinous rice Thailand 32 7,727 13 2,179 1 2 U.S.A. 31 3,448 13 1,713 0 0
094 Other rice India 1 0 1 0 0 0
095 Barley Australia 71 192,096 6 8,981 1 0 Canada 16 42,955 5 2,079 2 43 U.S.A. 12 1,630 3 17 1 0 United Kingdom 2 4 0 0 0 0 Italy 10 3 2 0 0 0
096 Wheat U.S.A. 148 2,927,176 59 187,648 13 97 Canada 156 1,241,061 27 77,017 6 179 Australia 142 992,886 18 54,218 1 1 France 25 4,026 6 644 0 0 Turkey 1 40 0 0 0 0
097 Rye Germany 19 2,861 1 168 0 0 Canada 23 1,055 2 22 0 0 U.S.A. 4 739 2 7 0 0 Finland 1 89 0 0 0 0 Denmark 1 21 0 0 0 0
098 Oat U.S.A. 38 506 1 3 0 0 Finland 9 178 0 0 0 0 Australia 8 104 1 1 0 0 People’s Republic of China 2 2 0 0 0 0
099 Other oats U.S.A. 3 3 2 2 0 0 Peru 1 1 0 0 0 0 Canada 1 1 0 0 0 0
100 Maize U.S.A. 2,587 3,531,214 2,574 3,526,704 102 85,971 Brazil 88 275,296 25 55,563 0 0 France 9 47,847 2 2,040 0 0 Australia 14 16,495 2 47 0 0 Peru 33 980 26 962 0 0
101 Buckwheat People’s Republic of China 623 72,327 69 6,086 0 0 U.S.A. 237 15,356 7 286 0 0 Brazil 5 976 2 414 1 207 Canada 4 367 0 0 0 0 Australia 9 323 3 242 1 192
102 Indian millet U.S.A. 8 160 3 60 0 0 People’s Republic of China 11 119 3 53 0 0 Korea 13 0 0 0 0 0
103 Job’s tears Thailand 182 4,102 182 4,102 0 0 People’s Republic of China 69 789 69 789 5 86 Socialist Republic of Viet Nam 61 645 61 645 0 0 Laos 5 86 5 86 0 0
104 Other miscellaneous cereals People’s Republic of China 73 1,661 8 149 0 0 Peru 25 392 14 132 0 0 India 6 103 1 18 0 0 Bolivia 8 101 3 21 0 0 Socialist Republic of Viet Nam 2 63 0 0 0 0
021Pulses 105 Peanuts
People’s Republic of China 633 12,742 633 12,742 8 167 U.S.A. 313 6,226 313 6,226 8 159 South Africa 214 3,874 214 3,874 6 108 Argentina 123 3,001 123 3,001 1 25 India 21 396 21 396 1 19
106 Soybean U.S.A. 1,558 1,548,818 165 11,467 5 211 Brazil 17 579,200 8 146 2 20 Canada 2,600 346,654 160 10,514 1 3 People’s Republic of China 569 42,978 63 3,049 0 0 Argentina 4 343 0 0 0 0
107 Adzuki beans People’s Republic of China 1,247 79,153 144 7,277 1 2

21
Certification of Items Top 5 Countries Number and Weight of
Import Declaration Number of Inspection Number of Violation
Number Weight Number Weight Number Weight Myanmar 255 19,322 153 7,864 2 42
Canada 337 15,391 137 6,253 0 0 U.S.A. 372 10,064 211 7,054 0 0 Thailand 103 2,357 2 62 0 0
108 Broad beans People’s Republic of China 149 4,153 12 252 0 0 Australia 42 1,090 3 107 0 0 Portugal 2 38 1 19 0 0 Bolivia 3 34 0 0 0 0 United Kingdom 2 20 0 0 0 0
109 Pea Canada 240 6,931 15 417 0 0 United Kingdom 88 2,343 9 212 0 0 U.S.A. 85 1,917 1 50 0 0 Australia 30 1,150 1 21 0 0 New Zealand 20 594 0 0 0 0
110 Other pulses Myanmar 104 4,604 4 126 0 0 People’s Republic of China 71 3,850 7 155 0 0 India 97 1,631 88 1,614 2 24 U.S.A. 42 759 7 144 0 0 Thailand 13 249 0 0 0 0
022 Vegetables 111 Cruciferous vegetables
U.S.A. 5,167 39,320 403 2,731 0 0 People’s Republic of China 2,003 37,175 196 1,990 1 0 Korea 960 1,444 8 58 0 0 Taiwan 212 762 8 2 0 0 Mexico 64 381 4 18 0 0
112 Potato, yam, taro U.S.A. 95 18,665 4 745 0 0 People’s Republic of China 503 7,719 39 537 0 0 Socialist Republic of Viet Nam 4 31 0 0 0 0 Taiwan 52 19 5 1 0 0 France 119 4 8 0 0 0
113 Cucurbitaceous vegetables Mexico 1,094 56,311 21 825 0 0 New Zealand 543 55,357 9 186 0 0 New Caledonia (including Chesterfield) 15 2,560 5 433 0 0 Korea 1,130 1,347 11 43 0 0 Tonga 34 1,126 6 264 0 0
114 Vegetables of asteraceae People’s Republic of China 1,856 44,132 90 1,813 0 0 Taiwan 755 10,238 26 328 0 0 U.S.A. 2,406 6,936 170 337 0 0 Mexico 141 433 10 24 0 0 Belgium 340 248 33 20 0 0
115 Mushroom People’s Republic of China 4,145 6,693 440 685 0 0 Korea 844 498 34 37 0 0 Netherlands 33 438 32 417 0 0 France 960 370 957 369 1 0 Turkey 217 114 207 107 0 0
116 Umbeliferous vegetables People’s Republic of China 2,406 68,366 2,299 68,343 2 26 U.S.A. 1,578 10,608 172 1,223 2 8 New Zealand 309 4,199 17 103 0 0 Taiwan 122 3,105 119 3,103 0 0 Australia 257 2,851 23 242 0 0
117 Solanaceous vegetables Korea 4,753 23,612 488 2,375 1 4 Netherlands 5,913 7,899 648 771 0 0 New Zealand 4,459 5,208 362 392 0 0 U.S.A. 966 3,645 53 197 0 0 People’s Republic of China 160 1,715 153 1,664 0 0
118 Liliaceae vegetables People’s Republic of China 15,018 340,335 4,988 69,971 1 19 U.S.A. 1,394 26,005 58 839 0 0 New Zealand 829 23,016 56 495 0 0 Australia 951 9,331 83 308 0 0 Mexico 1,772 5,746 72 200 0 0
119 Other vegetables People’s Republic of China 2,212 24,964 188 1,496 0 0 Thailand 5,597 3,798 914 990 19 76 Philippines 1,766 3,569 121 216 0 0 Oman 363 1,378 311 1,261 4 6 Taiwan 383 1,214 47 204 0 0
023 Fruits 120 Stone fruits
U.S.A. 5,657 10,515 233 333 0 0 People’s Republic of China 76 2,624 1 11 0 0 Serbia 47 267 6 5 0 0 Greece 5 87 0 0 0 0 Chile 14 48 1 2 0 0
121 Citrus fruits U.S.A. 10,953 221,009 483 8,954 0 0 South Africa 1,357 53,803 90 2,963 1 14 Australia 1,249 30,633 153 3,211 3 74 Chile 1,027 14,729 51 814 0 0 Israel 28 3,778 2 603 0 0
122 Pomaceous fruits
New Zealand 87 1,922 7 85 0 0 People’s Republic of China 13 138 0 0 0 0 Korea 137 48 0 0 0 0 U.S.A. 4 19 0 0 0 0 Chile 1 5 0 0 0 0

22
Certification of Items Top 5 Countries Number and Weight of
Import Declaration Number of Inspection Number of Violation
Number Weight Number Weight Number Weight 123 Tropical fruits
Philippines 12,770 1,189,049 574 31,534 1 23 Mexico 3,941 63,182 3,137 57,030 8 39 New Zealand 238 60,528 10 592 0 0 Ecuador 1,509 35,664 73 1,582 0 0 Taiwan 1,306 9,399 102 550 0 0
124 Berry fruits U.S.A. 6,757 11,728 551 1,246 3 2 Canada 413 10,498 24 196 0 0 People’s Republic of China 217 6,653 13 158 0 0 Chile 935 3,403 89 139 0 0 Egypt 24 1,171 1 24 0 0
125 Other fruits Mexico 1,687 25,015 30 180 1 0 U.S.A. 1,842 18,849 136 772 0 0 Chile 708 12,240 70 864 0 0 People’s Republic of China 187 3,317 38 630 3 12 Korea 1,030 1,070 12 9 0 0
024 Nuts and seeds 126 Nuts
U.S.A. 2,741 43,444 2,715 43,264 18 261 People’s Republic of China 426 8,624 109 1,312 0 0 India 384 6,330 39 650 0 0 Australia 118 1,583 24 308 0 0 Socialist Republic of Viet Nam 90 1,289 9 143 0 0
127 Oil seeds (for extraction of cooking oil) Canada 33 2,199,618 16 401 6 84 Australia 216 90,740 151 20,939 0 0 Nigeria 244 54,669 176 38,146 1 19 Tanzania 106 24,352 17 2,893 0 0 Burkina Faso 57 16,353 11 3,210 0 0
128 Coffee bean Brazil 4,227 136,286 461 12,670 0 0 Socialist Republic of Viet Nam 1,418 69,710 119 4,360 0 0 Indonesia 1,385 50,440 1,385 50,440 1 40 Columbia 983 46,669 140 4,849 0 0 Guatemala 1,286 30,093 220 4,531 0 0
129 Cacao bean Ghana 546 43,214 546 43,214 18 1,273 Venezuela 168 4,375 168 4,375 8 199 Ecuador 144 3,521 144 3,521 3 74 Dominican Republic 32 1,027 4 126 0 0 Republic of Cote d’Ivoire 18 1,004 6 270 0 0
130 Other nuts and seeds Paraguay 63 9,180 9 1,761 0 0 Guatemala 146 7,860 36 2,461 0 0 Myanmar 98 6,346 98 6,346 3 222 Ethiopia 26 4,748 4 773 0 0 Nigeria 54 1,989 47 1,489 0 0
025 Other agricultural food Thailand 297 22 0 0 0 0 Italy 16 7 0 0 0 0 Philippines 59 3 0 0 0 0 People’s Republic of China 1 3 0 0 0 0 India 1 1 0 0 0 0
Processed agricultural food 026 Preparations of cereals
131 Rice flour Thailand 1,185 42,906 87 2,574 0 0 People’s Republic of China 103 26,601 100 26,592 0 0 U.S.A. 393 19,550 35 1,812 0 0 Australia 7 129 1 21 0 0 Taiwan 8 18 3 7 0 0
132 Oat flour Korea 1,366 32,853 40 793 0 0 Singapore 106 5,530 4 140 0 0 Italy 187 1,699 12 58 0 0 Indonesia 44 1,646 0 0 0 0 Germany 84 1,098 6 35 0 0
133 Flour of miscellaneous cereals Australia 19 1,922 1 0 0 0 U.S.A. 73 1,431 26 242 0 0 France 13 780 0 0 0 0 New Zealand 50 579 4 32 0 0 South Africa 2 467 0 0 0 0
134 Boiled cereals in water U.S.A. 902 24,901 23 483 0 0 Thailand 926 20,275 36 735 0 0 People’s Republic of China 41 512 8 111 0 0 France 13 283 1 14 0 0 Canada 4 98 0 0 0 0
135 Noodles (other than frozen food) Italy 6,224 94,290 108 468 0 0 Turkey 966 25,890 14 245 0 0 U.S.A. 446 21,606 5 34 0 0 People’s Republic of China 3,361 16,949 325 1,376 0 0 Korea 10,635 9,793 212 174 0 0
136 Bread (other than frozen food) U.S.A. 11 141 2 0 0 0 France 212 124 10 1 0 0 Italy 167 108 20 3 1 0 Canada 31 66 2 2 0 0 Germany 95 58 32 17 0 0
137 Cereals: Frozen food U.S.A. 4,945 47,253 330 2,434 0 0 Thailand 601 9,201 70 510 2 0 People’s Republic of China 2,380 7,484 296 1,008 1 1

23
Certification of Items Top 5 Countries Number and Weight of
Import Declaration Number of Inspection Number of Violation
Number Weight Number Weight Number Weight France 2,161 4,641 252 295 1 0 New Zealand 677 4,499 36 280 0 0
138 Cereals: Tightly-packaged food pasteurized by pressing and heating
Thailand 364 6,799 34 434 0 0 New Zealand 40 867 8 134 0 0 People’s Republic of China 86 823 18 93 1 17 Korea 145 17 8 4 0 0 Taiwan 2 0 1 0 0 0
139 Other preparations of cereals People’s Republic of China 725 9,883 70 390 0 0 Australia 185 5,356 6 13 0 0 Korea 2,828 3,854 56 146 0 0 United Kingdom 339 2,076 26 41 0 0 U.S.A. 533 2,054 53 118 1 1
027 Preparations of pulses 140 Pulses flour
India 249 22,209 13 196 0 0 U.S.A. 53 3,718 0 0 0 0 People’s Republic of China 59 459 8 83 0 0 Belgium 3 20 0 0 0 0 Taiwan 3 9 2 6 0 0
141 Peanuts preparations People’s Republic of China 3,082 54,080 3,082 54,080 13 77 U.S.A. 313 2,611 313 2,611 4 36 Australia 21 151 18 151 0 0 India 4 59 4 59 0 0 Argentina 1 20 1 20 0 0
142 Roasted/fried pulses (other than peanuts) People’s Republic of China 289 2,170 57 387 0 0 Iran 1 5 0 0 0 0 Philippines 58 3 3 0 0 0 Bangladesh 1 1 1 1 0 0 Thailand 3 1 0 0 0 0
143 Bean jam People’s Republic of China 5,537 74,301 521 3,871 0 0 Philippines 74 567 0 0 0 0 Thailand 17 266 3 39 0 0 Korea 50 165 1 0 0 0 U.S.A. 3 39 1 0 0 0
144 Boiled beans (including boiled aduzki) People’s Republic of China 2,487 12,472 263 997 1 25 Italy 202 752 14 40 0 0 U.S.A. 98 409 30 117 0 0 Taiwan 5 36 3 18 0 0 Canada 1 19 0 0 0 0
145 Processed soybean (other than listed above) People’s Republic of China 121 178 19 45 0 0 Thailand 110 66 5 3 0 0 Taiwan 3 2 2 1 0 0 Korea 7 2 0 0 0 0
146 Pulses: Frozen food People’s Republic of China 823 4,689 161 1,052 0 0 Italy 53 700 14 162 0 0 Thailand 151 178 24 32 0 0 Taiwan 25 150 8 6 0 0 Hong Kong 1 10 1 10 0 0
147 Pulses: Tightly-packaged food pasteurized by pressing and heating
People’s Republic of China 426 1,922 24 57 0 0 Italy 6 74 1 10 0 0 India 10 47 4 10 0 0 Thailand 23 15 1 1 0 0 Taiwan 2 0 0 0 0 0
148 Other preparations of pulses U.S.A. 538 78,552 2 3 0 0 India 478 29,314 30 334 0 0 People’s Republic of China 773 4,076 96 264 0 0 Italy 77 326 4 17 0 0 Taiwan 24 36 13 16 0 0
028 Preparations of vegetables (other than processed mushroom, spices, processed herb and tea)
149 Dried vegetables People’s Republic of China 4,352 35,786 1,500 7,320 4 16 U.S.A. 505 4,874 39 212 0 0 Thailand 350 824 71 235 0 0 Egypt 44 752 2 21 0 0 Socialist Republic of Viet Nam 241 429 51 47 0 0
150 Flour U.S.A. 536 20,037 16 485 0 0 Germany 53 2,166 3 129 0 0 People’s Republic of China 208 1,980 37 243 0 0 Netherlands 40 1,331 3 75 0 0 Spain 28 432 3 29 0 0
151 Salted vegetables (including in brine) People’s Republic of China 6,419 106,769 533 7,097 1 5 Thailand 1,201 17,063 34 238 0 0 Socialist Republic of Viet Nam 182 2,987 9 246 0 0 Taiwan 54 1,524 8 68 0 0 Republic of Sri Lanka 37 849 0 0 0 0
152 Preserved vegetables People’s Republic of China 26,116 113,981 1,907 5,440 4 8 Korea 13,202 20,879 284 160 0 0 Republic of Sri Lanka 301 2,572 3 6 0 0 Thailand 637 1,972 25 81 0 0 Turkey 94 1,115 14 101 0 0
153 Boiled vegetables in water People’s Republic of China 20,580 123,745 1,708 8,376 1 7

24
Certification of Items Top 5 Countries Number and Weight of
Import Declaration Number of Inspection Number of Violation
Number Weight Number Weight Number Weight Italy 2,710 96,040 41 668 0 0 Thailand 454 5,212 30 244 0 0 U.S.A. 134 3,492 4 10 0 0 Turkey 47 2,754 2 0 0 0
154 Puree and paste People’s Republic of China 838 45,719 81 1,812 0 0 U.S.A. 531 32,615 9 56 0 0 Portugal 324 26,126 0 0 0 0 Chile 184 16,635 0 0 0 0 Turkey 316 15,491 3 73 0 0
155 Vegetables: Frozen food People’s Republic of China 33,107 326,507 11,003 118,696 24 255 U.S.A. 12,568 310,118 847 10,441 0 0 Thailand 3,753 37,056 682 5,747 4 5 Taiwan 2,000 32,364 268 3,885 1 1 Canada 1,569 31,079 90 1,387 3 6
156 Vegetables: Tightly-packaged food pasteurized by pressing and heating
People’s Republic of China 1,147 3,623 201 618 1 0 Thailand 114 1,941 7 18 0 0 Italy 16 261 5 64 0 0 Taiwan 10 77 4 26 0 0 New Zealand 1 22 1 22 0 0
157 Other preparations of vegetables People’s Republic of China 10,993 56,254 1,135 5,010 0 0 U.S.A. 707 27,828 12 151 0 0 Italy 1,241 22,998 72 357 1 0 New Zealand 93 8,127 1 0 0 0 Australia 129 7,561 2 1 0 0
029 Processed mushroom product 158 Dried mushroom (including flour)
People’s Republic of China 3,657 8,260 1,528 3,282 2 4 Hong Kong 115 243 47 122 0 0 Italy 76 17 75 16 0 0 Korea 30 16 6 0 0 0 Thailand 17 9 0 0 0 0
159 Salted mushroom (including in brine) People’s Republic of China 560 4,624 20 180 0 0 Socialist Republic of Viet Nam 3 43 0 0 0 0 Thailand 2 1 0 0 0 0 Russian Federation 4 0 0 0 0 0 Italy 1 0 0 0 0 0
160 Boiled mushroom in water People’s Republic of China 2,769 18,123 368 1,961 1 0 Socialist Republic of Viet Nam 49 700 8 113 0 0 Indonesia 20 206 1 10 0 0 Korea 5 108 0 0 0 0 Thailand 41 68 2 5 0 0
161 Mushroom: Frozen food People’s Republic of China 594 4,513 151 973 0 0 Belgium 14 49 4 14 0 0 Socialist Republic of Viet Nam 15 30 2 8 0 0 France 9 22 4 8 0 0 Thailand 4 3 0 0 0 0
162 Mushroom: Tightly-packaged food pasteurized by pressing and heating
People’s Republic of China 639 2,191 84 246 0 0 Thailand 46 26 4 1 0 0 Indonesia 5 13 1 4 0 0 Taiwan 2 0 1 0 0 0
163 Other processed mushroom product People’s Republic of China 608 2,223 107 297 0 0 France 58 62 24 1 0 0 Italy 99 18 5 0 0 0 Netherlands 1 13 0 0 0 0 Thailand 22 11 3 1 0 0
030 Processed wild grass product and spices 164 Allspice
Jamaica 6 68 1 10 0 0 Mexico 5 58 1 5 0 0 Guatemala 3 20 0 0 0 0 Netherlands 1 10 1 10 0 0 Malaysia 6 8 1 1 0 0
165 Cinnamon People’s Republic of China 28 153 0 0 0 0 Socialist Republic of Viet Nam 19 139 2 12 0 0 Malaysia 62 81 6 9 0 0 Republic of Sri Lanka 55 13 3 0 0 0 U.S.A. 61 9 5 1 0 0
166 Laurel Turkey 58 208 1 10 0 0 U.S.A. 4 4 0 0 0 0 Morocco 2 2 0 0 0 0 Socialist Republic of Viet Nam 9 2 0 0 0 0 India 11 2 0 0 0 0
167 Saffron Spain 39 1 1 0 0 0 Iran 9 0 2 0 0 0 U.S.A. 2 0 0 0 0 0 Philippines 7 0 1 0 0 0 Socialist Republic of Viet Nam 2 0 0 0 0 0
168 Clove Singapore 18 170 5 46 0 0 Madagascar 8 81 0 0 0 0 Indonesia 7 13 2 3 0 0 Netherlands 2 13 0 0 0 0 Socialist Republic of Viet Nam 5 10 1 0 0 0
169 Chili pepper

25
Certification of Items Top 5 Countries Number and Weight of
Import Declaration Number of Inspection Number of Violation
Number Weight Number Weight Number Weight People’s Republic of China 1,027 9,730 1,026 9,721 1 1 Korea 121 560 121 560 0 0 India 17 55 17 55 3 1 U.S.A. 27 41 27 41 0 0 Mexico 9 5 9 5 0 0
170 Nutmeg Indonesia 73 487 73 487 3 19 Republic of Sri Lanka 7 2 7 2 0 0 India 2 0 2 0 0 0 Germany 1 0 1 0 0 0 France 3 0 3 0 0 0
171 Paprika Spain 104 750 5 20 0 0 Chile 8 100 1 15 0 0 People’s Republic of China 7 46 7 46 0 0 Socialist Republic of Viet Nam 4 1 0 0 0 0 Germany 38 1 18 1 0 0
172 Peppers Malaysia 500 3,388 38 268 0 0 Socialist Republic of Viet Nam 271 2,028 18 86 0 0 Indonesia 92 1,408 3 35 0 0 Singapore 65 700 0 0 0 0 India 86 616 6 92 0 0
173 Mustards Canada 167 4,290 10 200 0 0 U.S.A. 25 335 1 16 0 0 People’s Republic of China 1 10 1 10 0 0 Germany 9 5 0 0 0 0 India 23 5 1 0 0 0
174 Curry powder United Kingdom 16 16 5 7 0 0 Malaysia 11 7 6 5 0 0 Germany 4 6 2 3 0 0 France 3 5 1 3 0 0 Pakistan 5 4 1 1 1 1
175 Other processed wild grass product and spices India 840 6,383 184 2,098 4 3 Morocco 82 2,479 8 111 0 0 People’s Republic of China 417 2,270 92 363 2 2 Iran 61 1,090 6 120 0 0 U.S.A. 1,362 658 148 168 0 0
031 Tea 176 Non-fermented tea
People’s Republic of China 936 4,560 131 801 0 0 Socialist Republic of Viet Nam 87 319 10 68 0 0 Australia 18 319 4 2 0 0 Kenya 3 70 0 0 0 0 Taiwan 57 60 3 5 0 0
177 Semi-fermented tea People’s Republic of China 1,620 14,718 643 7,419 6 44 Taiwan 482 553 60 50 0 0 U.S.A. 88 51 0 0 0 0 Republic of Sri Lanka 5 33 2 3 1 0 Socialist Republic of Viet Nam 17 25 0 0 0 0
178 Fermented tea Republic of Sri Lanka 3,127 9,630 194 408 0 0 India 1,479 3,021 214 332 2 0 Kenya 83 1,111 8 83 0 0 Indonesia 63 743 4 64 0 0 People’s Republic of China 686 701 21 57 0 0
032 Preparations of fruits 179 Dried fruits (including powdered fruits)
U.S.A. 1,896 28,382 336 3,314 7 41 People’s Republic of China 1,508 15,461 303 1,719 1 16 Philippines 531 4,085 81 277 1 0 Turkey 283 3,020 163 1,365 4 37 Thailand 636 1,613 118 267 0 0
180 Temporarily stored fruits People’s Republic of China 1,138 24,987 179 3,413 0 0 U.S.A. 83 1,792 3 37 0 0 Spain 35 889 4 41 0 0 Chile 45 735 1 23 0 0 Thailand 21 403 0 0 0 0
181 Preserved fruits People’s Republic of China 2,921 10,725 287 1,070 0 0 Spain 679 2,494 109 239 2 1 U.S.A. 99 893 8 56 0 0 Italy 865 378 37 14 1 0 France 161 64 6 1 0 0
182 Syruped fruits People’s Republic of China 4,912 124,560 847 18,053 1 5 Thailand 1,880 35,478 120 1,085 2 1 South Africa 850 15,172 38 549 0 0 Philippines 870 9,132 63 373 2 0 Indonesia 433 8,475 17 267 0 0
183 Jam and marmalade People’s Republic of China 294 2,492 19 127 0 0 France 1,957 2,040 397 1,097 2 0 Egypt 86 1,959 13 131 0 0 Korea 195 1,764 9 49 0 0 United Kingdom 726 346 207 76 1 0
184 Fruits: Frozen food People’s Republic of China 193 3,249 52 789 0 0 France 2,087 2,551 360 259 0 0 Thailand 224 1,811 137 1,079 4 6 Peru 103 1,469 21 210 0 0 Mexico 134 1,097 36 271 0 0

26
Certification of Items Top 5 Countries Number and Weight of
Import Declaration Number of Inspection Number of Violation
Number Weight Number Weight Number Weight 185 Fruits: Tightly-packaged food pasteurized by pressing and heating
People’s Republic of China 110 1,438 8 41 0 0 U.S.A. 18 28 1 0 0 0
186 Other preparations of fruits People’s Republic of China 661 11,143 158 2,455 2 1 Philippines 366 5,028 39 251 1 0 India 223 4,066 19 113 1 0 Korea 598 3,168 39 197 0 0 U.S.A. 328 2,830 32 87 0 0
033 Preparations of nuts and seeds 187 Roasted/fried nuts and seeds (other than coffee bean and cacao bean)
People’s Republic of China 266 2,577 46 316 0 0 U.S.A. 686 1,695 146 330 2 14 Australia 115 287 23 43 0 0 Socialist Republic of Viet Nam 30 82 12 29 0 0 Germany 11 55 9 1 0 0
188 Paste France 476 1,372 76 129 0 0 Germany 97 254 33 74 0 0 Mexico 20 182 0 0 0 0 People’s Republic of China 21 86 9 58 0 0 Italy 200 70 120 34 0 0
189 Syruped nuts and seeds
People’s Republic of China 714 7,172 109 794 0 0 Thailand 32 496 1 14 0 0 Korea 33 280 7 44 0 0 Socialist Republic of Viet Nam 12 124 2 23 0 0 France 84 29 4 1 0 0
190 Coffee product U.S.A. 5,489 4,777 177 34 0 0 Brazil 112 3,942 2 17 0 0 Malaysia 91 1,566 2 53 0 0 Spain 39 1,138 2 2 0 0 Socialist Republic of Viet Nam 107 918 20 96 0 0
191 Cocoa product Singapore 1,037 54,511 23 919 0 0 Malaysia 739 32,695 22 568 0 0 Korea 337 22,079 10 850 0 0 Netherlands 500 9,961 25 358 0 0 Thailand 198 7,257 6 154 0 0
192 Nuts and seeds: Frozen food People’s Republic of China 191 2,816 51 650 0 0 Italy 12 129 3 41 0 0 Mexico 1 16 1 16 0 0 Korea 3 13 2 3 0 0 France 22 6 5 1 0 0
193 Nuts and seeds: Tightly-packaged food pasteurized by pressing and heating
People’s Republic of China 1,509 10,066 175 527 0 0 France 12 8 5 1 0 0 Korea 2 0 1 0 0 0
194 Other preparations of nuts and seeds People’s Republic of China 926 7,696 184 857 1 0 U.S.A. 103 810 19 216 0 0 Korea 531 631 21 24 0 0 Thailand 11 305 3 30 0 0 Guatemala 8 181 0 0 0 0
034 Starch 195 Tapioca starch
Thailand 409 116,755 155 68,416 1 136 Socialist Republic of Viet Nam 6 412 4 308 0 0 Malaysia 48 86 7 9 0 0 Taiwan 15 44 7 20 0 0 Brazil 7 8 3 3 0 0
196 Sago starch Malaysia 85 13,232 8 1,242 0 0 Indonesia 37 3,794 2 342 0 0 Thailand 5 179 0 0 0 0 India 4 2 1 0 0 0
197 Cornstarch U.S.A. 25 202 1 16 0 0 Netherlands 7 156 2 75 0 0 Italy 9 82 2 23 0 0 Australia 1 17 1 17 0 0 Brazil 12 6 2 2 0 0
198 Potato starch Denmark 38 5,696 5 614 0 0 Germany 28 4,782 3 422 0 0 Netherlands 33 4,480 3 300 0 0 Taiwan 5 11 2 1 0 0 Korea 1 0 0 0 0 0
199 Sweet potato starch Korea 23 5 0 0 0 0 People’s Republic of China 3 4 1 1 0 0
200 Wheat starch France 38 589 3 57 0 0 U.S.A. 4 224 1 20 0 0 Netherlands 3 59 0 0 0 0 Italy 1 0 0 0 0 0
201 Chemically modified starch Thailand 45 6,921 7 704 0 0 Malaysia 10 1,273 0 0 0 0 Socialist Republic of Viet Nam 45 1,196 3 71 0 0 Belgium 16 824 3 108 0 0 Germany 67 756 3 45 0 0

27
Certification of Items Top 5 Countries Number and Weight of
Import Declaration Number of Inspection Number of Violation
Number Weight Number Weight Number Weight 202 Other starch
People’s Republic of China 63 1,244 13 352 0 0 Germany 3 102 0 0 0 0 Canada 5 97 1 1 0 0 Thailand 6 81 0 0 0 0 Taiwan 5 75 2 30 0 0
035 Other processed agricultural food 203 Substitute for tea
People’s Republic of China 936 4,263 103 478 0 0 Brazil 209 720 16 56 0 0 South Africa 107 663 5 26 0 0 Korea 1,091 267 18 17 0 0 India 55 259 4 9 0 0
204 Vegetable protein People’s Republic of China 836 13,995 48 278 0 0 Australia 194 8,949 11 323 0 0 U.S.A. 474 7,461 12 167 0 0 Korea 100 2,754 0 0 0 0 France 65 1,593 3 53 0 0
205 Prepared flour Korea 1,899 13,146 56 307 0 0 Australia 208 5,844 8 25 0 0 Singapore 188 5,626 3 88 0 0 U.S.A. 593 5,214 12 65 0 0 Canada 51 2,711 0 0 0 0
206 Other processed agricultural food: Frozen food People’s Republic of China 665 5,317 134 2,376 0 0 New Zealand 20 316 1 0 0 0 Socialist Republic of Viet Nam 22 142 4 20 0 0 Singapore 21 111 4 24 0 0 U.S.A. 27 95 6 18 0 0
207 Other processed agricultural food: Tightly-packaged food pasteurized by pressing and heating
People’s Republic of China 29 351 4 14 0 0 Korea 4 1 2 1 0 0 Taiwan 1 1 0 0 0 0 Philippines 15 1 3 0 0 0 Thailand 1 0 1 0 0 0
208 Other processed agricultural food, not elsewhere classified
Thailand 563 16,793 31 161 2 2 People’s Republic of China 448 5,304 74 478 0 0 Indonesia 145 2,553 9 118 0 0 Singapore 128 1,956 1 14 0 0 Poland 27 1,873 0 0 0 0
Other foods 036 Soup, stew and seasonings (other than frozen food)
209 Soup U.S.A. 1,013 10,073 37 139 0 0 People’s Republic of China 406 1,786 87 318 0 0 Korea 1,037 1,583 56 86 0 0 Thailand 403 1,528 38 55 0 0 New Zealand 438 1,003 13 29 0 0
210 Stew Thailand 95 791 5 0 0 0 Australia 16 276 2 35 0 0 New Zealand 26 249 0 0 0 0 U.S.A. 39 108 8 13 0 0 Pakistan 18 10 0 0 0 0
211 Sauce Thailand 959 7,829 96 357 1 0 New Zealand 1,096 6,529 13 70 0 0 U.S.A. 1,264 6,064 106 230 0 0 Italy 1,504 3,225 171 132 1 0 Korea 174 647 17 78 0 0
212 Fermented soybean paste People’s Republic of China 216 7,380 13 101 0 0 Korea 765 155 13 6 0 0 Thailand 14 33 1 0 0 0
213 Gochujang Korea 844 1,470 72 123 0 0 People’s Republic of China 232 1,206 19 79 0 0 Taiwan 4 29 1 18 0 0 Malaysia 5 3 2 1 0 0
214 Soy sauce People’s Republic of China 130 1,887 13 159 0 0 Thailand 76 157 9 13 0 0 Philippines 139 128 4 0 0 0 Korea 79 85 5 12 0 0 Indonesia 21 56 4 13 0 0
215 Fish sauce Thailand 370 2,212 31 159 0 0 Socialist Republic of Viet Nam 144 1,010 30 130 0 0 Korea 370 292 9 18 0 0 People’s Republic of China 20 38 1 2 0 0 Philippines 59 24 3 0 1 0
216 Ketchup U.S.A. 276 3,818 9 53 0 0 Netherlands 67 1,849 2 37 0 0 People’s Republic of China 23 296 5 55 0 0 Turkey 12 219 1 0 0 0 Sweden 15 117 1 10 0 0
217 Mustard preparations France 352 1,469 51 62 0 0 U.S.A. 230 1,165 21 42 0 0 Philippines 15 194 1 13 0 0 Sweden 32 72 2 7 0 0 Germany 81 15 15 3 0 0

28
Certification of Items Top 5 Countries Number and Weight of
Import Declaration Number of Inspection Number of Violation
Number Weight Number Weight Number Weight 218 Chili pepper preparations
People’s Republic of China 422 1,282 59 169 0 0 U.S.A. 431 1,042 54 103 0 0 Thailand 225 553 24 57 0 0 Taiwan 58 97 17 21 0 0 Belize 47 96 4 8 0 0
219 Vinegar Italy 1,147 1,068 194 133 0 0 People’s Republic of China 112 804 27 175 0 0 France 448 531 69 34 0 0 U.S.A. 103 441 3 2 0 0 Spain 111 167 30 30 0 0
220 Sugar People’s Republic of China 74 3,633 13 404 0 0 Thailand 75 3,485 3 180 0 0 Brazil 28 985 1 76 0 0 Belgium 30 785 0 0 0 0 France 115 424 30 69 0 0
221 Saccharides Korea 4,208 118,277 85 1,491 0 0 Thailand 1,506 82,140 15 319 0 0 U.S.A. 3,002 68,496 154 1,380 1 0 Singapore 1,185 47,218 32 1,320 0 0 Indonesia 37 17,618 3 0 0 0
222 Salts Mexico 77 339,882 0 0 0 0 Australia 306 183,077 8 49,231 0 0 People’s Republic of China 581 16,758 15 498 0 0 Taiwan 25 1,831 1 1 0 0 Germany 44 1,264 5 64 0 0
223 Other seasonings People’s Republic of China 1,573 6,134 290 876 1 1 New Zealand 929 5,317 21 72 0 0 Korea 1,817 5,269 101 71 2 0 Socialist Republic of Viet Nam 207 4,313 15 64 1 0 Hong Kong 405 3,589 28 163 1 0
037 Oils and fats (other than dairy products) 224 Oils and fats from land animals
Netherlands 32 726 0 0 0 0 U.S.A. 101 661 1 0 0 0 Taiwan 44 238 1 6 0 0 Belgium 38 216 0 0 0 0 New Zealand 11 15 0 0 0 0
225 Oils and fats from aquatic animals Thailand 20 532 0 0 0 0 Norway 13 24 0 0 0 0 Korea 11 20 2 0 0 0 U.S.A. 18 18 4 1 1 1 Iceland 1 14 0 0 0 0
226 Oils and fats from vegetables Italy 5,173 28,655 148 167 0 0 Spain 1,676 24,761 41 214 0 0 Taiwan 251 8,698 11 70 0 0 Canada 233 5,828 17 225 0 0 Malaysia 198 3,916 10 143 0 0
227 Modified oils and fats Singapore 738 8,308 41 252 0 0 New Zealand 217 7,419 9 202 0 0 Belgium 117 2,997 4 72 0 0 Netherlands 98 2,759 2 28 0 0 Malaysia 118 2,572 8 113 0 0
038 Cakes (other than frozen food) 228 Western-style cake
U.S.A. 10,982 17,177 1,912 3,707 3 2 People’s Republic of China 4,449 14,180 637 2,204 0 0 Belgium 10,562 8,694 1,351 338 5 1 Korea 9,700 8,159 407 464 2 0 Malaysia 3,026 8,097 323 647 0 0
229 Japanese-style cake People’s Republic of China 1,727 9,138 230 655 1 11 Thailand 1,313 2,649 82 49 0 0 Philippines 198 780 11 42 0 0 Taiwan 215 664 9 23 0 0 U.S.A. 74 323 0 0 0 0
230 Other cake People’s Republic of China 779 2,875 251 719 0 0 Netherlands 378 979 23 61 0 0 Philippines 258 563 9 12 0 0 Taiwan 279 463 53 79 0 0 Malaysia 26 257 11 83 0 0
039 Frozen food People’s Republic of China 18,365 104,297 4,875 28,250 10 69 Thailand 2,935 16,710 345 1,466 2 21 U.S.A. 1,465 8,376 203 652 0 0 Australia 412 7,116 34 377 0 0 Socialist Republic of Viet Nam 1,205 4,418 268 615 3 8
040 Tightly-packaged food pasteurized by pressing and heating Thailand 891 4,587 130 307 0 0 People’s Republic of China 517 4,412 121 897 1 1 New Zealand 464 1,590 16 35 0 0 Korea 1,049 919 88 67 0 0 India 141 107 65 43 2 0
041 Health food 231 Health food derived from vegetables
Singapore 31 1,657 0 0 0 0 U.S.A. 2,472 1,287 124 57 0 0 People’s Republic of China 930 1,240 308 156 3 1 Netherlands 71 978 4 53 0 0
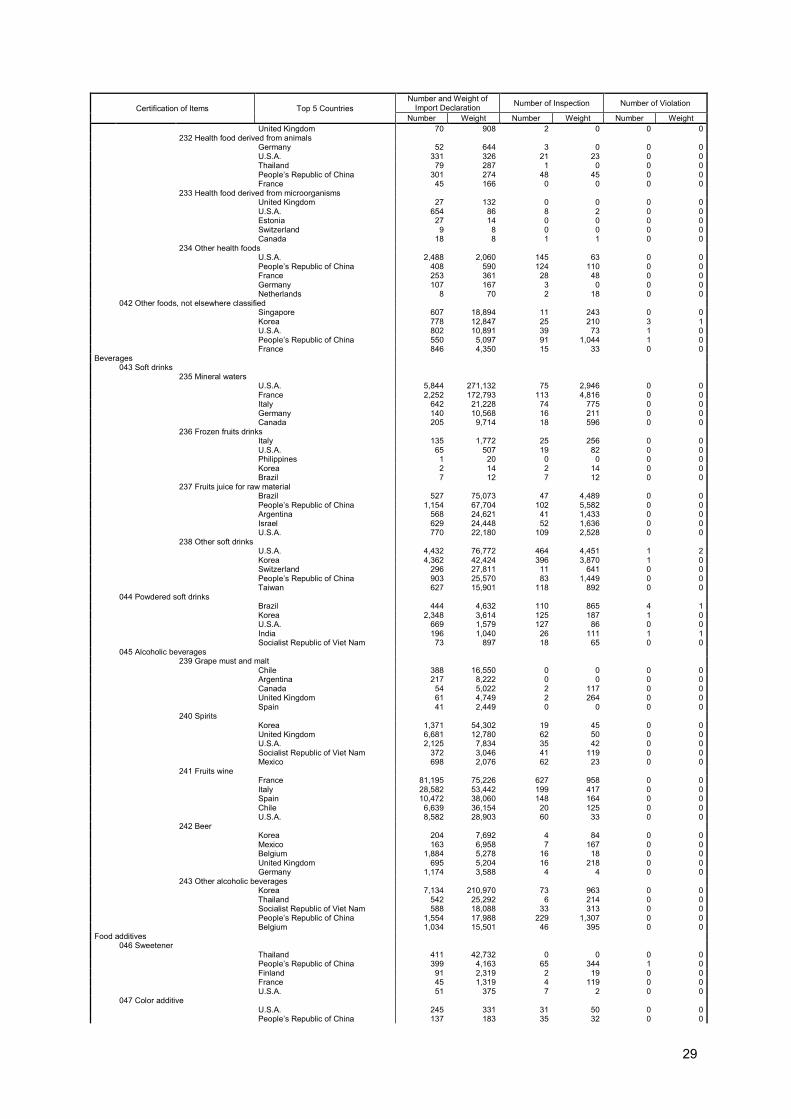
29
Certification of Items Top 5 Countries Number and Weight of
Import Declaration Number of Inspection Number of Violation
Number Weight Number Weight Number Weight United Kingdom 70 908 2 0 0 0
232 Health food derived from animals Germany 52 644 3 0 0 0 U.S.A. 331 326 21 23 0 0 Thailand 79 287 1 0 0 0 People’s Republic of China 301 274 48 45 0 0 France 45 166 0 0 0 0
233 Health food derived from microorganisms United Kingdom 27 132 0 0 0 0 U.S.A. 654 86 8 2 0 0 Estonia 27 14 0 0 0 0 Switzerland 9 8 0 0 0 0 Canada 18 8 1 1 0 0
234 Other health foods U.S.A. 2,488 2,060 145 63 0 0 People’s Republic of China 408 590 124 110 0 0 France 253 361 28 48 0 0 Germany 107 167 3 0 0 0 Netherlands 8 70 2 18 0 0
042 Other foods, not elsewhere classified Singapore 607 18,894 11 243 0 0 Korea 778 12,847 25 210 3 1 U.S.A. 802 10,891 39 73 1 0 People’s Republic of China 550 5,097 91 1,044 1 0 France 846 4,350 15 33 0 0
Beverages 043 Soft drinks
235 Mineral waters U.S.A. 5,844 271,132 75 2,946 0 0 France 2,252 172,793 113 4,816 0 0 Italy 642 21,228 74 775 0 0 Germany 140 10,568 16 211 0 0 Canada 205 9,714 18 596 0 0
236 Frozen fruits drinks Italy 135 1,772 25 256 0 0 U.S.A. 65 507 19 82 0 0 Philippines 1 20 0 0 0 0 Korea 2 14 2 14 0 0 Brazil 7 12 7 12 0 0
237 Fruits juice for raw material Brazil 527 75,073 47 4,489 0 0 People’s Republic of China 1,154 67,704 102 5,582 0 0 Argentina 568 24,621 41 1,433 0 0 Israel 629 24,448 52 1,636 0 0 U.S.A. 770 22,180 109 2,528 0 0
238 Other soft drinks U.S.A. 4,432 76,772 464 4,451 1 2 Korea 4,362 42,424 396 3,870 1 0 Switzerland 296 27,811 11 641 0 0 People’s Republic of China 903 25,570 83 1,449 0 0 Taiwan 627 15,901 118 892 0 0
044 Powdered soft drinks Brazil 444 4,632 110 865 4 1 Korea 2,348 3,614 125 187 1 0 U.S.A. 669 1,579 127 86 0 0 India 196 1,040 26 111 1 1 Socialist Republic of Viet Nam 73 897 18 65 0 0
045 Alcoholic beverages 239 Grape must and malt
Chile 388 16,550 0 0 0 0 Argentina 217 8,222 0 0 0 0 Canada 54 5,022 2 117 0 0 United Kingdom 61 4,749 2 264 0 0 Spain 41 2,449 0 0 0 0
240 Spirits Korea 1,371 54,302 19 45 0 0 United Kingdom 6,681 12,780 62 50 0 0 U.S.A. 2,125 7,834 35 42 0 0 Socialist Republic of Viet Nam 372 3,046 41 119 0 0 Mexico 698 2,076 62 23 0 0
241 Fruits wine France 81,195 75,226 627 958 0 0 Italy 28,582 53,442 199 417 0 0 Spain 10,472 38,060 148 164 0 0 Chile 6,639 36,154 20 125 0 0 U.S.A. 8,582 28,903 60 33 0 0
242 Beer Korea 204 7,692 4 84 0 0 Mexico 163 6,958 7 167 0 0 Belgium 1,884 5,278 16 18 0 0 United Kingdom 695 5,204 16 218 0 0 Germany 1,174 3,588 4 4 0 0
243 Other alcoholic beverages Korea 7,134 210,970 73 963 0 0 Thailand 542 25,292 6 214 0 0 Socialist Republic of Viet Nam 588 18,088 33 313 0 0 People’s Republic of China 1,554 17,988 229 1,307 0 0 Belgium 1,034 15,501 46 395 0 0
Food additives 046 Sweetener
Thailand 411 42,732 0 0 0 0 People’s Republic of China 399 4,163 65 344 1 0 Finland 91 2,319 2 19 0 0 France 45 1,319 4 119 0 0 U.S.A. 51 375 7 2 0 0
047 Color additive U.S.A. 245 331 31 50 0 0 People’s Republic of China 137 183 35 32 0 0
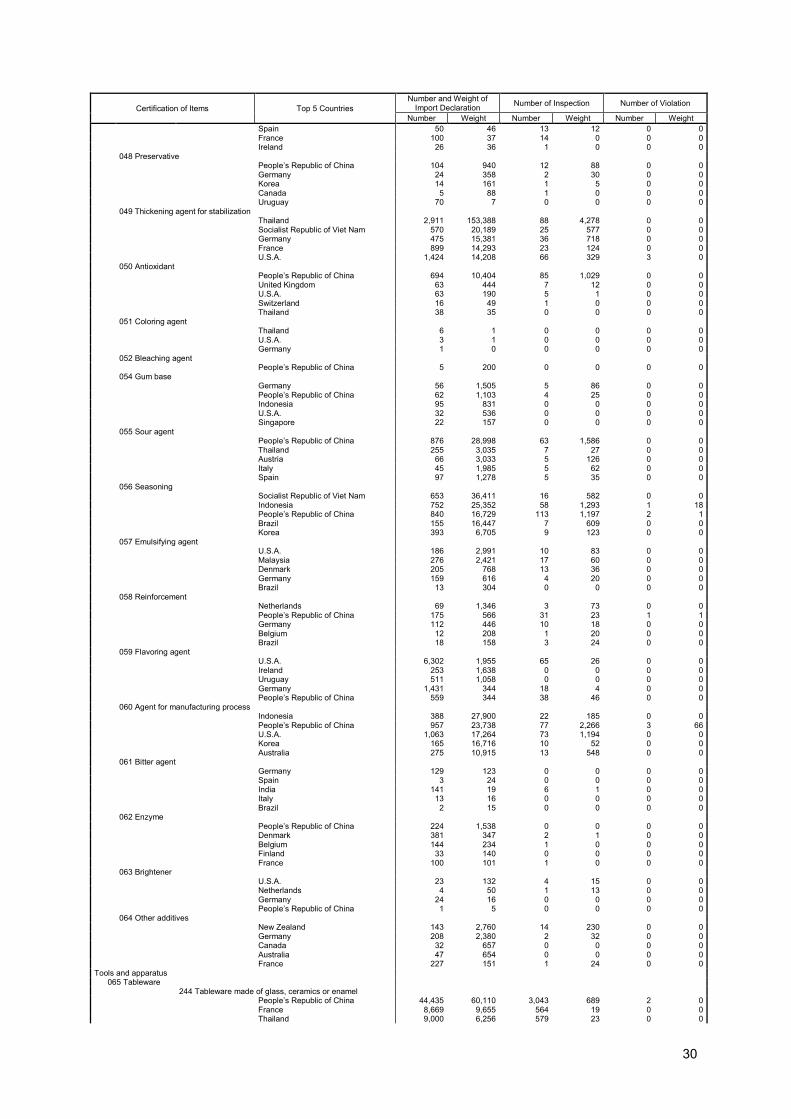
30
Certification of Items Top 5 Countries Number and Weight of
Import Declaration Number of Inspection Number of Violation
Number Weight Number Weight Number Weight Spain 50 46 13 12 0 0 France 100 37 14 0 0 0 Ireland 26 36 1 0 0 0
048 Preservative People’s Republic of China 104 940 12 88 0 0 Germany 24 358 2 30 0 0 Korea 14 161 1 5 0 0 Canada 5 88 1 0 0 0 Uruguay 70 7 0 0 0 0
049 Thickening agent for stabilization Thailand 2,911 153,388 88 4,278 0 0 Socialist Republic of Viet Nam 570 20,189 25 577 0 0 Germany 475 15,381 36 718 0 0 France 899 14,293 23 124 0 0 U.S.A. 1,424 14,208 66 329 3 0
050 Antioxidant People’s Republic of China 694 10,404 85 1,029 0 0 United Kingdom 63 444 7 12 0 0 U.S.A. 63 190 5 1 0 0 Switzerland 16 49 1 0 0 0 Thailand 38 35 0 0 0 0
051 Coloring agent Thailand 6 1 0 0 0 0 U.S.A. 3 1 0 0 0 0 Germany 1 0 0 0 0 0
052 Bleaching agent People’s Republic of China 5 200 0 0 0 0
054 Gum base Germany 56 1,505 5 86 0 0 People’s Republic of China 62 1,103 4 25 0 0 Indonesia 95 831 0 0 0 0 U.S.A. 32 536 0 0 0 0 Singapore 22 157 0 0 0 0
055 Sour agent People’s Republic of China 876 28,998 63 1,586 0 0 Thailand 255 3,035 7 27 0 0 Austria 66 3,033 5 126 0 0 Italy 45 1,985 5 62 0 0 Spain 97 1,278 5 35 0 0
056 Seasoning Socialist Republic of Viet Nam 653 36,411 16 582 0 0 Indonesia 752 25,352 58 1,293 1 18 People’s Republic of China 840 16,729 113 1,197 2 1 Brazil 155 16,447 7 609 0 0 Korea 393 6,705 9 123 0 0
057 Emulsifying agent U.S.A. 186 2,991 10 83 0 0 Malaysia 276 2,421 17 60 0 0 Denmark 205 768 13 36 0 0 Germany 159 616 4 20 0 0 Brazil 13 304 0 0 0 0
058 Reinforcement Netherlands 69 1,346 3 73 0 0 People’s Republic of China 175 566 31 23 1 1 Germany 112 446 10 18 0 0 Belgium 12 208 1 20 0 0 Brazil 18 158 3 24 0 0
059 Flavoring agent U.S.A. 6,302 1,955 65 26 0 0 Ireland 253 1,638 0 0 0 0 Uruguay 511 1,058 0 0 0 0 Germany 1,431 344 18 4 0 0 People’s Republic of China 559 344 38 46 0 0
060 Agent for manufacturing process Indonesia 388 27,900 22 185 0 0 People’s Republic of China 957 23,738 77 2,266 3 66 U.S.A. 1,063 17,264 73 1,194 0 0 Korea 165 16,716 10 52 0 0 Australia 275 10,915 13 548 0 0
061 Bitter agent Germany 129 123 0 0 0 0 Spain 3 24 0 0 0 0 India 141 19 6 1 0 0 Italy 13 16 0 0 0 0 Brazil 2 15 0 0 0 0
062 Enzyme People’s Republic of China 224 1,538 0 0 0 0 Denmark 381 347 2 1 0 0 Belgium 144 234 1 0 0 0 Finland 33 140 0 0 0 0 France 100 101 1 0 0 0
063 Brightener U.S.A. 23 132 4 15 0 0 Netherlands 4 50 1 13 0 0 Germany 24 16 0 0 0 0 People’s Republic of China 1 5 0 0 0 0
064 Other additives New Zealand 143 2,760 14 230 0 0 Germany 208 2,380 2 32 0 0 Canada 32 657 0 0 0 0 Australia 47 654 0 0 0 0 France 227 151 1 24 0 0
Tools and apparatus 065 Tableware
244 Tableware made of glass, ceramics or enamel People’s Republic of China 44,435 60,110 3,043 689 2 0 France 8,669 9,655 564 19 0 0 Thailand 9,000 6,256 579 23 0 0

31
Certification of Items Top 5 Countries Number and Weight of
Import Declaration Number of Inspection Number of Violation
Number Weight Number Weight Number Weight Taiwan 438 2,249 47 22 0 0 Italy 4,018 1,337 424 23 0 0
245 Tableware made of plastic People’s Republic of China 15,843 19,077 768 188 15 0 Taiwan 1,511 4,933 159 40 0 0 Korea 1,256 2,401 38 12 1 0 Indonesia 1,392 2,337 49 29 0 0 Thailand 4,713 1,486 121 4 0 0
246 Tableware made of rubber People’s Republic of China 621 179 104 1 0 0 Thailand 153 127 13 1 0 0 Taiwan 18 4 1 0 0 0 Switzerland 13 3 3 0 0 0 Malaysia 16 3 2 0 0 0
247 Tableware made of metal People’s Republic of China 4,722 3,020 18 0 0 0 Taiwan 83 194 0 0 0 0 India 436 140 1 0 0 0 U.S.A. 237 70 0 0 0 0 Korea 1,080 66 2 0 0 0
248 Tableware made of wood, bamboo or rattan People’s Republic of China 10,712 96,176 10 140 0 0 Socialist Republic of Viet Nam 366 3,389 0 0 0 0 United Kingdom 20 311 0 0 0 0 Indonesia 109 222 1 0 0 0 Russian Federation 25 145 0 0 0 0
249 Tableware made of paper, cloth or leather People’s Republic of China 624 2,536 3 1 0 0 Korea 132 379 0 0 0 0 U.S.A. 185 188 1 0 0 0 Thailand 42 141 0 0 0 0 Taiwan 41 117 0 0 0 0
250 Tableware made of stone Korea 326 115 0 0 0 0 People’s Republic of China 32 42 0 0 0 0 Philippines 5 7 0 0 0 0 Indonesia 2 0 0 0 0 0 India 2 0 0 0 0 0
251 Others: Tableware People’s Republic of China 11,875 15,432 508 95 0 0 Korea 945 3,579 19 9 0 0 Thailand 1,753 2,224 24 2 0 0 Taiwan 439 841 31 2 0 0 Italy 170 497 14 0 0 0
066 Cookware 252 Cookware made of glass, ceramics or enamel
People’s Republic of China 3,435 8,664 193 59 0 0 Thailand 338 1,821 12 1 0 0 France 1,197 574 66 4 2 0 Malaysia 199 452 8 0 0 0 Korea 180 125 21 0 0 0
253 Cookware made of plastic People’s Republic of China 10,069 9,948 349 22 3 0 Korea 1,632 2,680 50 18 0 0 Socialist Republic of Viet Nam 111 424 1 0 0 0 U.S.A. 574 225 37 0 0 0 Thailand 1,750 183 27 0 0 0
254 Cookware made of rubber People’s Republic of China 3,542 2,053 222 6 0 0 Indonesia 11 24 0 0 0 0 Taiwan 85 24 8 0 0 0 Malaysia 6 16 2 0 0 0 Spain 92 15 9 1 0 0
255 Cookware made of metal People’s Republic of China 17,137 23,408 4 3 0 0 Thailand 209 1,599 0 0 0 0 Korea 1,162 1,283 1 0 0 0 Taiwan 493 936 1 1 0 0 Socialist Republic of Viet Nam 434 849 0 0 0 0
256 Cookware made of wood, bamboo or rattan People’s Republic of China 2,050 2,603 1 0 0 0 Thailand 73 168 0 0 0 0 Socialist Republic of Viet Nam 118 135 0 0 0 0 Romania 142 17 0 0 0 0 Japan 18 15 0 0 0 0
257 Cookware made of paper, cloth or leather People’s Republic of China 156 1,304 1 5 0 0 U.S.A. 145 65 0 0 0 0 Italy 278 52 0 0 0 0 Slovak 203 29 0 0 0 0 Singapore 2 16 0 0 0 0
258 Cookware made of stone Italy 12 135 0 0 0 0 Korea 276 101 0 0 0 0 People’s Republic of China 29 47 0 0 0 0 Taiwan 5 41 0 0 0 0 United Kingdom 6 4 0 0 0 0
259 Others: Cookware People’s Republic of China 21,989 48,537 360 99 0 0 Korea 3,334 10,165 90 18 0 0 France 1,872 6,252 30 2 0 0 Socialist Republic of Viet Nam 695 1,337 16 0 0 0 Taiwan 476 677 26 2 1 0
067 Machines and apparatus for food manufacture 260 Machines and apparatus for food manufacture made of glass, ceramics or enamel
Hong Kong 81 3,613 0 0 0 0 People’s Republic of China 10 43 2 0 0 0

32
Certification of Items Top 5 Countries Number and Weight of
Import Declaration Number of Inspection Number of Violation
Number Weight Number Weight Number Weight Italy 7 3 1 0 0 0 Pakistan 1 1 0 0 0 0 United Kingdom 1 0 0 0 0 0
261 Machines and apparatus for food manufacture made of plastic
Thailand 75 2,086 0 0 0 0 Hong Kong 60 1,866 0 0 0 0 People’s Republic of China 310 786 46 1 1 0 Korea 309 51 35 0 0 0 Germany 76 21 6 5 0 0
262 Machines and apparatus for food manufacture made of rubber
People’s Republic of China 132 2,302 21 0 0 0 Hong Kong 58 1,846 0 0 0 0 Thailand 4 33 1 0 0 0 U.S.A. 210 12 6 0 0 0 India 35 6 1 0 0 0
263 Machines and apparatus for food manufacture made of metal
People’s Republic of China 1,017 1,879 1 1 0 0 Germany 1,298 1,439 1 0 0 0 Italy 751 561 0 0 0 0 U.S.A. 1,353 560 1 0 0 0 France 218 370 0 0 0 0
264 Machines and apparatus for food manufacture made of wood, bamboo or rattan
U.S.A. 89 1,920 0 0 0 0 United Kingdom 62 1,810 0 0 0 0 Spain 1 29 0 0 0 0 France 8 6 0 0 0 0 Germany 1 3 0 0 0 0
265 Machines and apparatus for food manufacture made of paper, cloth or leather
People’s Republic of China 4 8 0 0 0 0 France 24 5 0 0 0 0 Germany 14 4 0 0 0 0 U.S.A. 42 1 0 0 0 0 Ireland 3 0 0 0 0 0
266 Machines and apparatus for food manufacture made of stone
Spain 11 92 0 0 0 0 Italy 7 36 0 0 0 0 Taiwan 21 23 0 0 0 0 People’s Republic of China 12 15 0 0 0 0 France 9 15 0 0 0 0
267 Others: Machines and apparatus for food manufacture People’s Republic of China 1,795 6,703 24 26 0 0 U.S.A. 321 562 3 0 0 0 Socialist Republic of Viet Nam 188 541 1 0 0 0 Italy 807 531 7 1 0 0 Korea 188 365 6 1 0 0
068 Other tools and apparatus 268 Other tools and apparatus made of glass, ceramics or enamel
People’s Republic of China 2,882 13,802 217 89 1 0 Thailand 438 779 20 0 0 0 Malaysia 106 624 3 0 0 0 Hong Kong 100 326 1 0 0 0 India 21 119 2 0 0 0
269 Other tools and apparatus made of plastic People’s Republic of China 23,775 47,339 1,323 223 6 0 Thailand 7,471 16,055 149 39 0 0 Taiwan 844 4,472 68 4 3 0 Indonesia 704 3,834 19 3 0 0 U.S.A. 1,941 3,743 113 3 1 0
270 Other tools and apparatus made of rubber Malaysia 2,538 8,170 26 8 0 0 People’s Republic of China 5,402 6,402 532 9 0 0 Thailand 1,397 3,793 30 11 0 0 Socialist Republic of Viet Nam 692 1,108 6 0 0 0 Indonesia 163 807 6 1 0 0
271 Other tools and apparatus made of metal People’s Republic of China 5,840 14,898 8 0 0 0 Thailand 360 640 4 0 0 0 Japan 83 413 0 0 0 0 Korea 271 358 0 0 0 0 Hong Kong 104 274 0 0 0 0
272 Other tools and apparatus made of wood, bamboo or rattan
People’s Republic of China 1,217 3,228 1 0 0 0 Socialist Republic of Viet Nam 83 165 0 0 0 0 Indonesia 11 116 0 0 0 0 France 59 87 0 0 0 0 United Kingdom 22 63 0 0 0 0
273 Other tools and apparatus made of paper, cloth or leather
Malaysia 278 2,330 0 0 0 0 People’s Republic of China 424 1,256 1 0 0 0 Germany 270 651 0 0 0 0 U.S.A. 222 483 1 5 0 0 Australia 94 190 0 0 0 0
274 Other tools and apparatus made of stone People’s Republic of China 186 139 0 0 0 0 India 4 5 0 0 0 0 U.S.A. 3 1 0 0 0 0 United Kingdom 2 1 0 0 0 0 Korea 17 1 0 0 0 0
275 Others: Other tools and apparatus

33
Certification of Items Top 5 Countries Number and Weight of
Import Declaration Number of Inspection Number of Violation
Number Weight Number Weight Number Weight People’s Republic of China 32,581 98,939 471 61 1 0 Thailand 7,017 39,844 20 1 0 0 Korea 2,964 10,271 76 7 0 0 Malaysia 380 1,384 17 5 0 0 Socialist Republic of Viet Nam 608 1,146 16 0 0 0
Container and package 069 Container and package made of glass, ceramics or enamel
People’s Republic of China 239 1,245 46 39 0 0 France 92 621 18 49 0 0 Taiwan 31 210 5 30 0 0 Germany 29 71 6 26 0 0 Italy 30 61 2 7 0 0
070 Container and package made of plastic People’s Republic of China 5,918 26,245 223 372 0 0 Korea 1,442 8,641 50 95 0 0 Taiwan 1,108 4,591 61 77 0 0 Thailand 665 3,437 16 10 0 0 Malaysia 178 1,480 9 20 0 0
071 Container and package made of rubber People’s Republic of China 33 38 6 4 0 0 Canada 2 2 0 0 0 0 Thailand 2 1 0 0 0 0 Korea 12 1 1 0 0 0 Italy 1 0 0 0 0 0
072 Container and package made of metal Taiwan 500 5,183 0 0 0 0 Korea 168 3,500 2 0 0 0 Japan 181 2,074 0 0 0 0 People’s Republic of China 517 1,915 3 8 0 0 Thailand 85 1,718 2 10 0 0
073 Container and package made of wood, bamboo or rattan U.S.A. 95 2,275 0 0 0 0 People’s Republic of China 351 1,385 0 0 0 0 Indonesia 14 739 1 14 0 0 Spain 39 550 0 0 0 0 France 25 132 0 0 0 0
074 Container and package made of paper, cloth or leather Malaysia 534 4,530 0 0 0 0 People’s Republic of China 392 2,302 0 0 0 0 Finland 10 1,249 0 0 0 0 Korea 78 581 0 0 0 0 Thailand 44 492 0 0 0 0
076 Others: Container and package Korea 715 6,228 4 1 0 0 People’s Republic of China 1,579 2,363 38 19 0 0 Malaysia 62 848 1 0 0 0 Taiwan 193 712 1 0 0 0 U.S.A. 160 495 13 0 0 0
Toys 077 Toys touched with mouth of infants
People’s Republic of China 1,395 282 47 2 0 0 Taiwan 47 32 2 2 0 0 Thailand 40 21 12 0 0 0 Germany 153 4 9 0 0 0 Korea 12 2 0 0 0 0
078 Accessory toys, transfer pictures and tumble dolls People’s Republic of China 57,744 50,697 2,511 386 4 0 Socialist Republic of Viet Nam 5,747 3,768 411 15 0 0 Thailand 2,699 3,178 122 16 0 0 Denmark 820 490 42 11 0 0 Taiwan 1,207 387 102 15 0 0
079 Toys in combination People’s Republic of China 3,427 3,472 55 10 0 0 Thailand 734 601 7 6 0 0 Socialist Republic of Viet Nam 387 565 36 2 0 0 Indonesia 194 15 0 0 0 0 Bulgaria 11 10 0 0 0 0

34
Table 5. State of Declaration, Inspection and Violation by Country of Production/Manufacture
Country Number and Weight of Import Number of Inspection Number of Violation
Number Weight Number Weight Number Weight tons tons tons Asia 1,173,756 9,191,040 148,244 1,420,469 613 4,087 Korea 146,982 829,995 8,213 25,744 37 26 People’s Republic of China 650,431 4,070,058 98,424 919,501 221 1,549 Taiwan 28,732 214,809 3,667 14,955 22 26 Mongolia 19 30 4 1 0 0 Hong Kong 3,280 13,417 407 460 1 0 Socialist Republic of Viet Nam 49,868 366,384 13,984 108,992 103 676 Thailand 155,770 1,487,592 11,819 195,669 84 801 Singapore 9,851 234,660 421 4,882 0 0 Malaysia 17,215 132,862 1,397 5,502 2 14 Brunei 5 115 1 23 0 0 Philippines 36,156 1,264,959 2,358 36,168 16 49 Indonesia 40,170 285,651 3,278 59,760 26 112 Cambodia 131 568 21 79 0 0 Laos 740 6,698 75 782 5 0 Myanmar 2,105 44,842 381 18,871 5 264 India 13,199 152,632 2,435 23,133 63 519 Pakistan 595 6,118 58 267 2 1 Republic of Sri Lanka 11,011 19,316 373 584 8 7 Maldives 236 355 0 0 0 0 Bangladesh 727 2,458 66 98 0 0 East Timor 19 283 0 0 0 0 Macau 5 0 0 0 0 0 Nepal 292 169 47 30 1 0 Bhutan 44 3 2 2 0 0 Iran 306 2,707 122 870 4 29 Bahrain 93 1,471 3 35 0 0 Saudi Arabia 21 245 5 37 1 8 Qatar 46 2 2 0 0 0 Oman 516 3,172 329 1,287 5 6 Israel 2,191 35,822 150 2,571 5 1 Jordan 14 3 0 0 0 0 Syria 8 7 3 0 0 0 Lebanon 86 38 10 1 0 0 The United Arab Emirates 199 4,590 21 76 0 0 The West Bank and Gaza 28 4 4 0 0 0 The Republic of Yemen 36 313 8 19 0 0 Azerbaijan Republic 5 16 2 16 0 0 Republic of Armenia 54 1 0 0 0 0 Uzbekistan 17 1 5 0 0 0 Kazakhstan 8 0 7 0 0 0 Kyrgyzstan 2 1 0 0 0 0 Georgia 164 136 5 21 0 0 Japan 2,379 8,535 137 34 2 0 Europe 543,064 2,022,115 34,579 71,874 119 159 Iceland 1,882 15,753 261 545 1 0 Norway 15,248 93,007 727 3,200 0 0 Sweden 2,834 13,451 389 1,167 1 0 Denmark 15,307 157,156 645 4,892 0 0 Faeroe Islands 20 832 2 23 0 0 United Kingdom 25,993 45,526 1,775 1,455 2 0 Ireland 1,616 16,133 52 250 0 0 Netherlands 18,175 100,236 1,647 5,474 3 5 Belgium 20,743 67,121 2,249 3,699 5 1 Luxembourg 151 31 39 11 1 0 France 210,978 437,854 9,299 15,129 19 4 Monaco 14 27 9 1 0 0 Germany 38,282 125,697 3,040 5,169 12 24 Switzerland 12,106 32,612 888 910 1 0 Principality of Liechtenstein 4 2 1 1 0 0 Portugal 5,711 30,727 343 237 0 0 Spain 25,336 143,708 1,858 3,164 24 28 Italy 105,950 391,774 7,343 9,048 40 36 San Marino 4 1 0 0 0 0 Malta 217 3,429 36 0 0 0 Finland 3,200 10,540 337 167 0 0 Poland 6,423 37,941 1,125 956 0 0 Russian Federation 6,688 154,819 397 10,235 0 0 Austria 4,383 26,998 358 1,090 1 0 Hungary 3,941 21,466 233 458 0 0 Serbia 253 1,094 22 38 0 0 Albania 15 1 3 0 0 0 Greece 1,934 17,383 185 482 0 0 Romania 1,671 563 57 169 0 0 Bulgaria 579 1,661 66 81 0 0 Cyprus 109 242 16 38 0 0 Turkey 8,557 67,584 820 3,617 7 61 Estonia 131 184 10 29 1 0 Latvia 189 1,258 19 39 0 0 Lithuania 140 388 26 25 0 0 Ukraine 362 203 25 2 1 0 Republic of Belarus 13 0 13 0 0 0 Republic of Moldova 128 69 12 11 0 0 Croatia 284 1,953 18 1 0 0 Slovenia 206 56 12 0 0 0 Bosnia and Herzegovina 46 0 9 0 0 0 Former Yugoslav Republic of Macedonia 77 946 13 2 0 0 Czech 2,179 1,357 161 36 0 0 Slovak 984 332 38 21 0 0 Montenegro 1 0 1 0 0 0 North America 294,411 15,854,259 30,465 4,092,870 228 87,234 Greenland 95 2,325 18 367 0 0

35
Canada 29,742 4,198,213 2,327 106,674 23 326 U.S.A. 234,245 10,947,577 23,572 3,912,024 190 86,830 Mexico 25,434 625,537 4,048 62,173 12 42 Guatemala 1,849 44,709 319 8,277 3 37 Honduras 180 7,356 32 1,035 0 0 Belize 138 4,799 7 172 0 0 El Salvador 183 5,809 15 439 0 0 Nicaragua 286 5,442 23 650 0 0 Costa Rica 432 7,259 42 637 0 0 Panama 102 609 3 7 0 0 Bermuda 3 1 0 0 0 0 The Commonwealth of Bahamas 8 8 1 1 0 0 Jamaica 266 885 15 50 0 0 Barbados 8 1 0 0 0 0 Trinidad and Tobago 21 41 5 13 0 0 Cuba 131 657 16 152 0 0 Haiti 21 61 1 17 0 0 Dominican Republic 91 1,361 14 182 0 0 Puerto Rico (U.S.A.) 1,039 1,385 6 1 0 0 United States Virgin Islands 5 0 0 0 0 0 Netherland Antilles 8 1 0 0 0 0 French West Indies (including Guadeloupe) 33 42 0 0 0 0 French West Indies 80 10 1 0 0 0 Grenada 1 0 0 0 0 0 Saint Lucia 2 0 0 0 0 0 Antigua and Barbuda 3 0 0 0 0 0 Commonwealth of Dominica 2 168 0 0 0 0 British Anguilla 3 1 0 0 0 0 South America 66,725 2,116,487 4,626 132,758 46 889 Columbia 1,470 51,024 199 5,197 1 0 Venezuela 211 4,397 172 4,376 8 199 Guyana 20 4 0 0 0 0 Suriname 64 542 1 9 0 0 Ecuador 3,129 60,700 311 6,565 3 74 Peru 3,722 34,317 439 3,430 3 2 Bolivia 207 5,106 64 1,435 3 91 Chile 23,768 369,541 996 14,017 5 63 Brazil 28,479 1,501,584 1,953 86,201 20 271 Paraguay 163 15,601 27 3,141 1 156 Uruguay 1,791 2,583 4 26 0 0 Argentina 3,696 71,031 459 8,356 2 31 Falkland Island and Dependencies (Br.) 5 57 1 5 0 0 Africa 12,801 358,361 1,932 107,978 33 1,821 Morocco 1,388 21,036 67 309 0 0 Tunisia 691 2,389 121 6 0 0 Egypt 449 6,342 49 770 0 0 Sudan 70 1,044 11 192 1 19 Mauritania 525 22,892 4 103 0 0 Senegal 205 2,966 1 145 0 0 Sierra Leone 5 1 1 0 0 0 Republic of Cote d’Ivoire 80 3,413 9 326 0 0 Ghana 725 46,698 560 43,349 18 1,273 Togo 2 0 1 0 0 0 Burkina Faso 84 16,629 13 3,303 0 0 Canary Islands (Sp.) 16 76 12 17 0 0 Nigeria 343 56,718 226 39,636 1 19 Rwanda 30 395 5 74 0 0 Cameroon 22 555 15 234 3 83 Republic of Congo 1 0 0 0 0 0 Burundi 14 64 1 2 0 0 St. Helena Island and Dependencies (Br.) 16 90 0 0 0 0 Ethiopia 697 23,215 160 4,384 0 0 Kenya 245 1,965 26 116 0 0 Uganda 108 1,829 13 597 1 297 Tanzania 563 37,863 50 4,058 0 0 Republic of Seychelles 301 9,478 0 0 0 0 Mozambique 75 1,997 7 333 0 0 Madagascar 164 491 17 68 1 8 Mauritius 130 635 5 29 0 0 Reunion (Fr.) 25 103 2 1 0 0 Zimbabwe 1 6 0 0 0 0 Namibia 54 887 1 13 0 0 South Africa 5,710 97,770 547 9,806 7 122 Malawi 42 468 6 72 0 0 Botswana 1 0 1 0 1 0 Swaziland 19 346 1 36 0 0 Oceania 90,738 2,613,591 3,534 179,799 14 287 Australia 57,859 2,191,092 2,020 166,813 11 272 Papua New Guinea 533 4,672 6 118 0 0 New Zealand 27,071 377,076 1,456 11,898 3 15 Cook Islands (N.Z.) 91 1,805 7 40 0 0 Tokelau Islands (N.Z.) 3 1 1 0 0 0 Niue Islands (N.Z.) 3 5 2 4 0 0 Samoa 11 69 4 31 0 0 The Republic of Vanuatu 725 12,383 2 26 0 0 Fiji 1,852 10,219 8 47 0 0 Solomon Islands 133 1,137 0 0 0 0 Tonga 57 1,312 6 264 0 0 Kiribati 120 2,748 3 0 0 0 New Caledonia (including Chesterfield) 231 3,476 12 481 0 0 French Polynesia 193 245 2 0 0 0 Guam (U.S.A.) 682 2,023 3 3 0 0 American Samoa 7 4 0 0 0 0 Tuvalu 51 1,489 0 0 0 0 Marshall Islands 184 814 1 73 0 0 Federated States of Micronesia 96 1,063 1 1 0 0 Palau 836 1,961 0 0 0 0
Total 2,181,495 32,155,854 223,380 6,005,747 1,053 94,477

36
Weight of
imports (tons) Percentage (%)
Asia 9,191,040 28.6% Europe 2,022,115 6.3%
North America 15,854,259 49.3%
South America 2,116,487 6.6%
Africa 358,361 1.1%
Oceania 2,613,591 8.1%
Total 32,155,854 100.0%
Figure 4. Composition of Weight of Imports by Area
2,613,591
2,116,487 9,191,040
2,022,115
15,854,259
Oceania
Asia
Europe
North America
South America
Africa 358,361
Weight of imports (tons)
32,155,854

37
State of Declaration, Inspection and Violation of Top 5 Items by Country of Production/Manufacture (on a weight basis)
Area Country Item
Number and Weight of Import Declaration Number of Inspection Number of Violation
Number Weight Number Weight Number Weight Asia
Korea 243 Other alcoholic beverages 7,134 210,970 73 963 0 0 221 Saccharides 4,208 118,277 85 1,491 0 0 240 Spirits 1,371 54,302 19 45 0 0 238 Other soft drinks 4,362 42,424 396 3,870 1 0 042 Bonito, tuna, mackerel 3,545 35,750 6 46 0 0
People’s Republic of China 118 Liliaceae vegetables 15,018 340,335 4,988 69,971 1 19 155 Vegetables: Frozen food 33,107 326,507 11,003 118,696 24 255 019 Heated meat product (packaging after heating) 15,053 180,124 11,519 145,666 4 17 067 Fish: Frozen food 30,697 144,354 4,361 21,297 15 65 182 Syruped fruits 4,912 124,560 847 18,053 1 5
Taiwan 042 Bonito, tuna, mackerel 4,241 66,931 0 0 0 0 155 Vegetables: Frozen food 2,000 32,364 268 3,885 1 1 238 Other soft drinks 627 15,901 118 892 0 0 114 Vegetables of the asteraceae 755 10,238 26 328 0 0 123 Tropical fruits 1,306 9,399 102 550 0 0
Mongolia 222 Salts 5 25 0 0 0 0 238 Other soft drinks 8 5 3 1 0 0 034 Other flesh and fowl preparations 1 0 0 0 0 0 226 Oils and fats from vegetables 4 0 0 0 0 0 037 Honey 1 0 1 0 0 0
Hong Kong 260 Machines and apparatus for food manufacture made of glass, ceramics or enamel 81 3,613 0 0 0 0 223 Other seasonings 405 3,589 28 163 1 0 261 Machines and apparatus for food manufacture made of plastic 60 1,866 0 0 0 0 262 Machines and apparatus for food manufacture made of rubber 58 1,846 0 0 0 0 268 Other tools and apparatus made of glass, ceramics or enamel 100 326 1 0 0 0
Socialist Republic of Viet Nam
128 Coffee bean 1,418 69,710 119 4,360 0 0 056 Seasoning 653 36,411 16 582 0 0 080 Aquatic animals: Frozen food 5,710 30,922 5,366 29,369 39 213 092 Non-glutinous rice 31 28,278 31 28,278 4 203 077 Sliced/shucked fresh aquatic animals (including frozen food) 3,881 27,487 3,538 25,217 22 135
Thailand 019 Heated meat product (packaging after heating) 17,796 223,645 1,350 11,834 0 0 092 Non-glutinous rice 207 172,811 76 68,354 18 471 049 Thickening agent for stabilization 2,911 153,388 88 4,278 0 0 195 Tapioca starch 409 116,755 155 68,416 1 136 221 Saccharides 1,506 82,140 15 319 0 0
Singapore 191 Cocoa product 1,037 54,511 23 919 0 0 221 Saccharides 1,185 47,218 32 1,320 0 0 028 Food made of milk as main material 1,008 40,171 9 295 0 0 029 Other dairy product 761 31,187 15 488 0 0 042 Other foods, not elsewhere classified 607 18,894 11 243 0 0
Malaysia 191 Cocoa product 739 32,695 22 568 0 0 196 Sago starch 85 13,232 8 1,242 0 0 270 Other tools and apparatus made of rubber 2,538 8,170 26 8 0 0 228 Western-style cake 3,026 8,097 323 647 0 0 069 Fish meat kneaded products 290 6,549 24 416 0 0
Brunei 235 Mineral waters 4 115 1 23 0 0 042 Bonito, tuna, mackerel 1 0 0 0 0 0
Philippines 123 Tropical fruits 12,770 1,189,049 574 31,534 1 23 042 Bonito, tuna, mackerel 1,685 11,561 9 132 0 0 182 Syruped fruits 870 9,132 63 373 2 0 011 Chicken 1,732 6,790 21 192 0 0 186 Other preparations of fruits 366 5,028 39 251 1 0
Indonesia 128 Coffee bean 1,385 50,440 1,385 50,440 1 40 042 Bonito, tuna, mackerel 12,976 37,111 30 817 0 0 060 Agent for manufacturing process 388 27,900 22 185 0 0 056 Seasoning 752 25,352 58 1,293 1 18 055 Lobster, prawn, shrimp 2,012 18,427 66 625 1 0
Cambodia 243 Other alcoholic beverages 23 120 2 0 0 0 106 Soybean 1 112 0 0 0 0 238 Other soft drinks 10 100 1 0 0 0 077 Sliced/shucked fresh aquatic animals (including frozen food) 12 93 0 0 0 0 126 Nuts 3 42 1 14 0 0
Laos 128 Coffee bean 66 5,656 5 652 0 0 151 Salted vegetables (including in brine) 6 666 0 0 0 0 150 Flour 11 214 4 38 0 0 103 Job’s tears 5 86 5 86 0 0 242 Beer 11 37 0 0 0 0
Myanmar 107 Adzuki beans 255 19,322 153 7,864 2 42 130 Other nuts and seeds 98 6,346 98 6,346 3 222

38
110 Other pulses 104 4,604 4 126 0 0 077 Sliced/shucked fresh aquatic animals (including frozen food) 571 3,849 22 102 0 0 127 Oil seeds (for extraction of cooking oil) 30 3,751 30 3,751 0 0
India 148 Other preparations of pulses 478 29,314 30 334 0 0 069 Fish meat kneaded products 1,147 28,385 34 708 0 0 140 Pulses flour 249 22,209 13 196 0 0 055 Lobster, prawn, shrimp 1,407 17,696 958 13,012 32 426 077 Sliced/shucked fresh aquatic animals (including frozen food) 842 10,618 167 1,937 3 29
Pakistan 069 Fish meat kneaded products 77 2,082 4 43 0 0 049 Thickening agent for stabilization 78 1,303 1 0 0 0 222 Salts 44 723 2 43 0 0 130 Other nuts and seeds 9 591 2 72 0 0 127 Oil seeds (for extraction of cooking oil) 3 486 0 0 0 0
Republic of Sri Lanka 178 Fermented tea 3,127 9,630 194 408 0 0 042 Bonito, tuna, mackerel 2,212 3,074 0 0 0 0 152 Preserved vegetables 301 2,572 3 6 0 0 055 Lobster, prawn, shrimp 117 896 5 24 0 0 151 Salted vegetables (including in brine) 37 849 0 0 0 0
Maldives 065 Dried fish product 48 219 0 0 0 0 042 Bonito, tuna, mackerel 182 136 0 0 0 0 066 Processed and cooked fish 6 0 0 0 0 0
Bangladesh 055 Lobster, prawn, shrimp 343 1,709 13 49 0 0 077 Sliced/shucked fresh aquatic animals (including frozen food) 33 402 0 0 0 0 107 Adzuki beans 7 232 1 40 0 0 248 Tableware made of wood, bamboo or rattan 6 26 0 0 0 0 064 Sliced/shucked fresh fish (including frozen food) 10 16 0 0 0 0
East Timor 128 Coffee bean 12 281 0 0 0 0 042 Bonito, tuna, mackerel 4 2 0 0 0 0 203 Substitute for tea 2 0 0 0 0 0 175 Other processed wild grass product and spices 1 0 0 0 0 0
Macau 186 Other preparations of fruits 1 0 0 0 0 0 194 Other preparations of nuts and seeds 3 0 0 0 0 0 222 Salts 1 0 0 0 0 0
Nepal 242 Beer 16 125 3 18 0 0 128 Coffee bean 7 15 2 6 0 0 178 Fermented tea 46 10 12 1 0 0 240 Spirits 8 6 1 3 0 0 135 Noodles (other than frozen food) 5 3 2 1 0 0
Bhutan 101 Buckwheat 1 2 1 2 0 0 115 Mushroom 42 2 0 0 0 0 158 Dried mushroom (including flour) 1 0 1 0 0 0
Iran 175 Other processed wild grass product and spices 61 1,090 6 120 0 0 179 Dried fruits (including powdered fruits) 80 853 43 399 2 11 126 Nuts 36 209 36 209 2 18 237 Fruits juice for raw material 12 175 5 39 0 0 139 Other preparations of cereals 5 118 0 0 0 0
Bahrain 056 Crab 78 1,227 3 35 0 0 077 Sliced/shucked fresh aquatic animals (including frozen food) 15 245 0 0 0 0
Saudi Arabia 055 Lobster, prawn, shrimp 9 136 0 0 0 0 070 Container and package made of plastic 2 47 1 23 0 0 244 Tableware made of glass, ceramics or enamel 4 37 0 0 0 0 238 Other soft drinks 4 14 4 14 1 8 123 Tropical fruits 1 11 0 0 0 0
Qatar 245 Tableware made of plastic 46 2 2 0 0 0
Oman 042 Bonito, tuna, mackerel 90 1,577 0 0 0 0 119 Other vegetables 363 1,378 311 1,261 4 6 125 Other fruits 7 109 0 0 0 0 117 Solanaceous vegetables 46 49 16 16 1 0 228 Western-style cake 4 31 1 9 0 0
Israel 237 Fruits juice for raw material 629 24,448 52 1,636 0 0 221 Saccharides 341 4,914 31 247 4 1 121 Citrus fruits 28 3,778 2 603 0 0 060 Agent for manufacturing process 34 832 4 31 0 0 208 Other processed agricultural food, not elsewhere classified 11 556 0 0 0 0
Jordan 226 Oils and fats from vegetables 14 3 0 0 0 0
Syria 226 Oils and fats from vegetables 1 7 0 0 0 0 228 Western-style cake 6 0 2 0 0 0 244 Tableware made of glass, ceramics or enamel 1 0 1 0 0 0
Lebanon 241 Fruits wine 41 19 0 0 0 0 242 Beer 2 8 0 0 0 0 226 Oils and fats from vegetables 7 8 0 0 0 0 219 Vinegar 3 1 0 0 0 0 152 Preserved vegetables 1 0 1 0 0 0
The United Arab Emirates 135 Noodles (other than frozen food) 61 2,621 1 20 0 0 235 Mineral waters 16 1,180 0 0 0 0 042 Bonito, tuna, mackerel 12 233 1 10 0 0 139 Other preparations of cereals 5 130 0 0 0 0

39
064 Sliced/shucked fresh fish (including frozen food) 4 94 0 0 0 0 The West Bank and Gaza
226 Oils and fats from vegetables 11 2 2 0 0 0 242 Beer 6 1 0 0 0 0 181 Preserved fruits 1 0 0 0 0 0 126 Nuts 2 0 2 0 0 0 179 Dried fruits (including powdered fruits) 1 0 0 0 0 0
The Republic of Yemen 128 Coffee bean 19 189 1 17 0 0 042 Bonito, tuna, mackerel 4 80 0 0 0 0 064 Sliced/shucked fresh fish (including frozen food) 1 23 0 0 0 0 055 Lobster, prawn, shrimp 1 18 0 0 0 0 074 Shellfish: Frozen food 4 2 2 1 0 0
Azerbaijan Republic 238 Other soft drinks 2 16 2 16 0 0 241 Fruits wine 2 0 0 0 0 0 248 Tableware made of wood, bamboo or rattan 1 0 0 0 0 0
Republic of Armenia 240 Spirits 14 0 0 0 0 0 055 Lobster, prawn, shrimp 23 0 0 0 0 0 183 Jam and marmalade 6 0 0 0 0 0 233Health food derived from microorganisms 10 0 0 0 0 0 208 Other processed agricultural food, not elsewhere classified 1 0 0 0 0 0
Uzbekistan 175 Other processed wild grass product and spices 1 1 0 0 0 0 241 Fruits wine 9 0 5 0 0 0 037 Honey 4 0 0 0 0 0 040 Other processed livestock food 1 0 0 0 0 0 039 Propolis 1 0 0 0 0 0
Kazakhstan 228 Western-style cake 2 0 1 0 0 0 241 Fruits wine 3 0 3 0 0 0 240 Spirits 3 0 3 0 0 0
Kyrgyzstan 004 Other fresh livestock food 1 1 0 0 0 0 037 Honey 1 0 0 0 0 0
Georgia 241 Fruits wine 157 96 0 0 0 0 235 Mineral waters 2 28 1 9 0 0 238 Other soft drinks 1 12 1 12 0 0 240 Spirits 1 0 0 0 0 0 228 Western-style cake 3 0 3 0 0 0
Japan 072 Container and package made of metal 181 2,074 0 0 0 0 069 Fish meat kneaded products 18 1,793 0 0 0 0 058 Other aquatic animals 5 1,015 0 0 0 0 042 Bonito, tuna, mackerel 37 685 0 0 0 0 046 Codfish 6 491 0 0 0 0
Europe Iceland
052 Other fish 144 5,356 5 117 0 0 047 Flatfish, sole 124 3,227 1 22 0 0 044 Sea bass, sea bream, croaker 88 2,414 0 0 0 0 014 Other aquatic food 103 2,273 3 107 0 0 064 Sliced/shucked fresh fish (including frozen food) 30 941 3 70 0 0
Norway 042 Bonito, tuna, mackerel 567 42,083 9 438 0 0 052 Other fish 10,182 33,460 483 1,812 0 0 064 Sliced/shucked fresh fish (including frozen food) 3,916 9,559 190 597 0 0 043 Horse mackerel, yellowtail, dolphinfish 59 2,665 3 73 0 0 045 Herring, sardine 78 2,448 2 48 0 0
Sweden 049 Thickening agent for stabilization 273 10,172 31 723 1 0 004 Other fresh livestock food 19 465 0 0 0 0 263 Machines and apparatus for food manufacture made of metal 171 322 0 0 0 0 228 Western-style cake 288 321 41 54 0 0 034 Other flesh and fowl preparations 13 306 0 0 0 0
Denmark 003 Pork 7,524 115,390 136 1,998 0 0 026 Cheese and cheese curd 2,363 8,012 62 221 0 0 049 Thickening agent for stabilization 272 6,935 16 174 0 0 198 Potato starch 38 5,696 5 614 0 0 018 Heated meat product (heating after packaging) 219 3,380 43 505 0 0
Faeroe Islands 052 Other fish 14 643 1 1 0 0 047 Flatfish, sole 3 124 0 0 0 0 044 Sea bass, sea bream, croaker 2 43 0 0 0 0 080 Aquatic animals: Frozen food 1 22 1 22 0 0
United Kingdom 240 Spirits 6,681 12,780 62 50 0 0 242 Beer 695 5,204 16 218 0 0 239 Grape must and malt 61 4,749 2 264 0 0 004 Other fresh livestock food 119 2,626 0 0 0 0 109 Pea 88 2,343 9 212 0 0
Ireland 003 Pork 313 6,636 4 81 0 0 026 Cheese and cheese curd 92 2,068 0 0 0 0 043 Horse mackerel, yellowtail, dolphinfish 27 1,912 1 123 0 0 242 Beer 62 1,806 0 0 0 0 059 Flavoring agent 253 1,638 0 0 0 0
Netherlands 191 Cocoa product 500 9,961 25 358 0 0 003 Pork 421 8,499 14 255 0 0 117 Solanaceous vegetables 5,913 7,899 648 771 0 0 043 Horse mackerel, yellowtail, dolphinfish 146 7,069 0 0 0 0 026 Cheese and cheese curd 929 6,516 56 71 0 0
Belgium 155 Vegetables: Frozen food 1,214 17,106 162 1,681 0 0 243 Other alcoholic beverages 1,034 15,501 46 395 0 0
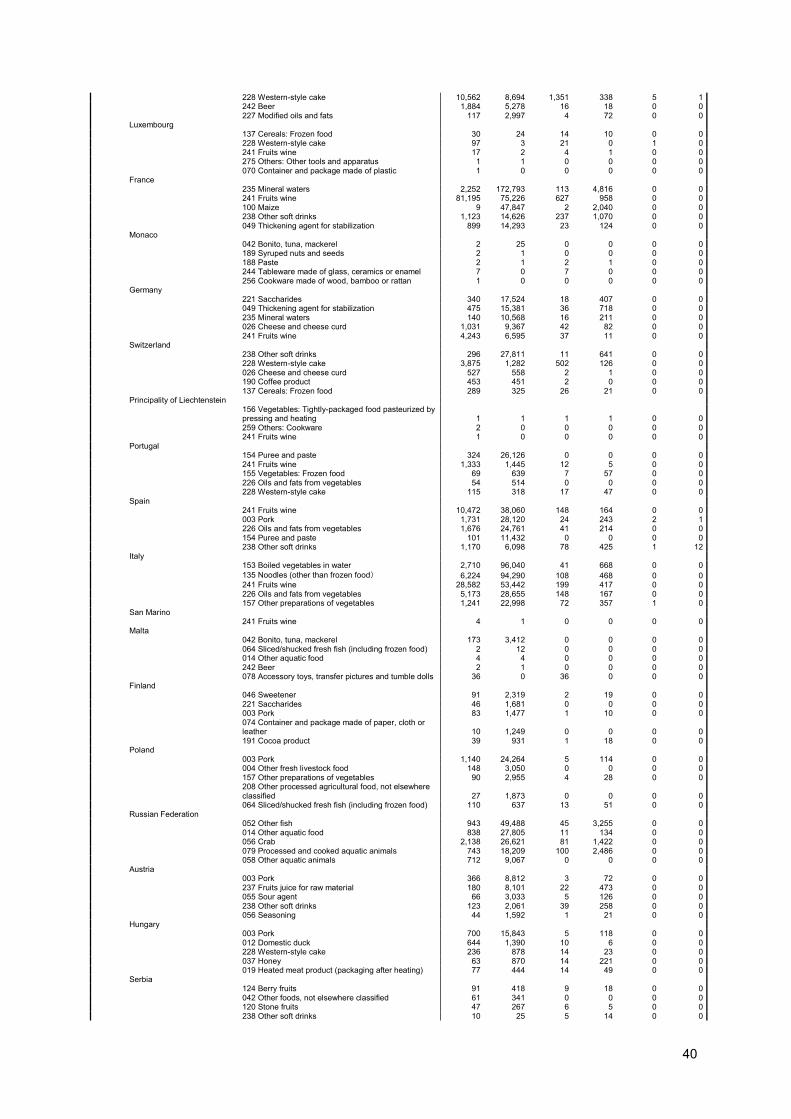
40
228 Western-style cake 10,562 8,694 1,351 338 5 1 242 Beer 1,884 5,278 16 18 0 0 227 Modified oils and fats 117 2,997 4 72 0 0
Luxembourg 137 Cereals: Frozen food 30 24 14 10 0 0 228 Western-style cake 97 3 21 0 1 0 241 Fruits wine 17 2 4 1 0 0 275 Others: Other tools and apparatus 1 1 0 0 0 0 070 Container and package made of plastic 1 0 0 0 0 0
France 235 Mineral waters 2,252 172,793 113 4,816 0 0 241 Fruits wine 81,195 75,226 627 958 0 0 100 Maize 9 47,847 2 2,040 0 0 238 Other soft drinks 1,123 14,626 237 1,070 0 0 049 Thickening agent for stabilization 899 14,293 23 124 0 0
Monaco 042 Bonito, tuna, mackerel 2 25 0 0 0 0 189 Syruped nuts and seeds 2 1 0 0 0 0 188 Paste 2 1 2 1 0 0 244 Tableware made of glass, ceramics or enamel 7 0 7 0 0 0 256 Cookware made of wood, bamboo or rattan 1 0 0 0 0 0
Germany 221 Saccharides 340 17,524 18 407 0 0 049 Thickening agent for stabilization 475 15,381 36 718 0 0 235 Mineral waters 140 10,568 16 211 0 0 026 Cheese and cheese curd 1,031 9,367 42 82 0 0 241 Fruits wine 4,243 6,595 37 11 0 0
Switzerland 238 Other soft drinks 296 27,811 11 641 0 0 228 Western-style cake 3,875 1,282 502 126 0 0 026 Cheese and cheese curd 527 558 2 1 0 0 190 Coffee product 453 451 2 0 0 0 137 Cereals: Frozen food 289 325 26 21 0 0
Principality of Liechtenstein 156 Vegetables: Tightly-packaged food pasteurized by pressing and heating 1 1 1 1 0 0 259 Others: Cookware 2 0 0 0 0 0 241 Fruits wine 1 0 0 0 0 0
Portugal 154 Puree and paste 324 26,126 0 0 0 0 241 Fruits wine 1,333 1,445 12 5 0 0 155 Vegetables: Frozen food 69 639 7 57 0 0 226 Oils and fats from vegetables 54 514 0 0 0 0 228 Western-style cake 115 318 17 47 0 0
Spain 241 Fruits wine 10,472 38,060 148 164 0 0 003 Pork 1,731 28,120 24 243 2 1 226 Oils and fats from vegetables 1,676 24,761 41 214 0 0 154 Puree and paste 101 11,432 0 0 0 0 238 Other soft drinks 1,170 6,098 78 425 1 12
Italy 153 Boiled vegetables in water 2,710 96,040 41 668 0 0 135 Noodles (other than frozen food) 6,224 94,290 108 468 0 0 241 Fruits wine 28,582 53,442 199 417 0 0 226 Oils and fats from vegetables 5,173 28,655 148 167 0 0 157 Other preparations of vegetables 1,241 22,998 72 357 1 0
San Marino 241 Fruits wine 4 1 0 0 0 0
Malta 042 Bonito, tuna, mackerel 173 3,412 0 0 0 0 064 Sliced/shucked fresh fish (including frozen food) 2 12 0 0 0 0 014 Other aquatic food 4 4 0 0 0 0 242 Beer 2 1 0 0 0 0 078 Accessory toys, transfer pictures and tumble dolls 36 0 36 0 0 0
Finland 046 Sweetener 91 2,319 2 19 0 0 221 Saccharides 46 1,681 0 0 0 0 003 Pork 83 1,477 1 10 0 0 074 Container and package made of paper, cloth or leather 10 1,249 0 0 0 0 191 Cocoa product 39 931 1 18 0 0
Poland 003 Pork 1,140 24,264 5 114 0 0 004 Other fresh livestock food 148 3,050 0 0 0 0 157 Other preparations of vegetables 90 2,955 4 28 0 0 208 Other processed agricultural food, not elsewhere classified 27 1,873 0 0 0 0 064 Sliced/shucked fresh fish (including frozen food) 110 637 13 51 0 0
Russian Federation 052 Other fish 943 49,488 45 3,255 0 0 014 Other aquatic food 838 27,805 11 134 0 0 056 Crab 2,138 26,621 81 1,422 0 0 079 Processed and cooked aquatic animals 743 18,209 100 2,486 0 0 058 Other aquatic animals 712 9,067 0 0 0 0
Austria 003 Pork 366 8,812 3 72 0 0 237 Fruits juice for raw material 180 8,101 22 473 0 0 055 Sour agent 66 3,033 5 126 0 0 238 Other soft drinks 123 2,061 39 258 0 0 056 Seasoning 44 1,592 1 21 0 0
Hungary 003 Pork 700 15,843 5 118 0 0 012 Domestic duck 644 1,390 10 6 0 0 228 Western-style cake 236 878 14 23 0 0 037 Honey 63 870 14 221 0 0 019 Heated meat product (packaging after heating) 77 444 14 49 0 0
Serbia 124 Berry fruits 91 418 9 18 0 0 042 Other foods, not elsewhere classified 61 341 0 0 0 0 120 Stone fruits 47 267 6 5 0 0 238 Other soft drinks 10 25 5 14 0 0

41
186 Other preparations of fruits 1 20 0 0 0 0 Albania
272 Other tools and apparatus made of wood, bamboo or rattan 7 1 0 0 0 0 066 Processed and cooked fish 1 0 0 0 0 0 256 Cookware made of wood, bamboo or rattan 2 0 0 0 0 0 248 Tableware made of wood, bamboo or rattan 1 0 0 0 0 0 259 Others: Cookware 1 0 0 0 0 0
Greece 182 Syruped fruits 332 7,263 14 333 0 0 135 Noodles (other than frozen food) 125 3,497 1 1 0 0 127 Oil seeds (for extraction of cooking oil) 20 2,532 0 0 0 0 154 Puree and paste 34 1,531 0 0 0 0 058 Other aquatic animals 29 482 0 0 0 0
Romania 037 Honey 21 326 13 146 0 0 241 Fruits wine 289 73 2 0 0 0 228 Western-style cake 64 38 3 1 0 0 244 Tableware made of glass, ceramics or enamel 1,026 36 5 0 0 0 235 Mineral waters 3 34 1 15 0 0
Bulgaria 074 Shellfish: Frozen food 32 602 0 0 0 0 241 Fruits wine 120 161 3 8 0 0 183 Jam and marmalade 40 125 2 5 0 0 239 Grape must and malt 2 97 0 0 0 0 078 Accessory toys, transfer pictures and tumble dolls 49 89 0 0 0 0
Cyprus 044 Sea bass, sea bream, croaker 3 142 0 0 0 0 238 Other soft drinks 26 73 13 35 0 0 241 Fruits wine 4 8 0 0 0 0 148 Other preparations of pulses 3 5 1 3 0 0 139 Other preparations of cereals 3 4 0 0 0 0
Turkey 135 Noodles (other than frozen food) 966 25,890 14 245 0 0 154 Puree and paste 316 15,491 3 73 0 0 226 Oils and fats from vegetables 295 3,724 18 101 0 0 179 Dried fruits (including powdered fruits) 283 3,020 163 1,365 4 37 153 Boiled vegetables in water 47 2,754 2 0 0 0
Estonia 243 Other alcoholic beverages 13 75 2 2 0 0 047 Flatfish, sole 1 49 0 0 0 0 080 Aquatic animals: Frozen food 2 26 2 26 0 0 233Health food derived from microorganisms 27 14 0 0 0 0 240 Spirits 18 5 0 0 0 0
Latvia 044 Sea bass, sea bream, croaker 3 320 0 0 0 0 124 Berry fruits 4 300 0 0 0 0 052 Other fish 1 263 0 0 0 0 240 Spirits 16 129 0 0 0 0 235 Mineral waters 2 109 0 0 0 0
Lithuania 039 Frozen food 19 99 6 10 0 0 042 Other foods, not elsewhere classified 9 60 0 0 0 0 047 Flatfish, sole 1 53 0 0 0 0 269 Other tools and apparatus made of plastic 53 45 1 0 0 0 052 Other fish 1 45 0 0 0 0
Ukraine 133 Flour of miscellaneous cereals 1 140 0 0 0 0 052 Other fish 5 27 0 0 0 0 241 Fruits wine 103 11 0 0 0 0 228 Western-style cake 158 6 17 1 1 0 240 Spirits 22 5 0 0 0 0
Republic of Belarus 115 Mushroom 13 0 13 0 0 0
Republic of Moldova 241 Fruits wine 108 67 5 9 0 0 037 Honey 3 1 3 1 0 0 210 Stew 1 1 0 0 0 0 238 Other soft drinks 4 0 4 0 0 0 228 Western-style cake 10 0 0 0 0 0
Croatia 042 Bonito, tuna, mackerel 61 1,927 0 0 0 0 241 Fruits wine 33 10 5 1 0 0 263 Machines and apparatus for food manufacture made of metal 3 5 0 0 0 0 251 Others: Tableware 79 4 5 0 0 0 228 Western-style cake 15 2 3 0 0 0
Slovenia 241 Fruits wine 73 42 0 0 0 0 244 Tableware made of glass, ceramics or enamel 105 6 8 0 0 0 267 Others: Machines and apparatus for food manufacture 3 5 0 0 0 0 242 Beer 1 2 0 0 0 0 228 Western-style cake 2 0 0 0 0 0
Bosnia and Herzegovina 241 Fruits wine 25 0 0 0 0 0 078 Accessory toys, transfer pictures and tumble dolls 3 0 2 0 0 0 211 Sauce 11 0 0 0 0 0 115 Mushroom 7 0 7 0 0 0
Former Yugoslav Republic of Macedonia 239 Grape must and malt 26 926 0 0 0 0 139 Other preparations of cereals 14 17 4 2 0 0 175 Other processed wild grass product and spices 28 3 0 0 0 0 115 Mushroom 9 0 9 0 0 0
Czech 242 Beer 192 314 0 0 0 0 078 Accessory toys, transfer pictures and tumble dolls 542 234 55 13 0 0 074 Container and package made of paper, cloth or leather 7 224 0 0 0 0 244 Tableware made of glass, ceramics or enamel 772 221 77 2 0 0 228 Western-style cake 49 113 4 1 0 0

42
Slovak 244 Tableware made of glass, ceramics or enamel 278 122 26 1 0 0 034 Other flesh and fowl preparations 7 104 1 20 0 0 273 Other tools and apparatus made of paper, cloth or leather 390 50 0 0 0 0 257 Cookware made of paper, cloth or leather 203 29 0 0 0 0 263 Machines and apparatus for food manufacture made of metal 10 16 0 0 0 0
Montenegro 115 Mushroom 1 0 1 0 0 0
North America Greenland
055 Lobster, prawn, shrimp 39 715 7 59 0 0 080 Aquatic animals: Frozen food 29 552 10 195 0 0 052 Other fish 9 500 0 0 0 0 047 Flatfish, sole 12 466 1 112 0 0 044 Sea bass, sea bream, croaker 3 66 0 0 0 0
Canada 127 Oil seeds (for extraction of cooking oil) 33 2,199,618 16 401 6 84 096 Wheat 156 1,241,061 27 77,017 6 179 106 Soybean 2,600 346,654 160 10,514 1 3 003 Pork 10,675 204,787 108 1,876 0 0 095 Barley 16 42,955 5 2,079 2 43
U.S.A. 100 Maize 2,587 3,531,214 2,574 3,526,704 102 85,971 096 Wheat 148 2,927,176 59 187,648 13 97 106 Soybean 1,558 1,548,818 165 11,467 5 211 003 Pork 25,097 417,634 197 2,761 0 0 092 Non-glutinous rice 385 310,392 100 36,954 3 23
Mexico 222 Salts 77 339,882 0 0 0 0 123 Tropical fruits 3,941 63,182 3,137 57,030 8 39 003 Pork 5,490 60,087 43 492 0 0 113 Cucurbitaceous vegetables 1,094 56,311 21 825 0 0 001Beef 3,505 29,284 22 326 0 0
Guatemala 128 Coffee bean 1,286 30,093 220 4,531 0 0 130 Other nuts and seeds 146 7,860 36 2,461 0 0 127 Oil seeds (for extraction of cooking oil) 145 4,116 22 864 2 23 123 Tropical fruits 45 844 4 75 0 0 155 Vegetables: Frozen food 64 804 22 206 0 0
Honduras 128 Coffee bean 151 6,702 25 855 0 0 130 Other nuts and seeds 22 593 5 144 0 0 001 Beef 2 25 0 0 0 0 127 Oil seeds (for extraction of cooking oil) 1 18 1 18 0 0 194 Other preparations of nuts and seeds 1 18 1 18 0 0
Belize 237 Fruits juice for raw material 43 3,484 3 164 0 0 042 Bonito, tuna, mackerel 47 1,208 0 0 0 0 218 Chili pepper preparations 47 96 4 8 0 0 054 Gum base 1 11 0 0 0 0
El Salvador 128 Coffee bean 180 5,809 15 439 0 0 275 Others: Other tools and apparatus 3 1 0 0 0 0
Nicaragua 128 Coffee bean 101 2,483 11 235 0 0 130 Other nuts and seeds 10 1,440 1 104 0 0 127 Oil seeds (for extraction of cooking oil) 21 839 8 282 0 0 001 Beef 146 597 0 0 0 0 055 Lobster, prawn, shrimp 6 83 2 29 0 0
Costa Rica 237 Fruits juice for raw material 111 3,342 19 410 0 0 128 Coffee bean 123 2,069 6 115 0 0 186 Other preparations of fruits 50 989 3 37 0 0 123 Tropical fruits 32 437 3 1 0 0 055 Lobster, prawn, shrimp 5 150 1 11 0 0
Panama 001 Beef 57 327 0 0 0 0 042 Bonito, tuna, mackerel 1 121 0 0 0 0 128 Coffee bean 29 114 3 7 0 0 123 Tropical fruits 4 38 0 0 0 0 064 Sliced/shucked fresh fish (including frozen food) 1 6 0 0 0 0
Bermuda 240 Spirits 3 1 0 0 0 0
The Commonwealth of Bahamas 240 Spirits 6 7 0 0 0 0 077 Sliced/shucked fresh aquatic animals (including frozen food) 1 1 0 0 0 0 055 Lobster, prawn, shrimp 1 1 1 1 0 0
Jamaica 128 Coffee bean 127 461 7 37 0 0 240 Spirits 101 206 0 0 0 0 239 Grape must and malt 5 95 0 0 0 0 164 Allspice 6 68 1 10 0 0 242 Beer 6 42 0 0 0 0
Barbados 240 Spirits 7 1 0 0 0 0 243 Other alcoholic beverages 1 0 0 0 0 0
Trinidad and Tobago 129 Cacao bean 4 38 1 12 0 0 243 Other alcoholic beverages 12 3 4 1 0 0 240 Spirits 5 1 0 0 0 0
Cuba 128 Coffee bean 10 215 1 54 0 0 079 Processed and cooked aquatic animals 13 137 1 9 0 0 055 Lobster, prawn, shrimp 29 126 7 35 0 0 240 Spirits 61 92 6 0 0 0 037 Honey 2 72 1 54 0 0
Haiti 128 Coffee bean 4 59 1 17 0 0

43
240 Spirits 14 2 0 0 0 0 180 Temporarily stored fruits 1 0 0 0 0 0 059 Flavoring agent 2 0 0 0 0 0
Dominican Republic 129 Cacao bean 32 1,027 4 126 0 0 128 Coffee bean 23 247 3 50 0 0 240 Spirits 16 68 3 0 0 0 123 Tropical fruits 15 18 3 5 0 0 125 Other fruits 2 0 0 0 0 0
Puerto Rico (U.S.A.) 240 Spirits 236 924 2 0 0 0 239 Grape must and malt 6 269 0 0 0 0 130 Other nuts and seeds 5 125 0 0 0 0 275 Others: Other tools and apparatus 788 66 2 0 0 0 042 Bonito, tuna, mackerel 2 0 0 0 0 0
United States Virgin Islands 240 Spirits 5 0 0 0 0 0
Netherland Antilles 243 Other alcoholic beverages 5 1 0 0 0 0 240 Spirits 3 0 0 0 0 0
French West Indies (including Guadeloupe) 248 Tableware made of wood, bamboo or rattan 4 40 0 0 0 0 240 Spirits 26 2 0 0 0 0 128 Coffee bean 3 0 0 0 0 0
French West Indies 240 Spirits 77 9 0 0 0 0 221 Saccharides 2 1 0 0 0 0 243 Other alcoholic beverages 1 0 1 0 0 0
Grenada 129 Cacao bean 1 0 0 0 0 0
Saint Lucia 240 Spirits 2 0 0 0 0 0
Antigua and Barbuda 240 Spirits 3 0 0 0 0 0
Commonwealth of Dominica 043 Horse mackerel, yellowtail, dolphinfish 2 168 0 0 0 0
British Anguilla 240 Spirits 3 1 0 0 0 0
South America Columbia
128 Coffee bean 983 46,669 140 4,849 0 0 123 Tropical fruits 153 2,333 6 78 0 0 044 Powdered soft drinks 182 605 25 110 0 0 190 Coffee product 24 395 0 0 0 0 155 Vegetables: Frozen food 18 269 4 46 0 0
Venezuela 129 Cacao bean 168 4,375 168 4,375 8 199 240 Spirits 34 16 2 1 0 0 228 Western-style cake 9 6 2 0 0 0
Guyana 240 Spirits 20 4 0 0 0 0
Suriname 069 Fish meat kneaded products 30 289 0 0 0 0 055 Lobster, prawn, shrimp 34 253 1 9 0 0
Ecuador 123 Tropical fruits 1,509 35,664 73 1,582 0 0 155 Vegetables: Frozen food 981 14,389 48 691 0 0 129 Cacao bean 144 3,521 144 3,521 3 74 237 Fruits juice for raw material 32 1,555 5 216 0 0 191 Cocoa product 41 1,100 4 100 0 0
Peru 123 Tropical fruits 525 7,752 37 517 0 0 077 Sliced/shucked fresh aquatic animals (including frozen food) 391 7,737 3 26 0 0 155 Vegetables: Frozen food 231 2,823 54 523 0 0 079 Processed and cooked aquatic animals 99 2,342 8 162 0 0 058 Other aquatic animals 67 1,613 9 231 0 0
Bolivia 130 Other nuts and seeds 46 1,454 28 830 2 46 221 Saccharides 27 1,355 5 199 0 0 127 Oil seeds (for extraction of cooking oil) 48 1,276 12 226 0 0 107 Adzuki beans 28 574 4 133 1 45 222 Salts 20 181 0 0 0 0
Chile 052 Other fish 4,401 127,026 68 2,088 0 0 064 Sliced/shucked fresh fish (including frozen food) 2,903 54,048 233 3,992 4 62 241 Fruits wine 6,639 36,154 20 125 0 0 003 Pork 2,840 35,531 44 457 0 0 154 Puree and paste 184 16,635 0 0 0 0
Brazil 106 Soybean 17 579,200 8 146 2 20 011 Chicken 18,599 385,581 485 9,114 0 0 100 Maize 88 275,296 25 55,563 0 0 128 Coffee bean 4,227 136,286 461 12,670 0 0 237 Fruits juice for raw material 527 75,073 47 4,489 0 0
Paraguay 130 Other nuts and seeds 63 9,180 9 1,761 0 0 127 Oil seeds (for extraction of cooking oil) 36 6,314 8 1,346 1 156 203 Substitute for tea 28 35 5 9 0 0 105 Peanuts 1 25 1 25 0 0 220 Sugar 1 20 0 0 0 0
Uruguay 059 Flavoring agent 511 1,058 0 0 0 0 055 Sour agent 542 478 0 0 0 0 044 Sea bass, sea bream, croaker 17 398 0 0 0 0 056 Seasoning 200 206 3 2 0 0 237 Fruits juice for raw material 5 119 1 24 0 0
Argentina 237 Fruits juice for raw material 568 24,621 41 1,433 0 0 055 Lobster, prawn, shrimp 650 13,587 134 2,336 0 0 239 Grape must and malt 217 8,222 0 0 0 0

44
069 Fish meat kneaded products 136 5,611 3 147 0 0 026 Cheese and cheese curd 157 3,803 3 72 0 0
Falkland Island and Dependencies (Br.) 064 Sliced/shucked fresh fish (including frozen food) 2 31 0 0 0 0 058 Other aquatic animals 2 25 1 5 0 0 052 Other fish 1 1 0 0 0 0
Africa Morocco
058 Other aquatic animals 702 15,777 8 106 0 0 175 Other processed wild grass product and spices 82 2,479 8 111 0 0 084 Dried seaweed 39 777 1 14 0 0 042 Bonito, tuna, mackerel 14 707 0 0 0 0 150 Flour 19 357 2 20 0 0
Tunisia 042 Bonito, tuna, mackerel 28 1,182 0 0 0 0 135 Noodles (other than frozen food) 89 1,079 0 0 0 0 226 Oils and fats from vegetables 32 69 3 2 0 0 058 Other aquatic animals 1 14 0 0 0 0 241 Fruits wine 21 11 0 0 0 0
Egypt 183 Jam and marmalade 86 1,959 13 131 0 0 155 Vegetables: Frozen food 33 1,655 7 522 0 0 124 Berry fruits 24 1,171 1 24 0 0 149 Dried vegetables 44 752 2 21 0 0 130 Other nuts and seeds 13 323 2 38 0 0
Sudan 130 Other nuts and seeds 58 983 9 172 1 19 049 Thickening agent for stabilization 5 61 2 20 0 0 175 Other processed wild grass product and spices 3 0 0 0 0 0 188 Paste 1 0 0 0 0 0 133 Flour of miscellaneous cereals 2 0 0 0 0 0
Mauritania 058 Other aquatic animals 514 22,843 4 103 0 0 077 Sliced/shucked fresh aquatic animals (including frozen food) 1 48 0 0 0 0 014 Other aquatic food 4 1 0 0 0 0 044 Sea bass, sea bream, croaker 3 0 0 0 0 0 047 Flatfish, sole 2 0 0 0 0 0
Senegal 058 Other aquatic animals 148 2,462 1 145 0 0 042 Bonito, tuna, mackerel 10 198 0 0 0 0 073 Processed and cooked shellfish 15 152 0 0 0 0 077 Sliced/shucked fresh aquatic animals (including frozen food) 7 48 0 0 0 0 084 Dried seaweed 4 45 0 0 0 0
Sierra Leone 178 Fermented tea 1 1 0 0 0 0 244 Tableware made of glass, ceramics or enamel 4 0 1 0 0 0
Republic of Cote d’Ivoire 191 Cocoa product 62 2,409 3 55 0 0 129 Cacao bean 18 1,004 6 270 0 0
Ghana 129 Cacao bean 546 43,214 546 43,214 18 1,273 191 Cocoa product 104 2,990 7 130 0 0 042 Bonito, tuna, mackerel 17 411 0 0 0 0 058 Other aquatic animals 4 49 0 0 0 0 242 Beer 12 9 1 0 0 0
Togo 179 Dried fruits (including powdered fruits) 2 0 1 0 0 0
Burkina Faso 127 Oil seeds (for extraction of cooking oil) 57 16,353 11 3,210 0 0 130 Other nuts and seeds 6 275 1 92 0 0 179 Dried fruits (including powdered fruits) 3 0 1 0 0 0 187 Roasted/fried nuts and seeds (other than coffee bean and cacao bean) 4 0 0 0 0 0 194 Other preparations of nuts and seeds 2 0 0 0 0 0
Canary Islands (Sp.) 058 Other aquatic animals 2 59 0 0 0 0 238 Other soft drinks 12 17 12 17 0 0 128 Coffee bean 2 0 0 0 0 0
Nigeria 127 Oil seeds (for extraction of cooking oil) 244 54,669 176 38,146 1 19 130 Other nuts and seeds 54 1,989 47 1,489 0 0 242 Beer 13 32 0 0 0 0 149 Dried vegetables 3 20 0 0 0 0 208 Other processed agricultural food, not elsewhere classified 2 6 0 0 0 0
M Rwanda 128 Coffee bean 27 395 5 74 0 0 178 Fermented tea 3 1 0 0 0 0
Cameroon 129 Cacao bean 21 533 15 234 3 83 128 Coffee bean 1 22 0 0 0 0
Republic of Congo 062 Enzyme 1 0 0 0 0 0
Burundi 128 Coffee bean 13 54 1 2 0 0 178 Fermented tea 1 9 0 0 0 0
St. Helena Island and Dependencies (Br.) 052 Other fish 7 60 0 0 0 0 055 Lobster, prawn, shrimp 8 29 0 0 0 0 128 Coffee bean 1 1 0 0 0 0
Ethiopia 128 Coffee bean 656 16,207 154 3,364 0 0 130 Other nuts and seeds 26 4,748 4 773 0 0 127 Oil seeds (for extraction of cooking oil) 15 2,261 2 247 0 0
Kenya 178 Fermented tea 83 1,111 8 83 0 0 128 Coffee bean 45 537 2 1 0 0 126 Nuts 11 157 3 16 0 0 176 Non-fermented tea 3 70 0 0 0 0
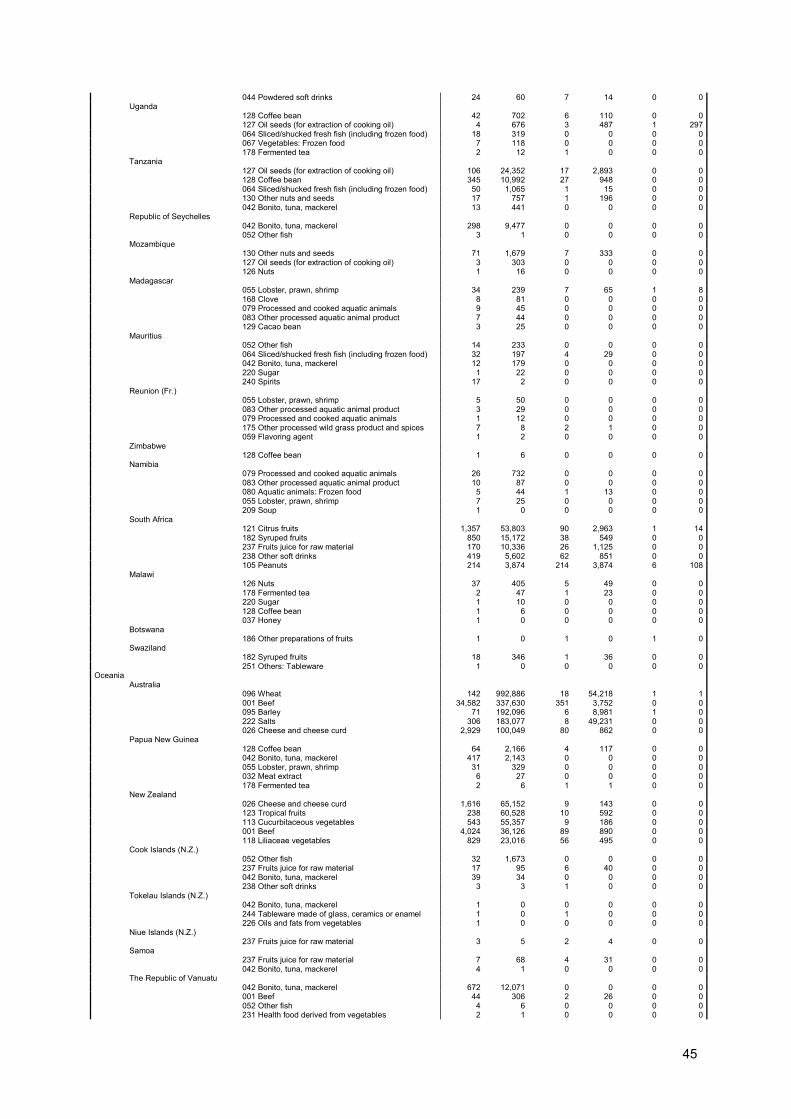
45
044 Powdered soft drinks 24 60 7 14 0 0 Uganda
128 Coffee bean 42 702 6 110 0 0 127 Oil seeds (for extraction of cooking oil) 4 676 3 487 1 297 064 Sliced/shucked fresh fish (including frozen food) 18 319 0 0 0 0 067 Vegetables: Frozen food 7 118 0 0 0 0 178 Fermented tea 2 12 1 0 0 0
Tanzania 127 Oil seeds (for extraction of cooking oil) 106 24,352 17 2,893 0 0 128 Coffee bean 345 10,992 27 948 0 0 064 Sliced/shucked fresh fish (including frozen food) 50 1,065 1 15 0 0 130 Other nuts and seeds 17 757 1 196 0 0 042 Bonito, tuna, mackerel 13 441 0 0 0 0
Republic of Seychelles 042 Bonito, tuna, mackerel 298 9,477 0 0 0 0 052 Other fish 3 1 0 0 0 0
Mozambique 130 Other nuts and seeds 71 1,679 7 333 0 0 127 Oil seeds (for extraction of cooking oil) 3 303 0 0 0 0 126 Nuts 1 16 0 0 0 0
Madagascar 055 Lobster, prawn, shrimp 34 239 7 65 1 8 168 Clove 8 81 0 0 0 0 079 Processed and cooked aquatic animals 9 45 0 0 0 0 083 Other processed aquatic animal product 7 44 0 0 0 0 129 Cacao bean 3 25 0 0 0 0
Mauritius 052 Other fish 14 233 0 0 0 0 064 Sliced/shucked fresh fish (including frozen food) 32 197 4 29 0 0 042 Bonito, tuna, mackerel 12 179 0 0 0 0 220 Sugar 1 22 0 0 0 0 240 Spirits 17 2 0 0 0 0
Reunion (Fr.) 055 Lobster, prawn, shrimp 5 50 0 0 0 0 083 Other processed aquatic animal product 3 29 0 0 0 0 079 Processed and cooked aquatic animals 1 12 0 0 0 0 175 Other processed wild grass product and spices 7 8 2 1 0 0 059 Flavoring agent 1 2 0 0 0 0
Zimbabwe 128 Coffee bean 1 6 0 0 0 0
Namibia 079 Processed and cooked aquatic animals 26 732 0 0 0 0 083 Other processed aquatic animal product 10 87 0 0 0 0 080 Aquatic animals: Frozen food 5 44 1 13 0 0 055 Lobster, prawn, shrimp 7 25 0 0 0 0 209 Soup 1 0 0 0 0 0
South Africa 121 Citrus fruits 1,357 53,803 90 2,963 1 14 182 Syruped fruits 850 15,172 38 549 0 0 237 Fruits juice for raw material 170 10,336 26 1,125 0 0 238 Other soft drinks 419 5,602 62 851 0 0 105 Peanuts 214 3,874 214 3,874 6 108
Malawi 126 Nuts 37 405 5 49 0 0 178 Fermented tea 2 47 1 23 0 0 220 Sugar 1 10 0 0 0 0 128 Coffee bean 1 6 0 0 0 0 037 Honey 1 0 0 0 0 0
Botswana 186 Other preparations of fruits 1 0 1 0 1 0
Swaziland 182 Syruped fruits 18 346 1 36 0 0 251 Others: Tableware 1 0 0 0 0 0
Oceania Australia
096 Wheat 142 992,886 18 54,218 1 1 001 Beef 34,582 337,630 351 3,752 0 0 095 Barley 71 192,096 6 8,981 1 0 222 Salts 306 183,077 8 49,231 0 0 026 Cheese and cheese curd 2,929 100,049 80 862 0 0
Papua New Guinea 128 Coffee bean 64 2,166 4 117 0 0 042 Bonito, tuna, mackerel 417 2,143 0 0 0 0 055 Lobster, prawn, shrimp 31 329 0 0 0 0 032 Meat extract 6 27 0 0 0 0 178 Fermented tea 2 6 1 1 0 0
New Zealand 026 Cheese and cheese curd 1,616 65,152 9 143 0 0 123 Tropical fruits 238 60,528 10 592 0 0 113 Cucurbitaceous vegetables 543 55,357 9 186 0 0 001 Beef 4,024 36,126 89 890 0 0 118 Liliaceae vegetables 829 23,016 56 495 0 0
Cook Islands (N.Z.) 052 Other fish 32 1,673 0 0 0 0 237 Fruits juice for raw material 17 95 6 40 0 0 042 Bonito, tuna, mackerel 39 34 0 0 0 0 238 Other soft drinks 3 3 1 0 0 0
Tokelau Islands (N.Z.) 042 Bonito, tuna, mackerel 1 0 0 0 0 0 244 Tableware made of glass, ceramics or enamel 1 0 1 0 0 0 226 Oils and fats from vegetables 1 0 0 0 0 0
Niue Islands (N.Z.) 237 Fruits juice for raw material 3 5 2 4 0 0
Samoa 237 Fruits juice for raw material 7 68 4 31 0 0 042 Bonito, tuna, mackerel 4 1 0 0 0 0
The Republic of Vanuatu 042 Bonito, tuna, mackerel 672 12,071 0 0 0 0 001 Beef 44 306 2 26 0 0 052 Other fish 4 6 0 0 0 0 231 Health food derived from vegetables 2 1 0 0 0 0

46
043 Horse mackerel, yellowtail, dolphinfish 1 0 0 0 0 0 Fiji
042 Bonito, tuna, mackerel 1,761 8,382 0 0 0 0 235 Mineral waters 29 1,490 3 47 0 0 064 Sliced/shucked fresh fish (including frozen food) 47 331 0 0 0 0 242 Beer 3 14 0 0 0 0 228 Western-style cake 9 1 5 0 0 0
Solomon Islands 042 Bonito, tuna, mackerel 132 1,137 0 0 0 0 037 Honey 1 0 0 0 0 0
Tonga 113 Cucurbitaceous vegetables 34 1,126 6 264 0 0 085 Salted seaweed 7 160 0 0 0 0 042 Bonito, tuna, mackerel 15 19 0 0 0 0 237 Fruits juice for raw material 1 6 0 0 0 0
Kiribati 042 Bonito, tuna, mackerel 100 2,729 0 0 0 0 222 Salts 1 18 0 0 0 0 064 Sliced/shucked fresh fish (including frozen food) 19 1 3 0 0 0
New Caledonia (including Chesterfield) 113 Cucurbitaceous vegetables 15 2,560 5 433 0 0 055 Lobster, prawn, shrimp 23 567 2 48 0 0 042 Bonito, tuna, mackerel 141 341 0 0 0 0 228 Western-style cake 46 8 5 0 0 0 190 Coffee product 3 0 0 0 0 0
French Polynesia 042 Bonito, tuna, mackerel 153 124 0 0 0 0 237 Fruits juice for raw material 11 59 0 0 0 0 242 Beer 11 58 0 0 0 0 175 Other processed wild grass product and spices 11 2 2 0 0 0 203 Substitute for tea 3 1 0 0 0 0
Guam (U.S.A.) 042 Bonito, tuna, mackerel 673 2,019 1 2 0 0 228 Western-style cake 5 3 1 0 0 0 229 Japanese-style cake 4 1 1 0 0 0
American Samoa 042 Bonito, tuna, mackerel 6 4 0 0 0 0 078 Accessory toys, transfer pictures and tumble dolls 1 0 0 0 0 0
Tuvalu 042 Bonito, tuna, mackerel 51 1,489 0 0 0 0
Marshall Islands 042 Bonito, tuna, mackerel 181 773 1 73 0 0 272 Other tools and apparatus made of wood, bamboo or rattan 3 41 0 0 0 0
Federated States of Micronesia 042 Bonito, tuna, mackerel 92 1,063 1 1 0 0 172 Peppers 4 0 0 0 0 0
Palau 042 Bonito, tuna, mackerel 824 1,918 0 0 0 0 237 Fruits juice for raw material 5 41 0 0 0 0 228 Western-style cake 5 1 0 0 0 0 240 Spirits 1 0 0 0 0 0 263 Machines and apparatus for food manufacture made of metal 1 0 0 0 0 0