statistics of government revenues from uk oil and … · numbers of oil and gas fields with...
TRANSCRIPT

1
Coverage: United Kingdom Theme: The Economy Released: June 2018 Next proposed release: Summer 2019 Frequency of release: Annually Media contact: HMRC Press Office (Business) 03000 585021 03000 585028 Statistical contacts: Max Rowe-Brown [email protected] 03000 523125 Responsible statistician: Iqbal Joomeen [email protected] 03000 586260 KAI Direct Business Taxes HM Revenue and Customs 100 Parliament Street London SW1A 2BQ Website: Petroleum Revenue Tax and government revenues from UK oil and gas production
Statistics of Government
revenues from UK Oil and Gas production

2
Contents Page
Statistics of Government revenues from UK oil and gas production 1
About these statistics 3
Key messages 3
Statistics published by HMRC for UK oil and gas sector 4
New or updated statistics in this release 4
Key contact for these statistics 4
Proposed changes to the frequency of oil and gas statistics 4
Section 1
Current UK oil and gas fiscal regime 5
Ring Fence Corporation Tax (RFCT) 5
Supplementary Charge (SC) 5
Petroleum Revenue Tax (PRT) 5
Section 2
Government revenues from UK oil and gas production (Table 11.11) 6
Analysis of Petroleum Revenue Tax assessments (Table 11.12) 11
Numbers of oil and gas fields with different Petroleum Revenue Tax Liabilities (Table 11.13)
15
Section 3
Background Information 18
Methodology 18
Statistical quality 18
User engagement 18
Consultation: Changes to frequency of publications 19
Uses of the statistics 20
Abbreviations 20
Glossary of terms 20
Useful links 21

3
Statistics of Government revenues from UK oil and gas production – including related assessment data for fields subject to Petroleum Revenue Tax (PRT). About these statistics This is a National Statistics publication produced by HM Revenue and Customs. For more information on National Statistics and governance of statistics produced by public bodies please see the UK Statistics Authority website (www.statisticsauthority.gov.uk). Key messages Table 11.11 - Government revenues from UK oil and gas production (updated June 2018)
As a result of industry reducing costs (expenditure 9% lower than last year) and a recovery in the oil price (which rose 30% over the same period), government revenues in 2017-18 climbed to £1,188 million, from the previous record low of -£316 million in 2016-17.
PRT revenues were -£569 million (in comparison to -£654 million in 2016-17) as a result of fewer losses being generated and carried back on account of the improved industry profitability from lower costs and higher oil prices.
Net Corporation Tax (CT) revenues increased by 420% from £338 million in 2016-17 to £1,757 million in 2017-18. Instalment payments of CT increased by £1,040 million from £896 million to £1,936 million; an increase of 116%. Over this period oil prices rose 30% and industry expenditure decreased by 9%, while production remained stable, resulting in a more profitable environment for UK oil and gas production.
Over the same period, repayments of CT fell from £558 million to £179 million (a decrease of 68%), primarily as a result of fewer new losses being made. Losses (particularly decommissioning losses) can be carried back against historical profits to obtain a repayment of previous tax paid – the more profitable environment means fewer losses, hence lower repayments.
Table 11.12 - Petroleum Revenue Tax assessments (updated June 2018)
Income (gross profit) from oil and gas extraction was £1,960 million in 2017H2, close to that of 2017H1, which was £1,989.
Other chargeable receipts – consisting of tariff income and revenues from asset disposals grew by 107% from £166 million in 2017 H1 to £344 million in 2017H2.
There was a 3% decrease (from £1,330 million to £1,292 million) in field expenditure claimed over the same period. Assessable profits (before oil allowance) increased by 23% between 2017 H1 and 2017 H2, from £743 million to £912 million.
After oil allowance, PRT assessable profits were £904 million, an increase of £167 million (23%) from the 2017 H1 amount of £737 million.
With effect from 1 January 2016, the PRT rate was reduced to 0% – therefore there were no PRT payments from this date.
Table 11.13 – Oil and Gas fields with Petroleum Revenue Tax liabilities (updated June 2018)
For the PRT half year period ending 31 December 2017, there were 49 fields with gross PRT profits above £1 million, of which 19 (39%) had no chargeable profits after taking into account expenditure/brought forward losses and reliefs/allowances. In comparison there were 49 fields in 2017 H1, 21 of which did not have chargeable profits, equating to 43%.

4
Statistics published by HMRC for UK Oil and Gas sector
1. Name of publication: Table 11.11 Government revenues from UK Oil and Gas production. Last published: June 2018 Next publication date: Summer 2019 Frequency of publication: Annually
2. Name of publication: Table 11.12 Analysis of Petroleum Revenue Tax assessments. Last published: June 2018 Next proposed publication date: Summer 2019 Proposed frequency of publication: Annually
3. Name of publication: Table 11.13 Numbers of Oil and Gas fields with different Petroleum
Revenue Tax liabilities. Last published: June 2018 Next proposed publication date: Summer 2019 Proposed frequency of publication: Annually
New or updated statistics in this release
Table 11.11 was extended by one year to include 2017-18 receipts, with related charts also extended by one year. Revisions have been made to earlier years’ figures as tax return data is now available.
In this June 2018 publication, Tables 11.12 and 11.13 have been updated to include statistics relating to PRT assessments for the half year chargeable period ending 31 December 2017. Small revisions have also been made to previous chargeable periods due to amended assessments issued within the last 6 months.
Proposed changes to the frequency of oil and gas statistical publications HMRC are consulting users on a proposal to change the frequency of this publication. In summary, the proposals are to:
Reduce the frequency of publishing Tables 11.12 and 11.13 from twice a year (January and June) to once a year in the summer.
The consultation will close on 31 August 2018. More details are provided on page 19 of this document.
Key contacts for these statistics
Max Rowe-Brown [email protected] 03000 523125

5
Section 1 Current UK Oil and Gas Fiscal Regime The tax regime which applies to exploration and production of oil and gas in the UK and on the United Kingdom Continental Shelf (UKCS) currently comprises three elements:
1. Ring Fence Corporation Tax (RFCT)
This is calculated in the same way as the standard corporation tax applicable to all companies
but with the addition of a ‘ring fence’ and the availability of 100% first year allowances for
virtually all capital expenditure. The ring fence prevents taxable profits from oil and gas
extraction in the UK and UKCS being reduced by losses from other activities or excessive
interest payments. The current rate of tax on ring fence profits is 30% and is set separately
from the rate of mainstream corporation tax.
2. Supplementary Charge (SC)
This is an additional charge on a company’s ring fence profits (but with no deduction for
finance costs). With effect from 1 January 2016 the rate is 10%. The rate of SC was 20%
between 1 January 2015 and 31 December 2015, and was 32% prior to this1.
3. Petroleum Revenue Tax (PRT)
This is a field based tax charged on profits arising from oil and gas production from individual
oil and gas fields which were given development consent before 16 March 1993. With effect
from 1 January 2016, the PRT rate was reduced to 0% (previously the rate was 50%). PRT is a
deductible expense in computing profits chargeable to ring fence corporation tax and
supplementary charge.
1 The rate of SC was 20% up until Budget 2011 (24 March 2011) when it increased to 32%

6
Section 2
Table 11.11: Government revenues from UK oil and gas production Table information and assessment (updates in June 2018) Table 11.11 shows historic receipts from all taxes levied on exploration and production activities of oil and gas from the UK and the UK continental shelf. The table covers all years from 1968-69 to 2017-18. The table is supplemented by charts illustrating the changes in receipts from 1984-85 (chart C1) and the trends of oil prices compared with production and expenditure from 1984 (chart C2).
As a result of cost cutting by industry (reducing expenditure by 9% over the last 12 months) and a recovery in the oil price (which increased by 30% over the same period), government revenues in 2017-18 climbed to £1,188 million, from the previous record low of -£316 million in 2016-17.
PRT revenues were -£569 million (in comparison to -£654 million in 2016-17) as a result of fewer losses being generated and carried back on account of the improved industry profitability from lower costs and higher oil prices.
Net Corporation Tax (CT) revenues increased by 420% from £338 million in 2016-17 to £1,757 million in 2017-18. Instalment payments of CT increased by £1,040 million from £896 million to £1,936 million; an increase of 116%. Over this period oil prices rose 30% and industry expenditure decreased by 9%, while production remained stable, resulting in a more profitable environment for UK oil and gas production.
Over the same period, repayments of CT fell from £558 million to £179 million (a decrease of 68%), primarily as a result of fewer new losses being made. Losses (particularly decommissioning losses) can be carried back against historical profits to obtain a repayment of previous tax paid – the more profitable environment means fewer losses, hence lower repayments.
Changes to statistics in June 2018 release
Table 11.11 was extended by one year to include 2017-18 receipts, with related charts also extended by one year. Revisions have been made to earlier years figures as tax return data is now available.
From 2015-16 we are able to provide a more accurate estimate of payments of RFCT and SC as CT payments are reported separately from CT repayments.

7

8
Footnotes 1. Figures for Corporation Tax for 2016-17 and 2017-18 are provisional and subject to change
in the future when payments originally made in respect of a group of companies are subsequently re-allocated to individual companies within the group but which are outside of the ring fence oil and gas regime.
2. From 2015-16, changes were made to the collection of CT receipts data and therefore from this date we are able to disaggregate total net CT between tax payments and repayments.
3. Analysis of tax returns is used to estimate the annual proportional split between Ring-
fenced Corporation Tax (RFCT) and Supplementary Charge (SC) and for years until 2015-16 this split is applied to net total CT. From 2015-16 these proportions have been applied to CT payments as this gives a more accurate estimate of the amounts of RFCT paid and SC paid. For illustrative purposes we continue to apply the split to the net CT figure which is shown in italics.
4. The table reflects the evolving tax regime for the UK Oil & Gas industry, so there are changes in the types of duties levied throughout the years featured in this table. Some examples of the changes are as follows:
Supplementary Petroleum Duty charged for only 2 years in the 1980’s.
Royalties abolished in 2002, with some residual repayments made in 2003.
Introduction of the CT supplementary charge in 2002.
From January 2016, the rate of PRT was permanently set to zero. From this date no PRT payments are due. Companies will continue to carry back losses against earlier years’ profits which may result in a repayment of PRT.
9
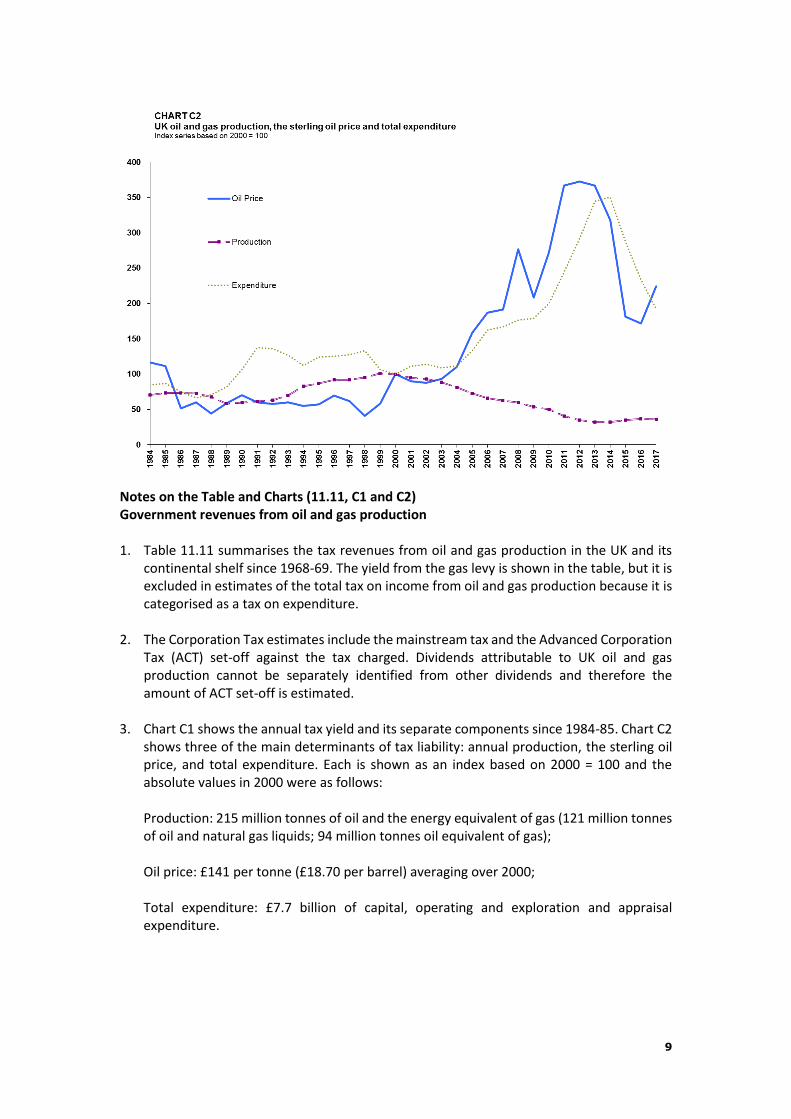
Notes on the Table and Charts (11.11, C1 and C2) Government revenues from oil and gas production 1. Table 11.11 summarises the tax revenues from oil and gas production in the UK and its
continental shelf since 1968-69. The yield from the gas levy is shown in the table, but it is excluded in estimates of the total tax on income from oil and gas production because it is categorised as a tax on expenditure.
2. The Corporation Tax estimates include the mainstream tax and the Advanced Corporation
Tax (ACT) set-off against the tax charged. Dividends attributable to UK oil and gas production cannot be separately identified from other dividends and therefore the amount of ACT set-off is estimated.
3. Chart C1 shows the annual tax yield and its separate components since 1984-85. Chart C2
shows three of the main determinants of tax liability: annual production, the sterling oil price, and total expenditure. Each is shown as an index based on 2000 = 100 and the absolute values in 2000 were as follows:
Production: 215 million tonnes of oil and the energy equivalent of gas (121 million tonnes of oil and natural gas liquids; 94 million tonnes oil equivalent of gas);
Oil price: £141 per tonne (£18.70 per barrel) averaging over 2000;
Total expenditure: £7.7 billion of capital, operating and exploration and appraisal expenditure.

10
4. The tax yield more than halved in 1986-87 because of the comparable fall in the oil price in 1986. Subsequently, it continued to fall as expenditure rose but from 1992-93 to 1996-97, the yield rose steadily in line with rising production and some recovery in oil prices. From 1997-98 to 1999-2000 the yield dropped in line with falling oil prices then rose again as oil prices increased.
5. The yield increased for 2005-06, boosted by a change in the instalment regime for UK Oil
& Gas companies, but declined in 2006-07 and 2007-08 as a result of lower production and higher costs. There was a considerable increase in receipts in 2008-09 due to record oil and gas prices, but yield decreased by half in 2009-10 as prices dropped significantly, production declined and expenditure increased. Despite rising expenditure and the continuing falls in production, yield increased in 2010-11 and 2011-12 as prices rose significantly from 2009 levels and Supplementary Charge was increased to 32% from 24th March 2011.
6. The steep increase in oil prices from 2003 through to 2011 served to inflate running costs
and release capital for investment so expenditure increased during this period. Although the expenditure increases would have the effect of reducing revenues, this was outweighed by the impact of rising oil prices and the trend of revenues over this period was broadly in line with oil price trends. Since 2012-13, tax revenues have dropped significantly as a result of continued high expenditure (though this has declined from its peak), lower production and falling oil prices.
7. From 2016, the rate of PRT was permanently set to zero and SC was reduced to 10%.
These reductions and to a lesser extent the utilisation of the basin wide Investment Allowance (introduced in 2015) resulted in the lowest levels of Government revenues since records began.
8. In response to the shock to the oil price in 2014, expenditure has been decreasing from
2015 to the present. Combined with steady production and a recovery of the oil price, this caused yield to increase significantly in 2017-18, to its highest level in 3 years.
9. Information on the current oil price (Brent crude) is available from Bloomberg.com. 10. Further information about UK Oil & Gas is available from the Oil and Gas Authority

11
Table 11.12: Analysis of Petroleum Revenue Tax assessments Table information and assessment (updated January 2018)
The table covers Petroleum Revenue Tax (PRT) assessments raised on companies participating in fields given development consent on or before 16 March 1993 and the participators are charged PRT on chargeable profits made. The assessments are raised for half year accounts periods ending 30 June (H1) and 31 December (H2). The current table covers assessments for the second half of 2011 to the second half of 2017.
HMRC Assessments are completed five months after the end of the chargeable period. Those for 2017 H2 were finalised in May 2018. Where a company has carried back a loss, this can impact receipts from seven months after the end of the chargeable period. Companies have up to four years to submit their loss carry back claim. Change in 2017 H2 assessments compared with 2017 H1 assessments
Income (gross profit) from oil and gas extraction was £1,960 million in 2017H2, close to that of 2017H1, which was £1,989.
Other chargeable receipts – consisting of tariff income and revenues from asset disposals grew by 107% from £166 million in 2017 H1 to £344 million in 2017H2.
There was a 3% decrease (from £1,330 million to £1,292 million) in field expenditure claimed over the same period. Assessable profits (before oil allowance) increased by 23% between 2017 H2 and 2017 H2, from £743 million to £912 million.
After oil allowance, PRT assessable profits were £904 million, an increase of £167 million (23%) from the 2017 H1 amount of £737 million.
With effect from 1 January 2016, the PRT rate was reduced to 0% – therefore there are no PRT payments from this date.
Comparison with previous 12 months
Comparing the 12 months ending 31 December 2017 with the period ending 31 December 2016, gross profits grew by 14% to £3,949 million largely due higher oil and gas prices
Field expenditure in the 12 month period ending 31 December 2017 was £2,622 million, the same as the previous 12 months. Over the same period, oil allowance fell by around 76% to £13 million.
Assessable profits for PRT increased by £345 million (26%) to £1,655 million, mostly due to higher oil and gas prices.
After oil allowance, profits chargeable to PRT in the 12 months ending 2017 H2 were £1,641 million, an increase of £436 million (36%) compared to the previous 12 month period.
Changes to statistics in June 2018 release
Data for 2017 H2 has been added to Table 11.12 and data for 2011 H1 has been dropped.
From this date onwards, we are proposing that statistics in Table 11.12 are updated once a year, in June. Please see the consultation at the end of this document for more information.

12
Table 11.12 and supporting notes
Amounts: £ million
Six month chargeable period ending 31 Dec 30 Jun 31 Dec 30 Jun 31 Dec 30 Jun 31 Dec 30 Jun 31 Dec 30 Jun 31 Dec 30 Jun 31 Dec
2011 2012 2012 2013 2013 2014 2014 2015 2015 2016 2016 2017 2017
Gross profit 4,907 4,987 4,292 4,587 4,084 3,861 2,935 2,391 1,856 1,642 1,814 1,989 1,960
plus other chargeable 195 178 172 390 149 140 220 169 265 486 152 166 344
receipts
less royalties (2) 3 3 2 3 2 3 2 3 2 2 1 1 2
less field expenditure 2,465 2,364 2,592 2,637 2,690 2,609 2,506 1,867 1,744 1,302 1,320 1,330 1,292
claimed in period
less cross field reliefs 15 59 60 16 5 8 1 11 11 1 2 13 2
claimed in period (3)
less losses brought forward 87 66 45 315 151 149 140 63 11 84 43 68 95
less losses carried back 315 259 109 142 31 211 137 85 19 18 8 0 0
Assessable Profits 2,218 2,415 1,658 1,865 1,354 1,020 370 531 334 718 592 743 912
less cash equivalent of 331 364 149 230 181 97 92 58 73 44 10 6 7
oil allowance
Assessable profits 1,887 2,052 1,509 1,635 1,174 922 278 473 261 674 531 737 904
after oil allowance
Assessable PRT before safeguard 944 1,026 755 817 587 461 139 236 131 0 0 0 0
reduction due to
safeguard restriction 0 0 0 0 0 0 0 0 0 0 0 0 0
Petroleum revenue tax payable 944 1,026 755 817 587 461 139 236 131 0 0 0 0
Memorandum item:
Repayment of PRT from
carry back of losses made
in the period (4):
Principal 101 88 158 127 264 297 320 227 316 229 276 254 0
Interest 10 11 13 12 0 0 0 0 0 0 0 0 0
Updated June 2018

13
Footnotes 1. Fields given development approval after 16 March 1993, which are not liable to pay
Petroleum Revenue Tax, are excluded from this table. 2. Royalties were abolished from 1 January 2003. The continuing deductions in the
assessments relate to licence fees that companies still have to pay BEIS. 3. Consisting of exploration and appraisal relief, cross-field allowance, research relief and
relief for unrelieved abandoned field loss. 4. Due to early publication of assessment data for the latest half year period, no repayments
have yet been made as a result of losses carried back from this period. The repayments for this period will however be featured in the next publication.

14
Notes on the table (11.12) Petroleum Revenue Tax assessments 1. Table 11.12 summarises the assessments of accruals of PRT liabilities so far made for each
six month period, from the second half of 2011 to the second half of 2017. Estimated assessments, which may later be revised, are included. They may subsequently change following HMRC tax assessments and because tax relief for losses and decommissioning costs in subsequent years may be deducible against some profits that would otherwise be subject to PRT in these periods.
2. No PRT assessment on a field is made until production commences. At that stage, all
expenditure claimed by the companies during the preceding development is taken into account. In general, assessments may be delayed when there is no liability to tax; the table figures do not include allowance for such cases.
3. In the table, the deduction for expenditure is limited to the amounts in assessments
required to reduce the assessable profit to nil. Field expenditure (both capital and operating) in the period is distinguished from expenditure claimed under the cross-field reliefs (mainly exploration and appraisal relief). Losses brought forward from earlier periods are not subdivided; they are predominantly from field expenditure, as it is usually inefficient to claim cross-field reliefs before they are effective.
4. As stated above, losses in a period (which are sometimes augmented by use of cross-field
reliefs) may be carried back indefinitely to earlier periods to reduce liabilities, leading to tax repayments. In the main part of the table, these losses are attributed to the period to which they were carried back. A memorandum item gives for each period the PRT arising for repayment as a result of losses carried back from the period; it is split between repayments of principal and associated interest. There is thus no simple direct link of PRT paid in each financial year and the amounts shown as payable for each reporting period.
5. For all chargeable periods after December 2015, the rate of PRT is 0%.

15
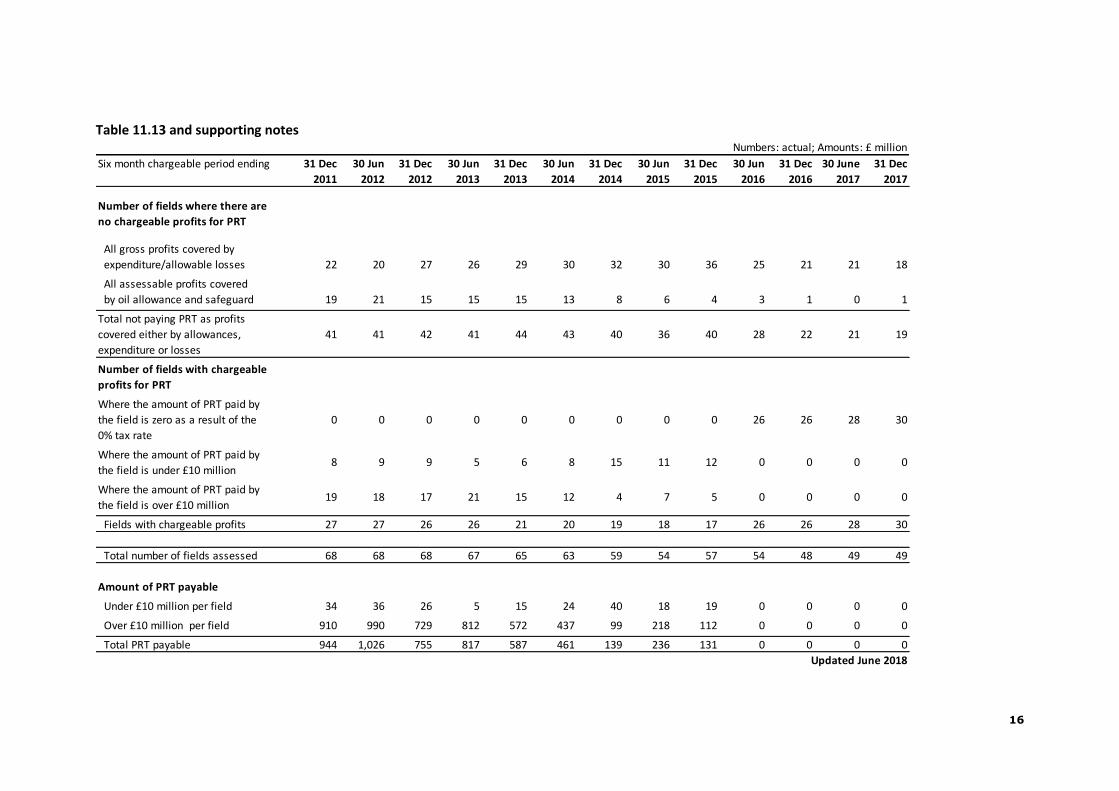
Table 11.13: Numbers of oil and gas fields with different Petroleum Revenue Tax liabilities Table information and assessment (updated June 2018)
The table shows the numbers of fields assessed for petroleum revenue tax with gross profits of over £1 million in a six month chargeable period. The table includes the numbers of fields whose profits are covered by expenditure and allowances and those paying Petroleum Revenue Tax (PRT) at different levels.
Number of fields charged to PRT in 2017 H2
Although there were 49 fields with gross PRT profits above £1 million, 19 of them (39%) did not pay PRT by virtue of having no chargeable profits after taking into account field expenditure, losses, reliefs and allowances.
The residual 61% of fields did not pay any PRT by virtue of the tax rate being 0%. Historical number of fields chargeable and paying PRT
PRT only applies to fields given development consent before March 1993 and the number of fields with gross profits and other chargeable receipts of over £1 million in the chargeable period assessed for PRT has been generally declining as fields have ceased production.
Changes to statistics in June 2018 release
Data for 2017 H2 has been added to Table 11.13 and data for 2011 H1 has been dropped
From this date onwards, we are proposing that statistics in Table 11.13 are updated once a year, in June. Please see the consultation at the end of this document for more information.
16
Table 11.13 and supporting notes
Numbers: actual; Amounts: £ million
Six month chargeable period ending 31 Dec 30 Jun 31 Dec 30 Jun 31 Dec 30 Jun 31 Dec 30 Jun 31 Dec 30 Jun 31 Dec 30 June 31 Dec
2011 2012 2012 2013 2013 2014 2014 2015 2015 2016 2016 2017 2017
Number of fields where there are
no chargeable profits for PRT
All gross profits covered by
expenditure/allowable losses 22 20 27 26 29 30 32 30 36 25 21 21 18
All assessable profits covered
by oil allowance and safeguard 19 21 15 15 15 13 8 6 4 3 1 0 1
Total not paying PRT as profits
covered either by allowances,
expenditure or losses
41 41 42 41 44 43 40 36 40 28 22 21 19
Number of fields with chargeable
profits for PRT
Where the amount of PRT paid by
the field is zero as a result of the
0% tax rate
0 0 0 0 0 0 0 0 0 26 26 28 30
Where the amount of PRT paid by
the field is under £10 million8 9 9 5 6 8 15 11 12 0 0 0 0
Where the amount of PRT paid by
the field is over £10 million19 18 17 21 15 12 4 7 5 0 0 0 0
Fields with chargeable profits 27 27 26 26 21 20 19 18 17 26 26 28 30
Total number of fields assessed 68 68 68 67 65 63 59 54 57 54 48 49 49
Amount of PRT payable
Under £10 million per field 34 36 26 5 15 24 40 18 19 0 0 0 0
Over £10 million per field 910 990 729 812 572 437 99 218 112 0 0 0 0
Total PRT payable 944 1,026 755 817 587 461 139 236 131 0 0 0 0
Updated June 2018
17
Notes on the table (11.13) Numbers of oil and gas fields with different Petroleum Revenue Tax liabilities
1. Table 11.13 shows accruals of PRT liabilities for the periods shown. They may subsequently change following HMRC tax assessments and because tax relief for losses and decommissioning costs in subsequent years may be deductible against some profits that would otherwise be subject to PRT in these periods. In this table, the amount of tax for each field is the sum of the amount shown on the assessments for all the companies with an interest in the field. For the more recent periods, the numbers of fields with particular levels of liabilities will be revised as further assessments are made.
2. For all chargeable periods after December 2015, the rate of PRT is 0%.

18
Section 3
Background Information
Methodology Table 11.11 is updated from the latest receipts data held on HMRC accounting records and these figures are agreed as a definitive measure of receipts for the HMRC Financial Statements and Accounts. For corporation tax, the initial payment of a large percentage of instalments into the HMRC group payment accounts are recorded as ring fence UK oil and gas receipts, but these figures can be revised when the group payments are distributed between liabilities for participating companies. We are now asking companies to provide details of the proportion of their payments relating to non-ring fence charges so our initial recording of receipts relating to exploration and production operations is more accurate, but there are still likely to be small adjustments when liabilities are finalised. The CT receipts are recorded using a link to the HMRC Corporation Tax system which holds all payment records. There is an ongoing reconciliation of PRT receipts with HMRC Finance department (as recommended by the National Audit Office) to ensure accuracy of recording.
Tables 11.12 and 11.13 data are downloaded from a system which records all PRT assessments raised by HMRC Large Business (LB) - Oil & Gas branch. This source is updated regularly by LB and includes the initial bulk issue assessments raised by LB in May and November and any subsequent amendments.
Statistical quality The National Audit Office (NAO) undertake a yearly audit of PRT and CT receipts to ensure accurate recording. Recording of PRT receipts by HMRC’s analytical directorate KAI is reconciled on a monthly basis with figures produced by HMRC’s Finance directorate, as recommended by NAO.
The PRT assessment data for tables 11.12 and 11.13 is provided by LB which are then checked against HMRC accounting systems by KAI.
There is a quality assurance process in place for the output of all tables as the prepared outputs are checked by managers and signed off by senior officials before they are released.
The statistics are consistent with publications released by the ONS, OGA and the OBR.
User engagement
We are committed to providing impartial quality statistics that meet our users’ needs. We encourage our users to engage with us so we can improve our official statistics and identify gaps in the statistics that we produce. If you would like to comment on these statistics or have any enquiries please use the statistical contacts provided in this document.

19
Consultation: Changes to the frequency of oil and gas official statistics We are seeking views on proposed changes to the frequency of HMRC’s official statistics of revenues from oil and gas production and analysis of PRT assessment data. This consultation will run from 9:30am on 29th June 2018 to 11:59 pm on 31st August 2018. In summary, the proposals are to:
Reduce the frequency of publishing Tables 11.12 and 11.13 from twice a year (January and June) to once a year in the summer.
Currently an update is made to the oil and gas statistics in June consisting of changes to Table 11.11 (revision to earlier years figures and the inclusion of an additional years data); and new data (relating to the most recent half year period) is added to Table 11.12 and 11.13 . The proposal is that an annual update to Table 11.12 and 11.13 will provide data for two half year periods in addition to the changes to Table 11.11. This would mean no longer publishing the analysis of PRT assessment every six months. There are no proposed changes to the level of granularity provided in Table 11.12 and 11.13 or showing this detail by chargeable period. Whilst it is proposed that the frequency of PRT liability statistics is reduced from bi-annual to annual, PRT receipts statistics will remain available monthly from the HMRC website.
To help us to identify users, level of usage and alternative options, please send your comments either by email or by post to:
KAI Direct Business Taxes HM Revenue & Customs 100 Parliament Street London SW1A 2BQ
Please include an indication of the impact level (including nil, minimal and high) that the changes might have. Please also include the purpose that the statistics are used for.
The outcome of the consultation will be published on HMRC’s oil and gas web page on or before the 31st October 2018.

20
Uses of the statistics
HMRC use these statistics to answer parliamentary questions and to inform policy decisions. Our users also use the statistics for media, research and forecasting purposes. Abbreviations ACT Advanced Corporation Tax BEIS Department for Business, Energy & Industrial Strategy CT Corporation Tax DECC Department of Energy and Climate Change HMRC HM Revenue & Customs KAI Knowledge Analysis and Intelligence (HMRC’s analysis directorate) LB Large Business (HMRC operational directorate) NAO National Audit Office OBR Office for Budget Responsibility OGA Oil and Gas Authority OGUK Oil & Gas UK (industry trade body) ONS Office for National Statistics PRT Petroleum Revenue Tax RFCT Ring Fence Corporation Tax SC Supplementary Charge UKCS UK Continental Shelf Glossary of terms Ring fence Term used for the boundaries within which the special tax regime for
oil and gas exploration and production activity in the UK and UK continental shelf applies.
Royalties Royalties were broadly levied at 12.5 % of the value of production,
less some specific costs, for fields approved before 1st April 1982. Royalties were deductible from gross profits in arriving at profits chargeable to CT and PRT. Royalties were abolished from 1st January 2003. The continuing deductions in the PRT assessments relate to licence fees that companies still have to pay to BEIS.
Cross field reliefs PRT is a field based tax and these reliefs and allowances can be passed
from one field to another in certain circumstances. Safeguard restriction Safeguard deduction is aimed at ensuring marginal fields remain
profitable. It does this by restricting the amount of PRT payable by a company for their share in a field in a chargeable period if the effect of the PRT would be to reduce after-tax profit below a minimum return on investment in the field. Safeguard is only available for a limited number of periods, so this is why the restriction has decreased to nil in recent years.

21
Cash equivalent of Oil allowance The oil allowance featured in table 11.12 is referred to in terms of
cash equivalent as the allowance itself is calculated in terms of a free slice of production (in million tonnes), so the deduction in the table is the cash value of that free slice of production.
Development Approval BEIS approve and issue licences for companies to operate fields in the
UK and UK continental shelf. More information about licences can be obtained from the licensing section of the BEIS website: Oil and gas - Licensing - GOV.UK
Advanced
Corporation Tax Component of Corporation Tax levied on dividend payments. ACT
was abolished in 1999. Decommissioning of UK oil and gas infrastructure
The Oil Taxation Act 1975 allows participators in an oil and gas field
liable to PRT to carry-back losses almost indefinitely against profits it
has previously made from the field, or which previous participators
in the field had made. This may result in the repayment of tax.
With respect to Offshore Corporation Tax (comprised of RFCT and
SC) the Corporation Tax Act 2010 allows for a company’s
decommissioning loss to be carried back against its own historical
profits dating back to April 2002. Again, this may result in a
repayment of tax.
Exchequer liabilities from decommissioning
The total industry costs between 2018-19 and 2062-63 for
decommissioning all UKCS oil and gas infrastructure is £64 billion2 as
measured in nominal prices and with discounting. The total
projected Exchequer cost of tax relief from this expenditure is £24
billion. This is comprised of tax repayments as well as a reduction in
Offshore Corporation Tax due as decommissioning costs reduces
company profits.
Useful links Oil and Gas Authority (GOV.UK) UK Statistics Authority (GOV.UK) Oil & Gas UK (industry trade body)
2 When measured in 2017 prices and without discounting, the OGA estimate the costs of UKCS decommissioning of £58.3 billion.