statistics in the supermarket: an intellectually nutritious activity alan reifman & zhen cong...
TRANSCRIPT

Statistics in the Supermarket: An Intellectually Nutritious Activity
Alan Reifman & Zhen Cong
Texas Tech University

Value of Students in Stat Classes Collecting Their Own Data
• Statistics educators have long advocated using real, as opposed to artificially created, datasets for teaching.
• Singer and Willett (1990)* articulate this position, but emphasize having students re-analyze existing data (e.g., from U.S. Census or previously published articles).
• Having students collect new data has advantage of giving them ownership of data collection and analyses.
• However, common forms of data collection (e.g., surveys) present challenges and sources of delay (e.g., finding respondents; seeking human-subjects approval under some circumstances).
*Singer, J.D., & Willett, J.B. (1990). Improving the teaching of applied statistics: Putting the data back Into data-analysis. American Statistician, 44, 223-230.

Motivation for Present Activity
• Students collect their own data, free from common logistical challenges.
• Activity contains a detective-like component,
requiring students’ use of statistical analyses to estimate answers to real-world questions.
• To begin the project, students are sent to the supermarket…

NuVal® Nutritional Rating System
• Displays single value from 1-100 to indicate a given food product’s nutritional value, with higher scores indicating healthier foods (http://www.nuval.com/).
• Some supermarkets, including one in our home city, display NuVal scores on shelves beside food products.
• NuVal website notes that the system “takes more than 30 different nutrients and nutrition factors into account,” which are submitted to a “complex algorithm.”
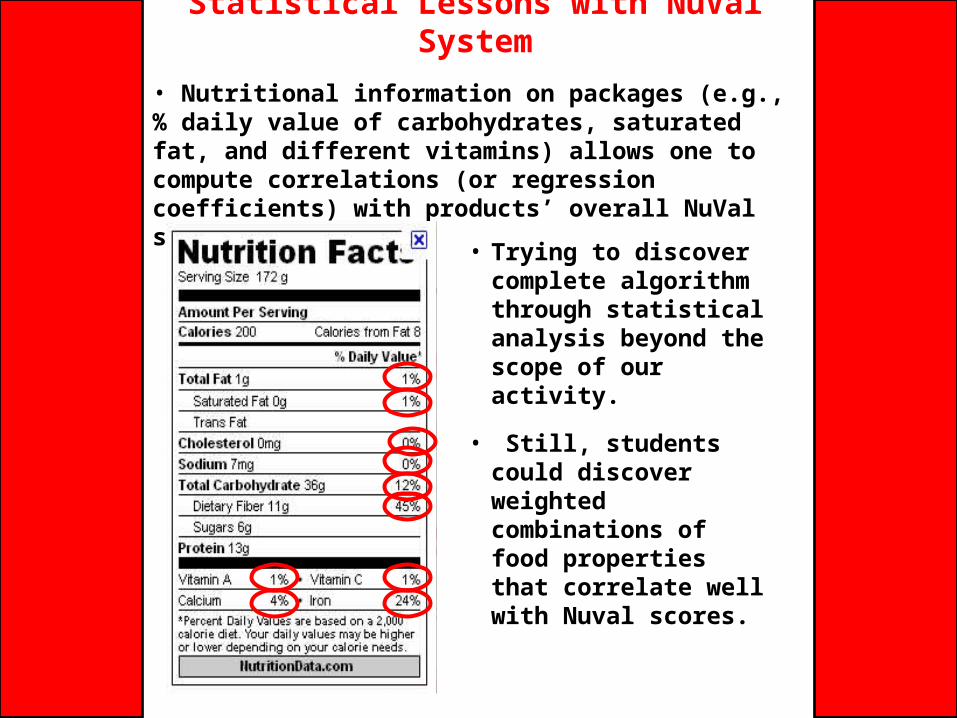
Statistical Lessons with NuVal System
• Nutritional information on packages (e.g., % daily value of carbohydrates, saturated fat, and different vitamins) allows one to compute correlations (or regression coefficients) with products’ overall NuVal scores.
• Trying to discover complete algorithm through statistical analysis beyond the scope of our activity.
• Still, students could discover weighted combinations of food properties that correlate well with Nuval scores.

The Activity
• Students in 2012 graduate multiple-regression course (taught by second author) assigned to estimate how 10 specific nutritional quantities (independent variables) contributed to overall NuVal score (dependent variable).
• Each student instructed to go to a NuVal-participating supermarket and record the nutritional information for randomly sampled products along a particular aisle (different for each student).
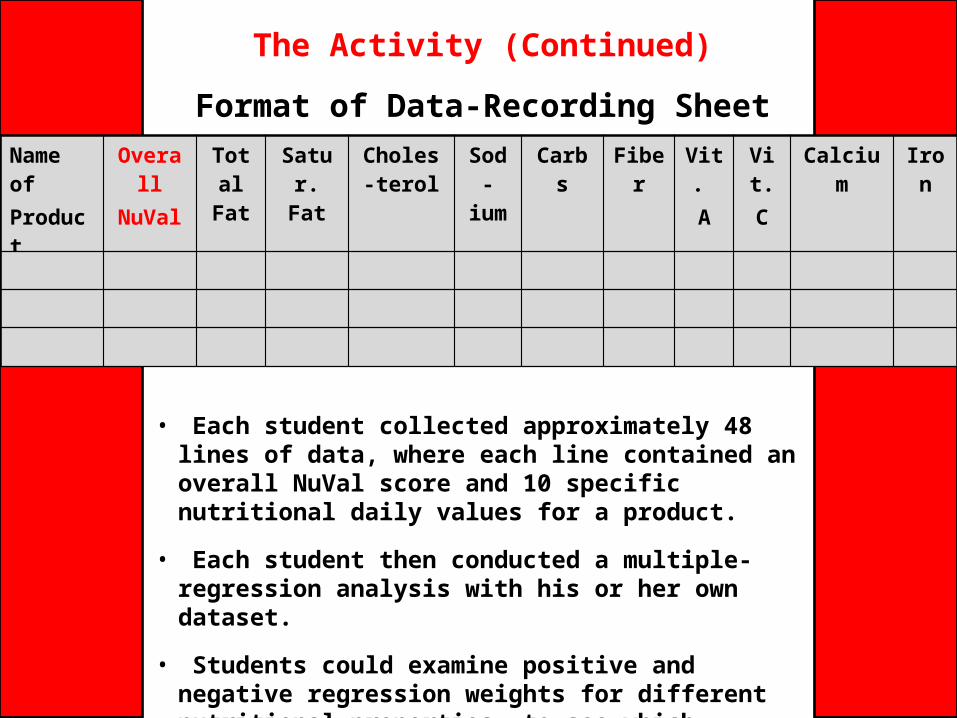
The Activity (Continued)
Format of Data-Recording Sheet
• Each student collected approximately 48 lines of data, where each line contained an overall NuVal score and 10 specific nutritional daily values for a product.
• Each student then conducted a multiple-regression analysis with his or her own dataset.
• Students could examine positive and negative regression weights for different nutritional properties, to see which properties were associated with increases or decreases in NuVal scores (and by how much).
Name of Product
OverallNuVal
Total Fat
Satur. Fat
Choles-terol
Sod-ium
Carbs Fiber Vit. A
Vit. C
Calcium Iron

Results & Recommendations
• Students successfully completed the data collection, analysis, and interpretation.
• Beyond the basic question of how the 10 nutritional components related to the overall NuVal score, the activity lends itself to discussion of further issues.
• The R2 for the 10-predictor equation was expected to fall well short of 1.00 (and indeed did) due to the fact that the NuVal score is based on 30 contributing factors (with possible nonlinear relations).
• The relation of a given nutritional property to overall NuVal score may be different within types of food (e.g., cookies/crackers; frozen vegetables) when the data are analyzed separately by food type.
• Though implemented with graduate students, the present activity would also be appropriate for advanced undergraduate students, in our view.

Any Questions or Comments?