statistics and simple plots. outline announcements: –homework ii: due wed. by 5, by e-mail cookie...
Post on 21-Dec-2015
214 views
TRANSCRIPT

Statistics and Simple Plots

Outline
• Announcements:– Homework II: due Wed. by 5, by e-mail
• Cookie Challenge• Statistics• Simple plots• Tutorial 4

Homework II
• myfft.m– Inputs:
• x, t (a signal)– Outputs:
• a, b, (Fourier coefficients)• f (Frequencies)
• FourierMat.m– Inputs:
• a, b, f (Fourier coefficients & frequencies)• t (a vector of times)
– Outputs:• x (signal at times in t)

Homework Policy
• You may discuss problems sets with others in the class
• BUT--write-up should be done alone

Cookie Challenge

Statistics
• Descriptive– summarize properties of data
• Comparative– compare data sets– test hypotheses

Descriptive Stats
• Most common descriptive stats are in “datafun” toolbox– mean, median, min/max, std– vectorized, operate on columns– Ex: x & y are column vectors with data
• m=mean([x,y])• m(1)=mean of x, m(2)=mean of y • Can force mean to work on rows:• m=mean([x,y],2);%mean along 2nd dimension
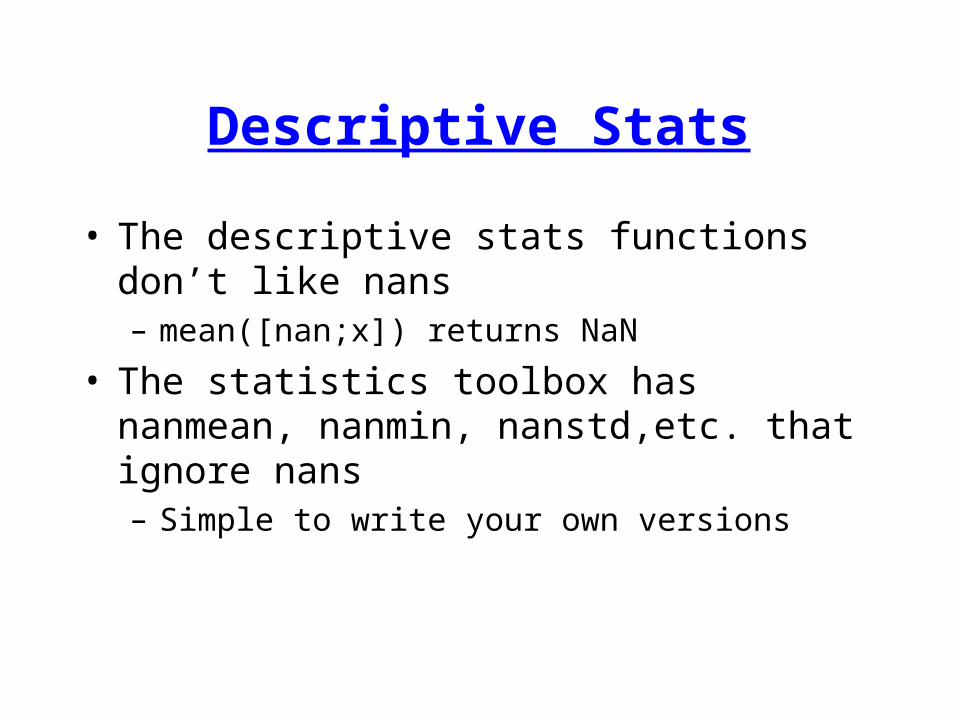
Descriptive Stats
• The descriptive stats functions don’t like nans– mean([nan;x]) returns NaN
• The statistics toolbox has nanmean, nanmin, nanstd,etc. that ignore nans– Simple to write your own versions

Basic Comparative Stats
• Curve fitting with polyfit– coefs=polyfit(x,y,n):%fits n-th order
polynomial to data• [x.^n, x.^n-1,…,x,1]*coefs ~ y
– Correlation coefficient (r) with corrcoef• r=corrcoef([x,y]);• r=[ r(x,x), r(x,y);
r(y,x), r(y,y)]• will also return probability

“Advanced” Comparative Stats
• Statistics toolbox has functions for– statistical distributions– parameter estimation– statistical tests
• A useful function:– regress--like polyfit, but get stats (p, R2)
• Fits any linear model (anything you can write as a matrix-vector product
• b=regress(y,X) finds b s.t.– X*b ~ y

Fitting Polynomials with \
• x,y are (column) vectors of observations– X=[x.^3 x.^2 x.^1 x.^0]; %matrix– If we know b:
• y=X*b;
– Instead, we know y:• b=X\y
– Matrix division--Matlab computes the inverse of the matrix
– \ is very smart--can deal with a variety of matrices in a very intelligent manner.

Summary of Matlab Stats
• Matlab has basic stats built-in• Can expand with the stats toolbox• Most statistical tests are easy to
program– Can program Matlab to deal with your data!– look for vector-products!
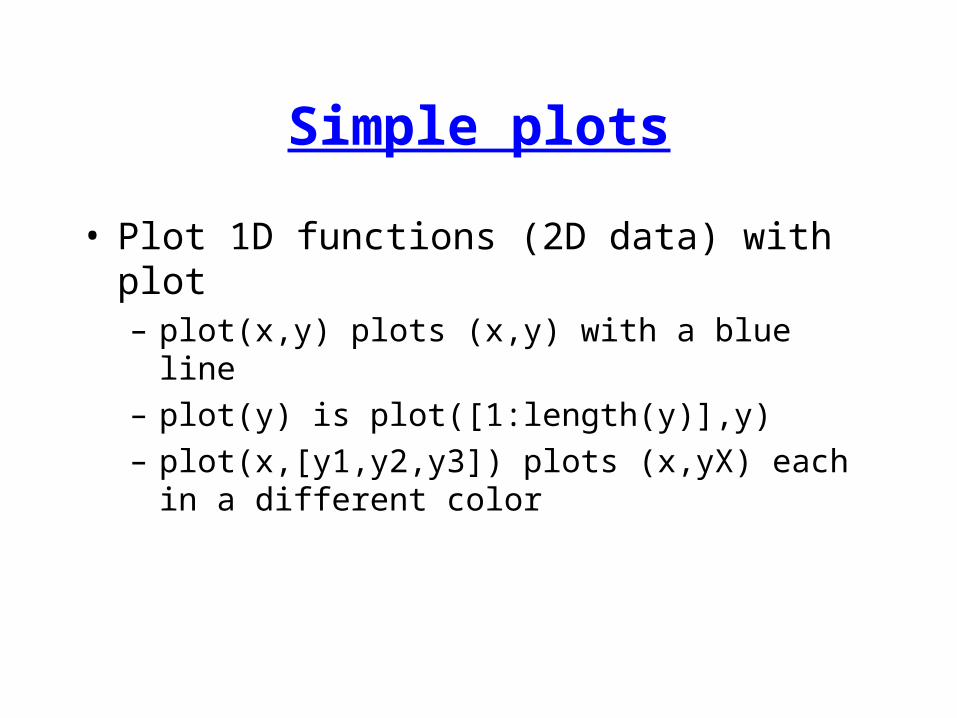
Simple plots
• Plot 1D functions (2D data) with plot– plot(x,y) plots (x,y) with a blue line– plot(y) is plot([1:length(y)],y)– plot(x,[y1,y2,y3]) plots (x,yX) each in a
different color

Customizing plot
• plot(x,y,’r’) is a red line• plot(x,y,’o’) plots circles rather than
lines• plot(x,y,’yp’) plots yellow pentagrams• Type help plot to get more options

Specialized 1D graphics
• bar--bar chart• pie--pie chart• polar--polar coordintes• semilogy, semilogx, loglog--plotting with
log-scales

2D basics
• Assume data Z is on a regular grid defined by X and Y
• pcolor, imagesc, contour plot in 2D• surf, mesh plot in 3D (perspective)

• 2D graphics use colors to represent data
• Color of z is defined by a colormap and caxis
• several built-in colormaps--help graph3d• Used in Lecture 01
2D basics

Generic graphics functions
• xlabel, ylabel, title label your plots• hold on--allows multiple plots on same
axes• clf clears the figure window• axis([xmin,xmax,ymin,ymax]) controls
axis limits

Multiple plots
• subplot(m,n,j) creates the jth plot in an m-by-n matrix of plots
1 2 3 4
1 1 2 3 4
2 5 6 7 8
3 (row-1)*n+col 10 11 12
n=col
m=row

Axes & Figures
• Matlab plots into figures– figure(n) makes n the current figure or
creates a figure numbered n
• Figures contain axes– If no axes exist in current figure, then any
graphics call will create one– Can explicitly create with subplot or axes

Printing figures
• print will send gcf to printer (or use GUI)• print -depsc fname.eps will save
graphics in EPS format• print -djpeg fname.jpg will save into JPG
format
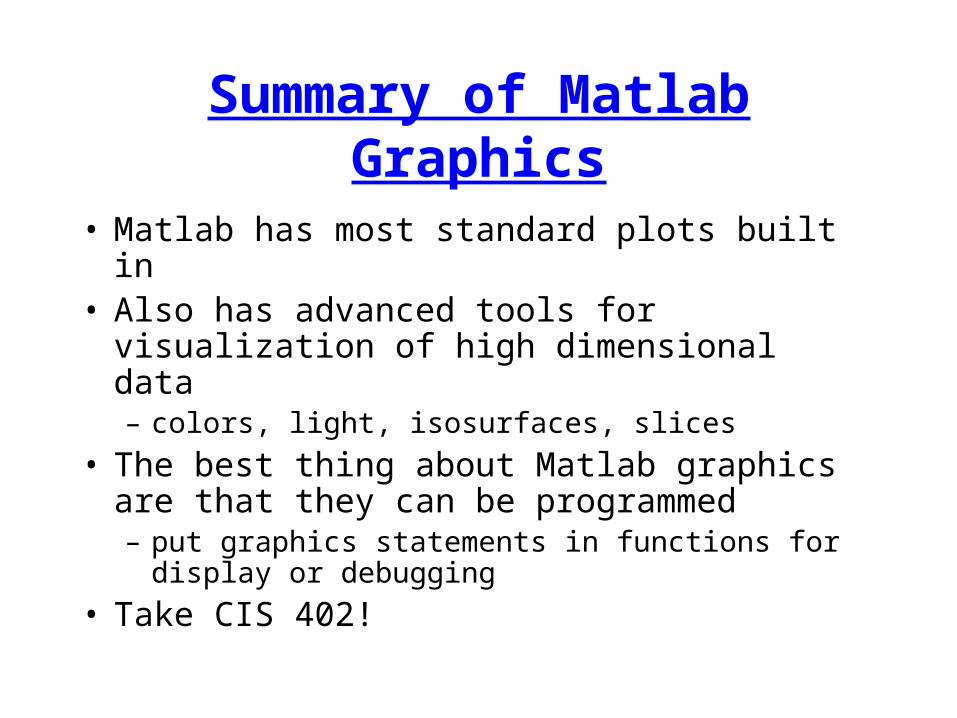
Summary of Matlab Graphics
• Matlab has most standard plots built in• Also has advanced tools for visualization
of high dimensional data– colors, light, isosurfaces, slices
• The best thing about Matlab graphics are that they can be programmed– put graphics statements in functions for
display or debugging
• Take CIS 402!

Tutorial 4: Temp. on NW Atlantic Shelf
• Data consist of yearly mean temperatures between 150-250m depth from 4 locations on NW Atlantic Shelf:
• Are the temp’s independent?• Practice working with data, simple stats and graphics
Emerald Basin
Georges Basin
JordanBasinWilkinson
Basin