statistical report on women and men in nigeria
TRANSCRIPT

i
2017
STATISTICAL REPORT ON WOMEN AND MEN IN NIGERIA
NATIONAL BUREAU OF STATISTICS
February 2018
ii
TABLE OF CONTENTS
TABLE OF CONTENTS .................................................................................................................. ii
PREFACE ........................................................................................................................................ vi
EXECUTIVE SUMMARY ............................................................................................................ viii
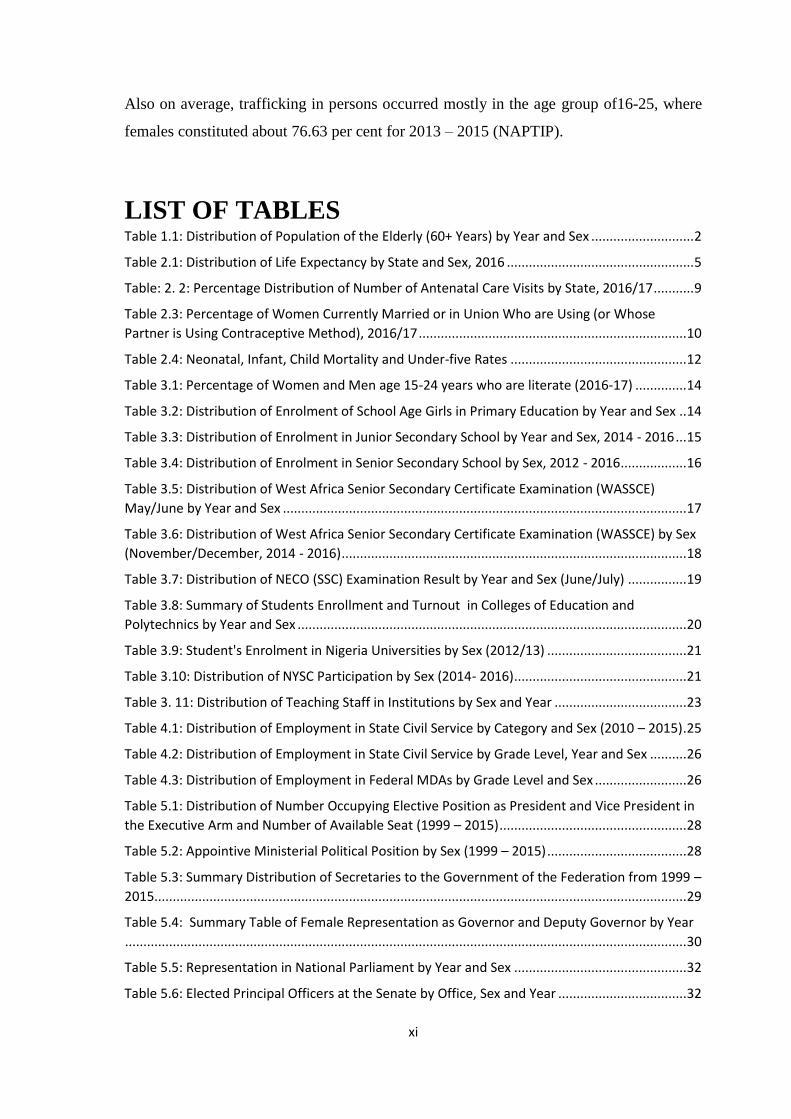
LIST OF TABLES ........................................................................................................................... xi
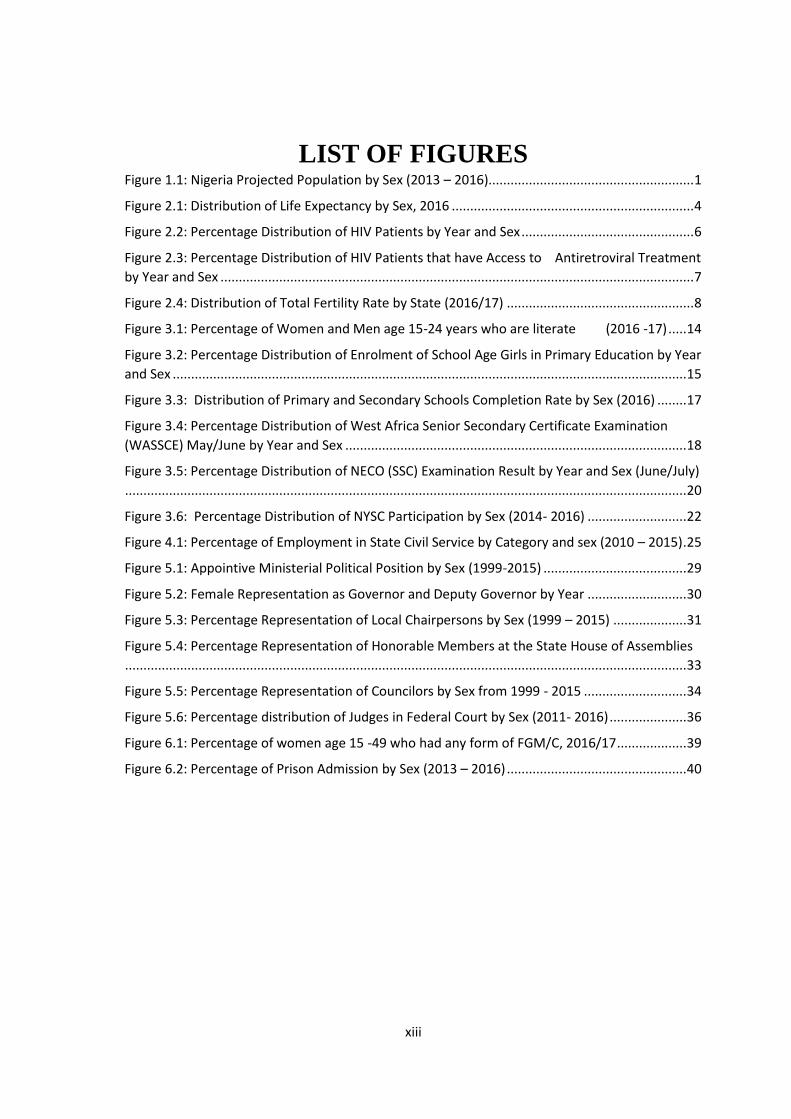
LIST OF FIGURES ....................................................................................................................... xiii
LIST OF ACRONYMS.................................................................................................................. xiv
CHAPTER 1: POPULATION .......................................................................................................... 1
Key Findings ................................................................................................................................. 1
Introduction ................................................................................................................................... 1
A. General Population Patterns .................................................................................................... 1
1. Population and Growth Rate ................................................................................................. 1
2. Distribution of Population of the Elderly (60+ Years) by Year and Sex .............................. 2
CHAPTER 2: HEALTH ................................................................................................................... 3
Key Findings ................................................................................................................................. 3
Introduction ................................................................................................................................... 3
A. Life Expectancy at Birth .......................................................................................................... 4
B. HIV and AIDS .......................................................................................................................... 5
1. Percentage Distribution of HIV Patients by Year and Sex ................................................... 5
2. Percentage Distribution of HIV Patients that have Access to Antiretroviral Treatment by
Year and Sex ............................................................................................................................. 6
C. Reproductive Health ................................................................................................................. 7
1. Total Fertility Rate ................................................................................................................ 7
2. Antenatal Care ....................................................................................................................... 8
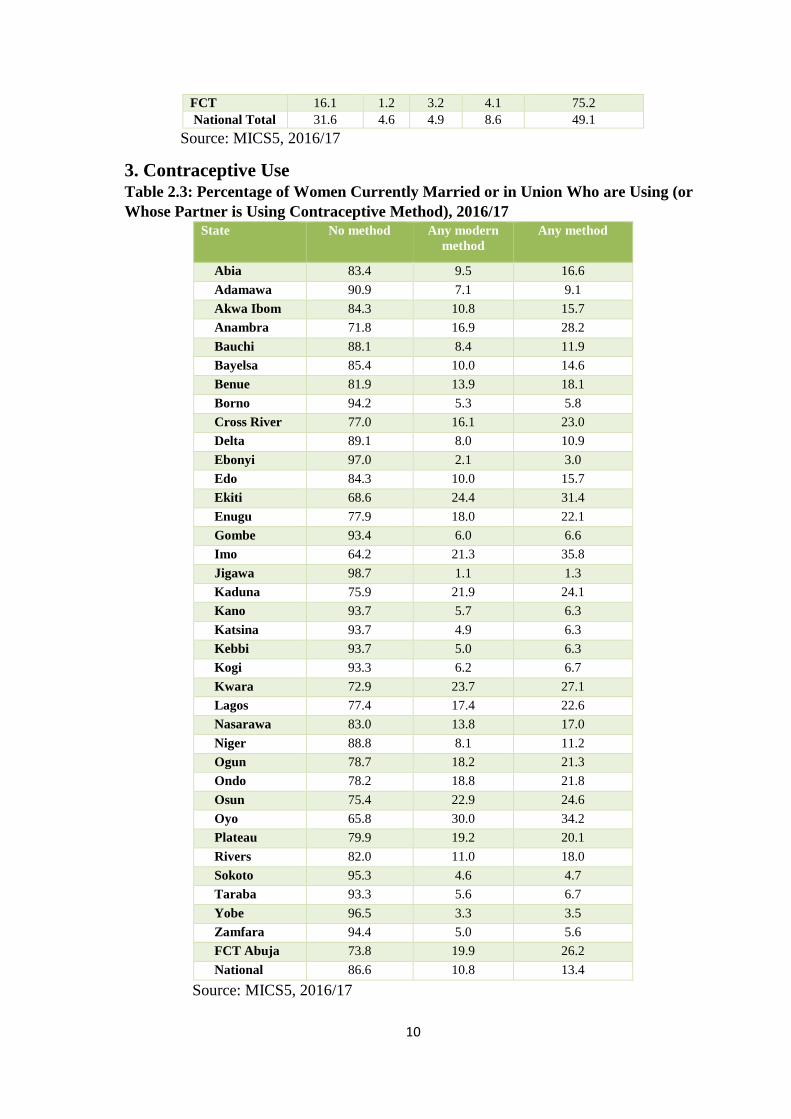
3. Contraceptive Use ............................................................................................................... 10
D. Early childhood Mortality Rate .............................................................................................. 11
1. Neonatal Mortality Rate ...................................................................................................... 11
2. Infant and Under 5 Mortality .............................................................................................. 11
3. Child Mortality Rate ........................................................................................................... 11
CHAPTER 3: EDUCATION .......................................................................................................... 13
Key Findings ............................................................................................................................... 13
Introduction ................................................................................................................................. 13
A. Educational Outcomes ............................................................................................................ 13
1. Literacy ............................................................................................................................... 13

iii
B. Participation in Education ...................................................................................................... 14
1. Enrolment in Primary Education ......................................................................................... 14
2. Secondary Education ........................................................................................................... 15
2.1: Percentage Distribution of Enrolment in Junior Secondary School by Sex, 2012 - 2016 15
2.2: Percentage Distribution of Enrolment in Senior Secondary School by Sex, 2012 - 2016
................................................................................................................................................. 16
2.3. Completion Rate ............................................................................................................... 16
2.4: Distribution of West Africa Senior Secondary Certificate Examination (WASSCE) by
Year and Sex ........................................................................................................................... 17
2.5: Distribution of West Africa Senior Secondary Certificate Examination (WASSCE) by
Sex (November/December, 2014 - 2017) ............................................................................... 18
2.6: Distribution of NECO (SSC) Examination by Year and Sex (June/July) ........................ 19
3. Tertiary Education ............................................................................................................... 20
3.1 Enrollment and Turnout in Tertiary Education ............................................................... 20
3.2: Student’s Enrolment in Nigeria Universities (2012/13) ................................................... 21
4. Educational attainment ........................................................................................................ 21
C. Teaching Staff ........................................................................................................................ 22
1. Percentage of Teaching Staff in Institutions by Sex (2013/14 – 2015/16).......................... 22
CHAPTER 4: WORK ..................................................................................................................... 24
Key Findings ............................................................................................................................... 24
A. Women and Men in State and Federal Civil Service ............................................................. 24
1. Employment in State Civil Service by Category................................................................. 24
2: Distribution of Employment in State Civil Service by Grade Level, Year and Sex ........... 26
3. Employment in Federal MDAs by Grade Level and Sex (2014 – 2016) ............................ 26
CHAPTER 5: POWER AND DECISION MAKING ..................................................................... 27
Key Findings ............................................................................................................................... 27
Introduction ............................................................................................................................. 27
A. Politics and Governance ......................................................................................................... 27
1. Executives ............................................................................................................................... 28
1a. Representation in the Executive Arm of Government ....................................................... 28
1b. Appointive Ministerial Political Position .......................................................................... 28
1c. Secretary to the Government of the Federation ................................................................. 29
1d. Representation at State Executives ................................................................................... 29
1e. Representation at the Local Government Executive ......................................................... 30
2. Legislator ................................................................................................................................ 31
2a. Representation in the National Parliament ........................................................................ 31
2b. Representation in State Houses of Assembly .................................................................... 33

iv
2c. Representation of Principal Officers in State Assemblies by Positions, Year and Sex ..... 33
2d. Representation as Councilors at the Local Government ................................................... 34
3. Judiciary .................................................................................................................................. 35
3a. Representation of Judges at Federal Courts ...................................................................... 35
3b. National Judicial Officers by Position, Sex and Year ....................................................... 36
B. Civil and Public Service ......................................................................................................... 36
1. Top Government Officials and Senior Administrators ..................................................... 37
CHAPTER 6: VIOLENCE AGAINST WOMEN/CRIME ............................................................. 38
Key Findings ............................................................................................................................... 38
A. Prevalence and Incidence of Violence Against Women ........................................................ 39
1. Female Genital Mutilation/Cutting (FGM/C) ..................................................................... 39
B. Prison Inmates/Offenders ....................................................................................................... 39
1. Number of Prison Inmates by Sex (2012 – 2016) ............................................................... 39
2. Prison Admission by Type of Offences (2013 – 2016) ...................................................... 40
C. Trafficking in Persons .......................................................................................................... 42
1. Number of Trafficked Persons by Age Group, Year and Sex ............................................. 42
2. Number of Identified Victims of Trafficking for Prostitution by Age, Sex and Year ........ 42
3. Number of Identified Victims of Trafficking for Forced Labour by Age, Sex and Year ... 43
STATISTICAL ANNEXES ............................................................................................................ 44
STATISTICAL TABLES ............................................................................................................... 44
ST 1.1: Nigeria Projected Population by Special Age Group Year and sex, 2013 – 2016 ............. 44
ST 2.1: Distribution of HIV Patients by State, Year and Sex (2013-2016) .................................... 46
ST 2.2: Distribution of HIV Patients that have Access to Antiretroviral Treatment by State, Year
and Sex (2013 - 2016) ..................................................................................................................... 48
ST 2.3: Distribution of Total Fertility Rate by State 2016/17 ......................................................... 50
ST 3.1: Percentage of Women and Men age 15-24 years who are literate by State and Sex,
2016/17 ............................................................................................................................................ 51
ST 3.2: Percentage Distribution of Enrolment in Primary Schools by State, Year and Sex, 2014 -
2016 ................................................................................................................................................. 52
ST 3.3: Percentage Distribution of Enrolment in Junior Secondary School by State, Year and sex,
2014 -2016 ...................................................................................................................................... 53
ST 3.4: Percentage Distribution of Enrolment in Senior Secondary School by State, Year and Sex,
2014 -2016 ...................................................................................................................................... 54
ST 3.5a: Distribution of NECO (SSC) Examination Result by State, Subject, Year and Sex
(June/July), 2012 ............................................................................................................................. 55
ST 3.5b: Distribution of NECO (SSC) Examination Result by State, Subject Year and Sex
(June/July), 2013 ............................................................................................................................. 56
v
ST 3.5c: Distribution of NECO (SSC) Examination Result by State, Subject, Year and Sex,
(June/July), 2014 ............................................................................................................................. 57
ST 3.5d: Distribution of NECO (SSC) Examination Result by State, Subject, Year and Sex,
(June/July), 2015 ............................................................................................................................. 58
ST 3.5e: Distribution of NECO (SSC) Examination Result by State, Subject, Year and Sex,
(June/July), 2016 ............................................................................................................................. 59
ST 3.6a: Distribution of NECO (SSC) Examination Result by State, Subject, Year and Sex,
(Nov/Dec.), 2012 ............................................................................................................................. 60
ST 3.6b: Distribution of NECO (SSC) Examination Result by State, Subject, Year and Sex,
(Nov/Dec.), 2013 ............................................................................................................................. 61
ST 3.6c: Distribution of NECO (SSC) Examination Result by State, Subject, Year and Sex,
(Nov/Dec.), 2014 ............................................................................................................................. 62
ST 3.6d: Distribution of NECO (SSC) Examination Result by State, Subject, Year and Sex,
(Nov/Dec.), 2015 ............................................................................................................................. 63
ST 3.6e: Distribution of NECO (SSC) Examination Result by State, Subject, Year and Sex,
(Nov/Dec.), 2016 ............................................................................................................................. 64
ST 3.7 Students Enrolment in Polytechnics by Institution and Sex, (2013/2014) and (2014/2015)
......................................................................................................................................................... 65
ST 3.8: Distribution of NYSC Participation by State, Year and Sex (2014- 2016) ....................... 67
ST 4.1: Employment in State Civil Service by State, Category, Year and Sex .............................. 68
ST 4.2a: Distribution of Employment in State Civil Service by Grade Level, Year and Sex (2014)
......................................................................................................................................................... 70
ST 4.2b: Distribution of Employment in State Civil Service by Grade Level, Year and Sex (2015)
......................................................................................................................................................... 71
ST 4.2c: Distribution of Employment in State Civil Service by Grade Level, Year and Sex (2016)
......................................................................................................................................................... 72
ST 4.3a: Distribution of Employment in Federal MDAs by Grade Level and Sex (2014) ............. 73
ST 4.3b: Distribution of Employment in Federal MDAs by Grade Level and Sex (2015) ............. 74
ST 4.4c: Distribution of Employment in Federal MDAs by Grade Level and Sex (2016) ............. 75
ST 5.1: Distribution of Women and Men Occupying Position of Governor and Deputy Governor
by State (1999 – 2015) .................................................................................................................... 76
ST 5.2: Distribution of Women and Men Occupying Position at the Local Government Level by
State (1999 – 2015) ......................................................................................................................... 77
ST 5.3: Distribution of State Legislator by Year and Sex (1999 – 2015) ....................................... 78
ST 5.4: Representation of Principal Officers in State House of Assembly by Type of Office and
Sex (1999 – 2015) ........................................................................................................................... 79
References ....................................................................................................................................... 82
vi
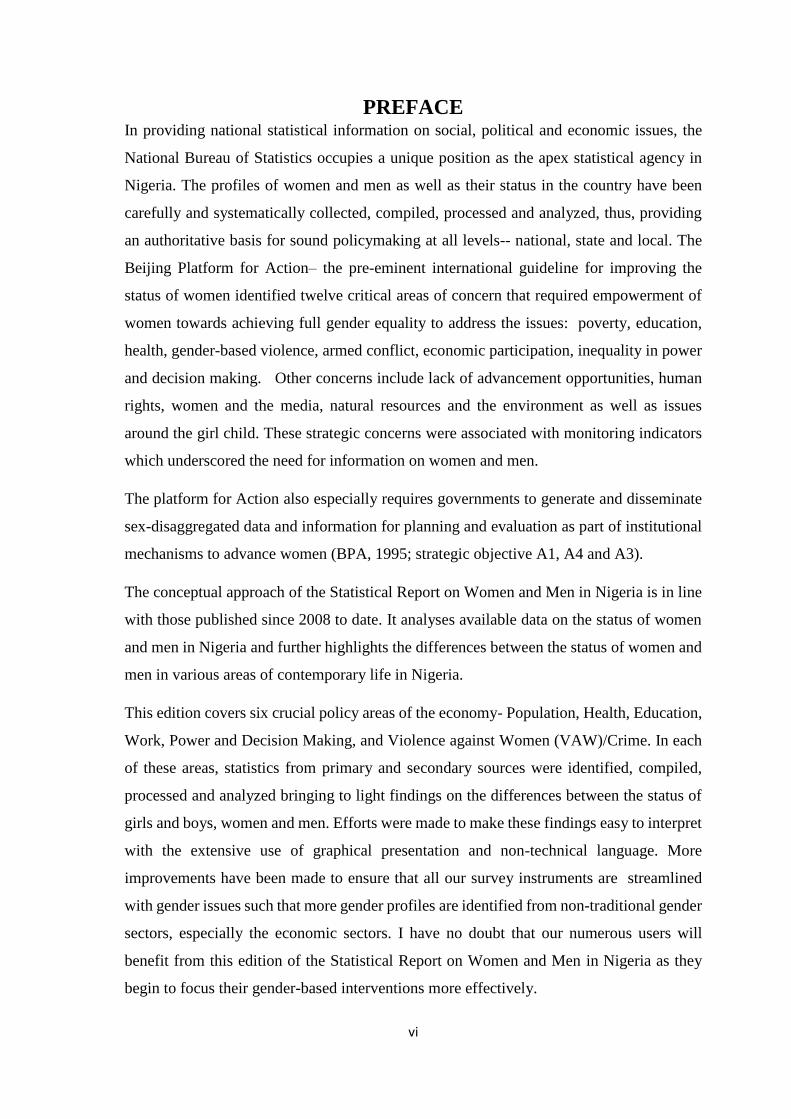
PREFACE In providing national statistical information on social, political and economic issues, the
National Bureau of Statistics occupies a unique position as the apex statistical agency in
Nigeria. The profiles of women and men as well as their status in the country have been
carefully and systematically collected, compiled, processed and analyzed, thus, providing
an authoritative basis for sound policymaking at all levels-- national, state and local. The
Beijing Platform for Action– the pre-eminent international guideline for improving the
status of women identified twelve critical areas of concern that required empowerment of
women towards achieving full gender equality to address the issues: poverty, education,
health, gender-based violence, armed conflict, economic participation, inequality in power
and decision making. Other concerns include lack of advancement opportunities, human
rights, women and the media, natural resources and the environment as well as issues
around the girl child. These strategic concerns were associated with monitoring indicators
which underscored the need for information on women and men.
The platform for Action also especially requires governments to generate and disseminate
sex-disaggregated data and information for planning and evaluation as part of institutional
mechanisms to advance women (BPA, 1995; strategic objective A1, A4 and A3).
The conceptual approach of the Statistical Report on Women and Men in Nigeria is in line
with those published since 2008 to date. It analyses available data on the status of women
and men in Nigeria and further highlights the differences between the status of women and
men in various areas of contemporary life in Nigeria.
This edition covers six crucial policy areas of the economy- Population, Health, Education,
Work, Power and Decision Making, and Violence against Women (VAW)/Crime. In each
of these areas, statistics from primary and secondary sources were identified, compiled,
processed and analyzed bringing to light findings on the differences between the status of
girls and boys, women and men. Efforts were made to make these findings easy to interpret
with the extensive use of graphical presentation and non-technical language. More
improvements have been made to ensure that all our survey instruments are streamlined
with gender issues such that more gender profiles are identified from non-traditional gender
sectors, especially the economic sectors. I have no doubt that our numerous users will
benefit from this edition of the Statistical Report on Women and Men in Nigeria as they
begin to focus their gender-based interventions more effectively.
vii
It is my earnest hope that the present publication will be used by policymakers,
implementers from government agencies, civil societies, and development partners to
advance an enabling social, political and economic environment that will ensure equal
treatment of all women and men and significantly improve the status of women in the
country.
Dr. Yemi Kale
Statistician-General of the Federation/Chief Executive Officer
National Bureau of Statistics

viii
EXECUTIVE SUMMARY Introduction
In the Beijing Declaration adopted at the Fourth World Conference in 1995 on Women, the
participating government expressed their commitments “to advance the goals of equality,
development and peace for all women everywhere in the interest of humanity”. In order to
assess the success of these goals, the Statistical Report of Women and Men is being
produced annually by the National Bureau of Statistics (NBS) as required by the Beijing
Platform for Action.
The 2016 edition of the Statistical Report on Women and Men in Nigeria takes a cursory
look at the status of women and men in the country over time. Analysis on this publication
are based on statistics from selected Federal and State MDAs which covers six focal policy
areas of the economy: Population, Health, Education, Works, Power and Decision Making,
and Violence against Women/Crime (VAW).
Concepts and Methods
Data was sourced from selected State and Federal MDAs including but not limited to
Ministry of Health, Federal Ministry of Education, National Examination Council (NECO),
National Board for Technical Education (NBTE) and Nigeria Prison Service, as well as
published sources e.g. MICS5 (2016/17), 1999 – 2015 Collation of data on Women and
Men in Governance and in Politics (NCWD/NBS) and 2016 Digest of Education Statistics
in Nigeria (FME). For some indicators, statistics are provided on a state basis. In analyzing
gender differences, Excel spreadsheet programme was used to derive basic inferential
statistics and graphics. The summary of key indicators is given below on each thematic
area.
Population
Nigeria is the most populous country in Africa and ranks the 7th in the world1. In 2016,
Nigeria population was estimated to be 193 million people compared to about 187 million
in 2015 (NpopC). Women and men constituted 49.2 per cent and 50.8 per cent of this
population respectively. Population growth rate is estimated to be 3.2 per cent, while the
sex ratio remained 102 men per 100 women. In 2016, the population of the elderly (60+

ix
years) was 9,622,057 among which male and female accounted for 5,367,714 and 4,254,343
respectively.
Health
Life expectancy is an important health indicator that is derived from the age-specific
mortality rates, and it provides a picture of the overall health status of a population, allowing
for the investigation of the longevity of women and men separately. In 2016, Life
expectancy for a male was 47 years, 51 years for female and 49 years for both (NBS, HDI
Survey, 2016). The percentage of women living with HIV was increasing slowly from 51.7
per cent in 2013 to 53.1 per cent in 2016, but that of men was decreasing slowly from 48.3
per cent in 2013 to 46.9 per cent in 2016 (NACA). Woman with access to Antiretroviral
Treatment increased from 66.6 per cent in 2013 to 69.7 per cent in 2014, and the percentage
was 69.2 and 69 per cent for 2015 and 2016 respectively. In 2013 about 33.4 per cent male
HIV patients had access to Antiretroviral Treatment, while it was 30.3, 30.8 and 31 per cent
in 2014, 2015 and 2016 respectively (FMH). In 2016/17, the total fertility rate was 5.8
births per woman (MICS5). About 49.1 per cent pregnant women had 4 or more antenatal
care visits in 2016/17 in Nigeria. According to the MICS5 Survey report, 2016/17, the use
of any contraceptive method for pregnancy was 13.4 per cent in 2016, in which only 10.8
per cent are using modern methods, while about 86.6 per cent are not using any method.
Child mortality rate was 54 per 1,000 live births as recorded in the MICS5 Report.
Education
Literacy rate among young women and men age 15-24 years in 2017 was 59.3 per cent and
70.9 per cent respectively (MICS5, 2016/17). The national literacy rate was 65.1 per cent.
Available data from the Federal Ministry of Education shows that enrollment rate of school-
aged girls in primary education was 48.6 per cent in 2014 but it decreased to 47.3 in 2015
and slightly bounced back to 47.5 in 2016. Also, the completion rate for girls in primary,
junior and senior secondary school in 2016 was 64.8 per cent, 38.9 per cent and 28.7 per
cent respectively, showing a decreased completion rate as the student progresses.
The findings also revealed that female enrollment was higher in private tertiary institutions
(46.26 per cent) than in public tertiary institutions, and the percentage was 35.94 per cent
in Federal University while it was 41.40 per cent in State University. Female teachers in

x
both polytechnics and colleges was only between 20.6 per cent to 27.88 per cent for
2013/2014 and 2014/ 2015 sessions.
Work
The percentage of men employed in the State Civil Service for 2010 to 2015 was higher
than that of women for both senior and junior positions. On average the percentage of
women employees from 2010 to 2015 was 38.16 per cent for both junior and senior
positions while it was 68.84 per cent men for both of the subgroups.
Also, in federal MDAs, men dominated the civil service, as women on grade level 01 – 17
plus the special grade level was below 42 per cent in 2014 – 2016.
Power and Decision Making
Despite all effort to promote the contribution of women in the domain of politics and
decision making in other fields to better the effort of male counterparts, women have
continued to record low representation at all tiers and levels of government, although, they
constitute almost half of the electorate Finding reveals that male constitute 94.71 per cent
and female 5.76 per cent at the National Parliament from 1999 to 2015 (National
Assembly). At federal coutrs, 29.38% of judgets were female while 70.62 percent were
male according to 2011 – 2016 National Judicial Council. State Assemblies also has 5.29
per cent female and 94.71 per cent male from 1999 - 2015 (State House of Assembly). In
1999 – 2015 at local government level, female chairpersons had 9 per cent and male 91 per
cent. Councilors also constituted 5.9 per cent female as against 94.1 per cent male.
Violence Against Women/Crime
Women of the 45-49 age group had the highest percentages of FGM/C compared to other
age groups, while womrn of 15-19 age group had the lowest (12.3 per cent), MICS5,
2016/17. The available data from the Nigerian Prisons Service (NPS) indicated that about
2 per cent female were prisoners/inmates between2012 – 2016. On average, Prison
admission for stealing was about 95 per cent male and about 5 per cent female from 2013 -
2016. Percentage of female admitted into prison because of trafficking was 14.58 and 14.46
per cent for 2015 and 2016 compared to 2013 which was 4.50 per cent and 2.86 per cent in
2014 (NPS).
xi
Also on average, trafficking in persons occurred mostly in the age group of16-25, where
females constituted about 76.63 per cent for 2013 – 2015 (NAPTIP).
LIST OF TABLES Table 1.1: Distribution of Population of the Elderly (60+ Years) by Year and Sex ............................ 2
Table 2.1: Distribution of Life Expectancy by State and Sex, 2016 ................................................... 5
Table: 2. 2: Percentage Distribution of Number of Antenatal Care Visits by State, 2016/17 ........... 9
Table 2.3: Percentage of Women Currently Married or in Union Who are Using (or Whose
Partner is Using Contraceptive Method), 2016/17 ......................................................................... 10
Table 2.4: Neonatal, Infant, Child Mortality and Under-five Rates ................................................ 12
Table 3.1: Percentage of Women and Men age 15-24 years who are literate (2016-17) .............. 14
Table 3.2: Distribution of Enrolment of School Age Girls in Primary Education by Year and Sex .. 14
Table 3.3: Distribution of Enrolment in Junior Secondary School by Year and Sex, 2014 - 2016 ... 15
Table 3.4: Distribution of Enrolment in Senior Secondary School by Sex, 2012 - 2016 .................. 16
Table 3.5: Distribution of West Africa Senior Secondary Certificate Examination (WASSCE)
May/June by Year and Sex .............................................................................................................. 17
Table 3.6: Distribution of West Africa Senior Secondary Certificate Examination (WASSCE) by Sex
(November/December, 2014 - 2016) .............................................................................................. 18
Table 3.7: Distribution of NECO (SSC) Examination Result by Year and Sex (June/July) ................ 19
Table 3.8: Summary of Students Enrollment and Turnout in Colleges of Education and
Polytechnics by Year and Sex .......................................................................................................... 20
Table 3.9: Student's Enrolment in Nigeria Universities by Sex (2012/13) ...................................... 21
Table 3.10: Distribution of NYSC Participation by Sex (2014- 2016) ............................................... 21
Table 3. 11: Distribution of Teaching Staff in Institutions by Sex and Year .................................... 23
Table 4.1: Distribution of Employment in State Civil Service by Category and Sex (2010 – 2015) . 25
Table 4.2: Distribution of Employment in State Civil Service by Grade Level, Year and Sex .......... 26
Table 4.3: Distribution of Employment in Federal MDAs by Grade Level and Sex ......................... 26
Table 5.1: Distribution of Number Occupying Elective Position as President and Vice President in
the Executive Arm and Number of Available Seat (1999 – 2015) ................................................... 28
Table 5.2: Appointive Ministerial Political Position by Sex (1999 – 2015) ...................................... 28
Table 5.3: Summary Distribution of Secretaries to the Government of the Federation from 1999 –
2015................................................................................................................................................. 29
Table 5.4: Summary Table of Female Representation as Governor and Deputy Governor by Year
......................................................................................................................................................... 30
Table 5.5: Representation in National Parliament by Year and Sex ............................................... 32
Table 5.6: Elected Principal Officers at the Senate by Office, Sex and Year ................................... 32

xii
Table 5.7: Representation at State Assemblies by Sex from 1999-2015 ....................................... 33
Table 5.8: Representation of Principal Officers in State Assemblies by Positions, Year and Sex ... 34
Table 5.9: Number of Judges in Federal Court by Court, Year and Sex .......................................... 35
Table 5.10: Number of National Judicial Officers by Position, Sex and Year .................................. 36
Table 5.11: Top Government Officials and Senior Administrator, 1999-2015................................ 37
Table 6.1: Number of Prison Inmates by Year and Sex ................................................................... 40
Table 6.2: Distribution of Prison Admission by Type of Offences and Sex (2013 – 2016) .............. 41
Table 6.3: Number of Trafficked Persons by Age Group, Year and Sex .......................................... 42
Table 6.4: Number of Identified Victims of Trafficking for Prostitution by Age, Year and Sex ....... 43
Table 6.5: Number of Identified Victims of Trafficking for Forced Labour by Age, Year and Sex ... 43
xiii
LIST OF FIGURES Figure 1.1: Nigeria Projected Population by Sex (2013 – 2016)........................................................ 1
Figure 2.1: Distribution of Life Expectancy by Sex, 2016 .................................................................. 4
Figure 2.2: Percentage Distribution of HIV Patients by Year and Sex ............................................... 6
Figure 2.3: Percentage Distribution of HIV Patients that have Access to Antiretroviral Treatment
by Year and Sex ................................................................................................................................. 7
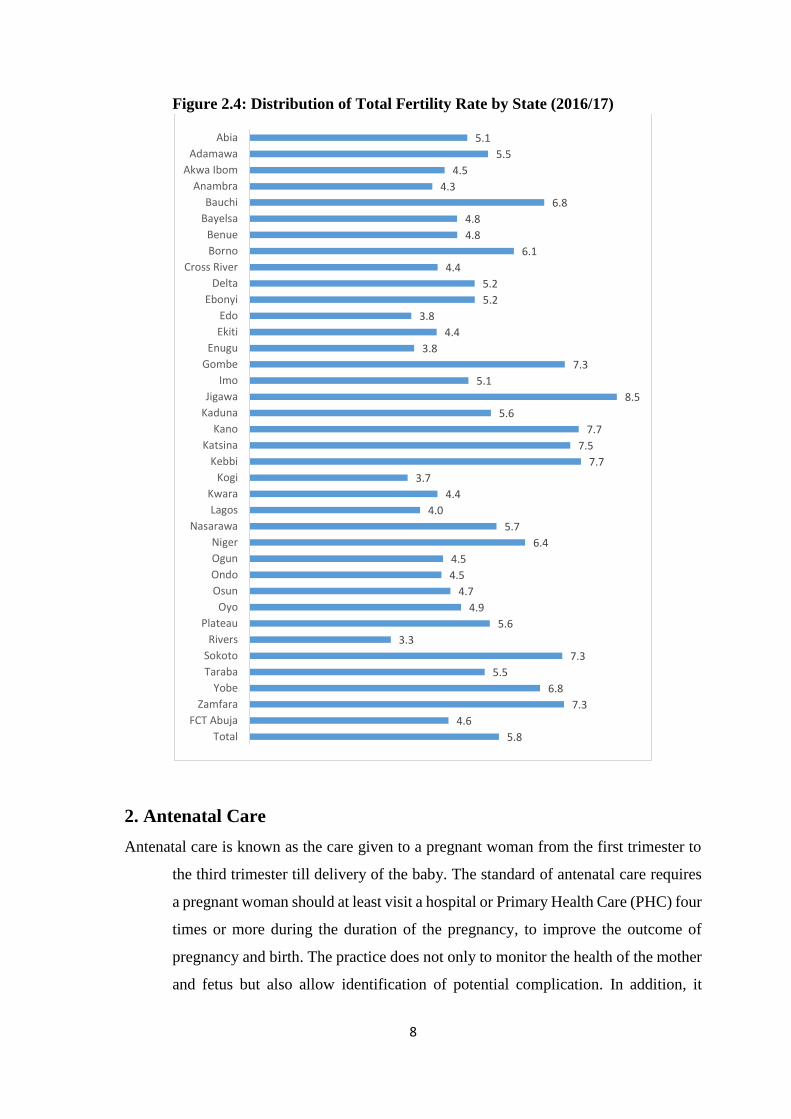
Figure 2.4: Distribution of Total Fertility Rate by State (2016/17) ................................................... 8
Figure 3.1: Percentage of Women and Men age 15-24 years who are literate (2016 -17) ..... 14
Figure 3.2: Percentage Distribution of Enrolment of School Age Girls in Primary Education by Year
and Sex ............................................................................................................................................ 15
Figure 3.3: Distribution of Primary and Secondary Schools Completion Rate by Sex (2016) ........ 17
Figure 3.4: Percentage Distribution of West Africa Senior Secondary Certificate Examination
(WASSCE) May/June by Year and Sex ............................................................................................. 18
Figure 3.5: Percentage Distribution of NECO (SSC) Examination Result by Year and Sex (June/July)
......................................................................................................................................................... 20
Figure 3.6: Percentage Distribution of NYSC Participation by Sex (2014- 2016) ........................... 22
Figure 4.1: Percentage of Employment in State Civil Service by Category and sex (2010 – 2015) . 25
Figure 5.1: Appointive Ministerial Political Position by Sex (1999-2015) ....................................... 29
Figure 5.2: Female Representation as Governor and Deputy Governor by Year ........................... 30
Figure 5.3: Percentage Representation of Local Chairpersons by Sex (1999 – 2015) .................... 31
Figure 5.4: Percentage Representation of Honorable Members at the State House of Assemblies
......................................................................................................................................................... 33
Figure 5.5: Percentage Representation of Councilors by Sex from 1999 - 2015 ............................ 34
Figure 5.6: Percentage distribution of Judges in Federal Court by Sex (2011- 2016) ..................... 36
Figure 6.1: Percentage of women age 15 -49 who had any form of FGM/C, 2016/17 ................... 39
Figure 6.2: Percentage of Prison Admission by Sex (2013 – 2016) ................................................. 40

xiv
LIST OF ACRONYMS
AIDS - Acquired Immune Deficiency Syndrome
BPA - Beijing Platform for Action
FGM - Female Genital Mutilation
FME - Federal Ministry of Education
HIV - Human Immune Deficiency Syndrome
ICT - Information and Communication Technology
INEC - Independent National Electoral Commission
MDAs - Ministries, Departments, and Agencies
MICS - Multiple Indicator Cluster Survey
NAPTIP - National Agency for Prohibition on Trafficking in Persons
NBS - National Bureau of Statistics
NBTE - National Board for Technical Education (NBTE)
NCCE - National Commission for Colleges of Education
NCWD - National Center for Women Development
NDHS - National Demographic and Health Survey
NECO - National Examination Council
NGP - National Gender Policy
NJC - National Judicial Council
NpopC - National Population Commission
OSGF - Office of the Secretary to Government of the Federation
SDGs - Sustainable Development Goals
ST - Statistical Table
UNESCO - United Nations Educational, Scientific and Cultural Organisation

xv
VAW - Violence against Women
WASSCE - West Africa Senior Secondary Certificate Examination
WHO - World Health Organization

1
CHAPTER 1: POPULATION Key Findings
▪ Nigeria population in 2016 is estimated at 193 million people
▪ Women constitute 49.2 per cent and men 50.8 per cent
▪ Population growth rate is estimated at 3.2 per cent.
▪ Sex ratio remained 102 men to 100 women
Introduction
Population size and growth patterns directly affect human living conditions across the
globe. This chapter elaborates, first, on general population dynamics and patterns in the
nation and the population of elderly men and women.
A. General Population Patterns
1. Population and Growth Rate
Nigeria is the most populous country in Africa and ranks the 7th in the world1. In 2016, the Nigeria
population was estimated to be 193 million compared to about 187 million in 2015 (NPopC).
Though, international migration has played a very negligible role in determining the population of
Nigeria, increasing fertility rates and decreasing mortality rates have contributed significantly to
the very high rate of population growth, which is, estimated to be growing by about 3.2 per cent per
annum. Women constitute 49.2 per cent and 50.8 per cent for men. The sex ratio remained 102 men
to 100 women in 2016. See Figure 1.1 below and ST 1.1 in the Appendix.
Figure 1.1: Nigeria Projected Population by Sex (2013 – 2016)
1 United Nations, 2015
17
5,6
90
,14
3
18
1,4
03
,14
8
18
7,3
01
,92
6
19
3,3
92
,51
7
89
,25
8,2
72
92
,16
0,7
29
95
,15
7,5
66
98
,25
1,8
52
86
,43
1,8
70
89
,24
2,4
19
92
,14
4,3
60
95
,14
0,6
65
2 0 1 3 2 0 1 4 2 0 1 5 2 0 1 6
Total
M
F

2
2. Distribution of Population of the Elderly (60+ Years) by Year and Sex
In Nigeria, both women and men over 60 year’s old are regarded as elderly A notable
demographic phenomenon in Nigeria is that the proportion of young population is
constantly increasing. Great transformations usually occur in societies where there is a
preponderance of young, active and vibrant people where societies with a significant
percentage of the elderly face challenges primarily, in ensuring that the accessto adequate
living conditions throughout the extended lifespan is garunteed. The total estimated
number of the elderly, that is, those aged 60 years or more went up slightly from 8,741,292
million in 2013 to 9,025,537 in 2014. In 2015, the estimated elderly population was
9,319,025 and in 2016 it was 9,622,057. The percentage of female elderly stood at 44.21
per cent. See Table 1.1 below.
Table 1.1: Distribution of Population of the Elderly (60+ Years) by Year and Sex
YEAR
Total Elderly 60+ years
Male Elderly 60+years
Female Elderly 60+ years
2013
8,741,292
4,876,375
3,864,917
2014
9,025,537
5,034,942
3,990,595
2015
9,319,025
5,198,666
4,120,359
2016
9,622,057
5,367,714
4,254,343
Source: National Population Commission (NPopC)

3
CHAPTER 2: HEALTH Key Findings
• Life Expectancy for males was 47 years, 51 years for females and 49 years for both
in 2016.
• The percentage of women living with HIV increased slightly from 51.7 per cent in
2013 to 53.1 per cent in 2016, but that of men decreased slightly from 48.3 per cent
in 2013 to 46.9 per cent in 2016.
• The percentage of woman with access to Antiretroviral Treatment increased from
66.6 per cent in 2013 to 69.7 per cent in 2014 and it was 69.2 and 69 per cent for
2015 and 2016 respectively. In 2013 about 33.4 per cent HIV male patients had
access to Antiretroviral Treatment, while the indicator recorded 30.3, 30.8 and 31
per cent in 2014, 2015 and 2016 respectively.
• In 2016, the total fertility rate was 5.8 births per woman.
• About 49.1 per cent of pregnant women had 4 or more antenatal care visits in
2016/17 in Nigeria.
• Only 10.8 per cent of Women in 2016 used modern contraceptive methods
• Child mortality rate was 54 per 1,000 live birth in 2016/17.
Introduction
According to the World Health Organization (WHO), “health is a state of complete
physical, mental and social well-being and not merely the absence of disease or infirmity”2.
The 1995 Beijing Platform for Action (BPA, 1995) emphasizes that women have the right
to a highest attainable standard of physical and mental health and that is essential to their
life and well-being and their ability to participate in all areas of public and private life3.
However, gender inequality persists in health service provision and women often find it
challenging accessing proper healthcare. Empowering women with the necessary
knowledge and skills to fulfill these health potentials is not only essential to their well-
being but also to that of their children and families. Tackling gender inequalities in the
provision of health services will enable all women and men to enjoy healthier lives, which
will ultimately lead to greater gender equality in all spheres of life. Sustainable
Development Goals (SDG) 3 also ensure healthy lives and promote well-being for all at all
ages.
2 ConstitutIon of WHO: Principle 3 United Nations, 1996, p.89

4
A. Life Expectancy at Birth Life expectancy at birth depicts the average number of years a newborn child is expected
to live given the current levels of mortality in a country. This health indicator is derived
from the age-specific mortality rates, and it provides a picture of the overall health status
of a population as well as allowing for the investigation of the longevity of women and men
separately. In 2016, life expectancy was 47 years for male, 51 years for female, and 49
years for both male and female. See Figure 2.1 below.
Figure 2.1: Distribution of Life Expectancy by Sex, 2016
Cross River state had the highest life expectancy for female which was 56 years, followed
by FCT, Osun and Oyo state (both 55 years ). Osun state had the highest life expectancy
for male (52 years), followed by Oyo and Cross River states (51 years). Adamawa state had
the least life expectancy of for both female (44 years) and for male (42 years). See Table
2.1 below.
49
47
51
Life Expectancy at birth(Both)
Life Expectancy at birth(Male)
Life Expectancy at birth(Female)

5
Table 2.1: Distribution of Life Expectancy by State and Sex, 2016
State Life Expectancy at
birth
Life Expectancy at
birth (Male)
Life Expectancy at
birth (Female)
Abia 52 49 53
Adamawa 43 42 44
Akwa-Ibom 51 49 51
Anambra 48 47 50
Bauchi 45 45 49
Bayelsa 50 47 53
Benue 47 46 50
Borno 43 42 48
Cross River 54 51 56
Delta 49 48 50
Ebonyi 48 47 52
Edo 50 46 48
Ekiti 53 48 53
Enugu 52 49 53
Gombe 48 45 49
Imo 53 50 52
Jigawa 47 44 48
Kaduna 45 43 48
Kano 47 46 49
Katsina 49 47 51
Kebbi 52 48 50
Kogi 46 45 48
Kwara 52 48 53
Lagos 49 48 51
Nasarawa 50 45 51
Niger 50 47 53
Ogun 53 50 53
Ondo 52 50 52
Osun 52 52 55
Oyo 51 51 55
Plateau 46 43 47
Rivers 47 46 49
Sokoto 50 48 51
Taraba 47 48 51
Yobe 44 42 46
Zamfara 50 47 50
FCT 52 50 55
Total 49 47 51
Source: NBS, HDI Survey, 2016
B. HIV and AIDS
1. Percentage Distribution of HIV Patients by Year and Sex
Since early 1980s, HIV/AIDS has been a critical health issue for women and men. The
epidemic continued to undermine development efforts worldwide and mostly afflict
populations already beset by extreme poverty. It has been noted to particularly affect the
working population, preventing women and men from making meaningful contributions
to development and improvement of families. At the household level, the epidemic

6
increases the burden of care and erodes savings. SDG Goal 3, target 3.3 aims at ending the
epidemics of AIDS, tuberculosis, malaria and neglected tropical diseases and combat
hepatitis, water-borne Diseases and other communicable diseases by 2030. About half of
the population of HIV patients are women. From Figure 2.2 below, the percentage of
women living with HIV increased slowly from 51.7 per cent in 2013 to 53.1 per cent in
2016, but that of men was decreased slowly from 48.3 per cent in 2013 to 46.9 per cent in
2016. Also see ST 2.1 in the Appendix.
Figure 2.2: Percentage Distribution of HIV Patients by Year and Sex
2. Percentage Distribution of HIV Patients that have Access to Antiretroviral
Treatment by Year and Sex
The percentage of female who had access to Antiretroviral Treatment increased from 66.6
per cent in 2013 to 69.7 per cent in 2014. The percentage decreased to 69.2 in 2015 and 69
per cent in 2016. In 2013 about 33.4 per cent male HIV patients had access to Antiretroviral
Treatment, while it was 30.3, 30.8 and 31 per cent in 2014, 2015 and 2016 respectively.
See Figure 2.3 below and ST 2.2 in the Appendix.
2013 2014 2015 2016
Male 48.3 47.8 47.3 46.9
Female 51.7 52.2 52.7 53.1
43.0
44.0
45.0
46.0
47.0
48.0
49.0
50.0
51.0
52.0
53.0
54.0
Per
cen
tage

7
Figure 2.3: Percentage Distribution of HIV Patients that have Access to
Antiretroviral Treatment by Year and Sex
C. Reproductive Health The reproductive years of women begin at puberty through menopause, and this is the
period when most women experience important life events such as becoming sexually
active, getting marrid and reproducing. It is also at these times that particular health risks,
especially pregnancy and childbirth related, cause ill-health and even death for many
women of childbearing age. The reproductive age is within the 15-49 age group.
1. Total Fertility Rate Fertility, as a demographic indicator, refers to the ability of a human being to reproduce
another human being, as currently being measured by the number of children ever born.
Practices in childbearing depend on culture, tradition, education and the overall level of
development of a particular society or community. Also, the age that an individual becomes
sexually active and the availability of contraception are two key determinants of fertility.
The most commonly used measure or indicator of fertility is the total fertility rate (TFR),
which is, the number of children that a woman bears over her entire childbearing years.
From MICS5, 2016/17 on average, total fertility rate was 5.8 births per woman (i.e. 5,800
births per 1,000 women) in Nigeria which simply means that each woman had on the
average 5.8 children each during their entire childbearing years. Jigawa state had the highest
fertility rate of 8.5 birth per woman while Rivers state had the lowest (3.3 birth per woman).
See Figure 2.4 below and ST 2.3 in the Appendix.
2013 2014 2015 2016
Male 33.4 30.3 30.8 31
Female 66.6 69.7 69.2 69
0
10
20
30
40
50
60
70
80
Per
cen
tage
8
Figure 2.4: Distribution of Total Fertility Rate by State (2016/17)
2. Antenatal Care
Antenatal care is known as the care given to a pregnant woman from the first trimester to
the third trimester till delivery of the baby. The standard of antenatal care requires
a pregnant woman should at least visit a hospital or Primary Health Care (PHC) four
times or more during the duration of the pregnancy, to improve the outcome of
pregnancy and birth. The practice does not only to monitor the health of the mother
and fetus but also allow identification of potential complication. In addition, it
5.8
4.6
7.3
6.8
5.5
7.3
3.3
5.6
4.9
4.7
4.5
4.5
6.4
5.7
4.0
4.4
3.7
7.7
7.5
7.7
5.6
8.5
5.1
7.3
3.8
4.4
3.8
5.2
5.2
4.4
6.1
4.8
4.8
6.8
4.3
4.5
5.5
5.1
Total
FCT Abuja
Zamfara
Yobe
Taraba
Sokoto
Rivers
Plateau
Oyo
Osun
Ondo
Ogun
Niger
Nasarawa
Lagos
Kwara
Kogi
Kebbi
Katsina
Kano
Kaduna
Jigawa
Imo
Gombe
Enugu
Ekiti
Edo
Ebonyi
Delta
Cross River
Borno
Benue
Bayelsa
Bauchi
Anambra
Akwa Ibom
Adamawa
Abia

9
provides women with information of needed nutrition during pregnancy and
breastfeeding.
From the Table 2.2 below, about 49.1 per cent pregnant women had 4 or more antenatal
care visits in 2016/17 in Nigeria. Lagos state had the highest percentage of women who had
four or more visits forantenatal care (94.2 per cent). Kebbi and Sokoto states had the
percentage of women with four or more visits forantenatal care, which recorded 20.9 per
cent and 24.9 per cent respectively. However, Sokoto State also had the highest percentage
(63.9 per cent) of no visit to antenatal care.
Table: 2. 2: Percentage Distribution of Number of Antenatal Care Visits by State,
2016/17
STATE
No
antenatal
care visits
One
visit
Two
visits
Three
visits
4 or more visits
Abia 8.7 0.9 1.3 2.4 86.1
Adamawa 19 3.6 5.8 14.6 55.7
Akwa Ibom 13.2 2 7.2 10.8 66.7
Anambra 1.3 3.3 1 2 90
Bauchi 38.2 4.9 9 12.7 33
Bayelsa 23.1 1.3 8 4.8 62.9
Benue 31.4 3.4 6.3 9.7 48.2
Borno 10.9 3.4 4.6 19.2 61.9
Cross Rivers 12.2 1.9 5.4 13.4 67.1
Delta 17.5 3.5 6.3 5.4 64.5
Ebonyi 21.6 2.1 2.2 11.5 57.7
Edo 5.4 3.1 1.6 6.3 83.7
Ekiti 8.3 2.4 1.1 1.5 86.1
Enugu 5.1 10.4 0.9 2.9 76.7
Gombe 27.9 10.2 9.3 17.8 34.1
Imo 3.4 9.1 3 1.9 81.9
Jigawa 42.3 7.6 5.7 7.2 36.3
Kaduna 23.4 17.5 2.4 9 43.8
Kano 29.9 3.7 7.6 13.6 44.7
Katsina 54.6 3.3 4.3 3.3 33.4
Kebbi 52.9 7 7.5 8.3 20.9
Kogi 18.1 7.7 5.4 8.5 57
Kwara 20.3 0.6 3 8.9 66.6
Lagos 3.1 0.8 0.5 1.4 94.2
Nasarawa 30.7 6.7 3.4 8.7 50.2
Niger 49.1 4.1 5.7 8.5 32.6
Ogun 9 0 2.6 2 86.4
Ondo 12.8 2.2 3.3 4.5 76.1
Osun 2.4 0 3.3 2.1 92.2
Oyo 7.8 4.3 5.9 9 68.3
Plateau 38.7 2.1 4.9 7.8 46.5
River 9.6 1.6 0 2.2 85.8
Sokoto 63.9 3.2 3.6 4.3 24.9
Taraba 50.9 3.7 4.9 7.4 31.6
Yobe 57.4 2.8 3.9 9.3 26.6
Zamfara 57.8 2.8 4.6 5.7 29
10
FCT 16.1 1.2 3.2 4.1 75.2
National Total 31.6 4.6 4.9 8.6 49.1
Source: MICS5, 2016/17
3. Contraceptive Use Table 2.3: Percentage of Women Currently Married or in Union Who are Using (or
Whose Partner is Using Contraceptive Method), 2016/17
State No method Any modern
method
Any method
Abia 83.4 9.5 16.6
Adamawa 90.9 7.1 9.1
Akwa Ibom 84.3 10.8 15.7
Anambra 71.8 16.9 28.2
Bauchi 88.1 8.4 11.9
Bayelsa 85.4 10.0 14.6
Benue 81.9 13.9 18.1
Borno 94.2 5.3 5.8
Cross River 77.0 16.1 23.0
Delta 89.1 8.0 10.9
Ebonyi 97.0 2.1 3.0
Edo 84.3 10.0 15.7
Ekiti 68.6 24.4 31.4
Enugu 77.9 18.0 22.1
Gombe 93.4 6.0 6.6
Imo 64.2 21.3 35.8
Jigawa 98.7 1.1 1.3
Kaduna 75.9 21.9 24.1
Kano 93.7 5.7 6.3
Katsina 93.7 4.9 6.3
Kebbi 93.7 5.0 6.3
Kogi 93.3 6.2 6.7
Kwara 72.9 23.7 27.1
Lagos 77.4 17.4 22.6
Nasarawa 83.0 13.8 17.0
Niger 88.8 8.1 11.2
Ogun 78.7 18.2 21.3
Ondo 78.2 18.8 21.8
Osun 75.4 22.9 24.6
Oyo 65.8 30.0 34.2
Plateau 79.9 19.2 20.1
Rivers 82.0 11.0 18.0
Sokoto 95.3 4.6 4.7
Taraba 93.3 5.6 6.7
Yobe 96.5 3.3 3.5
Zamfara 94.4 5.0 5.6
FCT Abuja 73.8 19.9 26.2
National 86.6 10.8 13.4
Source: MICS5, 2016/17
11
From Table 2.3, the percentage of population who used any contraceptives method for
pregnancy prevention and family planning was 13.4 per cent in 2016, in which only 10.8
per cent are using modern methods, while about 86.6 per cent are not using any method.
Jigawa State had the highest percent of 98.7 per cent women currently married who are not
using any method of contraceptive.
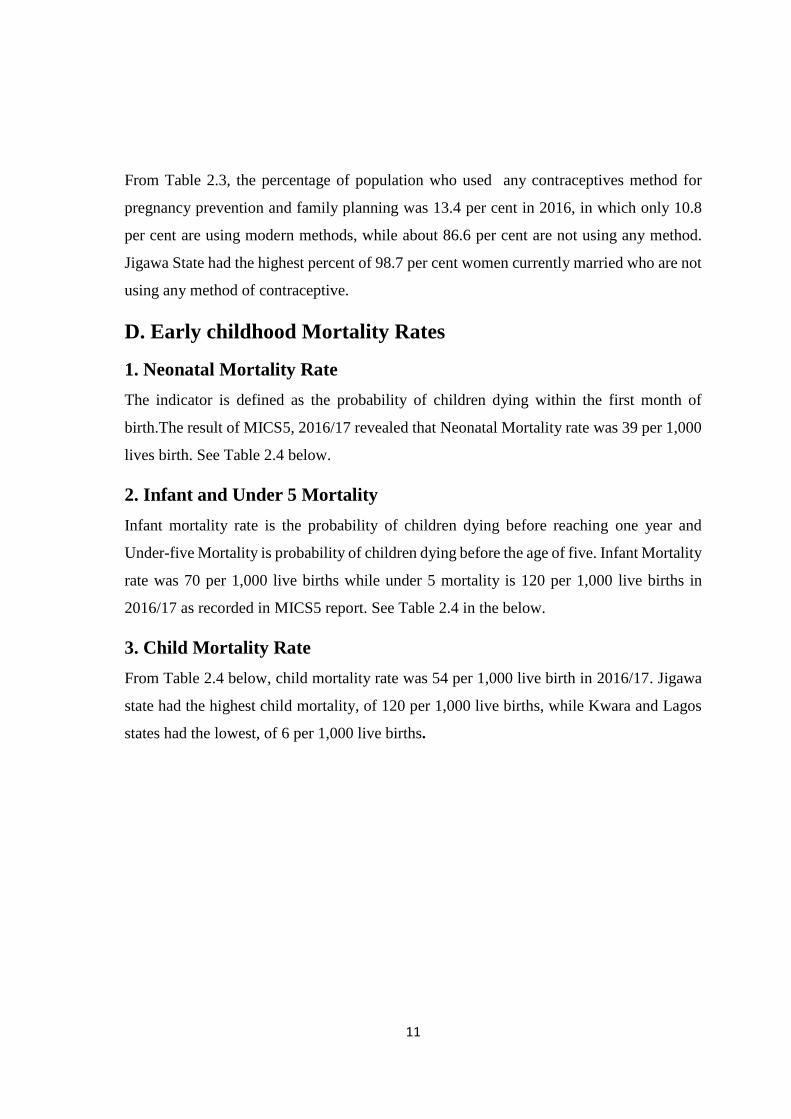
D. Early childhood Mortality Rates
1. Neonatal Mortality Rate
The indicator is defined as the probability of children dying within the first month of
birth.The result of MICS5, 2016/17 revealed that Neonatal Mortality rate was 39 per 1,000
lives birth. See Table 2.4 below.
2. Infant and Under 5 Mortality
Infant mortality rate is the probability of children dying before reaching one year and
Under-five Mortality is probability of children dying before the age of five. Infant Mortality
rate was 70 per 1,000 live births while under 5 mortality is 120 per 1,000 live births in
2016/17 as recorded in MICS5 report. See Table 2.4 in the below.
3. Child Mortality Rate
From Table 2.4 below, child mortality rate was 54 per 1,000 live birth in 2016/17. Jigawa
state had the highest child mortality, of 120 per 1,000 live births, while Kwara and Lagos
states had the lowest, of 6 per 1,000 live births.
12
Table 2.4: Neonatal, Infant, Child Mortality and Under-five Rates
State Neonatal
mortality
rate
Infant
mortality rate
Child
mortality
rate
Under-five
mortality rate
Abia -32 55 30 83
Adamawa 21 49 37 84
Akwa Ibom 21 42 32 73
Anambra -23 39 15 53
Bauchi 41 81 87 161
Bayelsa 29 57 41 95
Benue 41 70 14 82
Borno -26 42 42 82
Cross River 20 38 15 52
Delta 28 48 16 63
Ebonyi 30 47 15 62
Edo * * * *
Ekiti -46 69 18 86
Enugu * * * *
Gombe 35 90 78 162
Imo -35 66 33 96
Jigawa 37 83 120 192
Kaduna 28 66 18 82
Kano 69 112 103 203
Katsina 35 68 72 135
Kebbi 55 111 70 174
Kogi 29 49 28 75
Kwara 27 40 6 45
Lagos 29 45 6 50
Nasarawa 47 81 43 121
Niger 59 100 54 149
Ogun -28 49 19 66
Ondo -30 37 32 67
Osun -56 78 25 101
Oyo -42 59 15 73
Plateau 34 55 27 80
Rivers -27 41 18 58
Sokoto 28 51 72 119
Taraba 22 64 45 105
Yobe 44 64 41 102
Zamfara 53 104 118 210
FCT-Abuja 27 44 28 71
Total 39 70 54 120
Source: MICS5, 2016/17

13
CHAPTER 3: EDUCATION Key Findings
• Literacy rate among young women and men age 15-24 years in 2016 was 59.3 per
cent and 70.9 per cent respectively
• The percentage of girls’ enrollment in primary school was less than 50 per cent, it
was 48.6 per cent in 2014 but decreased in 2015 and 2016 to 47.4 and 47.5 per cent
respectively.
• The completion rate for girls in primary, junior Secondary and senior secondary
for 2016 were 64.8 per cent, 38.9 per cent and 33.2 per cent respectively.
• Female enrolment in Nigerian universities was 38.36 per cent (2012/2013)
• The percentage of women teachers in Polytechnics and Colleges of education was
very low, between 20 and 28 in 2013/2014 and 2014/2015 academic sessions
(Federal Ministry of Education).
Introduction
Education impacts skills and proficiencies that are central to human development and
enhanced quality of life, bringing wide ranges of benefits to both individuals and societies.
Investing in female education yields exceptionally high social and economic returns.
Education has long been recognized as a fundamental right with far-reaching impacts on
human development and social progress. The importance of education for the advancement
of women was highlighted in the Beijing Platform for Action, in which it was identified as
one of the 12 critical areas of concern and affirmed as critical for gender equality and
women empowerment. The Platform for Action also called for eliminating gender-based
discrimination in education at all levels, eradicating illiteracy among women and improving
access to vocational training, science and technology education, and continuing education.
Sustainable Development Goal (SDG) 4 also ensures inclusive and equitable quality
education and promote lifelong learning opportunities for all.
A. Educational Outcomes
1. Literacy
UNESCO defines a literate person as one who can with understanding both read and write
a short, simple statement on his/her everyday life, and an illiterate person as one who cannot
with understanding both read and write a short simple statement in his/her daily life. From
MICS5 survey result 2016/17, the literacy rate among female and male age 15-24 years was
59.3 per cent and 70.9 per cent respectively. See figure 3.1 below.

14
Figure 3.1: Percentage of Women and Men age 15-24 years who are literate
(2016 -17)
The literacy rate of most young women and men in the southern zone was higher (over 90
per cent) than Northern zone. In the Northern region the percentage of women who are
literate was between 38.0 – 62.0 per cent, while it was between 53.1 – 76.4 per cent for
men. See the Table 3.1 below.
Table 3.1: Percentage of Women and Men age 15-24 years who are literate (2016-17)
Zone Female Male
North west 38.0 57.5
North east 41.9 53.1
North central 62.0 76.4
South west 92.6 93.7
South south 94.8 95.0
South east 95.4 94.3
Source: MICS5, 2016/17
B. Participation in Education
1. Enrolment in Primary Education
Available data from Federal Ministries of Education shows that the rate of enrolment
among school age girls in primary education was 48.6 per cent in 2014 but it decreased in
2015 and 2016 to 47.4 and 47.5 per cent respectively. More than half of students enrolled
in primary schools were boys, which accounted for 51.4 per cent of total primary school
students in 2014. The percentage rose to 52.6 per cent in 2015 and slightly decreased to
52.5 per cent in 2016. See Table 3.2 and Figure 3.2 below.
Table 3.2: Distribution of Enrolment of School-Age Girls in Primary Education by
Year and Sex
Year M F % F % M
2014 13,255,789 12,545,408 48.6 51.4
2015 13,393,310 12,049,225 47.4 52.6
2016 13,435,940 12,155,241 47.5 52.5
Female, 59.3%
Male, 70.9%

15
Source: Nigeria Digest of Education Statistics, Federal Ministry of Education
Figure 3.2: Percentage Distribution of Enrolment of School-Age Girls in Primary
Education by Year and Sex
Zamfara state had the lowest percentages of girls enrolled in primary schools which ranges
from 34.8 – 35.5 per cent in 2014 – 2016, while the percentages of boy’s enrollment was
between 65.2 – 65.5 per cent for the reference period. No data is available for Borno state
in 2014 and 2015 but in 2016 the percentage of school girls enrolled was 46.1 per cent. See
ST 3.2 in the Appendix.
2. Secondary Education
2.1: Percentage Distribution of Enrolment in Junior Secondary Schools by Sex, 2012
- 2016
Enrollment of girls and boys into Junior Secondary schools as measured by the number of
admission at this level of education. The recorded enrollment rate in secondary education
was about 47 per cent for girls and 53 per cent for boys in the period under reference. See
Table 3.3 below.
Table 3.3: Distribution of Enrolment in Junior Secondary School by Year and Sex,
2014 - 2016
Junior Secondary
Year M F % F % M
2014 3,311,470 2,891,624 46.6 53.4
2015 3,260,109 2,920,182 47.2 52.8
2016 3,181,810 2,786,332 46.7 53.3
Source: Nigeria Digest of Education Statistics, Federal Ministry of Education
48.6
47.4 47.5
51.4
52.6 52.5
44.0
45.0
46.0
47.0
48.0
49.0
50.0
51.0
52.0
53.0
54.0
2014 2015 2016
% F
% M

16
Abia state had the highest percentage of girls enrolled in junior secondary school, of 53.7
and 55.6 in 2014 and 2016 respectively. From 2014 to 2016 Kebbi state had the lowest
percentage of girls enrolled in junior secondary (about 33 per cent). See ST 3.3 in the
Appendix.
2.2: Percentage Distribution of Enrolment in Senior Secondary Schools
by Sex, 2012 - 2016
The nationawide percentage of girls in senior secondary schools was below 50 per cent
from 2014 to 2016. The percentage was 45.9 per cent in 2014 and it increased slightly to
46.5 per cent in 2015 and 46.0 per cent in 2016. About 54 per cent of boys were enrolled
in senior secondary schools in 2014 to 2016. See Table 3.4 below.
Enugu state had the highest per cent of girls’ enrolment in senior secondary schools in both
2014 and 2015 (55.4 per cent). Abia state had the highest in 2016 (55.9 per cent), while
Kebbi recorded the lowest percentage (29.5 per cent). See ST 3.4 in the Appendix.
Table 3.4: Distribution of Enrolment in Senior Secondary School by Sex, 2012 - 2016
Year
Senior Secondary
M F % F % M
2014 2,321,183 1,971,306 45.9 54.1
2015 2,629,526 2,281,418 46.5 53.5
2016 2,417,192 2,058,117 46.0 54.0
Source: Nigeria Digest of Education Statistics, Federal Ministry of Education
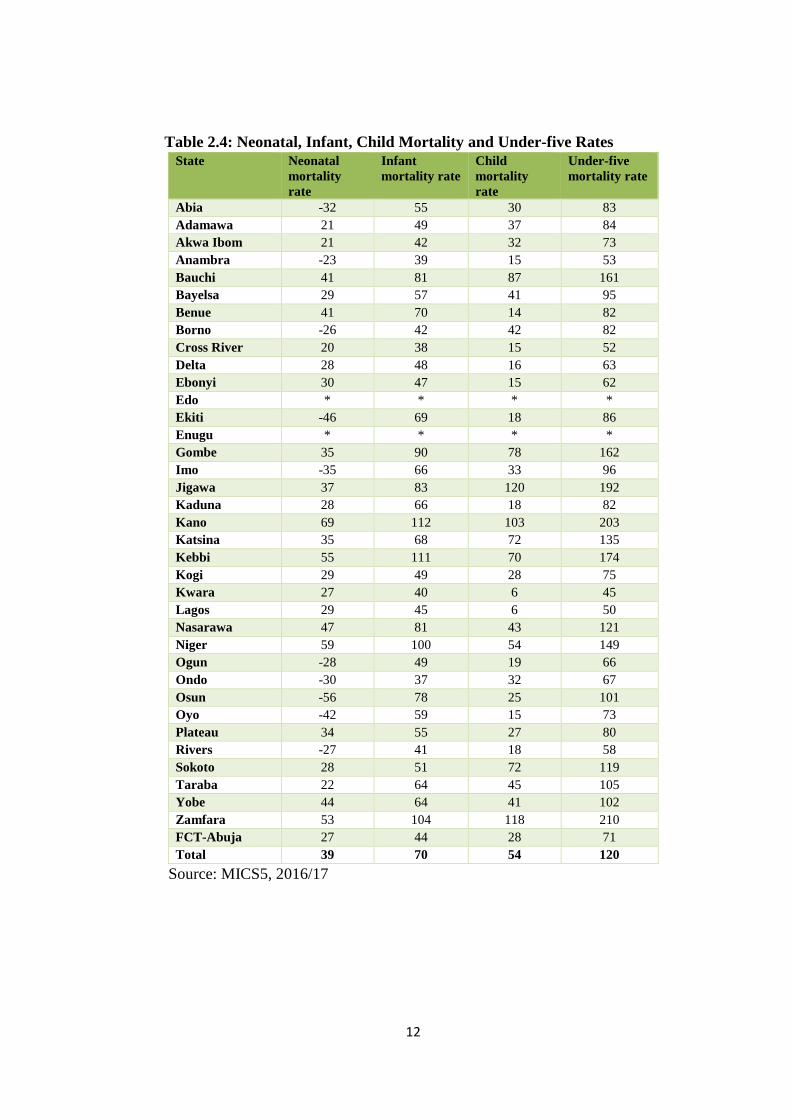
2.3. Completion rate Figure 3.3 below displays the completion rates by sex in primary and secondary schools
from Federal Ministry of Education (Nigeria Education Indicator 2016). The completion
rate for girls in primary school in 2016 was 64.8 per cent in the country while it was 70.8
per cent for boys. For junior secondary schools, the completion rates for girls and boys in
the same year were 38.9 and 43.3 per cent respectively while the completion rates for girls
and boys in senior secondary schools were lower than the completion rates in primary
schools and junior secondary schools for both gender, with an average of 30 per cent, (28.7
for girls and 33.2 for boys). See Figure 3.3 below.
17
Figure 3.3: Distribution of Primary and Secondary Schools Completion Rate by Sex
(2016)
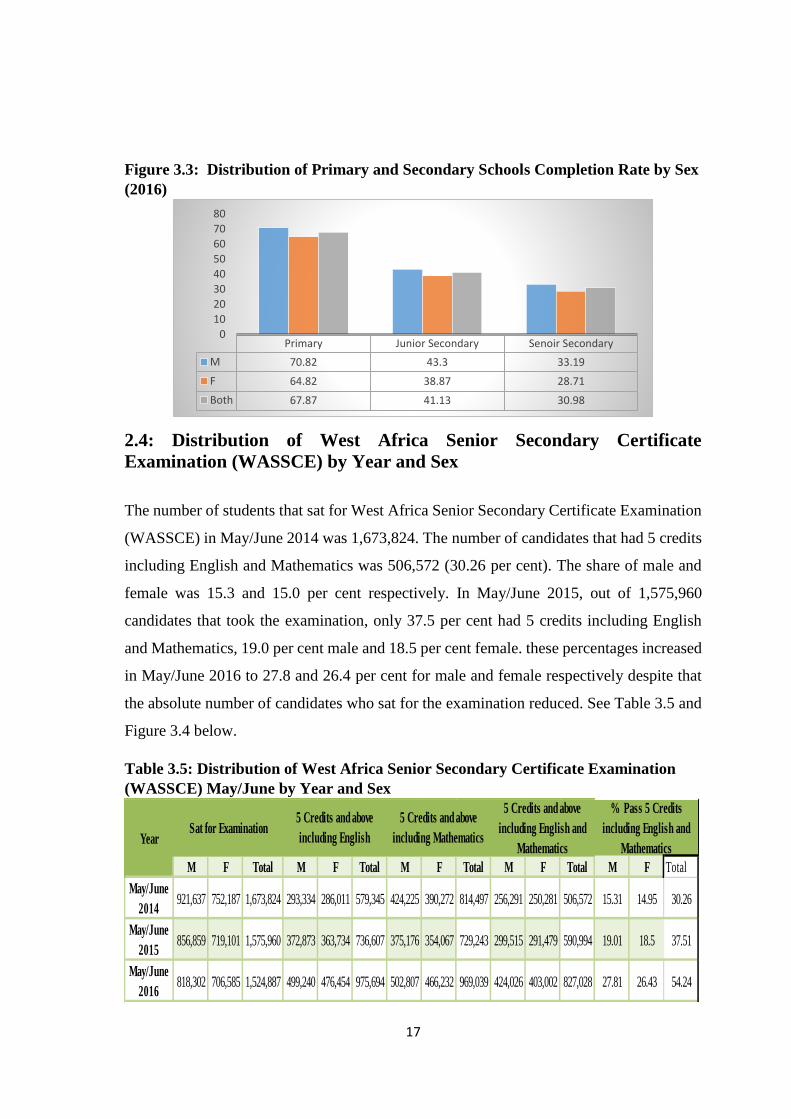
2.4: Distribution of West Africa Senior Secondary Certificate
Examination (WASSCE) by Year and Sex
The number of students that sat for West Africa Senior Secondary Certificate Examination
(WASSCE) in May/June 2014 was 1,673,824. The number of candidates that had 5 credits
including English and Mathematics was 506,572 (30.26 per cent). The share of male and
female was 15.3 and 15.0 per cent respectively. In May/June 2015, out of 1,575,960
candidates that took the examination, only 37.5 per cent had 5 credits including English
and Mathematics, 19.0 per cent male and 18.5 per cent female. these percentages increased
in May/June 2016 to 27.8 and 26.4 per cent for male and female respectively despite that
the absolute number of candidates who sat for the examination reduced. See Table 3.5 and
Figure 3.4 below.
Table 3.5: Distribution of West Africa Senior Secondary Certificate Examination
(WASSCE) May/June by Year and Sex
M F Total M F Total M F Total M F Total M F Total
May/June
2014921,637 752,187 1,673,824 293,334 286,011 579,345 424,225 390,272 814,497 256,291 250,281 506,572 15.31 14.95 30.26
May/June
2015856,859 719,101 1,575,960 372,873 363,734 736,607 375,176 354,067 729,243 299,515 291,479 590,994 19.01 18.5 37.51
May/June
2016818,302 706,585 1,524,887 499,240 476,454 975,694 502,807 466,232 969,039 424,026 403,002 827,028 27.81 26.43 54.24
% Pass 5 Credits
including English and
Mathematics
Sat for Examination5 Credits and above
including English
5 Credits and above
including MathematicsYear
5 Credits and above
including English and
Mathematics
Primary Junior Secondary Senoir Secondary
M 70.82 43.3 33.19
F 64.82 38.87 28.71
Both 67.87 41.13 30.98
0
10
20
30
40
50
60
70
80
18
Source: Nigeria Digest of Education Statistics, Federal Ministry of Education
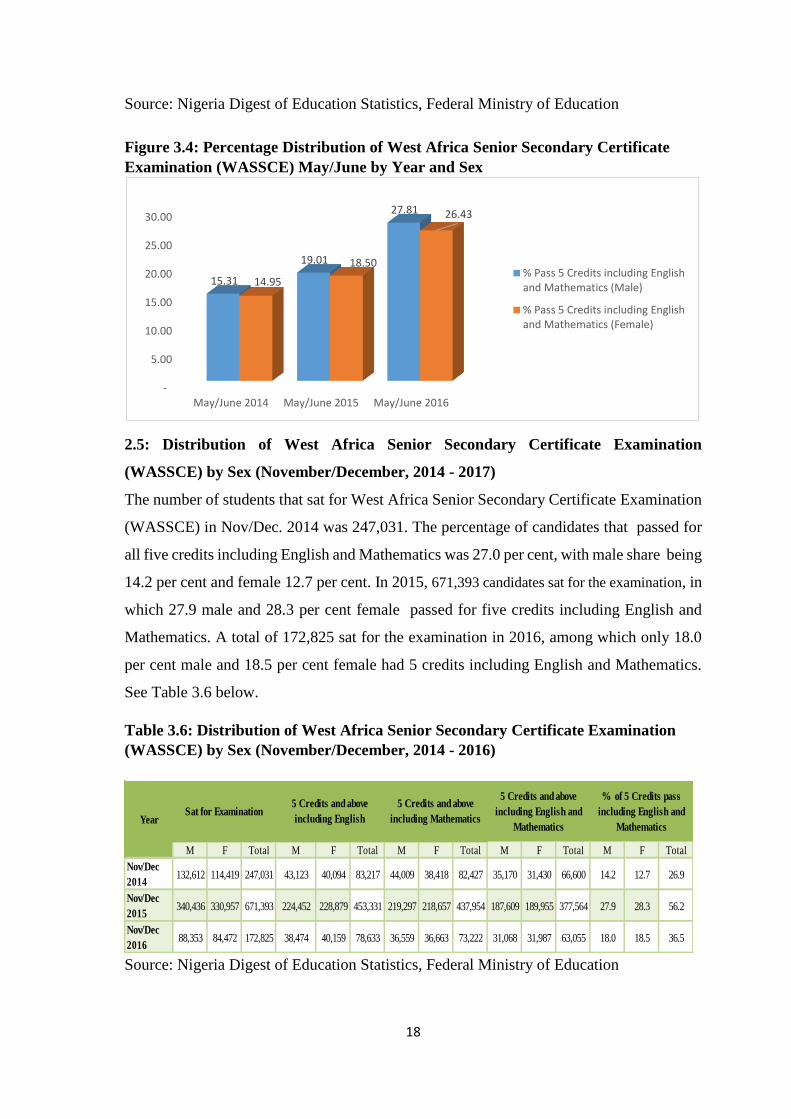
Figure 3.4: Percentage Distribution of West Africa Senior Secondary Certificate
Examination (WASSCE) May/June by Year and Sex
2.5: Distribution of West Africa Senior Secondary Certificate Examination
(WASSCE) by Sex (November/December, 2014 - 2017)
The number of students that sat for West Africa Senior Secondary Certificate Examination
(WASSCE) in Nov/Dec. 2014 was 247,031. The percentage of candidates that passed for
all five credits including English and Mathematics was 27.0 per cent, with male share being
14.2 per cent and female 12.7 per cent. In 2015, 671,393 candidates sat for the examination, in
which 27.9 male and 28.3 per cent female passed for five credits including English and
Mathematics. A total of 172,825 sat for the examination in 2016, among which only 18.0
per cent male and 18.5 per cent female had 5 credits including English and Mathematics.
See Table 3.6 below.
Table 3.6: Distribution of West Africa Senior Secondary Certificate Examination
(WASSCE) by Sex (November/December, 2014 - 2016)
M F Total M F Total M F Total M F Total M F Total
Nov/Dec
2014132,612 114,419 247,031 43,123 40,094 83,217 44,009 38,418 82,427 35,170 31,430 66,600 14.2 12.7 26.9
Nov/Dec
2015340,436 330,957 671,393 224,452 228,879 453,331 219,297 218,657 437,954 187,609 189,955 377,564 27.9 28.3 56.2
Nov/Dec
201688,353 84,472 172,825 38,474 40,159 78,633 36,559 36,663 73,222 31,068 31,987 63,055 18.0 18.5 36.5
YearSat for Examination
5 Credits and above
including English
5 Credits and above
including Mathematics
5 Credits and above
including English and
Mathematics
% of 5 Credits pass
including English and
Mathematics
Source: Nigeria Digest of Education Statistics, Federal Ministry of Education
-
5.00
10.00
15.00
20.00
25.00
30.00
May/June 2014 May/June 2015 May/June 2016
15.31
19.01
27.81
14.95
18.50
26.43
% Pass 5 Credits including Englishand Mathematics (Male)
% Pass 5 Credits including Englishand Mathematics (Female)

19
2.6: Distribution of NECO (SSC) Examination by Year and Sex
(June/July)
From Table 3.7 below and Figure 3.5; a total of 1,102,608 candidates sat for NECO (SSC)
June/July Examination in 2012, the percentage of candidates who passed for five credits
and above including English and mathematics was 29.29 per cent for male and 36.22 for
female. The number of candidates who sat for the examination decreased in 2013 to 2015
and the percentage of candidates who passed the examination increased. In 2016, the total
of 1,022,474 candidates sat for the examination. The percentage of candidates that pass
both English and Mathematics was 66.86 per cent for male and 73.77 per cent for female.
Also see ST 3.5a - 3.5e in the Appendix.
Table 3.7: Distribution of NECO (SSC) Examination Result by Year and Sex
(June/July)
Source: National Examination Council
M F Total M F Total M F Total M F Total M F Total M F
Jun/Jul
2012636,513 466,095 1,102,608 298,733 256,151 554,884 307,617 259,394 567,011 206,173 182,923 389,096 186,442 168,824 355,266 29.29 36.22
Jun/Jul
2013600,853 433,410 1,034,263 377,596 303,911 681,507 379,986 288,328 668,314 288,002 230,675 518,677 272,465 220,689 493,154 45.35 50.92
Jun/Jul
2014568,394 410,492 978,886 400,525 301,590 702,115 379,651 287,878 667,529 302,726 233,956 536,682 287,308 224,623 511,931 50.55 54.72
Jun/Jul
2015559,086 410,404 969,490 453,422 347,056 800,478 444,993 331,385 776,378 385,715 295,322 681,037 375,038 289,709 664,747 67.08 70.59
Jun/Jul
2016595,534 426,940 1,022,474 485,897 371,802 857,699 460,716 352,130 812,846 406,599 320,089 726,688 398,190 314,954 713,144 66.86 73.77
Perc. of 5
Credits
including Maths Year
Total Number of candidates
SatCredit Pass in English
Credit Pass in
mathematics
Credit Pass in Maths &
Eng
5 Credits including Maths
&Eng

20
Figure 3.5: Percentage Distribution of NECO (SSCE) Examination Result by Year
and Sex (June/July)
3. Tertiary Education
3.1 Enrolment and Turnout in Tertiary Education Enrolment in tertiary institutions across the country was dominated by male on the
average. Tertiary institutions include colleges of education, polytechnics, and
universities in Nigeria. The table below shows that the percentage of female enrolled in
colleges of education in Nigeria for the reference period was below average, 47.37 per
cent and 46.75 per cent for 2013/2014 and 2014/2015 academic sessions respectively.
The turnout for female was above average (52.53 per cent) for 2013/2014. For
Polytechnics, about 40 per cent students enrolled were female for the reference period.
Also, the turnout of female students was about 40 per cent for the two periods. See
Table 3.8 below.
Table 3.8: Summary of Students Enrolment and Turnoutin Colleges of Education
and Polytechnics by Year and Sex
F M % F F M % F F M % F F M % F
2013/2014 175,507 195,019 47.37 18,885 17,069 52.53 117,638 175,745 40.10 50,304 74,362 40.35
2014/2015 175,438 199,811 46.75 NA NA NA 119,687 174,105 40.74 43,060 65,228 39.76
Year
Colleges of Education Polytechnics
Enrolment Out-Turn Enrolment Out-Turn
Source: Nigeria Digest of Education Statistics, Federal Ministry of Education
Note: NA: Information not Available
0
10
20
30
40
50
60
70
80
Jun/Jul2012
Jun/Jul2013
Jun/Jul2014
Jun/Jul2015
Jun/Jul2016
Perc. of 5 Credits includingMaths & Eng (% )Male
Perc. of 5 Credits includingMaths & Eng (%) Female

21
3.2: Student’s Enrolment in Nigeria Universities (2012/13) The available data from Federal Ministry of Education revealed that female enrollment
in Nigeria Universities in 2012/2013 was only 38.36 per cent while the percentage of
male enrollment was 61.64 per cent. Private universities had the highest percentage of
female (46.26 per cent) enrollment followed by state universities (41.40 per cent) and
federal universities (35.94 per cent). See Table 3.9 below.
Table 3.9: Student's Enrolment in Nigeria Universities by Sex (2012/13)
University F M % F % M
Federal 273,657 487706 35.94 64.06
State 171,942 243384 41.40 58.60
Private 33,750 39,203 46.26 53.74
Total 479,349 770.293 38.36 61.64
Source: Nigeria Digest of Education Statistics, Federal Ministry of Education
4. Educational Attainment Educational attainment is measured by the quantum of turnout from tertiary institutions
and number participating in the National Youth Service Corps (NYSC) every year.
Table 3.10 and Figure 3.6 below show the percentages of female and male completing
tertiary education. The percentage of female who completed tertiary education slightly
dropped from 45.95 per cent in 2014 to 45.80 per cent in 2015. However, female
completion rate increased to 47.50 per cent in 2016. In 2014, about 54.05 per cent male
completed tertiary education, and the rate slightly increased in 2015 to 54.20 per cent
but dropped in 2016 to 52.50 per cent.
Table 3.10: Distribution of NYSC Participation by Sex (2014- 2016)
Year Male Female Male Female
2014
128,096 108,907 54.05 45.95
2015
132,689 112,144 54.20 45.80
2016
159,345 144,177 52.50 47.50
Source: NYSC (ICT, Department)

22
Figure 3.6: Percentage Distribution of NYSC Participation by Sex (2014- 2016)
C. Teaching Staff Quality in education highly depends on the quality of the teaching staff. Gender balance
among the teaching staff is critical for promoting gender parity in access to and
achievement in education and for creating a supportive and non-discriminating learning
environment for both women and men. It is proved that gender balance among teaching
staff is closely related to the improvement of gender parity in enrolment4. As the
proportion of female teachers’ increases from low levels, girls’ enrolment rises relative
to boys. The feminization of the teaching profession particularly in states where women
have lower socio-economic status can serve as an empowering tool for young women to
pursue their studies, and for parents to choose to educate the girls5.
1. Percentage of Teaching Staff in Institutions by Sex (2013/14 – 2015/16)
Table 3.11 below displays percentage of female teachers in institutions for the reference
period (2013/14 - 2015/2016). The percentage of female teachers in public primary
schools was 45.27 per cent in 2013/2014, and it increased to 48.36 per cent in 2014/2015
but slightly decreased to 47.83 per cent in 2015/2016. The proportion of female teachers
in junior secondary schools was 50.25 per cent for 2013/2014 and 53.38 per cent in
2014/2015 but decreased to 47.75 per cent in 2015/2016. Among senior secondary
school teachers, the percentage of female was 47.82 per cent in 2013/2014, which
4 Colclough et al, 2003
5 UNESCO, 2003
40.00
42.00
44.00
46.00
48.00
50.00
52.00
54.00
56.00
2014 2015 2016
54.05 54.20
52.50
45.95 45.80
47.50 Male
Female

23
increased to 52.29 per cent in 2014/2015 but dropped to 48.42 per cent in 2015/2016
session. The percentage of female teachers in polytechnics and colleges was very low,
between 20 to 28 in 2013/2014 and 2014/2015 academic sessions (Federal Ministry of
Education).
Table 3. 11: Distribution of Teaching Staff in Institutions by Sex and Year
Institution 2013/2014 2014/2015 2015/2016
M F % F M F % F M F % F
Public
Primary
282,096 233,305 45.27 293,019 274,361 48.36 283,051 259,482 47.83
Junior
Secondary
163,543 165,216 50.25 127,331 145,810 53.38 152,623 139,457 47.75
Senior
Secondary
235,500 215,808 47.82 339,454 372,090 52.29 350,323 328,836 48.42
Polytechnic 9,839 2,559 20.64 12,663 3,360 20.97 NA NA NA
College of
Education
13,924 5,031 26.54 14,176 5,480 27.88 NA NA NA
Source: Nigeria Digest of Education Statistics, Federal Ministry of Education

24
CHAPTER 4: WORK Key Findings
▪ The percentage of men employed in the State Civil Service from 2014 to 2015 was
higher than the percentage of women for both senior and junior positions. The average
percentage of women employed in State Civil service from 2010 to 2015 in each
category (junior and senior) was 38.16 per cent, while it was 68.84 per cent for men.
▪ Also, in federal MDAs men dominated, women on grade level 01 – 17 plus Special
grade level was below 42 per cent in 2014 – 2016.
Introduction
Women constitute roughly half of Nigerian’s population and thus potentially half of its
workforce. As a group, they do as much work as men if not more. However, the types of
work they do , the condition under which they work, and their access to opportunities for
advancement differ from men’s. Women are, often, disadvantaged compared to men in
access to employment opportunities and in conditions of work; furthermore, many women
forgo or curtail employment because of family responsibilities. The removal of obstacles
and inequalities that women face with respect to employment is a step towards realizing
women’s potential in the economy and enhancing their contribution to economic and social
development. The Beijing Declaration affirms national commitment to the inalienable
rights of women and girls and their empowerment and equal participation in all spheres of
life including the economic domain6. Also, Goal 8, target 8.5 of the Sustainable
Development Goals (SDG) is to achieve full and productive employment and decent work
for all women and men( including for young people and persons with disabilities), as well
as equal pay for work of equal value by 2030.
A. Women and Men in State and Federal Civil Service Women’s representation in the civil service was among the concerns raised in the Beijing
Platform for Action. This report is limited to the available data from State Civil Service
Commissions; and Federal Ministries, Department and Agencies (MDAs).
1. Employment in State Civil Service by Category
The available data from State Civil Service Commissions shows that the percentage of men
employed in the State Civil Service for the reference period was higher than that of women
for both senior and junior positions. The percentage of men employed in junior positions
6 United Nations, 1995
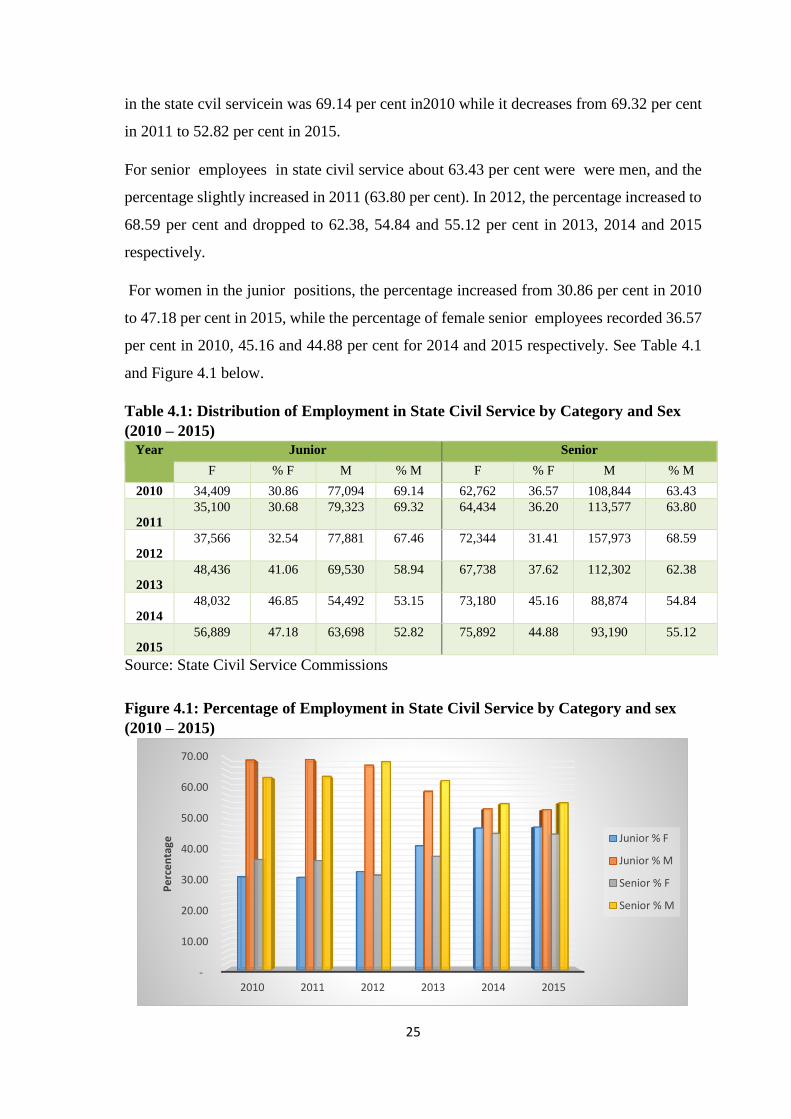
25
in the state cvil servicein was 69.14 per cent in2010 while it decreases from 69.32 per cent
in 2011 to 52.82 per cent in 2015.
For senior employees in state civil service about 63.43 per cent were were men, and the
percentage slightly increased in 2011 (63.80 per cent). In 2012, the percentage increased to
68.59 per cent and dropped to 62.38, 54.84 and 55.12 per cent in 2013, 2014 and 2015
respectively.
For women in the junior positions, the percentage increased from 30.86 per cent in 2010
to 47.18 per cent in 2015, while the percentage of female senior employees recorded 36.57
per cent in 2010, 45.16 and 44.88 per cent for 2014 and 2015 respectively. See Table 4.1
and Figure 4.1 below.
Table 4.1: Distribution of Employment in State Civil Service by Category and Sex
(2010 – 2015)
Year Junior Senior
F % F M % M F % F M % M
2010 34,409 30.86 77,094 69.14 62,762 36.57 108,844 63.43
2011
35,100 30.68 79,323 69.32 64,434 36.20 113,577 63.80
2012
37,566 32.54 77,881 67.46 72,344 31.41 157,973 68.59
2013
48,436 41.06 69,530 58.94 67,738 37.62 112,302 62.38
2014
48,032 46.85 54,492 53.15 73,180 45.16 88,874 54.84
2015
56,889 47.18 63,698 52.82 75,892 44.88 93,190 55.12
Source: State Civil Service Commissions
Figure 4.1: Percentage of Employment in State Civil Service by Category and sex
(2010 – 2015)
-
10.00
20.00
30.00
40.00
50.00
60.00
70.00
2010 2011 2012 2013 2014 2015
Pe
rce
nta
ge Junior % F
Junior % M
Senior % F
Senior % M

26
2: Distribution of Employment in State Civil Service by Grade Level,
Year and Sex
From Table 4.2 below as recorded by the available data from State Civil Service
Commissions, where men dominated at grade level 15 – 17 and and the special scale (2014
– 2016). The percentage of men in grade level 15 – 17 ranges from 50 to 51.5 per cent for
the reference period while that of women of the same grade level 15 – 17 was below 50 per
cent (about 49 per cent). For the special level, men recorded over 88.57 per cent in 2014,
84.30 per cent in 2015 and 79.55 in 2016. The percentage of women at the special grade
was 11.43 in 2014, it increased in 2015 to 15.70 per cent and 20.45 per cent in 2016.
Table 4.2: Distribution of Employment in State Civil Service by Grade Level, Year
and Sex
Grade Level
2014 2015 2016
M F % F M F % F M F % F
01 - 06 28,435 30,621 51.85 31,328 30,254 49.13 20,425 26,123 56.12
07 - 10 30,185 43,756 59.18 54,389 34,573 38.86 25,303 32,489 56.22
12 - 14 22,943 26,471 53.57 37,818 22,138 36.92 21,261 24,344 53.38
15 - 17 14,147 14,028 49.79 15,427 14,960 49.23 15,448 14,553 48.51
Special
Grade
1,480 191 11.43 612 114 15.70 455 117 20.45
Total 97,190 15,067 54.21 39,574 02,039 2.23 2,892 7,626 54.08
Source: State Civil Service Commissions
3. Employment in Federal MDAs by Grade Level and Sex (2014 – 2016)
Available data on employment in MDAs showed that men dominated in Federal MDAs.
Women on grade level 01 – 17 plus the special grade level was below 42 per cent in the
reference period. For grade level 15 – 17 the percentage of women increased slightly from
23.79 per cent in 2014 to 24.31 in 2015 and to 25.61 per cent in 2016. See Table 4.3 below.
Table 4.3: Distribution of Employment in Federal MDAs by Grade Level and Sex
Grade
Level
2014 2015 2016
M F % F M F % F M F % F
01 - 06 15,141 6,105 28.73 13,215 5,631 29.88 14,324 5,390 27.34
07 - 10 32,961 19,809 37.54 28,774 20,540 41.65 34,054 20,187 37.22
12 - 14 12,352 5,809 31.99 12,624 6,213 32.98 12,522 6,246 33.28
15 - 17 3,107 970 23.79 3,689 1,185 24.31 3,790 1,305 25.61
Special
Grade
52 12 18.75 56 12 17.65 56 9 13.85
Total 63,613 32,705 33.96 58,358 33,581 36.53 64,746 33,137 33.85
Source: Federal MDAs

27
CHAPTER 5: POWER AND DECISION MAKING
Key Findings
▪ Women have never been the president or the vice President in the history of Nigeria.
▪ Representation at National Parliament was 94.71 per cent male and 5.76 per cent
female from 1999-2015.
▪ Female and male constituted 5.50 per cent and 94.50 percent of the Upper House
respectively.
▪ The percentages of female and male in the Lower House were 5.83 per cent and 94.17
per cent respectively.
▪ Judges at the federal court were 29.38 per cent female and 70.62 per cent male.
▪ Representation at the State Assemblies recorded 5.29 per cent female and 94.71 per
cent male.
▪ LGA Chairpersons were 9 per cent female and 91 per cent male from 1999 – 2015.
▪ Councilors were 94.1 per cent male and 5.9 per cent female.
Introduction From antecedents, men have been predominant and still dominate the world of politics.
Though, Marginalization of women is contributed by patriarchy, poverty, illiteracy,
religious and cultural norms. The Universal Declaration of Human Rights recognizes the
right of every individual to take part in the government of his or her country7. Equal access
to power, decision making and leadership at all levels is necessary for a proper and
effectively functioning democracy. The SDG Goal 5, also ensures women’s full and
elective participation as well as equal opportunities for leadership at all levels of decision-
making in political, economic and public life.
This chapter provides an assessment of the current situation as well as recent trends of the
participation of women and men in positions of power and decision making across the
country. The chapter covers three main areas-- politics and governance in the Executive,
Legislature and Judiciary.
A. Politics and Governance The high-leveled disparities between the population of men and women in the domain of
politics and decision-making limit women’s political, social and economic opportunities.
The gender inequity in the domains statsed above is owing to the limited number of female
participation in goverments, especially, where key policy decisions are made and resource
allocations are decided. Women have continued to suffer in all facet of politics and
7 United Nations, 1996 Article 21

28
leadership positions, despite the recognition of the importance of women’s political
empowerment within the framework of the SDGs.
1. Executives
1a. Representation in Executive Arm of Government Since independence, Nigerian political strides have improved significantly, with male being
the major actors. Though, Nigeria is running her 5th democratic administration since its
emergence in 1999. Women had rarely been well represented in any of the three arms of
government, as he topmost decision-making bods are still dominated by men. It is
becoming a norm that men paly the most important roles in politics, particularly at the
federal level with regards to the position of president, vice presidents and secretary to the
government of the federation as well as appointive ministerial positions. Below are tables
showing these findings.
Table 5.1: Distribution of Number Occupying Elective Position as President and
Vice President in the Executive Arm and Number of Available Seat (1999 – 2015)
Position 1999-2003 2003-2007 2007-2011 2011-2015 2015 -
No. of
Seat
Available
% F No. of
Seat
Availab
le
% F No. of
Seat
Availa
ble
% F No. of
Seat
Availa
ble
% F No. of
Seat
Availa
ble
% F
President 1 0 1 0 1 0 1 0 1 0
Vice
President
1 0 1 0 1 0 1 0 1 0
Source: Office of Secretary to the Government of Federation (OSGF)
Table 5.1 above clearly shows the current statuesque, with regards to gender representation
as president or vice President, with all the positions held by men.
1b. Appointive Ministerial Political Position
Appointive positions cut across the three levels of government, that is, the federal, state and
local government. However, available data allows us to focus the report only on the
ministerial appointees at the federal level of government.
Table 5.2 and Figure 5.1 below show that of a total of 341 ministers that served from 1999-
2015, only 47 (14 per cent) were female, while 294 (86 per cent) were male which is an
indication that male are also dominating in appointive positions. Though the number of
females appointed as ministers in 2011 slightly increased, 2003 appointments recorded the
lowest number of female representation.
Table 5.2: Appointive Ministerial Political Position by Sex (1999 – 2015)
1999 2003 2007 2011 2015
M F M F M F M F M F

29
89 11 38 4 83 12 53 15 31 5
Source: NCWD/NBS Collation of data on Women and Men.
Figure 5.1: Appointive Ministerial Political Position by Sex (1999-2015)
1c. Secretary to the Government of the Federation Representation as the secretary to the government of the federation also has not been
unequal between genders as shown in Table 5.3. Available data shows that women have
never been appointed as a secretary to the government of the federation since independence.
Table 5.3: Summary Distribution of Secretaries to the Government of the Federation
from 1999 – 2015
Sex 1999 -2007 2007 – 2008 2008 - 2011 2011 – 2015
Male 1 1 1 1
Female 0 0 0 0
Source: Office of Secretary to the Government of Federation (OSGF)
1d. Representation at State Executives
Nigeria as an entity runs federal system of government with a replica of similar structure in
the state and local governments.
Available data showing the representation of women, as governors or deputies governors
is still low compared to the number of candidates who showed interest at candidacy level
0
10
20
30
40
50
60
70
80
90
M F M F M F M F M F
1999 2003 2007 2011 2015
SEX

30
in various states. Table 5.4 and Figure 5.2 below shows the representation profile of women
and men.
Table 5.4: Summary Table of Female Representation as Governor and Deputy
Governor by Year
Office
1999 2003 2007 2011 2015
F M F M F M F M F M
Governor 0 36 0 37 0 40 0 41 0 36
Deputy Governor 0 36 3 36 4 35 8 39 6 33
Source: NCWD/NBS Collation of data on women and men.
Women within the years under review had not been governors in any of the states of the
federation, but few had been elected as deputy governors in 2003, 2007, 2011 and 2015.
Female had the highest representation (of 8 deputy governors) in 2011, which decreased to
6 in 2015.
Figure 5.2: Female Representation as Governor and Deputy Governor by Year
1e. Representation at the Local Government Executive
Local government is the third level of government administration in Nigeria and it was
created to enable the government to get closer to the people. However, recently this
intended way of power distributionhas become ineffective since some state government did
not conduct elections due to various emerging reasons put forward by some of the states.
Also, most local governments had only caretaker chairpersons running the affairs.
Consequently, it has led to staggering election dates in almost all the states of the federation.
0
10
20
30
40
50
F M F M F M F M F M1999
20032007
20112015
Governor
Deputy Governor

31
Due to these reasons, the entire representation at various states was put together for an
overview of the statuesque of representation at the local government. See ST. 5.2 in the
Appendix.
Figure 5.3: Percentage Representation of Local Chairpersons by Sex (1999 – 2015)
The above chart shows that more male were elected or appointed to the positions of local
government chairperson than female. The representation of female stood at about 9 per cent
and the percentage of male was 91 per cent, which indicates that male is still more
representative than female even at the grassroots.
Note: No data was accessible for some states like Akwa-Ibom, Anambra, Bayelsa, Edo, Gombe, Ogun,
Ondo and Taraba State for the years under review.
2. Legislator
2a. Representation at the National Parliament Women population is estimated to account for half of the total electorate population,
entitled to vote and be voted for, and to public office. Representation at the National
Parliamnent is currently measured as the proportion of seats held by women in the lower
and upper-houses of the National Assembly.
From the return of democracy in 1999 to the latest election in 2015, women had the highest
representation of 7.2 per cent in 2007-2011 and the lowest of 3.2 per cent in 1999-2003 for
both houses. (See Table 5.5 below).
F, 9.04%
M, 90.96%

32
Table 5.5: Representation in National Parliament by Year and Sex
Legislator
1999-2003 2003-2007 2007-2011 2011-2015 2015-2019
Number % Number % Number % Number % Number %
SENATE
Male 106 97.2 106 97.2 100 91.7 102 93.6 101 92.7
Female 3 2.8 3 2.8 9 8.3 7 6.4 8 7.3
Total 109 100 109 100 109 100 109 100 109 100
HOUSE OF REPS.
Male 348 96.7 339 94.2 335 93.1 336 93.3 337 93.6
Female 12 3.3 21 5.8 25 6.9 24 6.7 23 6.4
Total 360 100 360 100 360 100 360 100 360 100
BOTH HOUSES
Male 454 96.8 445 94.9 435 92.8 438 93.4 438 93.4
Female 15 3.2 24 5.1 34 7.2 31 6.6 31 6.6
Total 469 100 469 100 469 100 469 100 469 100
Source: National Assembly, Abuja
Table 5.6 below shows that the principal officers at the senate in 2003, 2007 and 2011 had
no female representative. A total of 4 female principal officers were recorded in 1999 and
1 recorded in 2015.
Female held the position of deputy minority leader and chief whip in 1999 as well as two
deputy minority whips that emerged at different times between 1999 and 2003. While only
one female got elected to the postition of a deputy minority whip in 2015.
Table 5.6: Elected Principal Officers at the Senate by Office, Sex and Year
Source: NCWD/NBS Collation of data on women and men.
OFFICE 1999 2003 2007 2011 2015
F M F M F M F M F M
Senate President 0 3 0 2 0 1 0 1 0 1
Deputy Senate President 0 2 0 1 0 1 0 1 0 1
Majority Leader 0 3 0 1 0 1 0 1 0 1
Deputy Majority Leader 0 2 0 1 0 1 0 1 0 1
Minority Leader 0 2 0 1 0 1 0 1 0 1
Deputy Minority Leader 1 1 0 1 0 1 0 1 0 1
Chief Whip 1 1 0 2 0 1 0 1 0 1
Deputy Chief Whip 0 3 0 2 0 1 0 1 0 1
Minority Whip 0 2 0 2 0 1 0 1 0 1
Deputy Minority Whip 2 0 0 1 0 1 0 1 1 0

33
2b. Representation in State Houses of Assembly
Table 5.7 and Figure 5.4 illustrate the representation of women and men in state assemblies.
Like in the National Parliament, the number of men far outweighs the number of women in
the State House of Assemblies.
Table 5.7: Representation at State Assemblies by Sex from 1999-2015
Legislator 1999 2003 2007 2011 2015
F M F M F M F M F M
22 771 30 710 43 663 58 650 37 659
Percentage 2.8 97.2 4.1 95.9 6.1 93.9 8.2 91.8 5.3 94.7
Source: NCWD/NBS Collation of data on women and men.
In 2011, female representation at states assemblies was 58, the highest record from 1999 to
2015, and it has an increasing trend as it recorded 22, 30 and 43 in 1999, 2003 and 2007
respectively. However, the figure dropped in 2015 from 58 in 2011 to 37. The chart below
(Figure 5.4) gives the percentage representation.
Figure 5.4: Percentage Representation of Honorable Members at the State Houses of
Assembly
2c. Representation of Principal Officers in State Assemblies by
Positions, Year and Sex A total of 72 elected female officers (out of 1,005 officers in total) were recorded in 2011-
2015, which was the highest figure of female representation in state assemblies within the
reviewing perioid. While the lowest number of female principal officers, of 21, was
recorded in 1999-2003. Also the figure was recorded 64, 57 and 48 for 2003-2007, 2007-
2.77
97.23
4.05
95.95
6.09
93.91
8.19
91.81
5.32
94.68
0.00 20.00 40.00 60.00 80.00 100.00 120.00
F
M
F
M
F
M
F
M
F
M
19
99
20
03
20
07
20
11
20
15
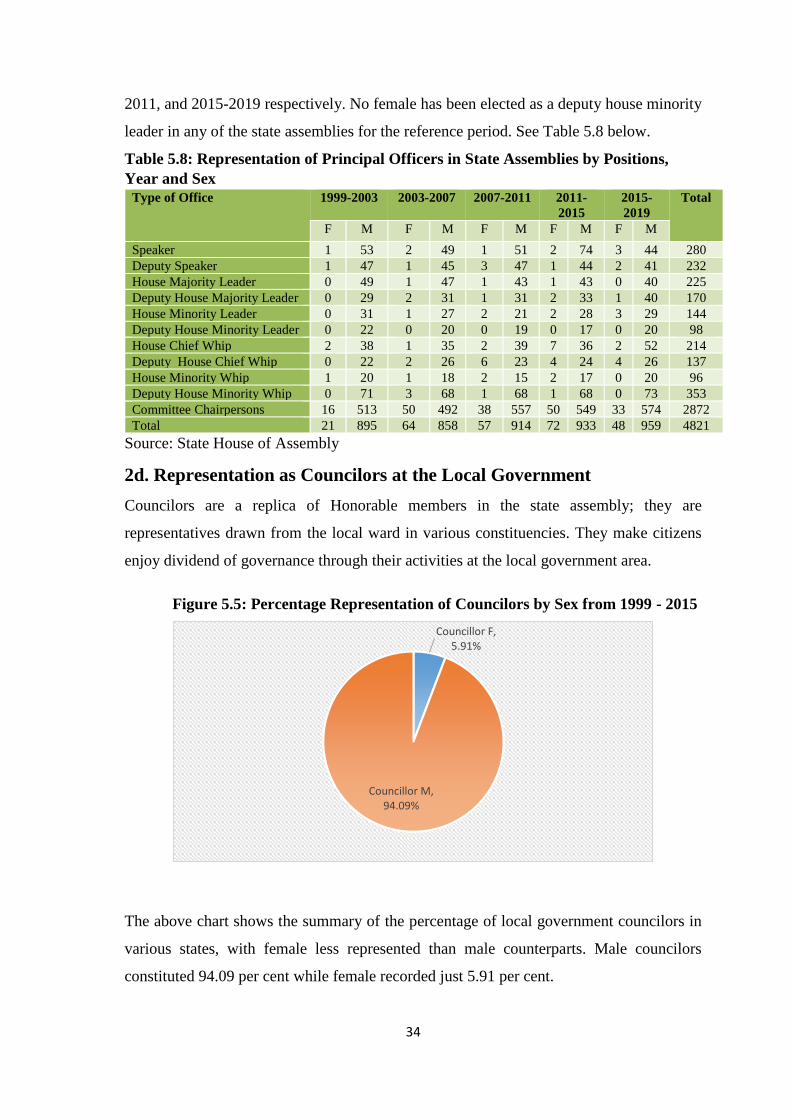
34
2011, and 2015-2019 respectively. No female has been elected as a deputy house minority
leader in any of the state assemblies for the reference period. See Table 5.8 below.
Table 5.8: Representation of Principal Officers in State Assemblies by Positions,
Year and Sex
Type of Office 1999-2003 2003-2007 2007-2011 2011-
2015
2015-
2019
Total
F M F M F M F M F M
Speaker 1 53 2 49 1 51 2 74 3 44 280
Deputy Speaker 1 47 1 45 3 47 1 44 2 41 232
House Majority Leader 0 49 1 47 1 43 1 43 0 40 225
Deputy House Majority Leader 0 29 2 31 1 31 2 33 1 40 170
House Minority Leader 0 31 1 27 2 21 2 28 3 29 144
Deputy House Minority Leader 0 22 0 20 0 19 0 17 0 20 98
House Chief Whip 2 38 1 35 2 39 7 36 2 52 214
Deputy House Chief Whip 0 22 2 26 6 23 4 24 4 26 137
House Minority Whip 1 20 1 18 2 15 2 17 0 20 96
Deputy House Minority Whip 0 71 3 68 1 68 1 68 0 73 353
Committee Chairpersons 16 513 50 492 38 557 50 549 33 574 2872
Total 21 895 64 858 57 914 72 933 48 959 4821
Source: State House of Assembly
2d. Representation as Councilors at the Local Government
Councilors are a replica of Honorable members in the state assembly; they are
representatives drawn from the local ward in various constituencies. They make citizens
enjoy dividend of governance through their activities at the local government area.
Figure 5.5: Percentage Representation of Councilors by Sex from 1999 - 2015
The above chart shows the summary of the percentage of local government councilors in
various states, with female less represented than male counterparts. Male councilors
constituted 94.09 per cent while female recorded just 5.91 per cent.
Councillor F, 5.91%
Councillor M, 94.09%

35
NOTE: Data from the following state is not included due to inaccessibility: Abia, Adamawa, Anambra,
Bayelsa, Borno, Edo, Gombe, Imo, Kaduna, Kogi, Lagos, Ogun, Ondo, Osun, Oyo, Taraba and Yobe.
3. Judiciary
3a. Representation of Judges at Federal Courts
The Judiciary is the third arm of government; it ensures logical interpretation of the
constitution as they prevent the integrity and protection of human rights from being abused.
The judiciary exists at the federal, state and local levels.
Table 5.9: Number of Judges in Federal Court by Court, Year and Sex
Court 2011 2012 2013 2014 2015 2016
M F M F M F M F M F M F
Supreme Court Of Nigeria 11 3 13 3 13 3 13 3 14 3 11 4
Court Of Appeal 48 17 52 19 49 17 63 25 61 26 53 26
Federal High Court 43 16 40 15 45 20 38 17 36 17 57 23
National Industrial Court 5 3 5 3 11 9 11 9 11 8 11 8
Source: National Judicial Council
Male judges are more prevalent than female judges in all the federal courts. The Supreme
Court had only 3 female judges in each year (2011 to 2015), and in 2016 the number
increased to 4. The Court of Appeal had more female representation with 17 female judges
recorded in 2011 and 2013, and the number increased in 2014 to 2016 from 25 to 26 judges.
The Federal High Court recorded16, 15, and 20 female judgets for the year of 2011, 2012
and 2013 respectively, and the number saw an increase from 17 to 23 from 2014 to 2016.
The national Industrial Court had 3 female judges for 2011 and 2012, 9 for 2013 and 2014,
and 8 recorded in 2015 and 2016. The share of male judges in federal courts from 2011 to
2016 was 70.62 per cent while the percentage of women judges was 29.38 per cent. See
Table 5.9 above and Figure 5.6 below.

36
Figure 5.6: Percentage distribution of Judges in Federal Court by Sex (2011- 2016)
3b. National Judicial Officers by Position, Sex and Year According to Table 5.10 below, no female had been the President of National Industrial
Court or the Chief Registrar of Supreme Court from 2013 to 2016. One female held the
position of the Chief Justice of Nigeria in 2013. Female had a constant representation as
Justice of Supreme Court from 2013 to 2016 (3 in every year).
Table 5.10: Number of National Judicial Officers by Position, Sex and Year
Source: National Judicial Council
B. Civil and Public Service
Women’s representation in decision-making positions in the Civil and Public Service is
among the concerns raised in Beijing Platform for Action. The limited information
M, 70.62%
F, 29.38%
Position 2013 2014 2015 2016
F M F M F M F M
Chief Justice of Nigeria 1 0 0 1 0 1 0 1
Justice of Supreme Court 3 12 3 12 3 13 3 10
President of Court of Appeal 1 0 1 0 1 0 1 0
Justices of Court of Appeal 16 49 24 64 25 61 25 53
President of National Industrial Court 0 1 0 1 0 1 0 1
Judges of National Industrial Court 9 10 9 10 8 10 8 10
Chief Judges of High Courts 10 29 11 28 10 29 11 28
Judges of High Courts 212 478 205 445 214 445 228 486
Chief Registrar of Supreme Court 0 1 0 1 0 1 0 1

37
available to assess levels and trends poses challenges to addressing gender disparities in
these areas.
1. Top Government Officials and Senior Administrators
Available data from National Center for Women Development (NCWD) and National
Bureau of Statistics (NBS) publication shows that women are underrepresented among
high-ranking government administrators with decision making power, as shown in Table
5.11.
Table 5.11: Top Government Officials and Senior Administrator,
1999-2015
Position M % M F % F
Head of Service 9 75 3 25
Permanent Secretary 95 86 15 14
Special Adviser 27 77 8 23
Special Assistant 98 72 38 28
Central Bank Governors 4 100 0 0
Chief Executive Officer 307 87 44 13
Director General 114 90 12 10
Executive Secretary 29 78 8 22
Source: NCWD/NBS Collation of data on women and men.
The highest representation of women among high-ranking government administrators with
decision-making powers was in the position of Special Assistant, which recorded 28 per
cent, followed by Head of Service (25 per cent) and Special Advisers (23 per cent). Also,
no woman has been nominated as the Central Bank Governor. See Table 5.11 above.
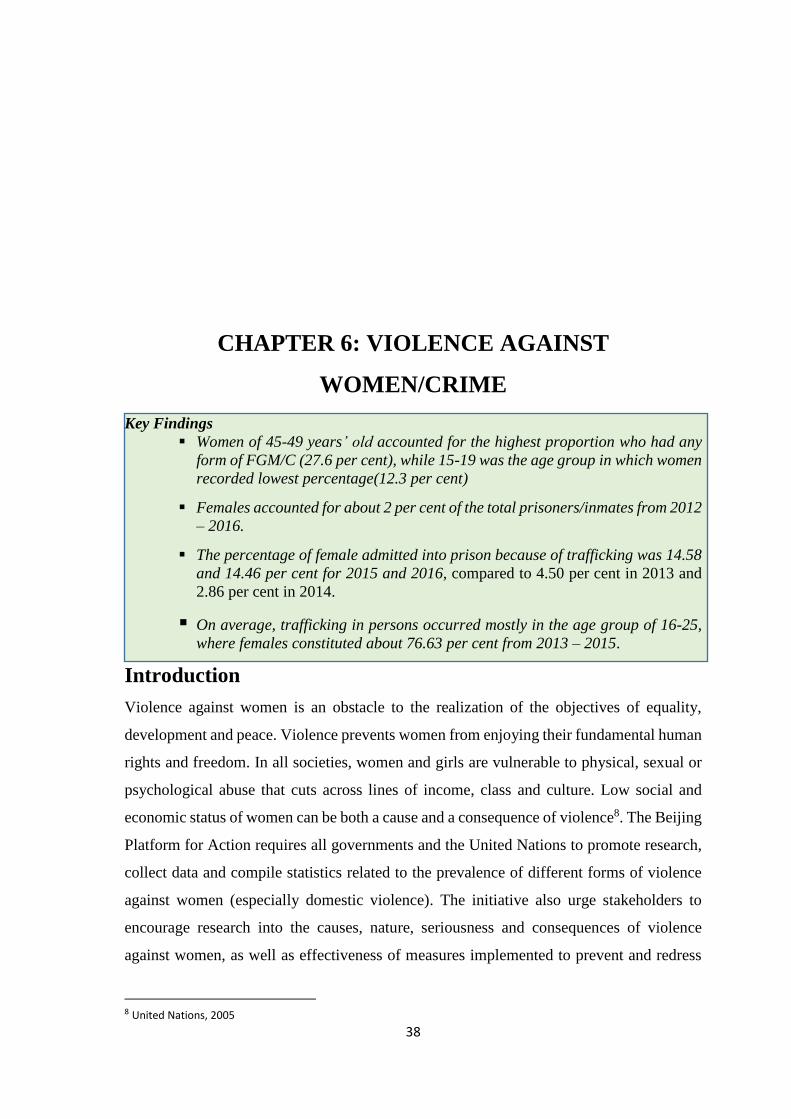
38
CHAPTER 6: VIOLENCE AGAINST
WOMEN/CRIME
Key Findings
▪ Women of 45-49 years’ old accounted for the highest proportion who had any
form of FGM/C (27.6 per cent), while 15-19 was the age group in which women
recorded lowest percentage(12.3 per cent)
▪ Females accounted for about 2 per cent of the total prisoners/inmates from 2012
– 2016.
▪ The percentage of female admitted into prison because of trafficking was 14.58
and 14.46 per cent for 2015 and 2016, compared to 4.50 per cent in 2013 and
2.86 per cent in 2014.
▪ On average, trafficking in persons occurred mostly in the age group of 16-25,
where females constituted about 76.63 per cent from 2013 – 2015.
Introduction
Violence against women is an obstacle to the realization of the objectives of equality,
development and peace. Violence prevents women from enjoying their fundamental human
rights and freedom. In all societies, women and girls are vulnerable to physical, sexual or
psychological abuse that cuts across lines of income, class and culture. Low social and
economic status of women can be both a cause and a consequence of violence8. The Beijing
Platform for Action requires all governments and the United Nations to promote research,
collect data and compile statistics related to the prevalence of different forms of violence
against women (especially domestic violence). The initiative also urge stakeholders to
encourage research into the causes, nature, seriousness and consequences of violence
against women, as well as effectiveness of measures implemented to prevent and redress
8 United Nations, 2005

39
violence against women. Goal 16 of the Sustainable Development Goal (SDGs) promotes
peaceful and inclusive societies which provide access to justice for all and build effective,
accountable and inclusive institutions at all levels.
A. Prevalence and Incidence of Violence Against Women
1. Female Genital Mutilation/Cutting (FGM/C)
Female Genital Mutilation/Cutting or FGM/C is a cultural practice involving the
ceremonial circumcision of a female child. Though the ceremony can be carried out at any
age, it is mostly done before a female child attains the age of 5 years. This practice has been
widely criticized due to its immediate and long-term medical implications to the well being
of the female and her reproductive health. Therefore,FGM/C is considered violence against
women because it is a breach on the right of women.
Available statistical data from MICS5, 2016/2017 indicated that women in the 45-49 age
group had the highest percentage who had any form of FGM/C (27.6 per cent), while
women between 15-19 year’s old had the lowest percentage (12.3 per cent). See Figure
6.1.
Figure 6.1: Percentage of women age 15 -49 who had any form of FGM/C, 2016/17
B. Prison Inmates/Offenders
1. Number of Prison Inmates by Sex (2012 – 2016)
The number ofprison inmates kept increasing in the period under reference (2012-2016)
with the majority being male. The available data from the Nigerian Prisons Service
indicates that about 2 per cent were female prisoners/inmates within the five-yeas period.
(See Table 6.1 below).
12.3
15.4
16.9
20.1
21.3
24.4
27.6
0.0 5.0 10.0 15.0 20.0 25.0 30.0
15-19
20-24
25-29
30-34
35-39
40-44
45-49
Percentage of women who hadany form of FGM/C

40
Table 6.1: Number of Prison Inmates by Year and Sex
Year Male Female % Female
2012 51,161 975 1.87
2013 54,151 885 1.61
2014 54,933 1,103 1.97
2015 63,668 1,365 2.10
2016 67,329 1,357 1.98
TOTAL 291,242 5,687 1.92
Source: Nigerian Prisons Service
2. Prison Admission by Type of Offence (2013 – 2016)
The percentage of male admitted into prison for any type of offence was about 95.1 per
cent while that of female was about 4.9 per cent in both 2013 and 2014. However, the
percentage of female admission into prison increased to 5.3 per cent in 2015 and it was
recorded 4.5 per cent in 2016. See Figure 6.2.
Prison admission for stealing was higher throughout the reference period compared to other
offences that were listed in Table 6.2 below. , It was about 95 per cent for male and about
5 per cent for female. Percentage of female admitted into prison because of trafficking was
14.58 and 14.46 per cent for 2015 and 2016 respectively, compared to 4.50 per cent in 2013
and 2.86 per cent in 2014. See Table 6.2 below.
Figure 6.2: Percentage of Prison Admission by Sex (2013 – 2016)
95.1 95.1 94.7 95.5
4.9 4.9 5.3 4.5
0.0
20.0
40.0
60.0
80.0
100.0
120.0
2013 2014 2015 2016
M
F

41
Table 6.2: Distribution of Prison Admission by Type of Offences and Sex
(2013 – 2016) Type of
Offence
2013 2014 2015 2016
M F % F M F % F M F % F M F % F
Debt 618
28
4.33
884
50
5.35
642
13
1.98
712
39
5.19
Arson
685
14
2.00
777
31
3.84
730
40
5.19
611
48
7.28
Affray 1,000
12
1.19
844
20
2.31
1,375
183
11.75
1,010
27
2.60
Assault
8,301
681
7.58
7,128
529
6.91
8,177
603
6.87
9,411
343
3.52
Murder 6,852
320
4.46
8,153
407
4.75
8,509
314
3.56
8,141
361
4.25
Treason
387
44
10.21
349
9
2.51
214
22
9.32
278
15
5.12
Sedition 183
5
2.66
162
8
4.71
34
2
5.56
86
4
4.44
Abduction
1,610
79
4.68
1,286
63
4.67
1,094
101
8.45
1,344
112
7.69
Smugging 621
15
2.36
525
15
2.78
406
18
4.25
663
20
2.93
Immigration
623
15
2.35
520
24
4.41
243
22
8.30
288
23
7.40
Stealing 47,689
2,747
5.45
44,385
2,491
5.31
36,051
2,249
5.87
45,201
2,501
5.24
Robbery
12,920
296
2.24
8,223
282
3.32
9,207
252
2.66
10,969
289
2.57
Armed
Robber
11,661
197
1.66
9,987
262
2.56
9,659
54
0.56
5,871
322
5.20
Sex Offences
5,666
131
2.26
4,284
152
3.43
3,603
183
4.83
4,003
145
3.50
Traffic
Offence
3,023
65
2.10
1,758
48
2.66
1,040
46
4.24
1,058
41
3.73
Currency
Offence
2,662
100
3.62
772
11
1.40
672
10
1.47
423
23
5.16
Indian Hamp
Offences
4,225
128
2.94
6,844
216
3.06
4,205
197
4.48
7,201
206
2.78
Contempt of
Court Offence
3,784
127
3.25
3,523
169
4.58
3,257
178
5.18
4,186
182
4.17
Unlawful
Possession of
Arms
2,623
93
3.42
2,564
49
1.88
2,846
92
3.13
3,654
82
2.19
Forgery and
Altering
1,587
19
1.18
979
18
1.81
924
38
3.95
1,641
44
2.61
Escaping from
Lawful
Custody
504
4
0.79
456
-
181
1
0.55
202
2
0.98
Offences
against Native
Law and
custom
526
10
1.87
591
19
3.11
148
1
0.67
230
6
2.54

42
Unlawful
Possession of
prop
1,481
27
1.79
1,870
39
2.04
1,532
27
1.73
1,644
36
2.14
Economic
sabotage
662
30
4.34
84
7
7.69
132
-
186
5
2.62
Human
Trafficking
212
10
4.50
306
9
2.86
41
7
14.58
71
12
14.46
Criminal
lunatic
31
-
61
-
83
-
106
9
7.83
Cultism/Ritual 255 - 77 2 1.12 243 - 401 2 .50
Breach of
peace
233
1
0.43
675
20
2.88
523
8
1.51
948
26
2.67
Other Offence 30,428 2,646 8.00 23,841 1,884 7.32 22,365 1,988 8.16 25,942 1,442 5.27
Total 51,052 7,844 4.94 132,008 6,834 4.92 118,136 6,649 5.33 36,481 6,367 4.46
Source: Nigerian Prisons Service.
C. Trafficking in Persons
1. Number of Trafficked Persons by Age Group, Year and Sex
Table 6.3 below, displays trafficked persons by age group and sex from 2013-2015. Overall,
the number of trafficked females was48.65 per cent in 2013 and 49.42 per cent in 2014, and
it reached its highest in 2015 (76.38 per cent). On the average, trafficking in persons
occurred mostly in the age bracket 16 - 25 where females constituted 76.52 per cent
followed by age group 26-35 where women accounted for 74.36 per cent for the reference
period. Trafficking in persons who are below 5 reduced in 2015, with19 female and 20 male
recorded, compared to 2014 which was 28 and 26 for female and male respectively.
Table 6.3: Number of Trafficked Persons by Age Group, Year and Sex
Age group
2013 2014 2015
F M % F F M % F F Male % F
0 – 5 3 9 25.00 28 26 51.85 19 20 48.72
6 – 15 156 351 30.77 180 393 31.41 214 108 66.46
16 – 25 275 133 67.40 259 88 74.64 358 51 87.53
26 – 35 40 15 72.73 38 11 77.55 75 28 72.82
36 & above 13 6 68.42 2 1 66.67 10 2 83.33
Total 487 514 48.65 507 519 49.42 676 209 76.38
Source: NAPTIP
2. Number of Identified Victims of Trafficking for Prostitution by Age,
Sex and Year
Females in the age group of 18-27 were trafficked the most throughout the reference period,
and the number was recorded 202 in 2013 but reduced to 141 in 2014 and increased again
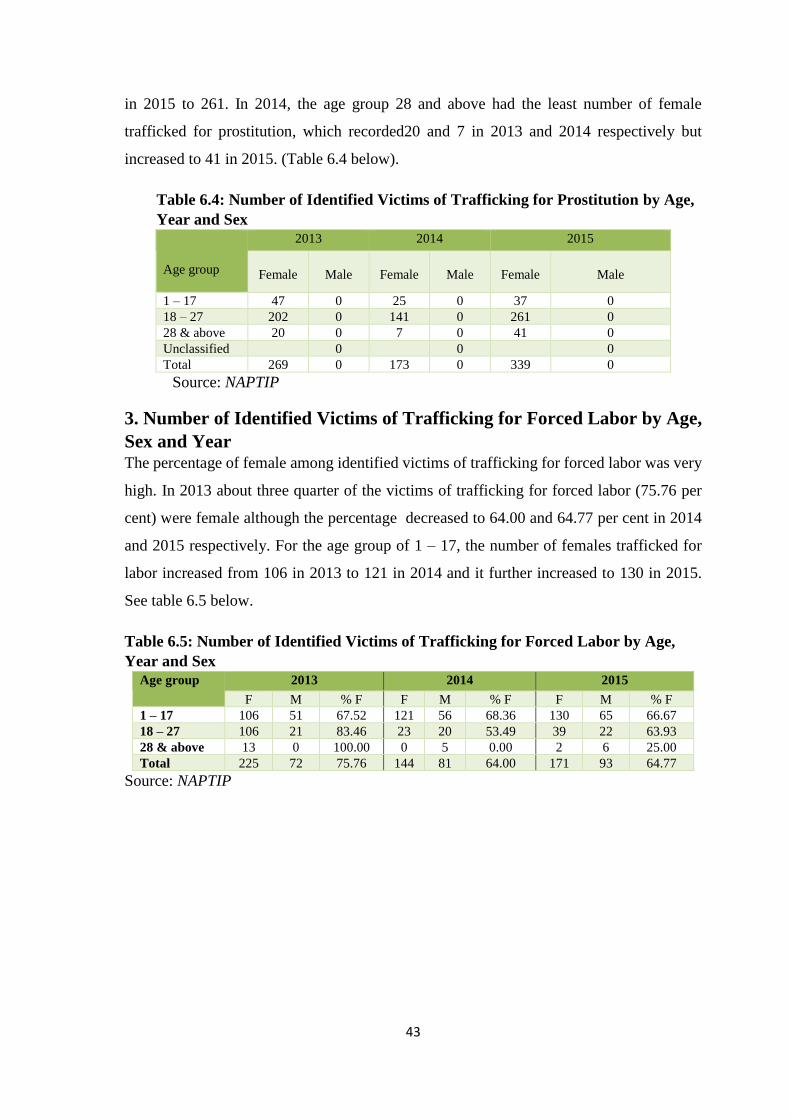
43
in 2015 to 261. In 2014, the age group 28 and above had the least number of female
trafficked for prostitution, which recorded20 and 7 in 2013 and 2014 respectively but
increased to 41 in 2015. (Table 6.4 below).
Table 6.4: Number of Identified Victims of Trafficking for Prostitution by Age,
Year and Sex
Age group
2013 2014 2015
Female
Male
Female
Male
Female
Male
1 – 17 47 0 25 0 37 0
18 – 27 202 0 141 0 261 0
28 & above 20 0 7 0 41 0
Unclassified
0
0
0
Total 269 0 173 0 339 0
Source: NAPTIP
3. Number of Identified Victims of Trafficking for Forced Labor by Age,
Sex and Year The percentage of female among identified victims of trafficking for forced labor was very
high. In 2013 about three quarter of the victims of trafficking for forced labor (75.76 per
cent) were female although the percentage decreased to 64.00 and 64.77 per cent in 2014
and 2015 respectively. For the age group of 1 – 17, the number of females trafficked for
labor increased from 106 in 2013 to 121 in 2014 and it further increased to 130 in 2015.
See table 6.5 below.
Table 6.5: Number of Identified Victims of Trafficking for Forced Labor by Age,
Year and Sex
Age group 2013 2014 2015
F M % F F M % F F M % F
1 – 17 106 51 67.52 121 56 68.36 130 65 66.67
18 – 27 106 21 83.46 23 20 53.49 39 22 63.93
28 & above 13 0 100.00 0 5 0.00 2 6 25.00
Total 225 72 75.76 144 81 64.00 171 93 64.77
Source: NAPTIP
44
STATISTICAL ANNEXES
STATISTICAL TABLES Population
ST 1.1: Nigeria Projected Population by Special Age Group Year and sex, 2013 – 2016
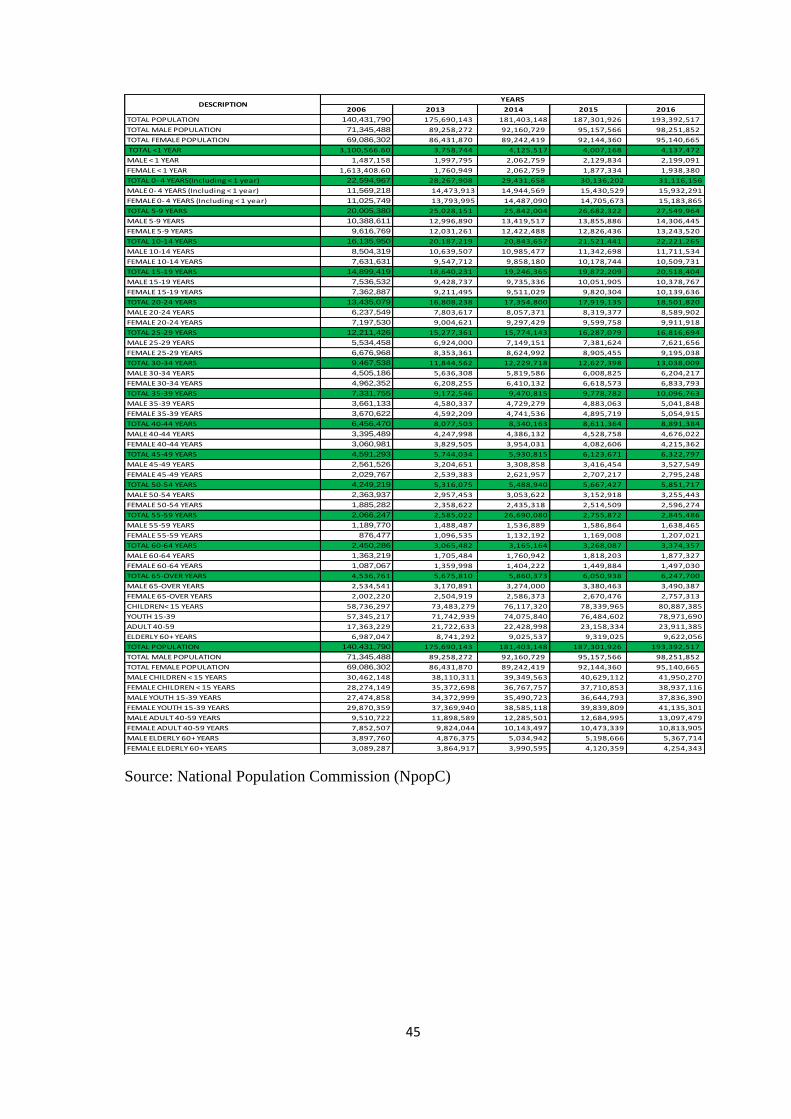
45
Source: National Population Commission (NpopC)
2006 2013 2014 2015 2016
TOTAL POPULATION 140,431,790 175,690,143 181,403,148 187,301,926 193,392,517
TOTAL MALE POPULATION 71,345,488 89,258,272 92,160,729 95,157,566 98,251,852
TOTAL FEMALE POPULATION 69,086,302 86,431,870 89,242,419 92,144,360 95,140,665
TOTAL <1 YEAR 3,100,566.60 3,758,744 4,125,517 4,007,168 4,137,472
MALE < 1 YEAR 1,487,158 1,997,795 2,062,759 2,129,834 2,199,091
FEMALE < 1 YEAR 1,613,408.60 1,760,949 2,062,759 1,877,334 1,938,380
TOTAL 0- 4 YEARS(Including < 1 year) 22,594,967 28,267,908 29,431,658 30,136,202 31,116,156
MALE 0- 4 YEARS (Including < 1 year) 11,569,218 14,473,913 14,944,569 15,430,529 15,932,291
FEMALE 0- 4 YEARS (Including < 1 year) 11,025,749 13,793,995 14,487,090 14,705,673 15,183,865
TOTAL 5-9 YEARS 20,005,380 25,028,151 25,842,004 26,682,322 27,549,964
MALE 5-9 YEARS 10,388,611 12,996,890 13,419,517 13,855,886 14,306,445
FEMALE 5-9 YEARS 9,616,769 12,031,261 12,422,488 12,826,436 13,243,520
TOTAL 10-14 YEARS 16,135,950 20,187,219 20,843,657 21,521,441 22,221,265
MALE 10-14 YEARS 8,504,319 10,639,507 10,985,477 11,342,698 11,711,534
FEMALE 10-14 YEARS 7,631,631 9,547,712 9,858,180 10,178,744 10,509,731
TOTAL 15-19 YEARS 14,899,419 18,640,231 19,246,365 19,872,209 20,518,404
MALE 15-19 YEARS 7,536,532 9,428,737 9,735,336 10,051,905 10,378,767
FEMALE 15-19 YEARS 7,362,887 9,211,495 9,511,029 9,820,304 10,139,636
TOTAL 20-24 YEARS 13,435,079 16,808,238 17,354,800 17,919,135 18,501,820
MALE 20-24 YEARS 6,237,549 7,803,617 8,057,371 8,319,377 8,589,902
FEMALE 20-24 YEARS 7,197,530 9,004,621 9,297,429 9,599,758 9,911,918
TOTAL 25-29 YEARS 12,211,426 15,277,361 15,774,143 16,287,079 16,816,694
MALE 25-29 YEARS 5,534,458 6,924,000 7,149,151 7,381,624 7,621,656
FEMALE 25-29 YEARS 6,676,968 8,353,361 8,624,992 8,905,455 9,195,038
TOTAL 30-34 YEARS 9,467,538 11,844,562 12,229,718 12,627,398 13,038,009
MALE 30-34 YEARS 4,505,186 5,636,308 5,819,586 6,008,825 6,204,217
FEMALE 30-34 YEARS 4,962,352 6,208,255 6,410,132 6,618,573 6,833,793
TOTAL 35-39 YEARS 7,331,755 9,172,546 9,470,815 9,778,782 10,096,763
MALE 35-39 YEARS 3,661,133 4,580,337 4,729,279 4,883,063 5,041,848
FEMALE 35-39 YEARS 3,670,622 4,592,209 4,741,536 4,895,719 5,054,915
TOTAL 40-44 YEARS 6,456,470 8,077,503 8,340,163 8,611,364 8,891,384
MALE 40-44 YEARS 3,395,489 4,247,998 4,386,132 4,528,758 4,676,022
FEMALE 40-44 YEARS 3,060,981 3,829,505 3,954,031 4,082,606 4,215,362
TOTAL 45-49 YEARS 4,591,293 5,744,034 5,930,815 6,123,671 6,322,797
MALE 45-49 YEARS 2,561,526 3,204,651 3,308,858 3,416,454 3,527,549
FEMALE 45-49 YEARS 2,029,767 2,539,383 2,621,957 2,707,217 2,795,248
TOTAL 50-54 YEARS 4,249,219 5,316,075 5,488,940 5,667,427 5,851,717
MALE 50-54 YEARS 2,363,937 2,957,453 3,053,622 3,152,918 3,255,443
FEMALE 50-54 YEARS 1,885,282 2,358,622 2,435,318 2,514,509 2,596,274
TOTAL 55-59 YEARS 2,066,247 2,585,022 26,690,080 2,755,872 2,845,486
MALE 55-59 YEARS 1,189,770 1,488,487 1,536,889 1,586,864 1,638,465
FEMALE 55-59 YEARS 876,477 1,096,535 1,132,192 1,169,008 1,207,021
TOTAL 60-64 YEARS 2,450,286 3,065,482 3,165,164 3,268,087 3,374,357
MALE 60-64 YEARS 1,363,219 1,705,484 1,760,942 1,818,203 1,877,327
FEMALE 60-64 YEARS 1,087,067 1,359,998 1,404,222 1,449,884 1,497,030
TOTAL 65-OVER YEARS 4,536,761 5,675,810 5,860,373 6,050,938 6,247,700
MALE 65-OVER YEARS 2,534,541 3,170,891 3,274,000 3,380,463 3,490,387
FEMALE 65-OVER YEARS 2,002,220 2,504,919 2,586,373 2,670,476 2,757,313
CHILDREN< 15 YEARS 58,736,297 73,483,279 76,117,320 78,339,965 80,887,385
YOUTH 15-39 57,345,217 71,742,939 74,075,840 76,484,602 78,971,690
ADULT 40-59 17,363,229 21,722,633 22,428,998 23,158,334 23,911,385
ELDERLY 60+ YEARS 6,987,047 8,741,292 9,025,537 9,319,025 9,622,056
TOTAL POPULATION 140,431,790 175,690,143 181,403,148 187,301,926 193,392,517
TOTAL MALE POPULATION 71,345,488 89,258,272 92,160,729 95,157,566 98,251,852
TOTAL FEMALE POPULATION 69,086,302 86,431,870 89,242,419 92,144,360 95,140,665
MALE CHILDREN < 15 YEARS 30,462,148 38,110,311 39,349,563 40,629,112 41,950,270
FEMALE CHILDREN < 15 YEARS 28,274,149 35,372,698 36,767,757 37,710,853 38,937,116
MALE YOUTH 15-39 YEARS 27,474,858 34,372,999 35,490,723 36,644,793 37,836,390
FEMALE YOUTH 15-39 YEARS 29,870,359 37,369,940 38,585,118 39,839,809 41,135,301
MALE ADULT 40-59 YEARS 9,510,722 11,898,589 12,285,501 12,684,995 13,097,479
FEMALE ADULT 40-59 YEARS 7,852,507 9,824,044 10,143,497 10,473,339 10,813,905
MALE ELDERLY 60+ YEARS 3,897,760 4,876,375 5,034,942 5,198,666 5,367,714
FEMALE ELDERLY 60+ YEARS 3,089,287 3,864,917 3,990,595 4,120,359 4,254,343
DESCRIPTIONYEARS

46
HEALTH
ST 2.1: Distribution of HIV Patients by State, Year and Sex (2013-2016)
Source: NACA
M F TOTAL % F M F TOTAL % F
1 Abia 24,734 33,659 58,393 57.6 24,357 33,377 57,734 57.8
2 Adamawa 24,145 30,020 54,165 55.4 23,055 29,011 52,066 55.7
3 Akwa Ibom 101,253 101,049 202,302 49.9 104,923 106,123 211,046 50.3
4 Anambra 15,877 22,086 37,963 58.2 16,379 23,041 39,420 58.5
5 Bauchi 32,602 21,088 53,690 39.3 31,306 20,934 52,240 40.1
6 Bayelsa 29,492 38,894 68,386 56.9 29,060 38,533 67,593 57.0
7 Benue 82,949 97,435 180,384 54.0 82,139 99,187 181,326 54.7
8 Borno 28,064 34,578 62,642 55.2 27,438 33,840 61,278 55.2
9 Cross Rivers 41,377 33,326 74,703 44.6 41,003 34,080 75,083 45.4
10 Delta 13,246 18,751 31,997 58.6 13,292 19,070 32,362 58.9
11 Ebonyi 24,453 21,239 45,692 46.5 24,729 21,785 46,514 46.8
12 Edo 88,211 44,921 133,132 33.7 89,367 46,414 135,781 34.2
13 Ekiti 1,908 2,398 4,306 55.7 1,996 2,542 4,538 56.0
14 Enugu 13,785 17,524 31,309 56.0 14,236 18,132 32,368 56.0
15 Gombe 41,637 54,354 95,991 56.6 42,192 56,517 98,709 57.3
16 Imo 18,305 36,723 55,028 66.7 18,377 36,504 54,881 66.5
17 Jigawa 27,634 63,583 91,217 69.7 29,629 68,679 98,308 69.9
18 Kaduna 46,999 19,359 66,358 29.2 47,102 19,756 66,858 29.5
19 Kano 96,413 85,143 181,556 46.9 91,644 83,742 175,386 47.7
20 Katsina 69,210 40,683 109,893 37.0 66,784 40,731 107,515 37.9
21 Kebbi 39,453 16,139 55,592 29.0 35,845 15,671 51,516 30.4
22 Kogi 11,965 13,734 25,699 53.4 11,566 13,523 25,089 53.9
23 Kwara 27,387 25,245 52,632 48.0 25,550 25,043 50,593 49.5
24 Lagos 14,504 15,430 29,934 51.5 14,793 15,713 30,506 51.5
25 Nasarawa 73,451 108,638 182,089 59.7 76,605 113,432 190,037 59.7
26 Niger 36,297 59,110 95,407 62.0 37,822 61,646 99,468 62.0
27 Ogun 26,864 45,747 72,611 63.0 25,712 44,318 70,030 63.3
28 Ondo 62,327 25,687 88,014 29.2 60,378 25,564 85,942 29.7
29 Osun 44,705 39,107 83,812 46.7 43,955 39,483 83,438 47.3
30 Oyo 26,269 33,973 60,242 56.4 26,635 34,662 61,297 56.5
31 Plateau 89,169 114,269 203,438 56.2 90,322 116,438 206,760 56.3
32 River 26,254 35,457 61,711 57.5 26,976 36,472 63,448 57.5
33 Sokoto 48,208 64,014 112,222 57.0 48,490 64,773 113,263 57.2
34 Taraba 59,495 76,476 135,971 56.2 58,655 75,684 134,339 56.3
35 Yobe 65,465 82,067 147,532 55.6 66,766 84,829 151,595 56.0
36 Zamfara 28,771 36,375 65,146 55.8 27,356 34,656 62,012 55.9
37 FCT 7,208 9,121 16,329 55.9 6,749 8,622 15,371 56.1
1,510,086 1,617,402 3,127,488 51.7 1,503,183 1,642,527 3,145,710 52.2 Total
S/N STATE2013 2014

47
ST 2.1: Distribution of HIV Patients by State, Year and Sex (2013-2016) Cont;
Source: NACA
M F TOTAL % F M F TOTAL % F
1 Abia 24,040 33,430 57,470 58.2 23,659 33,344 57,003 58.5
2 Adamawa 22,182 28,402 50,584 56.1 21,435 27,988 49,423 56.6
3 Akwa Ibom 108,442 110,852 219,294 50.5 111,777 115,251 227,028 50.8
4 Anambra 16,967 24,006 40,973 58.6 17,598 25,051 42,649 58.7
5 Bauchi 30,389 20,827 51,216 40.7 29,426 20,717 50,143 41.3
6 Bayelsa 28,516 38,026 66,542 57.1 27,929 37,483 65,412 57.3
7 Benue 82,335 100,936 183,271 55.1 82,776 102,403 185,179 55.3
8 Borno 26,915 33,274 60,189 55.3 26,500 32,910 59,410 55.4
9 Cross Rivers 40,822 35,121 75,943 46.2 40,727 36,056 76,783 47.0
10 Delta 13,399 19,426 32,825 59.2 13,459 19,759 33,218 59.5
11 Ebonyi 25,222 22,410 47,632 47.0 25,673 22,954 48,627 47.2
12 Edo 90,583 47,929 138,512 34.6 92,045 49,540 141,585 35.0
13 Ekiti 2,086 2,695 4,781 56.4 2,173 2,852 5,025 56.8
14 Enugu 14,679 18,778 33,457 56.1 15,112 19,451 34,563 56.3
15 Gombe 42,635 58,385 101,020 57.8 42,507 60,239 102,746 58.6
16 Imo 18,482 36,404 54,886 66.3 18,573 36,380 54,953 66.2
17 Jigawa 31,870 74,202 106,072 70.0 34,265 79,894 114,159 70.0
18 Kaduna 47,181 20,120 67,301 29.9 47,264 20,395 67,659 30.1
19 Kano 86,976 81,868 168,844 48.5 82,303 79,462 161,765 49.1
20 Katsina 64,733 40,915 105,648 38.7 62,461 40,737 103,198 39.5
21 Kebbi 32,706 15,260 47,966 31.8 29,919 14,930 44,849 33.3
22 Kogi 11,142 13,249 24,391 54.3 10,692 12,899 23,591 54.7
23 Kwara 24,140 25,024 49,164 50.9 22,789 24,955 47,744 52.3
24 Lagos 15,099 16,041 31,140 51.5 15,439 16,541 31,980 51.7
25 Nasarawa 80,194 119,052 199,246 59.8 84,242 125,226 209,468 59.8
26 Niger 39,539 64,329 103,868 61.9 41,132 67,189 108,321 62.0
27 Ogun 24,909 43,726 68,635 63.7 24,040 42,960 67,000 64.1
28 Ondo 58,788 25,728 84,516 30.4 57,282 25,940 83,222 31.2
29 Osun 43,357 39,717 83,074 47.8 42,868 39,823 82,691 48.2
30 Oyo 26,940 35,263 62,203 56.7 27,221 35,873 63,094 56.9
31 Plateau 91,284 118,373 209,657 56.5 92,335 120,265 212,600 56.6
32 River 27,857 37,733 65,590 57.5 28,560 38,904 67,464 57.7
33 Sokoto 48,905 65,775 114,680 57.4 49,258 66,722 115,980 57.5
34 Taraba 57,683 74,682 132,365 56.4 56,592 73,397 129,989 56.5
35 Yobe 68,273 87,802 156,075 56.3 69,707 90,796 160,503 56.6
36 Zamfara 26,048 33,039 59,087 55.9 24,807 31,619 56,426 56.0
37 FCT 6,502 8,421 14,923 56.4 6,334 8,314 14,648 56.8
1,501,820 1,671,220 3,173,040 52.7 1,500,879 1,699,219 3,200,098 53.1
2016S/N STATE
Total
2015
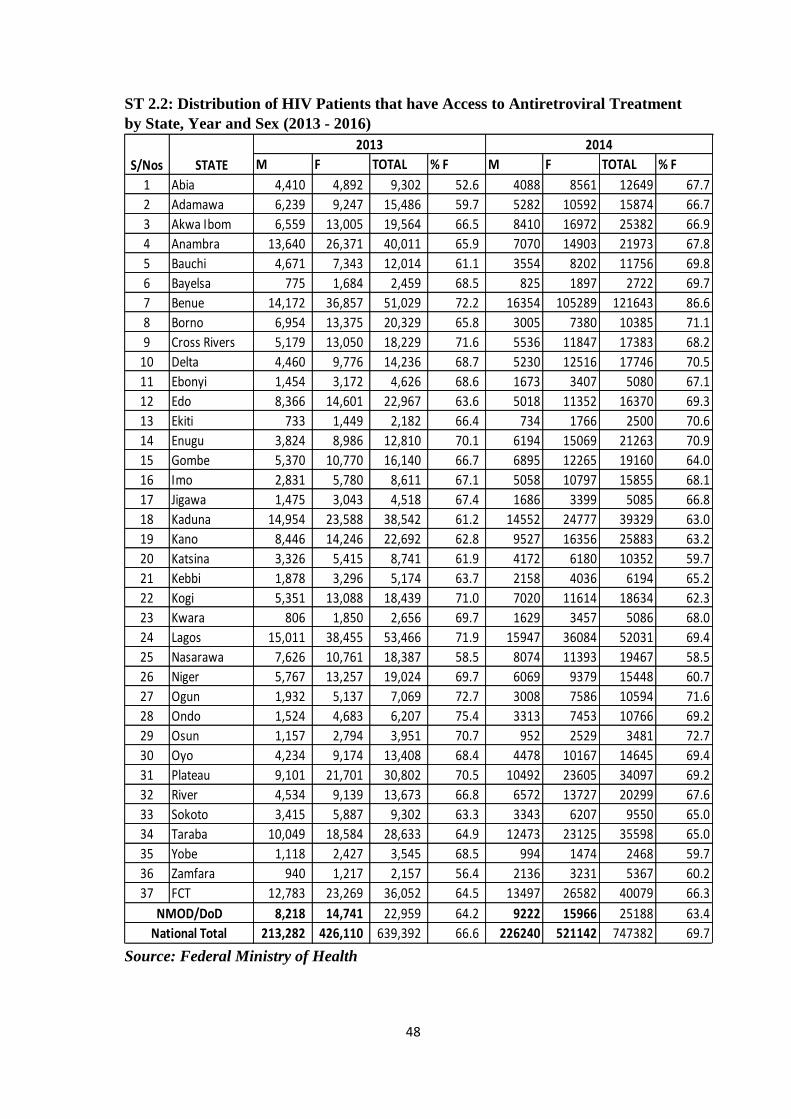
48
ST 2.2: Distribution of HIV Patients that have Access to Antiretroviral Treatment
by State, Year and Sex (2013 - 2016)
Source: Federal Ministry of Health
M F TOTAL % F M F TOTAL % F
1 Abia 4,410 4,892 9,302 52.6 4088 8561 12649 67.7
2 Adamawa 6,239 9,247 15,486 59.7 5282 10592 15874 66.7
3 Akwa Ibom 6,559 13,005 19,564 66.5 8410 16972 25382 66.9
4 Anambra 13,640 26,371 40,011 65.9 7070 14903 21973 67.8
5 Bauchi 4,671 7,343 12,014 61.1 3554 8202 11756 69.8
6 Bayelsa 775 1,684 2,459 68.5 825 1897 2722 69.7
7 Benue 14,172 36,857 51,029 72.2 16354 105289 121643 86.6
8 Borno 6,954 13,375 20,329 65.8 3005 7380 10385 71.1
9 Cross Rivers 5,179 13,050 18,229 71.6 5536 11847 17383 68.2
10 Delta 4,460 9,776 14,236 68.7 5230 12516 17746 70.5
11 Ebonyi 1,454 3,172 4,626 68.6 1673 3407 5080 67.1
12 Edo 8,366 14,601 22,967 63.6 5018 11352 16370 69.3
13 Ekiti 733 1,449 2,182 66.4 734 1766 2500 70.6
14 Enugu 3,824 8,986 12,810 70.1 6194 15069 21263 70.9
15 Gombe 5,370 10,770 16,140 66.7 6895 12265 19160 64.0
16 Imo 2,831 5,780 8,611 67.1 5058 10797 15855 68.1
17 Jigawa 1,475 3,043 4,518 67.4 1686 3399 5085 66.8
18 Kaduna 14,954 23,588 38,542 61.2 14552 24777 39329 63.0
19 Kano 8,446 14,246 22,692 62.8 9527 16356 25883 63.2
20 Katsina 3,326 5,415 8,741 61.9 4172 6180 10352 59.7
21 Kebbi 1,878 3,296 5,174 63.7 2158 4036 6194 65.2
22 Kogi 5,351 13,088 18,439 71.0 7020 11614 18634 62.3
23 Kwara 806 1,850 2,656 69.7 1629 3457 5086 68.0
24 Lagos 15,011 38,455 53,466 71.9 15947 36084 52031 69.4
25 Nasarawa 7,626 10,761 18,387 58.5 8074 11393 19467 58.5
26 Niger 5,767 13,257 19,024 69.7 6069 9379 15448 60.7
27 Ogun 1,932 5,137 7,069 72.7 3008 7586 10594 71.6
28 Ondo 1,524 4,683 6,207 75.4 3313 7453 10766 69.2
29 Osun 1,157 2,794 3,951 70.7 952 2529 3481 72.7
30 Oyo 4,234 9,174 13,408 68.4 4478 10167 14645 69.4
31 Plateau 9,101 21,701 30,802 70.5 10492 23605 34097 69.2
32 River 4,534 9,139 13,673 66.8 6572 13727 20299 67.6
33 Sokoto 3,415 5,887 9,302 63.3 3343 6207 9550 65.0
34 Taraba 10,049 18,584 28,633 64.9 12473 23125 35598 65.0
35 Yobe 1,118 2,427 3,545 68.5 994 1474 2468 59.7
36 Zamfara 940 1,217 2,157 56.4 2136 3231 5367 60.2
37 FCT 12,783 23,269 36,052 64.5 13497 26582 40079 66.3
8,218 14,741 22,959 64.2 9222 15966 25188 63.4
213,282 426,110 639,392 66.6 226240 521142 747382 69.7National Total
S/Nos STATE
2013
NMOD/DoD
2014

49
ST 2.2: Distribution of HIV Patients that have Access to Antiretroviral Treatment by State,
Year and Sex (2013 - 2016) Cont;
Source: Federal Ministry of Health
M F TOTAL % F M F TOTAL % F
1 Abia 4,813 8,907 13,720 64.9 5,103 10,263 15,366 66.8
2 Adamawa 8,390 18,203 26,593 68.5 10,308 21,312 31,620 67.4
3 Akwa Ibom 15,035 26,590 41,625 63.9 19,018 37,822 56,840 66.5
4 Anambra 7,368 15,541 22,909 67.8 8,468 17,695 26,163 67.6
5 Bauchi 3,762 9,494 13,256 71.6 4,320 9,183 13,503 68.0
6 Bayelsa 1,100 2,671 3,771 70.8 1,303 2,925 4,228 69.2
7 Benue 29,088 107,911 136,999 78.8 30,409 110,206 140,615 78.4
8 Borno 3,058 5,889 8,947 65.8 3,551 7,213 10,764 67.0
9 Cross Rivers 7,070 15,909 22,979 69.2 7,235 16,016 23,251 68.9
10 Delta 5,630 15,230 20,860 73.0 7,151 18,830 25,981 72.5
11 Ebonyi 1,985 3,921 5,906 66.4 2,221 4,789 7,010 68.3
12 Edo 8,140 15,208 23,348 65.1 8,404 17,326 25,730 67.3
13 Ekiti 911 2,191 3,102 70.6 997 2,430 3,427 70.9
14 Enugu 7,377 17,894 25,271 70.8 8,024 19,774 27,798 71.1
15 Gombe 7,604 16,016 23,620 67.8 8,350 17,307 25,657 67.5
16 Imo 5,497 10,746 16,243 66.2 6,407 12,842 19,249 66.7
17 Jigawa 1,731 3,410 5,141 66.3 1,966 4,052 6,018 67.3
18 Kaduna 14,420 28,560 42,980 66.4 15,699 29,324 45,023 65.1
19 Kano 9,832 16,987 26,819 63.3 10,702 18,772 29,474 63.7
20 Katsina 4,707 7,342 12,049 60.9 5,069 8,062 13,131 61.4
21 Kebbi 2,677 4,736 7,413 63.9 3,055 5,463 8,518 64.1
22 Kogi 5,807 13,267 19,074 69.6 6,680 15,047 21,727 69.3
23 Kwara 2,254 5,536 7,790 71.1 1,693 5,246 6,939 75.6
24 Lagos 14,911 32,492 47,403 68.5 18,451 40,499 58,950 68.7
25 Nasarawa 8,204 15,055 23,259 64.7 14,957 31,180 46,137 67.6
26 Niger 5,330 11,871 17,201 69.0 6,077 13,448 19,525 68.9
27 Ogun 3,573 8,692 12,265 70.9 3,721 9,779 13,500 72.4
28 Ondo 2,191 5,676 7,867 72.1 2,388 6,244 8,632 72.3
29 Osun 1,489 3,684 5,173 71.2 1,731 4,367 6,098 71.6
30 Oyo 4,739 10,874 15,613 69.6 4,979 11,329 16,308 69.5
31 Plateau 10,588 24,517 35,105 69.8 12,204 26,428 38,632 68.4
32 River 9,431 20,981 30,412 69.0 12,105 26,932 39,037 69.0
33 Sokoto 3,615 5,511 9,126 60.4 3,778 5,430 9,208 59.0
34 Taraba 13,559 28,362 41,921 67.7 16,814 31,736 48,550 65.4
35 Yobe 1,883 3,108 4,991 62.3 2,273 3,749 6,022 62.3
36 Zamfara 1,322 2,045 3,367 60.7 1,508 2,422 3,930 61.6
37 FCT 14,426 30,323 44,749 67.8 18,316 37,015 55,331 66.9
9,172 15,953 25,125 63.5 9,116 16,972 26,088 65.1
262,689 591,303 853,992 69.2 304,551 679,429 983,980 69.0
2016
S/Nos STATE
NMOD/DoD
National Total
2015

50
ST 2.3: Distribution of Total Fertility Rate by State 2016/17
Source: MICS5, 2016/17
Total Fertility
Rate
Abia 5.1
Adamawa 5.5
Akwa Ibom 4.5Anambra 4.3Bauchi 6.8
Bayelsa 4.8
Benue 4.8
Borno 6.1
Cross River 4.4
Delta 5.2
Ebonyi 5.2
Edo 3.8
Ekiti 4.4
Enugu 3.8
Gombe 7.3
Imo 5.1
Jigawa 8.5
Kaduna 5.6
Kano 7.7
Katsina 7.5
Kebbi 7.7
Kogi 3.7
Kwara 4.4
Lagos 4.0
Nasarawa 5.7
Niger 6.4
Ogun 4.5
Ondo 4.5
Osun 4.7
Oyo 4.9
Plateau 5.6
Rivers 3.3
Sokoto 7.3
Taraba 5.5
Yobe 6.8
Zamfara 7.3
FCT Abuja 4.6
Total 5.8
State

51
EDUCATION
ST 3.1: Percentage of Women and Men age 15-24 years who are literate by State and
Sex, 2016/17
Source: MICS5, 2016/2017
State F M
Abia 98.2 94.2
Adamawa 50.6 74.3
Akwa Ibom 94.6 92.7
Anambra 98.1 95.1
Bauchi 25.6 39.8Bayelsa 95.8 98.3Benue 69.9 90.5
Borno 56.4 60.3
Cross River 94.3 95
Delta 91 95.3
Ebonyi 83.4 81.9
Edo 94.9 98.3
Ekiti 96.7 99
Enugu 97.9 96.8
Gombe 37.5 47.5
Imo 98.2 98.9
Jigawa 24.8 32.3
Kaduna 54.4 65.2
Kano 46.1 72.5
Katsina 32.6 62.6
Kebbi 30.9 41.8
Kogi 86.3 92.4
Kwara 73.5 81
Lagos 93.1 98.3
Nasarawa 56 78.1
Niger 37.6 58.9
Ogun 90.7 89
Ondo 91.4 93.4
Osun 94.7 94.8
Oyo 90.7 88.3
Plateau 65.1 69.6
Rivers 98.1 94.7
Sokoto 20.1 47.4
Taraba 53.1 70.6
Yobe 28.3 42.7
Zamfara 31 53
FCT Abuja 81.3 90.1
Nigeria 59.3 70.9

52
ST 3.2: Percentage Distribution of Enrolment in Primary Schools by State, Year and Sex,
2014 -2016
Source: Federal Ministry of Education
M F Total % F M F Total % F M F Total % F
Abia 119,287 174,401 293,688 59.4 95,306 92,439 187,745 49.2 80,827 78,593 159,420 49.3
Adamawa 303,513 278,710 582,223 47.9 34,126 32,930 67,056 49.1 271,920 247,984 519,904 47.7
Akwa Ibom 465,437 494,890 960,327 51.5 488,717 519,622 1,008,339 51.5 424,274 443,875 868,149 51.1
Anambra 448,686 467,045 915,731 51.0 402,905 414,168 817,073 50.7 427,924 446,180 874,104 51.0
Bauchi 429,884 940,488 1,370,372 68.6 467,814 395,336 863,150 45.8 495,327 421,940 917,267 46.0
Bayelsa 68,057 67,976 136,033 50.0 63,220 61,449 124,669 49.3 57,444 54,330 111,774 48.6
Benue 372,018 332,157 704,175 47.2 530,586 477,819 1,008,405 47.4 283,949 253,594 537,543 47.2
Borno NA NA NA NA NA NA NA NA 290,611 249,051 539,662 46.1
Cross River 219,336 216,059 435,395 49.6 219,336 216,059 435,395 49.6 100,718 96,858 197,576 49.0
Delta 253,461 248,288 501,749 49.5 240,405 238,675 479,080 49.8 194,207 191,310 385,517 49.6
Ebonyi 180,312 184,037 364,349 50.5 191,722 196,938 388,660 50.7 172,984 174,422 347,406 50.2
Edo 186,438 184,782 371,220 49.8 187,112 181,960 369,072 49.3 155,857 152,307 308,164 49.4
Ekiti 55,551 56,088 111,639 50.2 71,171 71,692 142,863 50.2 77,827 76,966 154,793 49.7
Enugu 172,219 163,467 335,686 48.7 160,535 156,805 317,340 49.4 163,268 158,953 322,221 49.3
FCT 112,892 110,467 223,359 49.5 119,294 116,771 236,065 49.5 244,214 245,084 489,298 50.1
Gombe 282,151 230,913 513,064 45.0 238,955 195,937 434,892 45.1 249,545 206,026 455,571 45.2
Imo 481,826 447,084 928,910 48.1 506,486 470,253 976,739 48.1 489,440 467,887 957,327 48.9
Jigawa 331,449 252,571 584,020 43.2 329,371 254,048 583,419 43.5 362,802 285,345 648,147 44.0
Kaduna 704,592 613,216 1,317,808 46.5 698,092 612,625 1,310,717 46.7 810,634 726,061 1,536,695 47.2
Kano 1,313,143 1,278,240 2,591,383 49.3 1,358,500 1,335,095 2,693,595 49.6 1,420,782 1,398,611 2,819,393 49.6
Katsina 915,303 674,900 1,590,203 42.4 917,848 676,394 1,594,242 42.4 850,043 679,587 1,529,630 44.4
Kebbi 287,428 167,873 455,301 36.9 301,696 177,095 478,791 37.0 303,762 193,790 497,552 38.9
Kogi 398,168 398,251 796,419 50.0 441,025 441,136 882,161 50.0 272,597 267,577 540,174 49.5
Kwara 150,064 140,402 290,466 48.3 154,804 143,168 297,972 48.0 156,352 143,060 299,412 47.8
Lagos 195,973 204,304 400,277 51.0 479,023 489,226 968,249 50.5 486,924 496,482 983,406 50.5
Nasarawa 174,688 145,506 320,194 45.4 190,468 163,315 353,783 46.2 407,018 359,434 766,452 46.9
Niger 397,283 309,179 706,462 43.8 385,553 303,168 688,721 44.0 432,214 339,523 771,737 44.0
Ogun 280,014 275,218 555,232 49.6 320,085 319,614 639,699 50.0 501,998 488,219 990,217 49.3
Ondo 1,069,153 1,081,578 2,150,731 50.3 838,629 838,729 1,677,358 50.0 435,397 411,059 846,456 48.6
Osun 210,661 209,669 420,330 49.9 210,706 210,325 421,031 50.0 169,462 168,141 337,603 49.8
Oyo 651,565 689,263 1,340,828 51.4 742,662 746,962 1,489,624 50.1 796,005 858,352 1,654,357 51.9
Plateau 369,311 365,021 734,332 49.7 297,932 296,759 594,691 49.9 285,238 278,412 563,650 49.4
Rivers 165,328 168,001 333,329 50.4 167,632 162,054 329,686 49.2 121,144 119,412 240,556 49.6
Sokoto 438,864 254,266 693,130 36.7 442,232 272,199 714,431 38.1 414,849 262,044 676,893 38.7
Taraba 339,258 271,999 611,257 44.5 330,992 274,131 605,123 45.3 295,235 243,122 538,357 45.2
Yobe 424,857 295,790 720,647 41.0 448,782 317,726 766,508 41.5 413,821 295,682 709,503 41.7
Zamfara 287,619 153,309 440,928 34.8 319,588 176,603 496,191 35.6 319,327 175,968 495,295 35.5
Total 13,255,789 12,545,408 25,801,197 48.6 13,393,310 12,049,225 25,442,535 47.4 13,435,940 12,155,241 25,591,181 47.5
2015 2016STATE
2014

53
ST 3.3: Percentage Distribution of Enrolment in Junior Secondary School by State, Year
and sex, 2014 -2016
Source: Federal Ministry of Education
M F TOTAL %F M F TOTAL %F M F TOTAL %F
Abia 27,907 32,397 60,304 53.7 31,755 35,347 67,102 52.7 15,709 19,633 35,342 55.6
Adamawa 65,125 50,101 115,226 43.5 55,127 46,664 101,791 45.8 56,286 47,614 103,900 45.8
Akwa Ibom 169,039 181,196 350,235 51.7 177,488 190,263 367,751 51.7 88,500 92,432 180,932 51.1
Anambra 40,461 46,377 86,838 53.4 61,269 68,637 129,906 52.8 46,064 48,548 94,612 51.3
Bauchi 89,104 62,195 151,299 41.1 99,089 70,142 169,231 41.4 112,110 82,239 194,349 42.3
Bayelsa 21,162 20,634 41,796 49.4 21,514 20,674 42,188 49.0 17,879 17,472 35,351 49.4
Benue 383,199 298,396 681,595 43.8 234,728 183,168 417,896 43.8 83,618 71,648 155,266 46.1
Borno NA NA NA NA NA NA NA NA 66,238 55,018 121,256 45.4
Cross River 87,120 88,609 175,729 50.4 87,120 88,609 175,729 50.4 33,075 31,237 64,312 48.6
Delta 92,476 95,499 187,975 50.8 108,651 110,994 219,645 50.5 79,740 75,388 155,128 48.6
Ebonyi 36,604 37,166 73,770 50.4 36,570 40,427 76,997 52.5 45,849 50,741 96,590 52.5
Edo 70,044 67,797 137,841 49.2 85,949 86,814 172,763 50.3 71,213 71,370 142,583 50.1
Ekiti 30,126 25,097 55,223 45.4 29,017 28,972 57,989 50.0 29,073 29,604 58,677 50.5
Enugu 67,232 73,633 140,865 52.3 59,619 70,857 130,476 54.3 55,548 66,259 121,807 54.4
FCT 54,170 55,855 110,025 50.8 68,217 71,190 139,407 51.1 45,205 46,122 91,327 50.5
Gombe 76,918 56,150 133,068 42.2 49,097 38,853 87,950 44.2 51,228 41,000 92,228 44.5
Imo 229,553 229,645 459,198 50.0 237,404 238,163 475,567 50.1 208,537 208,780 417,317 50.0
Jigawa 70,163 41,599 111,762 37.2 63,443 44,392 107,835 41.2 85,958 59,849 145,807 41.0
Kaduna 116,650 97,880 214,530 45.6 47,493 44,514 92,007 48.4 167,595 138,047 305,642 45.2
Kano 196,487 147,785 344,272 42.9 242,369 194,125 436,494 44.5 242,398 199,237 441,635 45.1
Katsina 121,537 93,878 215,415 43.6 144,755 102,746 247,501 41.5 154,668 111,514 266,182 41.9
Kebbi 96,481 47,175 143,656 32.8 99,032 46,882 145,914 32.1 95,598 47,804 143,402 33.3
Kogi 43,408 41,896 85,304 49.1 44,101 42,549 86,650 49.1 33,520 31,933 65,453 48.8
Kwara 17,016 15,452 32,468 47.6 17,896 16,842 34,738 48.5 65,939 63,188 129,127 48.9
Lagos 156,237 161,375 317,612 50.8 223,337 238,263 461,600 51.6 232,384 239,663 472,047 50.8
Nasarawa 12,771 12,301 25,072 49.1 48,968 38,687 87,655 44.1 53,689 46,433 100,122 46.4
Niger 109,648 74,982 184,630 40.6 107,474 71,654 179,128 40.0 124,255 93,121 217,376 42.8
Ogun 136,929 133,604 270,533 49.4 146,721 146,109 292,830 49.9 135,093 133,614 268,707 49.7
Ondo 101,063 99,417 200,480 49.6 110,753 105,718 216,471 48.8 59,274 60,632 119,906 50.6
Osun 69,386 68,765 138,151 49.8 12,398 13,281 25,679 51.7 63,876 62,490 126,366 49.5
Oyo 142,754 145,890 288,644 50.5 166,199 165,096 331,295 49.8 146,750 148,830 295,580 50.4
Plateau 55,502 48,896 104,398 46.8 61,491 54,771 116,262 47.1 52,347 47,848 100,195 47.8
Rivers 74,331 81,672 156,003 52.4 72,143 78,108 150,251 52.0 55,633 59,692 115,325 51.8
Sokoto 57,875 32,612 90,487 36.0 58,732 32,337 91,069 35.5 128,906 71,132 200,038 35.6
Taraba 56,165 37,035 93,200 39.7 40,638 31,007 71,645 43.3 67,371 49,218 116,589 42.2
Yobe 79,152 57,528 136,680 42.1 46,716 29,227 75,943 38.5 42,643 32,009 74,652 42.9
Zamfara 57,675 31,135 88,810 35.1 62,836 34,100 96,936 35.2 68,041 34,973 103,014 33.9
TOTAL 3,311,470 2,891,624 6,203,094 46.6 3,260,109 2,920,182 6,180,291 47.2 3,181,810 2,786,332 5,968,142 46.7
2014 2015 2016STATE

54
ST 3.4: Percentage Distribution of Enrolment in Senior Secondary School by State, Year
and Sex, 2014 -2016
Source: Federal Ministry of Education
M F TOTAL %F M F TOTAL %F M F TOTAL %F
Abia 20,700 24,447 45,147 54.1 20,768 21,263 42,031 50.6 12,580 15,917 28,497 55.9
Adamaw a 43,743 33,614 77,357 43.5 44,636 34,300 78,936 43.5 45,546 34,999 80,545 43.5
Akw a Ibom 147,357 147,961 295,318 50.1 154,729 155,368 310,097 50.1 130,116 79,775 209,891 38.0
Anambra 25,212 29,253 54,465 53.7 27,000 29,939 56,939 52.6 27,167 31,606 58,773 53.8
Bauchi 67,943 31,215 99,158 31.5 65,721 40,402 106,123 38.1 75,130 47,416 122,546 38.7
Bayelsa 24,325 21,140 45,465 46.5 24,259 21,597 45,856 47.1 16,986 15,462 32,448 47.7
Benue 194,801 149,323 344,124 43.4 245,468 188,753 434,221 43.5 53,788 44,421 98,209 45.2
Borno NA NA NA NA NA NA NA NA 39,726 28,810 68,536 42.0
Cross River 67,092 69,579 136,671 50.9 67,092 69,579 136,671 50.9 25,953 25,244 51,197 49.3
Delta 76,839 74,286 151,125 49.2 54,200 52,281 106,481 49.1 62,726 61,847 124,573 49.6
Ebonyi 23,401 25,621 49,022 52.3 31,190 34,886 66,076 52.8 35,808 40,304 76,112 53.0
Edo 63,286 64,812 128,098 50.6 48,550 48,385 96,935 49.9 59,787 62,744 122,531 51.2
Ekiti 26,185 19,373 45,558 42.5 28,283 27,891 56,174 49.7 25,179 25,006 50,185 49.8
Enugu 60,350 74,927 135,277 55.4 53,120 66,113 119,233 55.4 48,796 60,996 109,792 55.6
FCT 27,437 29,118 56,555 51.5 31,858 36,105 67,963 53.1 27,966 29,672 57,638 51.5
Gombe 51,776 38,670 90,446 42.8 38,742 24,994 63,736 39.2 38,081 27,155 65,236 41.6
Imo 207,783 217,630 425,413 51.2 232,477 245,488 477,965 51.4 179,880 205,016 384,896 53.3
Jigaw a 56,818 29,405 86,223 34.1 52,722 25,864 78,586 32.9 55,006 31,371 86,377 36.3
Kaduna 89,620 68,754 158,374 43.4 74,464 61,788 136,252 45.3 89,908 76,358 166,266 45.9
Kano 149,909 87,604 237,513 36.9 177,467 120,731 298,198 40.5 161,304 111,502 272,806 40.9
Katsina 89,229 44,315 133,544 33.2 103,954 52,279 156,233 33.5 106,949 62,457 169,406 36.9
Kebbi** NA NA NA NA NA NA NA NA 55,369 23,125 78,494 29.5
Kogi 39,622 34,635 74,257 46.6 40,681 35,601 76,282 46.7 29,454 26,917 56,371 47.7
Kw ara 44,337 38,860 83,197 46.7 52,519 47,019 99,538 47.2 54,752 48,695 103,447 47.1
Lagos 115,601 132,168 247,769 53.3 183,671 191,285 374,956 51.0 175,485 185,379 360,864 51.4
Nasaraw a NA NA NA NA 50,454 37,640 88,094 42.7 49,305 37,813 87,118 43.4
Niger 96,453 65,472 161,925 40.4 91,850 63,101 154,951 40.7 93,565 69,493 163,058 42.6
Ogun 111,192 110,174 221,366 49.8 125,064 125,979 251,043 50.2 113,185 119,309 232,494 51.3
Ondo 75,101 71,903 147,004 48.9 75,259 71,899 147,158 48.9 53,854 53,841 107,695 50.0
Osun NA NA NA NA 70,065 68,605 138,670 49.5 44,190 40,974 85,164 48.1
Oyo 125,012 127,762 252,774 50.5 140,755 147,412 288,167 51.2 119,528 123,603 243,131 50.8
Plateau 50,245 41,449 91,694 45.2 55,501 47,524 103,025 46.1 44,582 38,930 83,512 46.6
Rivers NA NA NA NA NA NA NA NA 51,085 62,424 113,509 55.0
Sokoto 48,230 22,755 70,985 32.1 39,411 20,610 60,021 34.3 50,240 27,848 78,088 35.7
Taraba NA NA NA NA 26,588 20,717 47,305 43.8 29,375 21,955 51,330 42.8
Yobe** 47,776 19,821 67,597 29.3 49,469 26,373 75,842 34.8 28,517 15,063 43,580 34.6
Zamfara 53,808 25,260 79,068 31.9 51,539 19,647 71,186 27.6 106,324 44,670 150,994 29.6
Total 2,321,183 1,971,306 4,292,489 45.9 2,629,526 2,281,418 4,910,944 46.5 2,417,192 2,058,117 4,475,309 46.0
2016 Enrolment 2014 Enrolment STATE
2015 Enrolment

55
ST 3.5a: Distribution of NECO (SSC) Examination Result by State, Subject, Year and
Sex (June/July), 2012
Source: National Examination Council (NECO)
State
Male Female Total Male Female Total Male Female Total Male Female Total Male Female Total Male Female
Abia 7,703 8,480 16,183 5,714 6,442 12,156 6,079 6,599 12,678 4,849 5,390 10,239 4,589 5,187 9,776 59.57 61.17
Adamawa 19,822 12,900 32,722 3,114 2,117 5,231 2,723 1,943 4,666 997 729 1,726 762 588 1,350 3.84 4.56
Akwa-Ibom 18,016 19,875 37,891 10,409 11,636 22,045 9,972 10,789 20,761 7,204 8,018 15,222 6,423 7,356 13,779 35.65 37.01
Anambra 9,090 11,186 20,276 6,783 8,116 14,899 5,806 6,908 12,714 4,797 5,649 10,446 4,484 5,319 9,803 49.33 47.55
Bauchi 18,149 7,730 25,879 4,501 2,199 6,700 4,416 2,333 6,749 2,093 1,137 3,230 1,838 1,016 2,854 10.13 13.14
Bayelsa 8,101 6,769 14,870 6,590 5,660 12,250 6,639 5,562 12,201 5,781 4,921 10,702 5,658 4,869 10,527 69.84 71.93
Benue 28,977 20,714 49,691 17,746 12,233 29,979 17,674 12,580 30,254 12,556 8,567 21,123 11,702 8,018 19,720 40.38 38.71
Borno 19,256 12,832 32,088 5,865 4,327 10,192 5,859 5,330 11,189 3,293 2,772 6,065 3,011 2,574 5,585 15.64 20.06
Cross-River 11,292 10,482 21,774 6,639 6,447 13,086 7,817 7,218 15,035 5,181 4,966 10,147 4,668 4,556 9,224 41.34 43.46
Delta 14,278 14,297 28,575 8,933 8,854 17,787 9,921 9,746 19,667 6,961 6,666 13,627 6,164 5,963 12,127 43.17 41.71
Ebonyi 8,070 7,355 15,425 5,788 5,141 10,929 5,439 4,934 10,373 4,458 4,002 8,460 4,224 3,802 8,026 52.34 51.69
Edo 20,576 18,870 39,446 12,851 12,370 25,221 16,608 15,169 31,777 11,179 10,647 21,826 10,200 9,940 20,140 49.57 52.68
Ekiti 5,658 5,647 11,305 3,196 3,415 6,611 3,443 3,563 7,006 2,390 2,630 5,020 2,035 2,313 4,348 35.97 40.96
Enugu 14,294 18,744 33,038 8,608 11,415 20,023 9,363 12,317 21,680 6,490 8,633 15,123 5,907 7,983 13,890 41.33 42.59
Gombe 10,106 5,877 15,983 2,106 1,494 3,600 1,858 1,397 3,255 809 625 1,434 624 496 1,120 6.17 8.44
Imo 15,985 18,440 34,425 10,125 12,320 22,445 10,605 12,640 23,245 7,603 9,325 16,928 7,052 8,844 15,896 44.12 47.96
Jigawa 14,393 3,437 17,830 4,225 1,360 5,585 4,416 929 5,345 1,993 369 2,362 1,753 356 2,109 12.18 10.36
Kaduna 33,123 23,103 56,226 16,700 13,427 30,127 15,259 11,821 27,080 10,616 8,605 19,221 8,866 7,467 16,333 26.77 32.32
Kano 40,817 19,110 59,927 12,584 6,610 19,194 12,678 8,822 21,500 6,480 4,704 11,184 5,578 4,288 9,866 13.67 22.44
Katsina 28,503 10,197 38,700 8,003 3,214 11,217 5,835 2,529 8,364 3,523 1,640 5,163 3,180 1,522 4,702 11.16 14.93
Kebbi 16,515 5,899 22,414 3,623 1,500 5,123 4,125 1,363 5,488 1,609 532 2,141 1,436 478 1,914 8.70 8.10
Kogi 17,062 13,236 30,298 11,972 9,386 21,358 12,830 10,025 22,855 9,790 7,708 17,498 9,321 7,356 16,677 54.63 55.58
Kwara 10,199 8,333 18,532 6,896 5,709 12,605 5,458 4,252 9,710 4,158 3,271 7,429 3,764 2,972 6,736 36.91 35.67
Lagos 26,169 25,760 51,929 18,691 18,791 37,482 19,911 18,609 38,520 15,694 15,041 30,735 13,946 13,696 27,642 53.29 53.17
Nasarawa 28,774 18,648 47,422 11,806 7,848 19,654 13,016 8,389 21,405 6,724 4,467 11,191 6,056 4,010 10,066 21.05 21.50
Niger 25,673 15,116 40,789 8,067 5,391 13,458 9,873 5,547 15,420 5,098 3,281 8,379 4,334 2,825 7,159 16.88 18.69
Ogun 13,923 13,968 27,891 9,792 10,166 19,958 10,522 10,507 21,029 8,159 8,382 16,541 7,551 7,878 15,429 54.23 56.40
Ondo 17,699 16,171 33,870 8,423 7,890 16,313 9,520 8,246 17,766 6,346 5,689 12,035 5,642 5,137 10,779 31.88 31.77
Osun 12,516 11,845 24,361 7,180 6,971 14,151 8,227 7,604 15,831 5,542 5,215 10,757 5,134 4,850 9,984 41.02 40.95
Oyo 29,258 29,048 58,306 18,806 19,066 37,872 20,660 20,332 40,992 15,315 15,390 30,705 14,367 14,687 29,054 49.10 50.56
Plateau 20,004 16,139 36,143 10,498 7,977 18,475 9,734 7,304 17,038 6,285 4,576 10,861 5,472 3,967 9,439 27.35 24.58
Rivers 7,237 7,815 15,052 5,079 5,598 10,677 5,297 5,797 11,094 4,108 4,544 8,652 3,909 4,372 8,281 54.01 55.94
Sokoto 12,783 4,679 17,462 3,918 2,084 6,002 2,162 1,674 3,836 1,207 897 2,104 786 597 1,383 6.15 12.76
Taraba 12,091 6,729 18,820 4,205 2,156 6,361 4,705 2,472 7,177 2,474 1,219 3,693 2,221 1,058 3,279 18.37 15.72
Yobe 12,777 4,657 17,434 1,712 929 2,641 1,406 658 2,064 651 299 950 511 278 789 4.00 5.97
Zamfara 22,105 5,915 28,020 3,043 999 4,042 5,295 1,328 6,623 1,437 423 1,860 1,232 371 1,603 5.57 6.27
Fct-Abuja 5,519 6,092 11,611 4,542 4,893 9,435 2,466 2,158 4,624 2,323 1,994 4,317 2,042 1,835 3,877 37.00 30.12
National 636,513 466,095 1,102,608 298,733 256,151 554,884 307,617 259,394 567,011 206,173 182,923 389,096 186,442 168,824 355,266 29.29 36.22
Total Number of
candidates SatCredit Pass in English
Credit Pass in
mathematics
Credit Pass in Maths &
Eng
Perc. of 5 Credits
including Maths
& Eng (%)
5 Credits including Maths &Eng

56
ST 3.5b: Distribution of NECO (SSC) Examination Result by State, Subject Year and Sex
(June/July), 2013
Source: National Examination Council (NECO)
M F Total M F Total M F Total M F Total M F Total M F
Abia 6,356 6,885 13,241 5,315 5,847 11,162 5,503 5,408 10,911 4,828 4,870 9,698 4,714 4,788 9,502 74.17 69.54
Adamawa 16,425 10,728 27,153 4,927 3,348 8,275 4,483 3,101 7,584 2,489 1,759 4,248 2,248 1,605 3,853 13.69 14.96
Akwa-Ibom 15,663 17,588 33,251 10,814 12,325 23,139 10,686 12,064 22,750 8,195 9,352 17,547 7,672 8,839 16,511 48.98 50.26
Anambra 8,458 10,095 18,553 7,330 8,522 15,852 6,653 7,180 13,833 6,004 6,358 12,362 5,885 6,225 12,110 69.58 61.66
Bauchi 17,826 7,790 25,616 7,846 4,064 11,910 11,589 5,487 17,076 6,145 3,399 9,544 5,623 3,193 8,816 31.54 40.99
Bayelsa 7,095 6,044 13,139 5,993 5,256 11,249 5,674 4,857 10,531 5,193 4,513 9,706 5,100 4,459 9,559 71.88 73.78
Benue 28,799 19,414 48,213 21,463 14,501 35,964 18,591 12,654 31,245 15,166 10,299 25,465 14,773 10,027 24,800 51.30 51.65
Borno 18,687 12,183 30,870 8,640 6,432 15,072 8,965 6,626 15,591 6,221 4,763 10,984 5,956 4,484 10,440 31.87 36.81
Cross-River 9,263 8,575 17,838 6,662 6,423 13,085 6,344 5,955 12,299 5,056 4,763 9,819 4,836 4,542 9,378 52.21 52.97
Delta 12,388 12,288 24,676 9,533 9,717 19,250 9,201 9,039 18,240 7,596 7,618 15,214 7,218 7,284 14,502 58.27 59.28
Ebonyi 7,120 6,234 13,354 5,962 5,174 11,136 5,153 4,403 9,556 4,537 3,895 8,432 4,433 3,816 8,249 62.26 61.21
Edo 18,506 17,069 35,575 15,342 14,530 29,872 15,749 14,430 30,179 13,599 12,710 26,309 13,165 12,410 25,575 71.14 72.70
Ekiti 5,939 6,117 12,056 4,468 4,726 9,194 4,444 4,539 8,983 3,565 3,773 7,338 3,323 3,574 6,897 55.95 58.43
Enugu 14,714 18,976 33,690 11,547 14,405 25,952 11,431 14,326 25,757 9,586 11,737 21,323 9,263 11,275 20,538 62.95 59.42
Gombe 10,433 6,247 16,680 5,073 3,136 8,209 5,980 3,803 9,783 3,786 2,447 6,233 3,330 2,180 5,510 31.92 34.90
Imo 13,918 16,300 30,218 10,520 12,295 22,815 10,346 11,644 21,990 8,422 9,631 18,053 8,089 9,376 17,465 58.12 57.52
Jigawa 16,291 3,952 20,243 8,859 2,167 11,026 10,416 2,472 12,888 6,569 1,561 8,130 6,329 1,519 7,848 38.85 38.44
Kaduna 30,009 20,603 50,612 18,652 13,191 31,843 18,832 13,251 32,083 13,772 9,872 23,644 12,861 9,392 22,253 42.86 45.59
Kano 39,163 15,379 54,542 23,157 10,773 33,930 27,471 12,224 39,695 19,385 9,333 28,718 17,704 8,831 26,535 45.21 57.42
Katsina 28,849 11,166 40,015 13,641 5,947 19,588 13,789 5,598 19,387 8,941 3,833 12,774 8,127 3,468 11,595 28.17 31.06
Kebbi 18,162 6,689 24,851 7,147 2,560 9,707 8,115 3,056 11,171 4,244 1,521 5,765 4,046 1,354 5,400 22.28 20.24
Kogi 16,089 12,403 28,492 13,516 10,547 24,063 13,289 10,257 23,546 11,623 8,983 20,606 11,399 8,789 20,188 70.85 70.86
Kwara 10,977 9,072 20,049 9,256 7,624 16,880 7,813 6,288 14,101 6,841 5,498 12,339 6,500 5,262 11,762 59.21 58.00
Lagos 21,664 21,433 43,097 18,181 18,271 36,452 16,588 15,484 32,072 14,775 13,969 28,744 13,978 13,422 27,400 64.52 62.62
Nasarawa 22,833 15,321 38,154 12,870 8,739 21,609 13,650 9,152 22,802 9,232 6,244 15,476 8,605 5,856 14,461 37.69 38.22
Niger 20,958 13,537 34,495 9,938 6,916 16,854 10,541 7,023 17,564 6,755 4,785 11,540 6,023 4,375 10,398 28.74 32.32
Ogun 13,139 13,063 26,202 11,319 11,393 22,712 11,083 10,458 21,541 9,924 9,493 19,417 9,607 9,255 18,862 73.12 70.85
Ondo 17,116 15,897 33,013 11,304 10,876 22,180 10,750 9,264 20,014 8,291 7,379 15,670 7,631 6,824 14,455 44.58 42.93
Osun 12,528 12,468 24,996 9,925 9,979 19,904 9,813 9,247 19,060 8,325 7,887 16,212 7,962 7,612 15,574 63.55 61.05
Oyo 29,405 29,091 58,496 23,337 23,341 46,678 23,664 22,443 46,107 19,937 19,053 38,990 19,347 18,553 37,900 65.79 63.78
Plateau 17,859 14,319 32,178 11,917 9,642 21,559 10,447 8,132 18,579 8,000 6,312 14,312 7,592 5,921 13,513 42.51 41.35
Rivers 5,869 6,215 12,084 4,871 5,206 10,077 4,661 4,669 9,330 4,073 4,033 8,106 3,965 3,933 7,898 67.56 63.28
Sokoto 17,155 5,806 22,961 6,946 3,072 10,018 6,219 2,369 8,588 3,661 1,610 5,271 2,917 1,382 4,299 17.00 23.80
Taraba 12,511 6,554 19,065 7,165 3,619 10,784 7,551 3,866 11,417 5,105 2,549 7,654 4,759 2,390 7,149 38.04 36.47
Yobe 11,939 4,521 16,460 3,264 1,097 4,361 2,658 1,536 4,194 1,318 651.00 1,969 1,172 597.00 1,769 9.82 13.21
Zamfara 20,714 6,663 27,377 5,539 2,214 7,753 8,203 2,937 11,140 3,421 1,320 4,741 3,126 1,192 4,318 15.09 17.89
Fct-Abuja 6,033 6,725 12,758 5,357 6,036 11,393 3,641 3,086 6,727 3,422 2,902 6,324 3,187 2,685 5,872 52.83 39.93
National 600,853 433,410 1,034,263 377,596 303,911 681,507 379,986 288,328 668,314 288,002 230,675 518,677 272,465 220,689 493,154 45.35 50.92
Total Number of candidates Sat Credit Pass in English Credit Pass in mathematics Credit Pass in Maths & Eng5 Credits including Maths
&Eng
Perc. of 5
Credits
including Maths
& Eng (% )
State

57
ST 3.5c: Distribution of NECO (SSC) Examination Result by State, Subject, Year and
Sex, (June/July), 2014
Source: National Examination Council (NECO)
M F Total M F Total M F Total M F Total M F Total M F
Abia5,777 6,459 12,236 4,787 5,394 10,181 4,509 5,221 9,730 4,020 4,651 8,671 3,958 4,570 8,528 68.51 70.75
Adamawa15,203 9,934 25,137 9,800 6,195 15,995 8,424 5,187 13,611 6,552 3,954 10,506 6,137 3,727 9,864 40.37 37.52
Akwa-Ibom13,601 15,735 29,336 9,973 11,375 21,348 9,672 11,016 20,688 7,826 8,810 16,636 7,439 8,406 15,845 54.69 53.42
Anambra8,153 9,634 17,787 6,964 7,897 14,861 6,188 7,011 13,199 5,527 6,138 11,665 5,410 6,000 11,410 66.36 62.28
Bauchi20,255 8,723 28,978 11,876 5,241 17,117 12,747 6,443 19,190 8,440 4,297 12,737 8,040 4,181 12,221 39.69 47.93
Bayelsa6,884 6,142 13,026 5,678 5,090 10,768 5,648 5,165 10,813 5,029 4,578 9,607 4,943 4,515 9,458 71.80 73.51
Benue23,271 17,117 40,388 16,912 12,413 29,325 15,858 11,824 27,682 12,806 9,451 22,257 12,212 9,062 21,274 52.48 52.94
Borno17,072 11,089 28,161 10,003 6,099 16,102 10,241 7,904 18,145 7,573 5,099 12,672 7,194 4,896 12,090 42.14 44.15
Cross-River7,103 6,962 14,065 4,972 4,928 9,900 4,670 4,539 9,209 3,596 3,528 7,124 3,414 3,335 6,749 48.06 47.90
Delta11,052 10,995 22,047 9,170 9,160 18,330 9,059 8,661 17,720 7,898 7,551 15,449 7,530 7,205 14,735 68.13 65.53
Ebonyi5,605 5,202 10,807 4,780 4,365 9,145 4,884 4,434 9,318 4,295 3,861 8,156 4,228 3,804 8,032 75.43 73.13
Edo14,927 14,123 29,050 12,918 12,346 25,264 12,787 12,117 24,904 11,475 10,995 22,470 11,002 10,642 21,644 73.71 75.35
Ekiti6,975 7,100 14,075 5,691 5,991 11,682 5,441 5,604 11,045 4,675 4,911 9,586 4,394 4,707 9,101 63.00 66.30
Enugu12,904 16,960 29,864 11,095 14,364 25,459 10,604 13,368 23,972 9,487 11,853 21,340 9,145 11,438 20,583 70.87 67.44
Gombe11,623 6,710 18,333 7,753 4,498 12,251 7,205 4,383 11,588 5,410 3,343 8,753 4,813 3,068 7,881 41.41 45.72
Imo11,404 13,436 24,840 9,537 11,258 20,795 9,173 10,647 19,820 8,060 9,400 17,460 7,738 9,125 16,863 67.85 67.91
Jigawa14,259 4,246 18,505 10,034 2,359 12,393 7,712 2,649 10,361 6,260 1,746 8,006 5,865 1,675 7,540 41.13 39.45
Kaduna27,143 19,602 46,745 19,920 14,038 33,958 19,650 13,520 33,170 15,711 10,640 26,351 14,722 10,021 24,743 54.24 51.12
Kano37,579 14,148 51,727 24,897 9,480 34,377 26,588 11,066 37,654 20,046 8,131 28,177 19,248 7,915 27,163 51.22 55.94
Katsina30,103 12,859 42,962 15,343 5,488 20,831 15,142 6,024 21,166 9,747 3,428 13,175 9,137 3,235 12,372 30.35 25.16
Kebbi 19,421 7,389 26,810 10,864 3,999 14,863 8,561 3,318 11,879 5,732 2,393 8,125 5,251 2,233 7,484 27.04 30.22
Kogi 15,153 11,523 26,676 13,072 10,102 23,174 11,880 8,936 20,816 10,680 8,142 18,822 10,445 7,958 18,403 68.93 69.06
Kwara11,568 9,769 21,337 8,355 7,188 15,543 8,751 7,265 16,016 6,724 5,694 12,418 6,485 5,543 12,028 56.06 56.74
Lagos20,632 20,056 40,688 18,066 17,532 35,598 16,514 15,469 31,983 15,129 14,181 29,310 14,368 13,635 28,003 69.64 67.98
Nasarawa22,093 15,555 37,648 16,046 11,175 27,221 15,266 10,884 26,150 12,248 8,563 20,811 11,441 8,045 19,486 51.79 51.72
Niger22,564 15,021 37,585 12,085 8,397 20,482 12,462 8,220 20,682 7,826 5,338 13,164 6,916 4,876 11,792 30.65 32.46
Ogun 8,294 8,217 16,511 6,659 6,628 13,287 6,492 6,099 12,591 5,486 5,267 10,753 5,284 5,111 10,395 63.71 62.20
Ondo14,639 14,442 29,081 11,638 11,472 23,110 10,014 9,083 19,097 8,558 7,875 16,433 7,964 7,442 15,406 54.40 51.53
Osun10,755 11,015 21,770 9,437 9,631 19,068 8,550 8,541 17,091 7,761 7,782 15,543 7,550 7,608 15,158 70.20 69.07
Oyo27,972 28,135 56,107 22,854 22,565 45,419 21,493 21,376 42,869 18,660 18,461 37,121 18,121 18,026 36,147 64.78 64.07
Plateau17,834 14,659 32,493 13,742 10,993 24,735 11,399 8,994 20,393 9,596 7,387 16,983 8,993 6,890 15,883 50.43 47.00
Rivers 5,071 5,302 10,373 4,245 4,513 8,758 4,278 4,347 8,625 3,728 3,822 7,550 3,637 3,740 7,377 71.72 70.54
Sokoto 18,309 6,605 24,914 10,149 3,386 13,535 8,632 3,787 12,419 5,970 2,156 8,126 5,299 1,864 7,163 28.94 28.22
Taraba11,885 6,395 18,280 7,632 4,377 12,009 8,318 4,366 12,684 5,896 3,322 9,218 5,658 3,148 8,806 47.61 49.23
Yobe12,401 4,283 16,684 6,097 2,031 8,128 5,106 2,515 7,621 3,437 1,626 5,063 3,127 1,582 4,709 25.22 36.94
Zamfara21,700 6,545 28,245 11,546 2,831 14,377 11,748 3,887 15,635 7,260 1,974 9,234 6,767 1,930 8,697 31.18 29.49
Fct-Abuja 7,210 8,405 15,615 5,935 6,791 12,726 3,985 4,008 7,993 3,602 3,608 7,210 3,433 3,465 6,898 47.61 41.23
National 568,394 410,492 978,886 400,525 301,590 702,115 379,651 287,878 667,529 302,726 233,956 536,682 287,308 224,623 511,931 50.55 54.72
Total Number of
candidates SatCredit Pass in English Credit Pass in mathematicsCredit Pass in Maths & Eng
5 Credits including
Maths &Eng
Perc. of 5
Credits
including Maths
& Eng (% )
State

58
ST 3.5d: Distribution of NECO (SSC) Examination Result by State, Subject, Year and
Sex, (June/July), 2015
Source: National Examination Council (NECO)
M F Total M F Total M F Total M F Total M F Total M F
Abia 5,410 6,144 11,554 5,033 5,765 10,798 4,809 5,137 9,946 4,575 4,932 9,507 4,517 4,886 9,403 83.49 79.52
Adamawa 13,866 9,566 23,432 11,671 8,075 19,746 10,759 7,332 18,091 9,522 6,445 15,967 9,160 6,212 15,372 66.06 64.94
Akwa-Ibom 13,258 15,413 28,671 11,018 12,793 23,811 10,543 12,042 22,585 9,201 10,586 19,787 8,982 10,417 19,399 67.75 67.59
Anambra 8,739 10,509 19,248 7,968 9,599 17,567 7,517 9,069 16,586 7,024 8,475 15,499 6,947 8,390 15,337 79.49 79.84
Bauchi 23,714 9,413 33,127 17,715 7,395 25,110 19,438 8,017 27,455 15,401 6,631 22,032 14,869 6,516 21,385 62.70 69.22
Bayelsa 6,807 6,150 12,957 6,234 5,702 11,936 5,850 5,275 11,125 5,621 5,066 10,687 5,510 4,998 10,508 80.95 81.27
Benue 21,426 16,672 38,098 18,756 14,348 33,104 18,036 13,848 31,884 16,307 12,382 28,689 16,065 12,189 28,254 74.98 73.11
Borno 12,226 8,147 20,373 9,956 6,920 16,876 9,424 6,864 16,288 8,249 6,029 14,278 8,109 5,955 14,064 66.33 73.09
Cross-River 7,269 7,596 14,865 6,381 6,716 13,097 5,980 6,066 12,046 5,428 5,555 10,983 5,238 5,365 10,603 72.06 70.63
Delta 11,051 11,337 22,388 10,110 10,455 20,565 10,117 10,314 20,431 9,444 9,701 19,145 9,212 9,486 18,698 83.36 83.67
Ebonyi 5,517 5,138 10,655 5,241 4,859 10,100 4,781 4,404 9,185 4,602 4,223 8,825 4,571 4,185 8,756 82.85 81.45
Edo 13,381 12,572 25,953 12,088 11,577 23,665 12,272 11,462 23,734 11,307 10,737 22,044 11,078 10,572 21,650 82.79 84.09
Ekiti 6,509 6,864 13,373 5,957 6,373 12,330 5,768 6,151 11,919 5,380 5,830 11,210 5,278 5,766 11,044 81.09 84.00
Enugu 12,060 15,852 27,912 10,516 13,767 24,283 10,698 13,665 24,363 9,631 12,214 21,845 9,459 12,050 21,509 78.43 76.02
Gombe 11,276 7,267 18,543 8,554 5,614 14,168 8,384 5,291 13,675 7,089 4,647 11,736 6,844 4,549 11,393 60.70 62.60
Imo 11,511 13,475 24,986 9,890 11,865 21,755 9,789 11,684 21,473 8,753 10,584 19,337 8,639 10,504 19,143 75.05 77.95
Jigawa 14,927 4,981 19,908 9,434 3,060 12,494 10,190 3,049 13,239 7,270 2,191 9,461 7,103 2,160 9,263 47.58 43.36
Kaduna 25,624 17,545 43,169 20,671 14,210 34,881 21,525 14,803 36,328 18,217 12,480 30,697 17,662 12,183 29,845 68.93 69.44
Kano 43,604 16,884 60,488 31,373 13,575 44,948 31,350 13,027 44,377 25,070 11,184 36,254 24,212 10,975 35,187 55.53 65.00
Katsina 31,288 13,565 44,853 21,132 7,898 29,030 20,427 7,971 28,398 15,834 5,664 21,498 15,097 5,436 20,533 48.25 40.07
Kebbi 20,396 7,985 28,381 15,077 5,976 21,053 15,232 5,538 20,770 12,321 4,560 16,881 11,929 4,405 16,334 58.49 55.17
Kogi 13,784 10,340 24,124 12,437 9,331 21,768 12,349 9,190 21,539 11,342 8,450 19,792 11,183 8,338 19,521 81.13 80.64
Kwara 11,747 9,749 21,496 10,256 8,581 18,837 10,235 8,406 18,641 9,204 7,585 16,789 9,097 7,517 16,614 77.44 77.11
Lagos 23,154 23,699 46,853 22,165 22,795 44,960 20,534 20,159 40,693 19,895 19,613 39,508 19,382 19,222 38,604 83.71 81.11
Nasarawa 19,574 14,869 34,443 16,261 12,229 28,490 15,997 12,229 28,226 13,934 10,531 24,465 13,573 10,270 23,843 69.34 69.07
Niger 17,679 12,703 30,382 13,029 9,316 22,345 13,598 9,367 22,965 10,935 7,619 18,554 10,358 7,134 17,492 58.59 56.16
Ogun 10,640 10,679 21,319 9,703 9,839 19,542 9,144 8,890 18,034 8,534 8,360 16,894 8,383 8,233 16,616 78.79 77.10
Ondo 9,809 10,228 20,037 8,635 9,080 17,715 8,047 8,266 16,313 7,407 7,625 15,032 7,284 7,524 14,808 74.26 73.56
Osun 12,249 12,392 24,641 10,831 10,986 21,817 10,731 10,677 21,408 9,853 9,810 19,663 9,731 9,699 19,430 79.44 78.27
Oyo 28,931 30,370 59,301 26,298 27,531 53,829 25,773 26,368 52,141 23,994 24,521 48,515 23,683 24,289 47,972 81.86 79.98
Plateau 17,199 14,530 31,729 14,401 11,945 26,346 13,468 11,189 24,657 11,736 9,541 21,277 11,430 9,272 20,702 66.46 63.81
Rivers 5,365 5,535 10,900 5,037 5,299 10,336 4,537 4,515 9,052 4,361 4,385 8,746 4,247 4,322 8,569 79.16 78.08
Sokoto 20,516 7,105 27,621 15,385 5,195 20,580 15,463 5,483 20,946 12,553 4,287 16,840 11,500 4,101 15,601 56.05 57.72
Taraba 10,358 5,829 16,187 8,698 4,787 13,485 8,488 4,718 13,206 7,485 4,062 11,547 7,292 3,966 11,258 70.40 68.04
Yobe 12,391 4,427 16,818 7,590 2,202 9,792 6,877 1,961 8,838 5,046 1,331 6,377 4,759 1,316 6,075 38.41 29.73
Zamfara 18,293 6,306 24,599 11,065 3,649 14,714 11,034 3,252 14,286 7,734 2,152 9,886 7,376 2,116 9,492 40.32 33.56
Fct-Abuja 7,538 8,568 16,106 6,856 7,749 14,605 5,829 5,706 11,535 5,456 5,334 10,790 5,279 5,191 10,470 70.03 60.59
National 559,086 410,404 969,490 453,422 347,056 800,478 444,993 331,385 776,378 385,715 295,322 681,037 375,038 289,709 664,747 67.08 70.59
Total Number of candidates Sat Credit Pass in English Credit Pass in mathematics Credit Pass in Maths & Eng5 Credits including Maths
&Eng
Perc. of 5 Credits
including Maths &
Eng (% )State

59
ST 3.5e: Distribution of NECO (SSC) Examination Result by State, Subject, Year and
Sex, (June/July), 2016
Source: National Examination Council (NECO)
M F Total M F Total M F Total M F Total M F Total M F
Abia 5,324 5,980 11,304 5,004 5,713 10,717 4,898 5,405 10,303 4,714 5,220 9,934 4,667 5,190 9,857 87.66 86.79
Adamawa 23,612 14,385 37,997 17,697 10,686 28,383 18,238 10,850 29,088 14,531 8,581 23,112 14,135 8,382 22,517 59.86 58.27
Akwa-Ibom 12,554 14,871 27,425 11,160 13,482 24,642 10,411 12,401 22,812 9,660 11,628 21,288 9,436 11,427 20,863 75.16 76.84
Anambra 8,793 11,178 19,971 8,003 10,302 18,305 7,654 9,520 17,174 7,136 8,954 16,090 7,043 8,874 15,917 80.10 79.39
Bauchi 27,594 10,508 38,102 20,256 8,201 28,457 19,786 8,311 28,097 15,886 6,886 22,772 15,506 6,789 22,295 56.19 64.61
Bayelsa 2,599 2,557 5,156 2,428 2,444 4,872 2,347 2,313 4,660 2,261 2,260 4,521 2,221 2,227 4,448 85.46 87.09
Benue 20,997 15,703 36,700 19,289 14,558 33,847 18,221 13,368 31,589 17,146 12,641 29,787 16,917 12,490 29,407 80.57 79.54
Borno 8,226 5,019 13,245 6,602 3,975 10,577 7,097 4,406 11,503 6,011 3,658 9,669 5,931 3,625 9,556 72.10 72.23
Cross-River 8,027 7,637 15,664 7,425 7,180 14,605 6,821 6,635 13,456 6,463 6,347 12,810 6,320 6,228 12,548 78.73 81.55
Delta 9,809 10,430 20,239 9,207 9,926 19,133 8,752 9,268 18,020 8,404 8,937 17,341 8,235 8,756 16,991 83.95 83.95
Ebonyi 5,509 5,180 10,689 5,191 4,907 10,098 4,860 4,439 9,299 4,665 4,266 8,931 4,636 4,241 8,877 84.15 81.87
Edo 11,349 11,240 22,589 10,867 10,858 21,725 10,540 10,446 20,986 10,211 10,196 20,407 10,075 10,108 20,183 88.77 89.93
Ekiti 4,636 4,732 9,368 4,353 4,503 8,856 4,330 4,390 8,720 4,110 4,212 8,322 4,060 4,171 8,231 87.58 88.14
Enugu 12,447 15,517 27,964 10,949 13,731 24,680 10,435 12,777 23,212 9,443 11,611 21,054 9,332 11,484 20,816 74.97 74.01
Gombe 15,047 7,987 23,034 10,580 5,959 16,539 9,037 5,164 14,201 6,980 4,200 11,180 6,711 4,094 10,805 44.60 51.26
Imo 10,562 12,194 22,756 9,765 11,676 21,441 9,119 10,793 19,912 8,791 10,480 19,271 8,721 10,421 19,142 82.57 85.46
Jigawa 17,731 5,791 23,522 11,638 4,151 15,789 10,953 3,727 14,680 8,396 2,850 11,246 8,268 2,835 11,103 46.63 48.96
Kaduna 29,880 19,868 49,748 24,114 16,896 41,010 24,878 17,299 42,177 21,158 15,208 36,366 20,517 14,805 35,322 68.66 74.52
Kano 51,086 22,689 73,775 37,408 18,513 55,921 33,008 17,226 50,234 27,709 14,986 42,695 27,211 14,766 41,977 53.27 65.08
Katsina 33,366 14,772 48,138 21,665 9,465 31,130 18,512 8,790 27,302 14,802 6,719 21,521 14,524 6,626 21,150 43.53 44.86
Kebbi 19,416 8,198 27,614 13,494 6,064 19,558 13,188 6,111 19,299 10,313 4,769 15,082 10,018 4,593 14,611 51.60 56.03
Kogi 14,434 9,884 24,318 13,678 9,436 23,114 13,404 9,131 22,535 12,802 8,768 21,570 12,669 8,687 21,356 87.77 87.89
Kwara 11,410 9,714 21,124 10,245 8,886 19,131 9,869 8,216 18,085 8,997 7,634 16,631 8,921 7,587 16,508 78.19 78.10
Lagos 26,323 27,520 53,843 24,731 26,167 50,898 23,835 24,595 48,430 22,725 23,672 46,397 22,241 23,242 45,483 84.49 84.45
Nasarawa 19,159 13,424 32,583 17,392 12,340 29,732 16,897 11,772 28,669 15,664 10,973 26,637 15,487 10,875 26,362 80.83 81.01
Niger 22,228 15,237 37,465 16,497 10,998 27,495 16,093 11,268 27,361 13,009 8,856 21,865 12,358 8,307 20,665 55.60 54.52
Ogun 12,375 12,685 25,060 11,722 12,163 23,885 11,188 11,378 22,566 10,799 11,056 21,855 10,632 10,936 21,568 85.92 86.21
Ondo 13,042 12,564 25,606 11,805 11,610 23,415 11,560 11,204 22,764 10,767 10,584 21,351 10,570 10,459 21,029 81.05 83.25
Osun 14,521 14,641 29,162 13,284 13,519 26,803 13,270 13,357 26,627 12,397 12,582 24,979 12,193 12,417 24,610 83.97 84.81
Oyo 28,216 28,256 56,472 25,904 26,265 52,169 25,105 25,013 50,118 23,711 23,817 47,528 23,366 23,582 46,948 82.81 83.46
Plateau 18,928 15,333 34,261 16,313 13,214 29,527 15,545 12,293 27,838 13,855 10,930 24,785 13,610 10,746 24,356 71.90 70.08
Rivers 5,602 6,240 11,842 5,304 5,958 11,262 4,746 5,131 9,877 4,589 4,984 9,573 4,493 4,920 9,413 80.20 78.85
Sokoto 18,188 6,968 25,156 13,499 5,305 18,804 10,801 4,622 15,423 8,975 4,029 13,004 8,424 3,896 12,320 46.32 55.91
Taraba 12,842 6,776 19,618 11,063 5,863 16,926 10,110 5,405 15,515 9,076 4,877 13,953 8,900 4,766 13,666 69.30 70.34
Yobe 11,696 4,452 16,148 7,703 3,185 10,888 6,899 3,450 10,349 5,616 2,646 8,262 5,445 2,586 8,031 46.55 58.09
Zamfara 19,861 7,027 26,888 12,413 4,985 17,398 12,081 5,221 17,302 9,063 4,084 13,147 8,798 4,037 12,835 44.30 57.45
Fct-Abuja 8,137 9,772 17,909 7,243 8,708 15,951 6,225 6,430 12,655 5,761 5,984 11,745 5,596 5,775 11,371 68.77 59.10
Foreigner 8 11 19 6 10 16 3 5 8 3 4 7 3 4 7 37.50 36.36
NATIONAL 595,534 426,940 1,022,474 485,897 371,802 857,699 460,716 352,130 812,846 406,599 320,089 726,688 398,190 314,954 713,144 66.86 73.77
Total Number of candidates Sat Credit Pass in English Credit Pass in mathematics Credit Pass in Maths & Eng 5 Credits including Maths
&Eng
Perc. of 5
Credits
including Maths
& Eng (% )
State

60
ST 3.6a: Distribution of NECO (SSC) Examination Result by State, Subject, Year and
Sex, (Nov/Dec.), 2012
Source: National Examination Council (NECO)
M F Total M F Total M F Total M F Total M F Total M F
Abia395 309 704 228 179 407 265 219 484 183 154 337 100 95 195 25.32 30.74
Adamawa 324 175 499 33 21 54 113 47 160 16 8 24 6 3 9 1.85 1.71
Akwa-Ibom 869 660 1,529 252 212 464 528 424 952 192 168 360 96 96 192 11.05 14.55
Anambra 431 417 848 48 40 88 159 148 307 28 19 47 10 8 18 2.32 1.92
Bauchi 790 258 1,048 91 39 130 227 63 290 22 7 29 6 0 6 0.76 -
Bayelsa 698 403 1,101 150 87 237 279 159 438 84 49 133 30 22 52 4.30 5.46
Benue 152 64 216 17 8 25 89 40 129 12 6 18 1 2 3 0.66 3.13
Borno 616 485 1,101 160 116 276 265 224 489 104 71 175 34 21 55 5.52 4.33
Cross-River 1,627 1,250 2,877 659 519 1,178 644 508 1,152 357 281 638 68 81 149 4.18 6.48
Delta 953 655 1,608 399 290 689 400 302 702 245 187 432 44 28 72 4.62 4.27
Ebonyi 1,377 1,345 2,722 449 424 873 664 657 1,321 276 270 546 67 74 141 4.87 5.50
Edo 714 692 1,406 277 270 547 345 366 711 179 191 370 88 104 192 12.32 15.03
Ekiti 826 158 984 50 17 67 236 58 294 31 6 37 1 1 2 0.12 0.63
Enugu 2,157 929 3,086 561 290 851 1,096 506 1,602 389 210 599 148 89 237 6.86 9.58
Gombe 3,698 1,085 4,783 847 307 1,154 1,955 629 2,584 663 256 919 252 107 359 6.81 9.86
Imo 4,342 581 4,923 305 49 354 1,146 158 1,304 125 20 145 19 5 24 0.44 0.86
Jigawa 528 214 742 107 47 154 237 125 362 71 36 107 26 7 33 4.92 3.27
Kaduna 611 448 1,059 159 120 279 368 303 671 129 103 232 46 47 93 7.53 10.49
Kano 827 668 1,495 319 274 593 469 347 816 234 186 420 97 83 180 11.73 12.43
Katsina 3,993 2,933 6,926 1,714 1,300 3,014 2,570 1,945 4,515 1,302 1,022 2,324 490 452 942 12.27 15.41
Kebbi 3,104 1,423 4,527 581 297 878 1,404 687 2,091 450 229 679 196 98 294 6.31 6.89
Kogi 3,704 3,153 6,857 1,735 1,420 3,155 2,738 2,344 5,082 1,505 1,232 2,737 827 723 1,550 22.33 22.93
Kwara 719 632 1,351 142 128 270 261 211 472 67 47 114 6 6 12 0.83 0.95
Lagos 1,673 1,301 2,974 446 319 765 572 407 979 226 159 385 55 45 100 3.29 3.46
Nasarawa 6,803 5,660 12,463 3,111 2,597 5,708 4,531 3,935 8,466 2,429 2,062 4,491 1,058 1,041 2,099 15.55 18.39
Niger 677 395 1,072 193 110 303 207 122 329 98 58 156 32 16 48 4.73 4.05
Ogun 1,751 1,380 3,131 619 479 1,098 1,013 805 1,818 465 351 816 206 184 390 11.76 13.33
Ondo 506 102 608 49 16 65 116 41 157 23 10 33 1 2 3 0.20 1.96
Osun 460 193 653 140 61 201 156 78 234 94 45 139 29 17 46 6.30 8.81
Oyo 825 179 1,004 52 17 69 265 61 326 29 8 37 2 2 4 0.24 1.12
Plateau 847 629 1,476 239 137 376 96 51 147 48 24 72 4 3 7 0.47 0.48
Rivers 123 95 218 10 6 16 14 7 21 4 1 5 4 1 5 3.25 1.05
Sokoto 503 360 863 171 100 271 190 136 326 102 66 168 26 26 52 5.17 7.22
Taraba 593 532 1,125 244 215 459 367 350 717 183 179 362 61 57 118 10.29 10.71
Yobe 342 166 508 25 7 32 38 29 67 8 4 12 1 0 1 0.29 -
Zamfara 820 465 1,285 339 173 512 385 229 614 193 103 296 39 36 75 4.76 7.74
Fct-Abuja 179 66 245 11 7 18 69 30 99 7 1 8 0 0 - - -
National 49,557 30,460 80,017 14,932 10,698 25,630 24,477 16,751 41,228 10,573 7,829 18,402 4,176 3,582 7,758 8.43 11.76
Total Number of
candidates Sat
Credit Pass in
English
Credit Pass in
mathematics
Credit Pass in Maths
& Eng
5 Credits including
Maths &Eng
Perc. of 5
Credits
including
Maths & Eng
(%)
State

61
ST 3.6b: Distribution of NECO (SSC) Examination Result by State, Subject, Year and
Sex, (Nov/Dec.), 2013
Source: National Examination Council (NECO)
M F Total M F Total M F Total M F Total M F Total M F
Abia285 244 529 205 183 388 192 167 359 159 146 305 141 129 270 49.47 52.87
Adamawa 295 168 463 122 78 200 116 76 192 78 58 136 32 15 47 10.85 8.93
Akwa-Ibom 508 384 892 211 179 390 327 242 569 165 120 285 117 86 203 23.03 22.40
Anambra 258 266 524 130 140 270 103 108 211 61 73 134 38 48 86 14.73 18.05
Bauchi 1,704 386 2,090 611 161 772 544 150 694 293 82 375 111 31 142 6.51 8.03
Bayelsa 130 94 224 52 49 101 95 73 168 39 43 82 24 30 54 18.46 31.91
Benue 546 282 828 195 80 275 234 104 338 117 48 165 66 29 95 12.09 10.28
Borno 85 42 127 19 9 28 33 20 53 12 6 18 5 - 5 5.88 -
Cross-River 340 258 598 136 98 234 154 117 271 87 54 141 48 27 75 14.12 10.47
Delta 1,207 988 2,195 521 449 970 611 524 1,135 350 306 656 157 141 298 13.01 14.27
Ebonyi 319 207 526 125 93 218 94 66 160 48 30 78 30 16 46 9.40 7.73
Edo 588 451 1,039 240 220 460 309 238 547 153 134 287 71 59 130 12.07 13.08
Ekiti 612 514 1,126 365 321 686 348 274 622 244 230 474 197 192 389 32.19 37.35
Enugu 652 587 1,239 252 174 426 311 294 605 145 103 248 103 72 175 15.80 12.27
Gombe 493 243 736 81 42 123 110 58 168 30 16 46 12 10 22 2.43 4.12
Imo 371 347 718 94 80 174 191 204 395 61 56 117 49 43 92 13.21 12.39
Jigawa 724 79 803 281 29 310 265 45 310 116 16 132 72 13 85 9.94 16.46
Kaduna 1,535 750 2,285 595 296 891 732 401 1,133 336 184 520 209 123 332 13.62 16.40
Kano 3,170 835 4,005 1,311 416 1,727 1,873 542 2,415 879 305 1,184 536 217 753 16.91 25.99
Katsina 2,970 454 3,424 707 128 835 1,044 175 1,219 343 65 408 137 37 174 4.61 8.15
Kebbi 783 287 1,070 250 122 372 443 193 636 186 106 292 109 74 183 13.92 25.78
Kogi 510 379 889 143 100 243 168 121 289 63 51 114 42 36 78 8.24 9.50
Kwara 783 634 1,417 462 362 824 396 343 739 307 257 564 223 210 433 28.48 33.12
Lagos 2,363 1,798 4,161 1,518 1,184 2,702 1,415 1,136 2,551 1,035 825 1,860 485 387 872 20.52 21.52
Nasarawa 651 372 1,023 376 242 618 287 198 485 202 149 351 102 78 180 15.67 20.97
Niger 2,736 1,369 4,105 1,076 608 1,684 1,200 734 1,934 743 459 1,202 536 344 880 19.59 25.13
Ogun 2,535 2,202 4,737 1,417 1,290 2,707 1,952 1,720 3,672 1,210 1,106 2,316 895 872 1,767 35.31 39.60
Ondo 681 481 1,162 235 165 400 245 187 432 124 81 205 54 37 91 7.93 7.69
Osun 1,173 897 2,070 613 467 1,080 471 362 833 309 235 544 103 83 186 8.78 9.25
Oyo 4,773 4,192 8,965 2,842 2,469 5,311 2,947 2,599 5,546 2,037 1,790 3,827 1,614 1,458 3,072 33.82 34.78
Plateau 544 326 870 236 155 391 294 172 466 170 116 286 104 67 171 19.12 20.55
Rivers 806 619 1,425 483 382 865 519 437 956 369 300 669 252 229 481 31.27 37.00
Sokoto 401 106 507 139 51 190 129 50 179 81 38 119 62 25 87 15.46 23.58
Taraba 468 181 649 239 85 324 134 58 192 91 37 128 44 25 69 9.40 13.81
Yobe 1,082 234 1,316 475 99 574 495 99 594 258 51 309 92 23 115 8.50 9.83
Zamfara 165 43 208 15 3 18 16 6 22 4 1 5 2 1 3 1.21 2.33
Fct-Abuja 490 401 891 188 144 332 70 41 111 47 27 74 13 11 24 2.65 2.74
National 37,736 22,100 59,836 16,960 11,153 28,113 18,867 12,334 31,201 10,952 7,704 18,656 6,887 5,278 12,165 18.25 23.88
Total Number of
candidates Sat
Credit Pass in
English
Credit Pass in
mathematics
Credit Pass in
Maths & Eng
5 Credits including
Maths &Eng
Perc. of 5
Credits
including
Maths &
Eng (%)
State

62
ST 3.6c: Distribution of NECO (SSC) Examination Result by State, Subject, Year and
Sex, (Nov/Dec.), 2014
Source: National Examination Council (NECO)
M F Total M F Total M F Total M F Total M F Total M F
Abia 341 318 659 201 204 405 241 235 476 173 165 338 149 149 298 43.70 46.86
Adamawa 160 101 261 62 31 93 60 36 96 36 16 52 8 2 10 5.00 1.98
Akwa-Ibom 608 589 1,197 388 370 758 391 421 812 262 280 542 180 213 393 29.61 36.16
Anambra 314 291 605 146 140 286 159 144 303 93 78 171 47 51 98 14.97 17.53
Bauchi 753 180 933 317 76 393 264 71 335 164 41 205 68 19 87 9.03 10.56
Bayelsa 116 83 199 28 24 52 11 7 18 3 4 7 1 3 4 0.86 3.61
Benue 487 281 768 260 129 389 121 77 198 89 51 140 26 14 40 5.34 4.98
Borno 114 62 176 50 16 66 17 8 25 11 3 14 4 2 6 3.51 3.23
Cross-River 365 293 658 134 131 265 72 66 138 45 40 85 16 20 36 4.38 6.83
Delta 1,183 1,059 2,242 505 492 997 489 478 967 261 276 537 139 148 287 11.75 13.98
Ebonyi 274 224 498 153 122 275 112 97 209 78 69 147 46 46 92 16.79 20.54
Edo 430 344 774 192 173 365 172 140 312 102 90 192 40 25 65 9.30 7.27
Ekiti 373 393 766 229 267 496 223 238 461 162 175 337 73 80 153 19.57 20.36
Enugu 656 654 1,310 421 444 865 353 401 754 245 305 550 176 260 436 26.83 39.76
Gombe 499 463 962 186 176 362 97 73 170 50 43 93 17 17 34 3.41 3.67
Imo 363 160 523 117 51 168 107 34 141 40 10 50 5 4 9 1.38 2.50
Jigawa 383 349 732 202 202 404 124 144 268 82 95 177 53 67 120 13.84 19.20
Kaduna 1,459 189 1,648 447 95 542 341 69 410 145 41 186 38 12 50 2.60 6.35
Kano 1,233 586 1,819 688 357 1,045 555 287 842 389 215 604 223 131 354 18.09 22.35
Katsina 3,098 852 3,950 1,266 385 1,651 1,888 594 2,482 921 302 1,223 481 187 668 15.53 21.95
Kebbi 2,330 375 2,705 731 153 884 679 172 851 362 93 455 174 54 228 7.47 14.40
Kogi 477 175 652 242 101 343 202 102 304 132 65 197 76 35 111 15.93 20.00
Kwara 395 312 707 242 202 444 157 143 300 113 97 210 43 19 62 10.89 6.09
Lagos 784 683 1,467 487 411 898 499 430 929 399 332 731 299 267 566 38.14 39.09
Nasarawa 2,305 1,845 4,150 1,620 1,292 2,912 1,444 1,206 2,650 1,096 913 2,009 718 592 1,310 31.15 32.09
Niger 762 490 1,252 451 293 744 354 233 587 243 160 403 105 60 165 13.78 12.24
Ogun 2,961 1,612 4,573 1,038 606 1,644 1,404 863 2,267 679 442 1,121 409 294 703 13.81 18.24
Ondo 3,456 3,059 6,515 2,139 1,928 4,067 2,638 2,457 5,095 1,754 1,626 3,380 1,401 1,370 2,771 40.54 44.79
Osun 553 510 1,063 248 248 496 253 219 472 153 144 297 69 66 135 12.48 12.94
Oyo 1,236 1,058 2,294 574 474 1,048 601 473 1,074 371 306 677 187 165 352 15.13 15.60
Plateau 5,061 4,501 9,562 2,895 2,589 5,484 3,347 3,124 6,471 2,117 1,957 4,074 1,593 1,539 3,132 31.48 34.19
Rivers 640 458 1,098 216 173 389 151 105 256 86 63 149 53 44 97 8.28 9.61
Sokoto 834 728 1,562 537 474 1,011 504 474 978 369 319 688 246 234 480 29.50 32.14
Taraba 510 183 693 323 137 460 362 144 506 290 119 409 234 105 339 45.88 57.38
Yobe 343 186 529 152 77 229 52 42 94 27 23 50 3 6 9 0.87 3.23
Zamfara 1,439 259 1,698 635 102 737 436 70 506 258 37 295 102 14 116 7.09 5.41
Fct-Abuja 94 92 186 51 46 97 24 33 57 16 25 41 8 8 16 8.51 8.70
National 37,389 23,997 61,386 18,573 13,191 31,764 18,904 13,910 32,814 11,816 9,020 20,836 7,510 6,322 13,832 20.09 26.34
Total Number of candidates
SatCredit Pass in English Credit Pass in mathematics Credit Pass in Maths & Eng
5 Credits including Maths
&Eng
Perc. of 5 Credits
including Maths
& Eng (% )State

63
ST 3.6d: Distribution of NECO (SSC) Examination Result by State, Subject, Year and
Sex, (Nov/Dec.), 2015
Source: National Examination Council (NECO)
M F Total M F Total M F Total M F Total M F Total M F
Abia 351 355 706 280 289 569 298 314 612 254 277 531 240 263 503 68.38 74.08
Adamawa 363 159 522 191 88 279 180 72 252 102 41 143 90 37 127 24.79 23.27
Akwa-Ibom659 767 1,426 305 326 631 378 410 788 215 226 441 182 184 366 27.62 23.99
Anambra 281 255 536 216 190 406 192 169 361 131 129 260 124 109 233 44.13 42.75
Bauchi 1,164 250 1,414 409 74 483 616 113 729 125 24 149 100 20 120 8.59 8.00
Bayelsa 73 54 127 46 33 79 30 28 58 14 14 28 10 11 21 13.70 20.37
Benue 446 222 668 178 97 275 207 92 299 85 33 118 57 25 82 12.78 11.26
Borno 70 47 117 40 24 64 45 25 70 7 9 16 7 5 12 10.00 10.64
Cross-
River 349 344 693 179 181 360 200 198 398 82 80 162 68 67 135 19.48 19.48
Delta 726 671 1,397 411 372 783 462 412 874 191 180 371 166 156 322 22.87 23.25
Ebonyi 156 161 317 90 102 192 70 70 140 54 59 113 40 42 82 25.64 26.09
Edo 316 251 567 158 116 274 158 128 286 61 48 109 46 34 80 14.56 13.55
Ekiti 376 301 677 221 198 419 305 251 556 139 135 274 118 118 236 31.38 39.20
Enugu 444 485 929 258 301 559 276 297 573 147 194 341 131 159 290 29.50 32.78
Gombe 432 159 591 50 19 69 120 39 159 22 10 32 11 5 16 2.55 3.14
Imo 222 270 492 156 190 346 169 202 371 80 104 184 74 94 168 33.33 34.81
Jigawa 443 55 498 196 21 217 93 14 107 29 5 34 20 5 25 4.51 9.09
Kaduna 1,036 559 1,595 659 390 1,049 666 377 1,043 362 195 557 298 180 478 28.76 32.20
Kano 2,169 572 2,741 1,347 359 1,706 1,504 431 1,935 661 198 859 596 175 771 27.48 30.59
Katsina 351 91 442 167 37 204 234 58 292 82 24 106 77 22 99 21.94 24.18
Kebbi 255 138 393 130 77 207 199 111 310 125 63 188 86 42 128 33.73 30.43
Kogi 250 178 428 121 85 206 119 74 193 33 27 60 28 26 54 11.20 14.61
Kwara 652 605 1,257 505 462 967 496 434 930 284 245 529 265 220 485 40.64 36.36
Lagos 1,853 1,589 3,442 1,081 944 2,025 1,225 1,028 2,253 457 403 860 376 319 695 20.29 20.08
Nasarawa 501 321 822 234 160 394 285 174 459 115 71 186 92 50 142 18.36 15.58
Niger 2,762 1,621 4,383 1,354 832 2,186 1,918 1,172 3,090 1,104 725 1,829 837 539 1,376 30.30 33.25
Ogun 3,203 2,870 6,073 2,467 2,228 4,695 2,822 2,524 5,346 2,158 2,011 4,169 1,893 1,765 3,658 59.10 61.50
Ondo 472 419 891 280 263 543 288 262 550 97 115 212 84 105 189 17.80 25.06
Osun 896 807 1,703 450 391 841 463 389 852 194 145 339 179 130 309 19.98 16.11
Oyo 4,719 4,299 9,018 3,283 3,100 6,383 3,335 3,041 6,376 2,329 2,339 4,668 1,878 1,890 3,768 39.80 43.96
Plateau 466 328 794 274 202 476 272 199 471 99 65 164 83 60 143 17.81 18.29
Rivers 649 595 1,244 349 365 714 426 405 831 196 226 422 155 189 344 23.88 31.76
Sokoto 321 162 483 213 121 334 202 115 317 110 57 167 84 44 128 26.17 27.16
Taraba 143 95 238 95 60 155 76 43 119 41 25 66 34 20 54 23.78 21.05
Yobe 170 46 216 110 26 136 121 31 152 77 17 94 62 14 76 36.47 30.43
Zamfara 284 83 367 54 20 74 99 15 114 49 10 59 20 3 23 7.04 3.61
Fct-Abuja 466 411 877 221 197 418 146 72 218 40 35 75 31 19 50 6.65 4.62
National 28,489 20,595 49,084 16,778 12,940 29,718 18,695 13,789 32,484 10,351 8,564 18,915 8,642 7,146 15,788 30.33 34.70
Total Number of candidates
Sat Credit Pass in English Credit Pass in mathematics
Credit Pass in Maths &
Eng
5 Credits including Maths
&Eng
Perc. of 5 Credits
including Maths
& Eng (% ) State

64
ST 3.6e: Distribution of NECO (SSC) Examination Result by State, Subject, Year and
Sex, (Nov/Dec.), 2016
Source: National Examination Council (NECO)
M F Total M F Total M F Total M F Total M F Total M F
Abia 345 299 644 145 134 279 236 212 448 132 122 254 127 119 246 36.81 39.80
Adamawa 438 197 635 294 134 428 367 159 526 272 122 394 255 118 373 58.22 59.90
Akwa-Ibom 590 528 1118 428 381 809 494 450 944 393 366 759 361 349 710 61.19 66.10
Anambra 253 241 494 202 193 395 206 199 405 179 174 353 169 169 338 66.80 70.12
Bauchi 415 152 567 80 23 103 241 94 335 67 18 85 59 16 75 14.22 10.53
Bayelsa 105 105 210 66 68 134 65 70 135 48 53 101 39 48 87 37.14 45.71
Benue 334 174 508 183 109 292 199 103 302 147 83 230 122 71 193 36.53 40.80
Borno 162 58 220 95 40 135 123 52 175 82 38 120 64 32 96 39.51 55.17
Cross-River 301 258 559 194 164 358 235 201 436 162 146 308 151 133 284 50.17 51.55
Delta 599 582 1181 436 442 878 491 462 953 398 378 776 355 351 706 59.27 60.31
Ebonyi 136 123 259 96 92 188 79 72 151 68 59 127 63 51 114 46.32 41.46
Edo 323 253 576 170 122 292 186 141 327 139 99 238 119 87 206 36.84 34.39
Ekiti 343 298 641 259 227 486 276 258 534 233 215 448 214 200 414 62.39 67.11
Enugu 488 526 1014 403 444 847 429 469 898 372 418 790 358 399 757 73.36 75.86
Gombe 258 119 377 121 58 179 73 38 111 48 18 66 36 13 49 13.95 10.92
Imo 184 169 353 110 102 212 135 122 257 97 85 182 90 78 168 48.91 46.15
Jigawa 1,165 186 1351 587 70 657 928 153 1081 513 55 568 408 46 454 35.02 24.73
Kaduna 928 457 1385 666 328 994 667 332 999 506 249 755 460 215 675 49.57 47.05
Kano 2,576 764 3340 1,988 602 2590 2,319 718 3037 1,867 583 2450 1,714 556 2270 66.54 72.77
Katsina 275 99 374 177 69 246 188 64 252 147 60 207 111 47 158 40.36 47.47
Kebbi 353 224 577 293 173 466 263 118 381 231 105 336 204 98 302 57.79 43.75
Kogi 239 206 445 170 131 301 173 144 317 150 110 260 131 106 237 54.81 51.46
Kwara 672 638 1310 507 503 1010 613 582 1195 486 480 966 463 451 914 68.90 70.69
Lagos 2,417 2,021 4438 1,177 933 2110 2,069 1,753 3822 1,112 887 1999 1,018 835 1853 42.12 41.32
Nasarawa 422 334 756 322 248 570 377 299 676 305 235 540 271 209 480 64.22 62.57
Niger 1,802 1,228 3030 1,323 906 2229 1,581 1,071 2652 1,235 853 2088 1,164 808 1972 64.59 65.80
Ogun 2,930 2,757 5687 2,434 2,307 4741 2,749 2,605 5354 2,357 2,237 4594 2,295 2,197 4492 78.33 79.69
Ondo 457 333 790 355 254 609 364 260 624 324 224 548 296 205 501 64.77 61.56
Osun 808 701 1509 578 501 1079 687 587 1274 532 462 994 466 419 885 57.67 59.77
Oyo 4,459 4,054 8513 3,716 3,360 7076 4,092 3,716 7808 3,549 3,212 6761 3,415 3,107 6522 76.59 76.64
Plateau 614 443 1057 477 344 821 530 390 920 450 330 780 412 304 716 67.10 68.62
Rivers 557 520 1077 355 338 693 462 451 913 326 314 640 283 285 568 50.81 54.81
Sokoto 193 85 278 90 45 135 135 54 189 84 40 124 74 35 109 38.34 41.18
Taraba 220 119 339 132 73 205 129 66 195 100 46 146 85 43 128 38.64 36.13
Yobe 433 120 553 261 74 335 334 84 418 231 61 292 214 61 275 49.42 50.83
Zamfara 188 42 230 58 23 81 43 6 49 25 4 29 20 4 24 10.64 9.52
Fct-Abuja 364 359 723 180 160 340 191 170 361 124 104 228 95 84 179 26.10 23.40
National 27,346 19,772 47,118 19,128 14,175 33,303 22,729 16,725 39,454 17,491 13,045 30,536 16,181 12,349 28,530 59.17 62.46
Total Number of candidates
Sat Credit Pass in English Credit Pass in mathematics
Credit Pass in Maths &
Eng
5 Credits including Maths
&Eng
Perc. of 5 Credits
including Maths
& Eng (% ) State

65
ST 3.7 Students Enrolment in Polytechnics by Institution and Sex, (2013/2014) and
(2014/2015)
Source: National Board for Technical Education (NBTE)
M F TOTAL M F TOTAL1 Abdu Gusau Polytechnic Talata Mafara Zamfara 1,584 427 2,011 1,334 370 1,704 2 Abia State Polytechnic Aba Abia 563 957 1,520 2,407 2,406 4,813 3 Abraham Adesanya Polytechnic, Ijebu Igbo Ogun 554 577 1,131 580 627 1,207 4 Abubakar Tatari Ali Polytechnic Bauchi Bauchi 3,183 663 3,846 3,402 797 4,199 5 Adamawa State Polytechnic Yola Adamawa 719 239 958 984 330 1,314
6 Akanu Ibiam Federal Polytechnic Unwana, Afikpo Ebonyi2,541 1,383 3,924 2,628 1,545 4,173
7Akwa Ibom State College of Arts and Science, Nung
UkimAkwa Ibom 187 180 367 81 77 158
8 Akwa Ibom State Polytechnic Ikot Osurua Akwa Ibom 2,027 1,944 3,971 2,401 2,403 4,804 9 Allover Central Polytechnic Otta Ogun 248 201 449 171 173 344
10 Auchi Polytechnic Auchi Edo 10,685 8,648 19,333 11,783 9,640 21,423
11 Bayelsa State College of Arts and Science, Elebele Bayelsa 14 8 22 72 42 114 12 Benue State Polytechnic Ugbokolo Benue 2,251 1,094 3,345 NS NS - 13 College of Technology, Iresi Osun NS NS - 14 Covenant Polytechnic, Aba Abia 252 161 413 282 169 451 15 Crown Polytechnic, Ado-Ekiti Ekiti 661 568 1,229 910 582 1,492 16 D.S. Adegbenro ICT Polytechnic, Itori-Ewekoro, Ogun 280 188 468 344 261 605 17 Delta State Polytechnic Ogwashukwu Delta 1,888 1,285 3,173 2,109 1,841 3,950 18 Delta State Polytechnic Otefe Delta 1,406 965 2,371 1,278 999 2,277 19 Delta State Polytechnic Ozoro Delta 1,931 1,560 3,491 3,662 2,918 6,580 20 Dorben Polytechnic, Abuja FCT 605 492 1,097 506 461 967
21Edo State Institute of Technology and Management,
UsenEdo 1,127 633 1,760 NS NS -
22 Federal Polytechnic Ado Ekiti Ekiti 11,155 7,282 18,437 LS LS - 23 Federal Polytechnic Bauchi Bauchi LS LS LS 6,630 3,143 9,773 24 Federal Polytechnic Bida Niger 5,364 2,717 8,081 3,809 1,963 5,772 25 Federal Polytechnic Damaturu Yobe 857 275 1,132 LS LS - 26 Federal Polytechnic Ede Osun LS LS LS 4,281 3,249 7,530 27 Federal Polytechnic Idah Kogi 4,520 2,196 6,716 3,654 1,924 5,578 28 Federal Polytechnic Ilaro Ogun 4,016 3,519 7,535 4,174 3,855 8,029 29 Federal Polytechnic K/Namoda Zamfara 2,475 1,137 3,612 LS LS - 30 Federal Polytechnic Nassarawa Nasarawa 6,440 4,806 11,246 4,787 2,356 7,143 31 Federal Polytechnic Nekede Imo 5,393 4,729 10,122 3,032 2,274 5,306 32 Federal Polytechnic Offa Kwara 8,534 6,720 15,254 5,504 5,544 11,048 33 Federal Polytechnic Oko Anambra 2,905 2,567 5,472 LS LS - 34 Federal Polytechnic, Bali Taraba 426 133 559 3,190 3,289 6,479 35 Federal Polytechnic, Ekowe Bayelsa 71 6 77 523 219 742 36 Federal Polytechnic, Mubi Adamawa LS LS LS 74 7 81 37 Fidei Polytechnic, Gboko Benue 804 516 1,320 1,004 722 1,726 38 Gateway ICT Polytechnic, Sapade Ogun 680 753 1,433 782 799 1,581 39 Grace Polytechnic Surulere-lagos Lagos 315 392 707 351 344 695 40 Hassan Usman Katsina Polytechnic Katsina Katsina 2,902 522 3,424 3,093 536 3,629 41 Heritage Polytechnic, Ikot Udota, Eket Akwa Ibom 1,093 1,103 2,196 1,379 1,506 2,885 42 Hussaini Adamu Polytechnic Kazaure Jigawa 604 123 727 329 93 422 43 Ibarapa Polytechnic, Eruwa Oyo 769 485 1,254 44 Igbajo Polytechnic, Igbajo Osun 272 291 563 235 220 455
2013/2014 2014/2015S/No Institution Location

66
ST 3.7 Students Enrolment in Polytechnics by Institution and Sex, (2013/2014) and
(2014/2015) Cont;
Source: National Board for Technical Education (NBTE)
M F TOTAL M F TOTAL45 Imo State Polytechnic, Umuagwo, Ohaji Imo 1,428 1,395 2,823 947 863 1,810 46 Institute of Management Technology Enugu Enugu 2,633 2,568 5,201 3,089 3,489 6,578 47 Interlink Polytechnic, Ijebu-Jesa Osun 209 179 388 228 156 384 48 Jigawa State Polytechnic, Dutse Jigawa 944 140 1,084 1,002 147 1,149 49 Kaduna Polytechnic, Kaduna Kaduna - 9,963 6,165 16,128 50 Kano State Polytechnic Kano Kano 5,931 1,767 7,698 6,467 1,848 8,315 51 Kings Polytechnic, Ubiaja Edo 138 54 192 NS NS - 52 Kogi State Polytechnic Lokoja Kogi 2,033 1,519 3,552 3,008 1,977 4,985 53 Kwara State Polytechnic Ilorin Kwara 1,699 1,432 3,131 1,376 1,477 2,853 54 Lagos City Polytechnic Ikeja Lagos 852 678 1,530 NS NS - 55 Lagos State Polytechnic Ikorodu Lagos 8,228 5,615 13,843 12,129 9,559 21,688 56 Lighthouse Polytchnic, Benin Edo NS NS NS NS NS - 57 Mai Idris Alooma Polytechnic, Geidam Yobe 765 246 1,011 716 168 884 58 Moshood Abiola Polytechnic Abeokuta Ogun 2,968 2,320 5,288 2,523 1,707 4,230 59 Nacabs Polytechnic, Akwanga Nasarawa 271 164 435 60 Nasarawa State Polytechnic Lafia Nasarawa 3,735 2,900 6,635 4,196 3,091 7,287 61 Niger State Polytechnic, Zungeru Niger NS NS NS 1,779 641 2,420 62 Nogak Polytechnic, Ikom, Cross River State Cross River 100 25 125 96 26 122 63 Nuhu Bamali Polytechnic Zaria Kaduna 5,741 3,564 9,305 NS NS - 64 Ogun State Institute of Technology, Igbesa Ogun 794 503 1,297 901 614 1,515 65 Oke-ogun Polytechnic, Shaki Oyo 1,460 1,296 2,756 66 Osun State College of Tech. Esa-Oke Osun 1,764 1,011 2,775 1,858 1,101 2,959 67 Osun State Polytechnic Iree Osun 2,945 2,563 5,508 3,085 2,478 5,563 68
Our Saviour Institute of Technology Emene-
EnuguEnugu 371 751 1,122 423 725 1,148
69 Petroleum Training Institute, Effuru Delta NS NS NS NS NS - 70 Plateau State Polytechnic B/Ladi Plateau 1,501 876 2,377 2,703 1,670 4,373 71 Ramat Polytechnic Maiduguri Borno 2,425 1,325 3,750 2,639 957 3,596 72
Rivers State College of Arts and Science Port
HarcourtRivers 182 245 427 2,195 1,598 3,793
73 Rivers State Polytechnic Bori Rivers 1,948 1,304 3,252 137 184 321 74 Ronik Polytechnic Lagos Lagos 171 201 372 175 192 367 75 Rufus Giwa Polytechnic Owo Ondo 3,825 2,723 6,548 3,102 2,160 5,262 76 Shaka Polytechnic, Benin City Edo NS NS NS 101 83 184 77 Sokoto State Polytechnic Sokoto Sokoto 1,834 713 2,547 NS NS - 78 Taraba State Polytechnic Jalingo Taraba 1,660 1,264 2,924 1,932 1,276 3,208 79 Templegate Polytechnic, Aba Abia 325 211 536 613 372 985 80 The Ibadan Polytechnic Ibadan Oyo 9,463 4,575 14,038 4,980 4,053 9,033 81 The Polytechnic, Ile-Ife Osun 303 199 502 320 190 510 82 The Polytechnic, Imesi-ile Osun NS NS NS 75 58 133 83 Tower Polytechnic, Ibadan Oyo 84 32 116 65 44 109 84 Uyo City Polytechnic, Uyo Akwa Ibom 184 152 336 85 Waziri Umaru Federal Polytechnic, B/Kebbi Kebbi LS LS LS 3,186 1,292 4,478 86 Wolex Polytechnic Iwo Osun 129 107 236 179 147 326 87 Yaba College of Technology Yaba Lagos 14,145 11,144 25,289 11,174 8,537 19,711 88
Zamfara State College of Arts and Science,
GusauZamfara 55 5 60 52 8 60
172,860 116,114 288,974 171,863 118,834 290,697 Total
S/No Institution Location2013/2014 2014/2015

67
ST 3.8: Distribution of NYSC Participation by State, Year and Sex (2014- 2016)
Source: NYSC ICT Department
MALE FEMALE MALE FEMALE MALE FEMALE
Abia 5244 3716 4067 2873 5564 7395
Adamawa 3953 2270 2888 2210 2349 1422
Akwa Ibom 3245 2907 4987 3905 4674 5678
Anambra 3295 3026 3628 3223 8731 12883
Bauchi 3514 1908 2493 2071 2368 739
Bayelsa 3132 2882 4992 4128 6308 4542
Benue 3109 2001 2135 2006 1982 1115
Borno 2392 2389 2453 2277 1686 1485
Cross River 3143 2967 3458 2875 2819 2652
Delta 3483 3569 4960 4415 9534 9959
Ebonyi 2902 2493 3546 2654 3449 2744
Edo 3077 3250 3508 3006 6912 6573
Ekiti 3158 3023 3946 3032 4759 4369
Enugu 2827 2780 3304 3785 5831 6792
FCT 4996 5516 4711 5530 239 150
Gombe 3293 2018 2543 2023 2351 1209
Imo 3346 2741 4184 2721 11014 15666
Jigawa 2807 1223 2476 1886 1300 291
Kaduna 3810 2377 3161 2169 1409 472
Kano 2896 2121 3578 3500 4156 2846
Katsina 2647 2485 3485 2462 7941 5881
Kebbi 3212 2358 3968 3080 4967 1727
Kogi 3170 2409 2545 1709 2549 859
Kwara 3395 3006 3537 2598 5513 4691
Lagos 3711 5261 3564 4841 2830 3087
Nasarawa 3638 3101 5131 3849 2625 1364
Niger 2385 2243 3214 2858 2706 1347
Ogun 3080 2784 4032 2938 6534 5740
Ondo 4254 4118 4937 4684 7810 8396
Osun 3790 3902 4067 3249 8275 7313
Oyo 3716 3769 3466 3360 7659 6690
Plateau 4086 3729 4595 3651 2392 1861
Rivers 5137 5038 3422 4360 4262 4346
Sokoto 3661 2581 3744 2161 1226 324
Taraba 3773 2375 2795 2201 1752 898
Yobe 3881 2652 2508 1906 1519 445
Zamfara 2938 1919 2661 1948 1350 226
Total 128096 108907 132689 112144 159345 144177
STATE
2014 2015 2016

68
WORK
ST 4.1: Employment in State Civil Service by State, Category, Year and Sex
Source: State Civil Service Commission
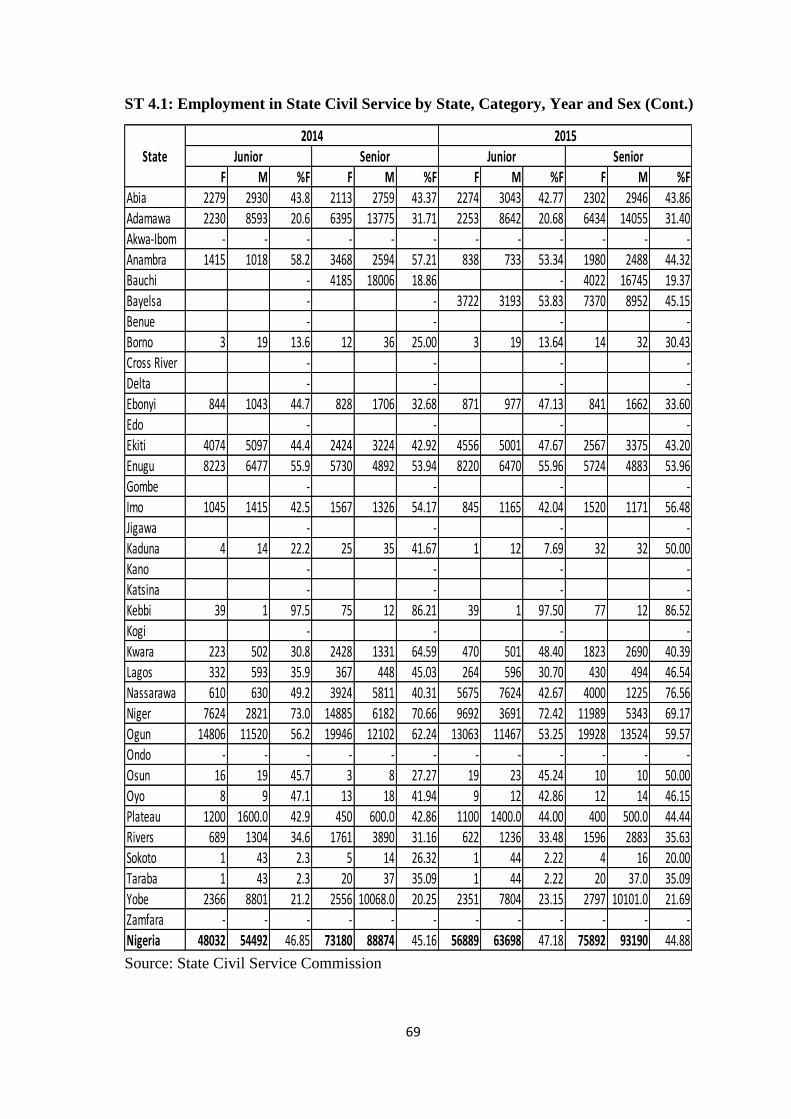
69
ST 4.1: Employment in State Civil Service by State, Category, Year and Sex (Cont.)
Source: State Civil Service Commission
F M %F F M %F F M %F F M %FAbia 2279 2930 43.8 2113 2759 43.37 2274 3043 42.77 2302 2946 43.86Adamawa 2230 8593 20.6 6395 13775 31.71 2253 8642 20.68 6434 14055 31.40Akwa-Ibom - - - - - - - - - - - -Anambra 1415 1018 58.2 3468 2594 57.21 838 733 53.34 1980 2488 44.32Bauchi - 4185 18006 18.86 - 4022 16745 19.37Bayelsa - - 3722 3193 53.83 7370 8952 45.15Benue - - - -Borno 3 19 13.6 12 36 25.00 3 19 13.64 14 32 30.43Cross River - - - -Delta - - - -Ebonyi 844 1043 44.7 828 1706 32.68 871 977 47.13 841 1662 33.60Edo - - - -Ekiti 4074 5097 44.4 2424 3224 42.92 4556 5001 47.67 2567 3375 43.20Enugu 8223 6477 55.9 5730 4892 53.94 8220 6470 55.96 5724 4883 53.96Gombe - - - -Imo 1045 1415 42.5 1567 1326 54.17 845 1165 42.04 1520 1171 56.48Jigawa - - - -Kaduna 4 14 22.2 25 35 41.67 1 12 7.69 32 32 50.00Kano - - - -Katsina - - - -Kebbi 39 1 97.5 75 12 86.21 39 1 97.50 77 12 86.52Kogi - - - -Kwara 223 502 30.8 2428 1331 64.59 470 501 48.40 1823 2690 40.39Lagos 332 593 35.9 367 448 45.03 264 596 30.70 430 494 46.54Nassarawa 610 630 49.2 3924 5811 40.31 5675 7624 42.67 4000 1225 76.56Niger 7624 2821 73.0 14885 6182 70.66 9692 3691 72.42 11989 5343 69.17Ogun 14806 11520 56.2 19946 12102 62.24 13063 11467 53.25 19928 13524 59.57Ondo - - - - - - - - - - - -Osun 16 19 45.7 3 8 27.27 19 23 45.24 10 10 50.00Oyo 8 9 47.1 13 18 41.94 9 12 42.86 12 14 46.15Plateau 1200 1600.0 42.9 450 600.0 42.86 1100 1400.0 44.00 400 500.0 44.44Rivers 689 1304 34.6 1761 3890 31.16 622 1236 33.48 1596 2883 35.63Sokoto 1 43 2.3 5 14 26.32 1 44 2.22 4 16 20.00Taraba 1 43 2.3 20 37 35.09 1 44 2.22 20 37.0 35.09Yobe 2366 8801 21.2 2556 10068.0 20.25 2351 7804 23.15 2797 10101.0 21.69Zamfara - - - - - - - - - - - -Nigeria 48032 54492 46.85 73180 88874 45.16 56889 63698 47.18 75892 93190 44.88
SeniorState2014 2015
Junior Senior Junior
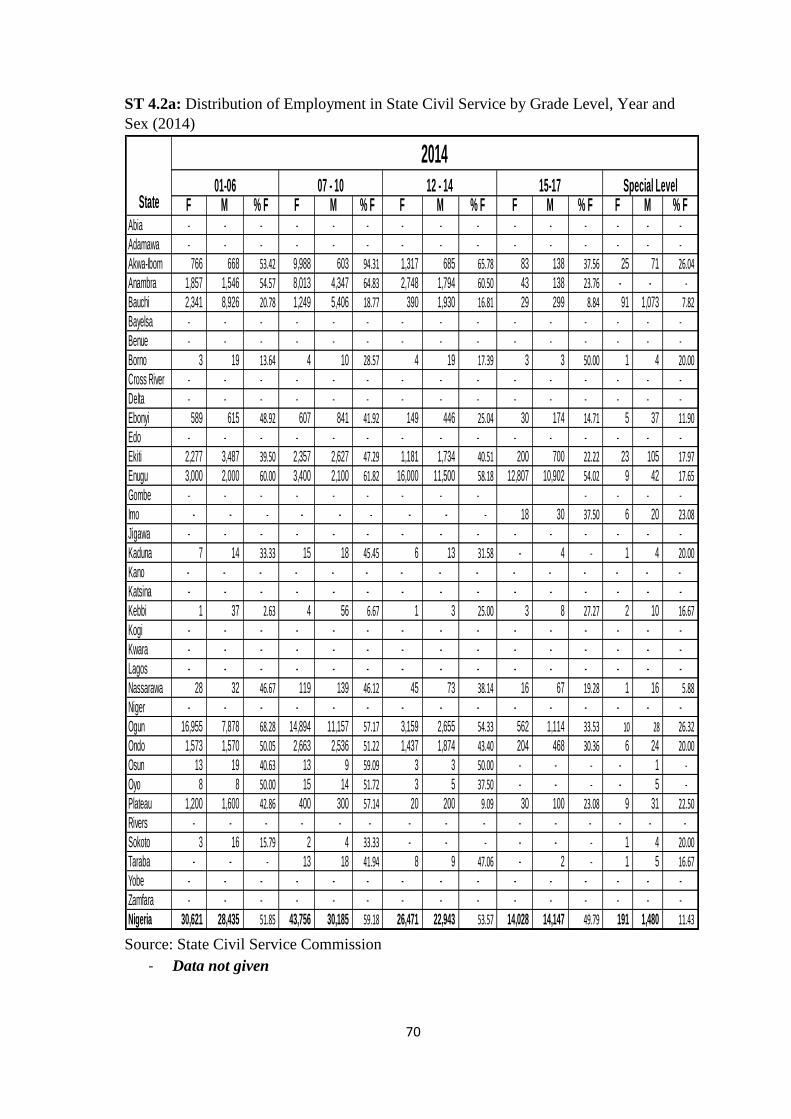
70
ST 4.2a: Distribution of Employment in State Civil Service by Grade Level, Year and
Sex (2014)
Source: State Civil Service Commission
- Data not given
F M % F F M % F F M % F F M % F F M % FAbia - - - - - - - - - - - - - - -Adamawa - - - - - - - - - - - - - - -Akwa-Ibom 766 668 53.42 9,988 603 94.31 1,317 685 65.78 83 138 37.56 25 71 26.04 Anambra 1,857 1,546 54.57 8,013 4,347 64.83 2,748 1,794 60.50 43 138 23.76 - - - Bauchi 2,341 8,926 20.78 1,249 5,406 18.77 390 1,930 16.81 29 299 8.84 91 1,073 7.82 Bayelsa - - - - - - - - - - - - - - -Benue - - - - - - - - - - - - - - -Borno 3 19 13.64 4 10 28.57 4 19 17.39 3 3 50.00 1 4 20.00 Cross River - - - - - - - - - - - - - - -Delta - - - - - - - - - - - - - - -Ebonyi 589 615 48.92 607 841 41.92 149 446 25.04 30 174 14.71 5 37 11.90 Edo - - - - - - - - - - - - - - -Ekiti 2,277 3,487 39.50 2,357 2,627 47.29 1,181 1,734 40.51 200 700 22.22 23 105 17.97 Enugu 3,000 2,000 60.00 3,400 2,100 61.82 16,000 11,500 58.18 12,807 10,902 54.02 9 42 17.65 Gombe - - - - - - - - - - - - -Imo - - - - - - - - - 18 30 37.50 6 20 23.08 Jigawa - - - - - - - - - - - - - - -
Kaduna 7 14 33.33 15 18 45.45 6 13 31.58 - 4 - 1 4 20.00 Kano - - - - - - - - - - - - - - -
Katsina - - - - - - - - - - - - - - -
Kebbi 1 37 2.63 4 56 6.67 1 3 25.00 3 8 27.27 2 10 16.67 Kogi - - - - - - - - - - - - - - -
Kwara - - - - - - - - - - - - - - -
Lagos - - - - - - - - - - - - - - -
Nassarawa 28 32 46.67 119 139 46.12 45 73 38.14 16 67 19.28 1 16 5.88 Niger - - - - - - - - - - - - - - -
Ogun 16,955 7,878 68.28 14,894 11,157 57.17 3,159 2,655 54.33 562 1,114 33.53 10 28 26.32 Ondo 1,573 1,570 50.05 2,663 2,536 51.22 1,437 1,874 43.40 204 468 30.36 6 24 20.00 Osun 13 19 40.63 13 9 59.09 3 3 50.00 - - - - 1 - Oyo 8 8 50.00 15 14 51.72 3 5 37.50 - - - - 5 - Plateau 1,200 1,600 42.86 400 300 57.14 20 200 9.09 30 100 23.08 9 31 22.50 Rivers - - - - - - - - - - - - - - -
Sokoto 3 16 15.79 2 4 33.33 - - - - - - 1 4 20.00 Taraba - - - 13 18 41.94 8 9 47.06 - 2 - 1 5 16.67 Yobe - - - - - - - - - - - - - - -
Zamfara - - - - - - - - - - - - - - -
Nigeria 30,621 28,435 51.85 43,756 30,185 59.18 26,471 22,943 53.57 14,028 14,147 49.79 191 1,480 11.43
State
201401-06 07 - 10 12 - 14 15-17 Special Level

71
ST 4.2b: Distribution of Employment in State Civil Service by Grade Level, Year
and Sex (2015)
Source: State Civil Service Commission
- Data not given
F M % F F M % F F M % F F M % F F M % F
Abia 2,276 2,885 44.10 899 5,439 14.18 920 1,016 47.52 636 834 43.27 5 18 21.74
Adamawa
Akwa-Ibom 936 680 57.92 1,524 664 69.65 1,675 560 74.94 65 130 33.33 30 67 30.93
Anambra 1,208 1,125 51.78 5,945 3,840 60.76 1,740 1,113 60.99 29 106 21.48 - - 0.00
Bauchi 2,183 8,455 20.52 1,368 5,666 19.45 384 1,923 16.64 33 290 10.22 3 179 1.65
Bayelsa - - - - - - - - - - - - - - -
Benue - - - - - - - - - - - - - - -
Borno 3 19 13.64 4 9 30.77 5 15 25.00 4 4 50.00 1 4 20.00
Cross River - - - - - - - - - - - - - - -
Delta - - - - - - - - - - - - - - -
Ebonyi 626 589 51.52 500 807 38.26 214 439 32.77 48 171 21.92 8 46 14.81
Edo - - - - - - - - - - - - - - -
Ekiti 2,277 3,487 39.50 2,357 2,627 47.29 1,181 1,734 40.51 200 700 22.22 23 105 17.97
Enugu 2,700 1,900 58.70 2,900 21,200 12.03 11,092 25,794 30.07 12,897 11,092 53.76 7 44 13.73
Gombe - - - - - - - - - - - - - - -
Imo 19 41 31.67 4 21 16.00
Jigawa - - - - - - - - - - - - - - -
Kaduna 1 12 7.69 20 21 48.78 8 12 40.00 - 3 0.00 1 4 20.00
Kano - - - - - - - - - - - - - - -
Katsina - - - - - - - - - - - - - - -
Kebbi 1 37 2.63 4 56 6.67 1 3 25.00 - - 0.00 2 12 14.29
Kogi - - - - - - - - - - - - - - -
Kwara - - - - - - - - - - - - - - -
Lagos - - - - - - - - - - - - - - -
Nassarawa 37 35 51.39 124 147 45.76 51 81 38.64 16 67 19.28 1 16 5.88
Niger - - - - - - - - - - - - - - -
Ogun 15,416 9,125 62.82 15,186 10,646 58.79 3,011 3,006 50.04 496 1,096 31.16 13 27 32.50
Ondo 1,465 1,532 48.88 3,497 2,923 54.47 1,544 1,841 45.61 415 665 38.43 7 26 21.21
Osun 16 22 42.11 13 8 61.90 1 2 33.33 - - 0.00 - 1 0.00
Oyo 8 9 47.06 11 13 45.83 2 5 28.57 - - 0.00 - 5 0.00
Plateau 1,100 1,400 44.00 220 300 42.31 300 260 53.57 100 220 31.25 8 32 20.00
Rivers - - - - - - - - - - - - - - -
Sokoto 1 16 5.88 1 5 16.67 - - 0.00 - - 0.00 1 5 16.67
Taraba - - 0.00 - 18 0.00 9 14 39.13 2 8 20.00 - - #DIV/0!
Yobe - - - - - - - - - - - - - - -
Zamfara - - - - - - - - - - - - - - -
Nigeria 30,254 31,328 49.13 34,573 54,389 38.86 22,138 37,818 36.92 14,960 15,427 49.23 114 612 15.70
State
201501-06 07 - 10 12 - 14 15-17 Special Level

72
ST 4.2c: Distribution of Employment in State Civil Service by Grade Level, Year
and Sex (2016)
Source: State Civil Service Commission
- Data not given
F M % F F M % F F M % F F M % F F M % F
Abia 2,268 2,891 43.96 903 1,083 45.47 878 975 47.38 599 814 42.39 6 17 26.09
Adamawa - - - - - - - - - - - - - - -
Akwa-Ibom 997 736 57.53 1,465 673 68.52 2,136 665 76.26 89 168 34.63 29 72 28.71
Anambra 1,564 1,104 58.62 6,219 3,726 62.53 1,629 1,050 60.81 32 94 25.40 - - -
Bauchi - - - - - - - - - - - - - - -
Bayelsa - - - - - - - - - - - - - - -
Benue - - - - - - - - - - - - - - -
Borno 3 25 10.71 4 15 21.05 10 22 31.25 4 4 50.00 1 4 20.00
Cross River - - - - - - - - - - - - - - -
Delta - - - - - - - - - - - - - - -
Ebonyi 628 575 52.20 528 814 39.34 210 430 32.81 35 165 17.50 8 42 16.00
Edo - - - - - - - - - - - - - - -
Ekiti 2,567 3,375 43.20 2,881 2,516 53.38 1,385 1,710 44.75 263 672 28.13 27 102 20.93
Enugu - - - - - - 12,000 10,200 54.05 12,052 11,010 52.26 4 47 7.84
Gombe - - - - - - - - - - - - - - -
Imo - - - - - - - - - 19 26 42.22 9 17 34.62
Jigawa - - - - - - - - - - - - - - -
Kaduna 1 10 9.09 18 16 52.94 18 11 62.07 - 4 - 1 4 20.00
Kano - - - - - - - - - - - - - - -
Katsina - - - - - - - - - - - - - - -
Kebbi 1 37 2.63 4 56 6.67 1 3 25.00 - - - 3 17 15.00
Kogi - - - - - - - - - - - - - - -
Kwara 356 372 48.90 1,566 2,212 41.45 695 860 44.69 107 243 30.57 1 14 6.67
Lagos - - - - - - - - - - - - - - -
Nassarawa 36 34 51.43 114 116 49.57 74 95 43.79 17 71 19.32 1 16 5.88
Niger - - - - - - - - - - - - - - -
Ogun 15,151 8,382 64.38 14,961 10,554 58.64 2,979 3,010 49.74 711 1,202 37.17 13 27 32.50
Ondo 1,476 1,628 47.55 3,521 3,129 52.95 1,923 1,892 50.41 495 743 39.98 7 27 20.59
Osun 15 21 41.67 18 1 94.74 2 5 28.57 - - - - 1 -
Oyo 9 12 42.86 12 10 54.55 - 4 - - - - - 5 -
Plateau 1,050 1,200 46.67 260 360 41.94 400 320 55.56 130 230 36.11 6 34 15.00
Rivers - - - - - - - - - - - - - - -
Sokoto 1 23 4.17 2 4 33.33 - - - - - - - 4 -
Taraba - - - 13 18 41.94 4 9 30.77 - 2 - 1 5 16.67
Yobe - - - - - - - - - - - - - - -
Zamfara - - - - - - - - - - - - - - -
Nigeria 26,123 20,425 56.12 32,489 25,303 56.22 24,344 21,261 53.38 14,553 15,448 48.51 117 455 20.45
State
2016
01-06 07 - 10 12 - 14 15-17 Special Level

73
ST 4.3a: Distribution of Employment in Federal MDAs by Grade Level and Sex
(2014)
Source: MDAs
M F M F M F M F M F
National Universities Commission 81 21 259 233 71 54 10 1 2
National Judicial Council
Nigerian Deposist Insruance Corporation, Abuja
National Directorate of Employment (NDE) 124 52 806 569 435 144 125 34 1 0
Nigerian Communication Commission
Ministry of Culture & Tourism
Revenue Mobilization and Fiscal Commission
Federal Ministry of Women Affairs 60 40 172 187 80 35 29 33 1
Federal Ministry of Special Duties and Inter-Govermenta Affairs 66 9 60 44 51 24 16 2 0 0
National Agency for Control of AIDS (SACA) 36 11 96 60 20 22 37 11 1 0
Federal Ministry of Comminication Technology
Federal Ministry of Finance
Ministry of Niger Delta Affairs
Ministry of Justice 64 46 471 379 155 148 123 79 2 0
Ministry of Foreign Affairs
Ministry of Police Affairs
Federal Ministry of Power, Works and Housing (Housing Sector) 300 106 1707 821 760 150 216 60 1 1
National Emergency Management Agency 300 106 1707 821 760 150 216 60 1 1
Institute for Peace and Conflict Resolution 135 52 254 122 120 60 55 13 2 0
Federal Ministry of Education Abuja
National Board for Technical Education 11 110 51 69 34 15 4 1
Head of Service
Fedral Ministry of Transport (AVIATION SECTOR) 8 8 173 156 88 40 49 12 2
Federal Ministry of Health
Federal Ministry of Lands,Housing and Urban Development
Ministry of Works
Fedral Ministry of Idustries, Trades and Investment 103 80 382 212 338 164 68 13 2 1
National Assembly Abuja 215 61 1273 849 388 268 157 49 5
Federal Ministry of Science and Technology
Federal Ministry of Agriculture 637 251 1595 1091 863 301 334 61 1 2
Federal Character Commission
Federal Ministry of Water Resources
Fedral Ministry of Labour 122 114 477 316 172 100 152 44 2
Federal Capital Territory Administration
National Youth Service Corps 682 352 1923 1661 665 437 254 176 1 0
Federal Ministry of Environment
Secretary to the Govt. of the Federation
Fedral Ministry of Information & Communications
Nigerian Electricity Regularitory Commission 379 458 1761 1293 1563 920 295 39 1
Nigerian Prisons Service
National Planning Commission
Federal Ministry of Aviation
Federal Inland Revenue Service (FIRS) 8 8 173 156 88 40 49 12 2
Federal Ministry of Youth Development 63 30 151 134 65 39 28 7 1
National Examinations Council 161 149 1311 1052 327 208 114 34 1 0
National Commission for Colleges of Education 32 105 230 99 121 53 44 1 1
Public Complaint Commission 82 59 796 520 203 142 60 26 0 1
NIPOST 2361 1957 2758 2292 606 530 6 0 1 0
NNPC
Ministry of Interior 11 110 51 69 34 15 4 1
Central Bank of Nigeria 11 110 51 69 34 15 4 1
NEXIM BANK 161 149 1311 1052 327 208 114 34 1
West African Examination Council
NAPTIP
Code of Conduct Bureau 59 43 330 307 66 54 30 8 1
News Agency of Nigeria 24 6 395 200 137 46 37 6 4 0
ICPC 91 22 359 164 109 23 24 10 4 1
NDLEA 2054 428 1079 291 938 220 53 15 1 1
FRSC 6094 1204 7109 2372 1505 335 94 6 4 0
National Orientation Agency (NOA) 355 141 1671 1264 633 453 154 37 1 0
Nigerian Television Authority (NTA) 332 58 2101 1172 562 393 129 76 6 2
TOTAL 15141 6105 32961 19809 12352 5809 3107 970 52 12
MDAs
01-06 7-10 12-14 15-17 Special Grade
2014

74
ST 4.3b: Distribution of Employment in Federal MDAs by Grade Level and Sex
(2015)
Source: MDAs
M F M F M F M F M F
National Universities Commission 75 20 250 233 76 60 8 5 3
National Judicial Council
Nigerian Deposist Insruance Corporation, Abuja
National Directorate of Employment (NDE) 89 31 826 562 368 130 167 54 1 0
Nigerian Communication Commission
Ministry of Culture & Tourism
Revenue Mobilization and Fiscal Commission
Federal Ministry of Women Affairs 19 15 206 217 76 35 39 31 1
Federal Ministry of Special Duties and Inter-Govermenta Affairs 66 9 60 44 52 22 14 2 0 0
National Agency for Control of AIDS (SACA) 36 10 94 58 20 22 36 10 1 0
Federal Ministry of Comminication Technology
Federal Ministry of Finance
Ministry of Niger Delta Affairs
Ministry of Justice 62 54 409 314 184 229 140 80 2 0
Ministry of Foreign Affairs
Ministry of Police Affairs
Federal Ministry of Power, Works and Housing (Housing Sector) 206 71 1949 978 814 149 202 60 3
National Emergency Management Agency 206 71 1949 978 814 149 202 60 3
Institute for Peace and Conflict Resolution 108 37 275 154 151 94 58 13 2
Federal Ministry of Education Abuja
National Board for Technical Education 4 93 41 70 47 28 5 1
Head of Service
Fedral Ministry of Transport (AVIATION SECTOR) 7 8 180 156 79 45 51 10 1 1
Federal Ministry of Health
Federal Ministry of Lands,Housing and Urban Development
Ministry of Works
Fedral Ministry of Idustries, Trades and Investment 97 62 399 241 350 173 71 16 2 1
National Assembly Abuja 173 55 977 687 574 419 230 75 3
Federal Ministry of Science and Technology
Federal Ministry of Agriculture 515 182 1745 1138 827 316 368 74 2 1
Federal Character Commission
Federal Ministry of Water Resources
Fedral Ministry of Labour 134 126 496 345 181 112 162 70 2
Federal Capital Territory Administration
National Youth Service Corps 633 313 1904 1628 649 438 266 180 1 0
Federal Ministry of Environment
Secretary to the Govt. of the Federation
Fedral Ministry of Information & Communications
Nigerian Electricity Regularitory Commission 179 220 1765 1472 1780 826 290 38 1
Nigerian Prisons Service
National Planning Commission
Federal Ministry of Aviation
Federal Inland Revenue Service (FIRS) 7 8 180 156 79 45 51 10 1 1
Federal Ministry of Youth Development 59 28 175 156 78 43 33 13 1
National Examinations Council 188 93 1297 1067 330 211 103 33 0 0
National Commission for Colleges of Education 144 8 283 197 58 33 43 1 1 0
Public Complaint Commission 84 53 934 652 214 168 69 34 0 1
NIPOST 2361 1957 2688 2188 706 630 6 0 1 0
NNPC
Ministry of Interior 1 37 35 19 10 7 2 2 1
Central Bank of Nigeria 4 93 41 70 47 28 5 1
NEXIM BANK 188 93 1297 1067 330 211 103 33
West African Examination Council
NAPTIP
Code of Conduct Bureau 44 40 392 295 71 52 37 6 1
News Agency of Nigeria 17 4 399 202 134 45 58 9 2 0
ICPC 67 15 341 140 131 40 47 19 4 1
NDLEA 1991 405 1095 300 917 219 55 15 1 1
FRSC 4883 1486 2376 2480 1338 313 272 34 6 1
National Orientation Agency (NOA) 274 108 1621 1222 553 479 314 105 1 0
Nigerian Television Authority (NTA) 294 49 1989 1096 531 401 131 83 6 2
TOTAL 13215 5631 28774 20540 12624 6213 3689 1185 56 12
MDAs
01-06 07-10 12-14 15-17 Special Grade
2015

75
ST 4.4c: Distribution of Employment in Federal MDAs by Grade Level and Sex
(2016)
Source: MDAs
Special Grade
M F M F M F M F M F
National Universities Commission 66 22 238 223 84 66 8 5 3
National Judicial Council
Nigerian Deposist Insruance Corporation, Abuja
National Directorate of Employment (NDE) 62 16 821 540 362 165 196 58 1 0
Nigerian Communication Commission
Ministry of Culture & Tourism
Revenue Mobilization and Fiscal Commission
Federal Ministry of Women Affairs 43 29 235 249 85 43 35 23 1
Federal Ministry of Special Duties and Inter-Govermenta Affairs 47 3 72 56 55 23 14 2 0 0
National Agency for Control of AIDS (SACA) 24 4 82 77 22 18 38 16 1 0
Federal Ministry of Comminication Technology
Federal Ministry of Finance
Ministry of Niger Delta Affairs
Ministry of Justice 50 41 309 352 140 163 143 90 2 0
Ministry of Foreign Affairs
Ministry of Police Affairs
Federal Ministry of Power, Works and Housing (Housing Sector) 193 73 1822 934 800 176 197 58 3
National Emergency Management Agency 193 73 1822 934 800 176 197 58 3
Institute for Peace and Conflict Resolution
Federal Ministry of Education Abuja
National Board for Technical Education 8 87 40 66 38 32 3 1
Head of Service
Fedral Ministry of Transport (AVIATION SECTOR) 3 10 180 143 75 44 46 12 1
Federal Ministry of Health
Federal Ministry of Lands,Housing and Urban Development
Ministry of Works
Fedral Ministry of Idustries, Trades and Investment 102 65 415 255 368 176 74 12 2 1
National Assembly Abuja 158 45 774 591 660 545 232 83 5 1
Federal Ministry of Science and Technology
Federal Ministry of Agriculture 429 141 1686 1087 876 379 360 71 3 0
Federal Character Commission
Federal Ministry of Water Resources
Fedral Ministry of Labour 134 126 496 345 181 112 162 70 2
Federal Capital Territory Administration
National Youth Service Corps 613 334 1784 1497 624 445 302 206 1 0
Federal Ministry of Environment
Secretary to the Govt. of the Federation
Fedral Ministry of Information & Communications
Nigerian Electricity Regularitory Commission 112 154 1754 1408 1588 1125 274 43 1 0
Nigerian Prisons Service
National Planning Commission
Federal Ministry of Aviation
Federal Inland Revenue Service (FIRS) 3 10 180 143 75 44 46 12 1
Federal Ministry of Youth Development 304 132 418 373 197 111 80 36 1
National Examinations Council 115 99 1260 1006 357 258 184 66 1 0
National Commission for Colleges of Education 138 10 352 196 74 27 0 0 1 0
Public Complaint Commission 84 53 934 652 214 168 69 34 0 1
NIPOST 2361 1957 2950 2354 682 3 6 0 1 0
NNPC
Ministry of Interior 1 33 36 18 8 7 2 1
Central Bank of Nigeria 8 87 40 66 38 32 3 1
NEXIM BANK 115 99 1260 1006 357 258 184 66 1
West African Examination Council
NAPTIP
Code of Conduct Bureau 24 30 398 266 75 55 35 12 1
News Agency of Nigeria 13 1 382 200 121 59 66 13 2 0
ICPC 75 15 326 140 131 40 47 15 3 1
NDLEA 1971 402 1084 301 909 216 55 15 1 1
FRSC 6400 1322 8355 2511 1362 358 252 33 5 1
National Orientation Agency (NOA) 217 86 1593 1196 587 510 296 106 1 0
Nigerian Television Authority (NTA) 258 38 1865 1036 511 399 121 82 6 2
TOTAL 14324 5390 34054 20187 12522 6246 3790 1305 56 9
MDAs
01-06 07-10 12-14 15-17
2016

76
POWER AND DECISION MAKING
ST 5.1: Distribution of Women and Men Occupying Position of Governor and
Deputy Governor by State (1999 – 2015)
Source: NCWD/NBS
F M F M F M F M F M F M F M F M F M F M
Abia 0 1 0 1 0 1 0 1 0 1 0 1 0 1 0 1 0 1 0 1
Adamawa 0 1 0 1 0 1 0 1 0 1 0 1 0 3 0 3 0 1 0 1
Akwa-Ibom 0 1 0 1 0 1 0 1 0 1 0 1 0 1 1 1 0 1 0 1
Anambra 0 1 0 1 0 1 0 2 0 1 0 1 0 1 0 1 0 1 0 1
Bauchi 0 1 0 1 0 1 0 1 0 1 0 1 0 1 0 1 0 1 0 1
Bayelsa 0 1 0 1 0 1 0 1 0 1 0 1 0 1 0 1 0 1 0 1
Benue 0 1 0 1 0 1 0 1 0 1 0 1 0 1 0 1 0 1 0 1
Borno 0 1 0 1 0 1 0 1 0 1 0 1 0 1 0 1 0 1 0 1
Cross River 0 1 0 1 0 1 0 1 0 1 0 1 0 1 0 1 0 1 0 1
Delta 0 1 0 1 0 1 0 1 0 1 0 1 0 1 1 1 0 1 0 1
Ebonyi 0 1 0 1 0 1 0 1 0 1 0 1 0 1 0 1 0 1 0 1
Edo 0 1 0 1 0 1 0 1 0 1 0 1 0 1 1 1 0 1 0 1
Ekiti 0 1 0 1 0 2 1 1 0 2 0 1 0 1 2 0 0 1 0 1
Enugu 0 1 0 1 0 1 0 1 0 1 0 1 0 1 0 2 0 1 1 0
Gombe 0 1 0 1 0 1 0 1 0 1 0 1 0 1 0 1 0 1 0 1
Imo 0 1 0 1 0 1 0 1 0 1 1 0 0 1 0 1 0 1 0 1
Jigawa 0 1 0 1 0 1 0 1 0 1 0 1 0 1 0 1 0 1 0 1
Kaduna 0 1 0 1 0 1 0 1 0 1 0 1 0 2 0 3 0 1 0 1
Kano 0 1 0 1 0 1 0 1 0 1 0 1 0 1 0 1 0 1 0 1
Katsina 0 1 0 1 0 1 0 1 0 1 0 1 0 1 0 1 0 1 0 1
Kebbi 0 1 0 1 0 1 0 1 0 1 0 1 0 2 0 2 0 1 0 1
Kogi 0 1 0 1 0 1 0 1 0 1 0 1 0 1 0 1 0 1 0 1
Kwara 0 1 0 1 0 1 0 1 0 1 0 1 0 1 0 1 0 1 0 1
Lagos 0 1 0 1 0 1 0 1 0 1 1 0 0 1 1 0 0 1 1 0
Nasarawa 0 1 0 1 0 1 0 1 0 1 0 1 0 1 0 1 0 1 0 1
Niger 0 1 0 1 0 1 0 1 0 1 0 1 0 1 0 1 0 1 0 1
Ogun 0 1 0 1 0 1 1 0 0 1 1 0 0 1 0 1 0 1 1 0
Ondo 0 1 0 1 0 1 0 1 0 1 0 1 0 1 0 1 0 1 0 2
Osun 0 1 0 1 0 1 1 0 0 1 1 0 0 1 1 0 0 1 1 0
Oyo 0 1 0 1 0 1 0 1 0 2 0 2 0 1 0 1 0 1 1 1
Plateau 0 1 0 1 0 1 0 1 0 1 0 1 0 1 1 0 0 1 0 1
Rivers 0 1 0 1 0 1 0 1 0 2 0 2 0 1 0 1 0 1 1 1
Sokoto 0 1 0 1 0 1 0 2 0 2 0 2 0 2 0 2 0 1 0 1
Taraba 0 1 0 1 0 1 0 1 0 1 0 1 0 1 0 1 0 1 0 1
Yobe 0 1 0 1 0 1 0 1 0 1 0 1 0 1 0 1 0 1 0 1
Zamfara 0 1 0 1 0 1 0 1 0 1 0 1 0 1 0 1 0 1 0 1
FCT
Total 0 36 0 36 0 37 3 36 0 40 4 35 0 41 8 39 0 36 6 33
2015
Governor Deputy Governor Governor Deputy Governor Governor Deputy Governor Governor
2003
Deputy GovernorSTATES
2007 2011
Governor Deputy Governor
1999
45

77
ST 5.2: Distribution of Women and Men Occupying Position at the Local
Government Level by State (1999 – 2015)
Source: NCWD/NBS
Abia 6 11 N/A N/A
Adamawa 2 122 N/A N/A
Akwa-Ibom N/A N/A 56 127
Anambra N/A N/A N/A N/A
Bauchi 0 37 3 275
Bayelsa N/A N/A N/A N/A
Benue 5 89 30 745
Borno 0 28 N/A N/A
Cross River 5 52 20 143
Delta 5 45 61 785
Ebonyi 25 80 153 920
Edo N/A N/A N/A N/A
Ekiti 5 139 63 1159
Enugu 44 58 54 136
Gombe N/A N/A N/A N/A
Imo 78 30 N/A N/A
Jigawa 0 76 7 1009
Kaduna 12 141 N/A N/A
Kano 0 75 4 555
Katsina 0 133 2 1401
Kebbi 2 64 25 366
Kogi 0 64 N/A N/A
Kwara 3 46 33 494
Lagos 1 20 N/A N/A
Nasarawa 0 13 6 82
Niger 11 295 16 61
Ogun N/A N/A N/A N/A
Ondo N/A N/A N/A N/A
Osun 0 13 N/A N/A
Oyo 3 120 N/A N/A
Plateau 7 71 12 56
Rivers 8 270 46 480
Sokoto 1 51 0 342
Taraba N/A N/A N/A N/A
Yobe 1 31 N/A N/A
Zamfara 0 63 0 215
FCT 1 26 12 254
Total 225 2263 603 9605
State
Local Government
Chairperson
F M
Councillor
F M

78
ST 5.3: Distribution of State Legislator by Year and Sex (1999 – 2015)
Source: State House of Assembly
F M F M F M F M F M
Abia 2 22 3 21 2 22 2 22 1 20 117
Adamawa 0 0 1 30 0 0 1 30 0 0 62
Akwa-Ibom 0 25 2 23 3 22 2 22 1 25 125
Anambra 2 22 2 23 4 25 5 12 2 20 117
Bauchi 0 0 1 30 0 0 1 30 0 0 62
Bayelsa 1 23 0 24 1 23 1 22 1 20 116
Benue 1 20 1 21 1 22 3 27 2 20 118
Borno 0 24 1 23 2 16 0 16 0 0 82
Cross River 0 22 0 19 2 20 0 0 0 0 63
Delta 1 28 4 20 5 21 3 25 3 25 135
Ebonyi 0 18 2 16 1 17 5 4 5 17 85
Edo 3 22 0 0 1 22 1 10 1 23 83
Ekiti 0 24 0 0 0 2 3 24 1 24 78
Enugu 1 16 1 16 2 15 5 12 3 14 85
Gombe 0 24 1 23 2 16 0 16 0 0 82
Imo 0 27 2 21 3 23 0 13 2 22 113
Jigawa 0 30 0 29 0 20 0 30 0 30 139
Kaduna 0 22 0 26 2 27 3 31 0 29 140
Kano 0 34 0 34 0 30 0 33 0 31 162
Katsina 0 23 0 0 0 31 0 10 0 0 64
Kebbi 0 24 0 24 0 24 0 24 0 24 120
Kogi 0 24 0 22 0 23 1 11 0 26 107
Kwara 0 24 1 23 3 21 6 18 4 20 120
Lagos 3 37 2 38 3 37 6 34 4 36 200
Nasarawa 0 20 0 4 0 0 0 20 0 22 66
Niger 2 25 0 0 2 26 3 24 1 25 108
Ogun 2 24 1 25 1 25 2 24 1 25 130
Ondo 0 0 1 25 0 26 3 23 3 24 105
Osun 1 21 0 0 0 0 0 0 0 23 45
Oyo 3 36 0 38 1 36 1 31 1 22 169
Plateau 0 0 2 21 1 23 0 0 1 23 71
Rivers 0 32 1 23 0 0 0 4 0 0 60
Sokoto 0 30 0 20 0 0 0 0 0 30 80
Taraba 0 24 1 24 1 24 1 24 0 24 123
Yobe 0 0 0 0 0 0 0 0 0 0 0
Zamfara 0 24 0 24 0 24 0 24 0 15 111
FCT 0 0 0 0 0 0 0 0 0 0 0
Total 22 771 30 710 43 663 58 650 37 659 3643
State 1999 2003 2007 2011 2015
TOTAL

79
ST 5.4: Representation of Principal Officers in State House of Assembly by Type of
Office and Sex (1999 – 2015)
Source: State House of Assembly and NBS, HDI (2016)
F M F M F M F M F M F M F M F M F M F M F M F M F M F M F M F M F M F M F M F M
Abia 3 1 1 1 3 1 2 1 1 1 2 1 1 1 1 1 1 1 1 1
Adamawa 3 2 5 6 1 3 2 1 3 2 1 3 2 3 4 1 1 1 1 2 1
Akwa-Ibom 2 1 2 1 2 1 1 2 1 1 1 1 2 1 1 1 2 2 1 1 2
Anambra 1 1 1 1 1 1 1 1 1 1 1 1 1 1 1 1 1 1 1 1 1
Bauchi 1 1 1 1 1 1 1 1 1 1 1 1 1 1 1 1 1 1 1 1
Bayelsa 1 1 1 1 1 1 1 1 1 1 1 1 1 1 1 1 1 1 1 1
Benue 1 1 1 1 3 1 1 1 1 1 1 1 1 2 1 1 1 1
Borno 1 1 1 1 1 1 1 1 1 1 1 1 1 1 1 1 1 1 1 1
Cross River 1 1 1 1 1 1 1 1 1 1 1 1 1 1 1 1 1 1 1 1
Delta 1 1 1 1 1 1 1 1 1 1 1 1 1 1 1 1 1 1 1 1
Ebonyi 1 1 1 1 1 1 1 1 1 1 1 1 1 1 1 1 1 1 1 1
Edo 2 3 2 1 1 3 1 1 2 2 1 3 1 1 1 2 1 2 3
Ekiti 1 4 4 22 1 2 2 3 1 1 1 2 3 2 1 1 1 2 1 1
Enugu 1 1 1 1 1 1 1 1 1 1 1 1 1 1 1 1 1 1 1 1
Gombe 1 1 1 1 1 1 1 1 1 1 1 1 1 1 1 1 1 1 1 1
Imo 3 1 2 1 1 1 1 2 1 1 1 2 1 2 1 1 1 1 1 1 2
Jigawa 2 2 1 1 2 2 2 2 1 1 2 2 1 1 1 1 1 1
Kaduna 2 2 2 2 1 1 1 1 2 1 1 1 1 2 1 1 1 1 1 1
Kano 2 1 1 3 2 2 1 1 2 1 1 1 1 2 2 1 1 1 1 1
Katsina 1 1 1 1 1 1 1 1 1 1 1 1 1 1 1 1 1 1 1 1
Kebbi 1 1 1 1 1 1 1 1 1 1 1 1 1 1 1 1 1 1 1 1
Kogi 3 3 1 2 3 3 3 2 1 3 2 2 1 1 3 2 2 1 1 3
Kwara 1 1 2 1 1 2 1 2 1 1 2 2 1 2 1 1 2 2 2
Lagos 1 1 1 1 1 1 1 1 1 1 1 1 1 1 1 1 1 1 1 1
Nasarawa 1 1 1 1 1 1 1 1 1 1 4 3 1 1 1 1
Niger 1 2 3 4 1 1 1 1 2 1 1 1 1 2 1
Ogun 1 1 1 1 1 1 1 1 1 1 1 1 1 1 1 1 1
Ondo 1 1 1 1 1 1 1 1 1 1 1 1 1 1 1 1 1 1 1 1
Osun 1 1 1 1 1 1 1 1 1 1 1 1 1 1 1 1 1 1 1 1
Oyo 1 1 1 1 1 1 1 1 1 1 1 1 1 1 1 1 1 1 1 1
Plateau 2 2 2 2 1 2 1 1 1 1 2 1 1 1 1 1 1 1 1
Rivers 1 1 1 1 2 1 1 2 1 1 1 1 2 1 1 1 1 2 1 1
Sokoto 1 2 1 2 1 1 2 2 2 1 1 2 1 1 1 1 2 1 1 1
Taraba 4 2 1 4 1 4 3 2 3 1 4 1 1 2 1 1 2 1
Yobe 1 1 1 1 1 1 1 1 1 1 1 1 1 1 1 1 1 1 1 1
Zamfara 1 1 1 1 1 1 1 1 1 1 1 1 1 1 1 1 1 1 1 1
FCT 0 0 0 0 0 0 0 0 0 0 0 0 0 0 0 0 0 0 0 0 0 0 0 0 0 0 0 0 0 0 0 0 0 0 0 0 0 0 0 0
Total 1 53 2 49 1 51 2 74 3 44 1 47 1 45 3 47 1 44 2 41 0 49 1 47 1 43 1 43 0 40 0 29 2 31 1 31 2 33 1 40
State
SPEAKER DEPUTY SPEAKER HOUSE MAJORITY LEADER DEPUTY HOUSE MAJORITY LEADER
2015-20191999-2003 2003-2007 2007-2011 2011-2015 2015-2019 1999-2003 2003-2007 2007-2011 2011-2015 2015-2019 1999-2003 2003-2007 2007-2011 2011-2015 1999-2003 2003-2007 2007-2011 2011-2015 2015-2019

80
ST 5.4: Representation of Principal Officers in State House of Assembly by Type of Office
and Sex (1999 – 2015) Cont;
Source: State House of Assembly and NBS, HDI (2016)
F M F M F M F M F M F M F M F M F M F M F M F M F M F M F M F M F M F M F M F M
Abia 1 1 2 1 1 1 1 1 1 1 1
Adamawa 1 1 1 1 1 1 1 1 1 1 1 1 2 1 1 1 1 1 1 1 1
Akwa-Ibom 1 1 1 1 1 1 1 1 1 1 1 1 1 1 1 1 2
Anambra 1 1 1 1 1 1 1 1 1 1 1 1 1 1 1 1 1 1 1 1
Bauchi 1 1 1 1 1 1 1 1 1 1 1 1 1 1 1 1 1 1 1 1
Bayelsa 1 1 1 1 1 1 1 1 1 1 1 1 1 1 1 1 1 1 1 1
Benue 1 2 2 2 1 1 1 1 1 1
Borno 1 1 1 1 1 1 1 1 1 1 1 1 1 1 1 1 1 1 1 1
Cross River 1 1 1 1 1 1 1 1
Delta 1 1 1 1 1 1 1 1 1 1 1 1 1 1
Ebonyi 1 1 1 1 1 1 1 1 1 1 1 1
Edo 1 1 1 2 2 1 1 1 1 3 1 2
Ekiti 1 1 1 1 2 2 2 1 1 11 1 4 2 2 1
Enugu 1 1 1 1 1 1 1 1 1 1
Gombe 1 1 1 1 1 1 1 1 1 1 1 1 1 1 1
Imo 1 1 1 1 1 1 1 1 1 1 2 1 1 1 2 2 1 1 1 1 1
Jigawa 1 1 1 1 1 1 1 1 1 1
Kaduna 1 1 1 3 1 1 1 1 2 1 1 1 1 2 1
Kano 1 1 1 1 1 1 1 1 1 2 1 1 1 1
Katsina 1 1 1 1 1 1 1 1 1 1 1 1 1 1 1 1 1 1 1 1
Kebbi 1 1 1 1 1 1 1 1 1 1 1 1 1 1
Kogi 2 2 1 1 1 2 1 1 1 2 5
Kwara 1 1 1 2 2 1 1 1 1 1 1
Lagos 1 1 1 1 1 1 1 1 1 1
Nasarawa 1 1 1 1 2 1 1 1 1 1 1 1 1 1 1 1 1
Niger 1 1 1 1 1 1 1 1 1
Ogun 1 1 1 1 1 1 1 1 1 1 1 1 1
Ondo 1 1 1 1 1 1 1 1 1 1 1 1 1 1 1 1 1
Osun 1 1 1 1 1 1 1 1 1 1 1 1 1 1 1
Oyo 1 1 1 1 1 1 1 1 1 1 1 1 1 1 1 1 1 1 1
Plateau 1 1 1 1 1 1 1 1 1 1 1 1 1 1 1
Rivers 1 1 1 1 1 2 1 1 1 1 2 1 1
Sokoto 1 1 2 1 1 2 1 2 1 1 1 1 2 1 1 1
Taraba 1 1 1 1 1 1 1 1 1 1 1 2 1 1 1
Yobe 1 1 1 1 1 1 1 1 1 1 1 1 1 1 1 1 1 1 1 1
Zamfara 1 1 1 1 1 1 1 1 1 1 1 1 1 1 1 1 1 1
FCT 0 0 0 0 0 0 0 0 0 0 0 0 0 0 0 0 0 0 0 0 0 0 0 0 0 0 0 0 0 0 0 0 0 0 0 0 0 0 0 0
Total 0 31 1 27 2 21 2 28 3 29 0 22 0 20 0 19 0 17 0 20 2 38 1 35 2 39 7 36 2 52 0 22 2 26 6 23 4 24 4 26
2003-2007 2007-2011 2011-2015 2015-20191999-2003 2003-2007 2007-2011 2011-2015 2015-2019 1999-20032015-2019 1999-2003 2003-2007 2007-2011 2011-2015 2015-20191999-2003 2003-2007 2007-2011 2011-2015
DEPUTY HOUSE MINORITY LEADER HOUSE CHIEF WHIP DEPUTY HOUSE CHIEF WHIP
State
HOUSE MINORITY LEADER

81
ST 5.4: Representation of Principal Officers in State House of Assembly by Type of Office and
Sex (1999 – 2015) Cont;
Source: State House of Assembly and NBS, HDI (2016)
F M F M F M F M F M F M F M F M F M F M F M F M F M F M F M F M F M F M F M F M
Abia 1 1 1 23 2 22 2 22 3 21 2 29 1 13 2 22 2 22 3 21 1 13
Adamawa 1 1 1 1 1 1 1 1 1 1 25 1 24 1 24 2 23 2 23 15 1 14 1 14 2 13 1 14
Akwa-Ibom 2 1 1 15 15 2 16 1 13 1 14 2 2
Anambra 1 1 1 1 1 1 1 1 1 1 1 2 2 6 3 19 17 18 14 17
Bauchi 1 1 1 1 1 1 1 1 1 1 1 30 1 30 1 30 2 29 1 30 1 30 1 30 1 30 2 29 1 30
Bayelsa 1 1 1 1 1 1 1 1 1 1 1 1 1 1 3 13 14 13 13 11
Benue 1 1 1 1 1 1 17 2 16 1 23 3 21 2 22 5 1 4
Borno 28 1 27 28 28 28
Cross River 14 18 3 17 19 3 16 5 2
Delta 1 1 1 1 17 2 16 3 18 3 18 4 17 5 3 1
Ebonyi 18 2 16 1 17 4 12 2 14
Edo 1 1 1 2 22 2 22 1 23 1 23 1 23 2 2 5
Ekiti 1 26 4 22 2 24
Enugu 1 2 23 4 19 4 19 4 19 3 19
Gombe 1 1 1 1 1 1 2 17 13 17 17 14
Imo 1 1 1 1 1 1 1 1 1 1 12 16 12 15 13
Jigawa 1 1 21 22 23 24 21
Kaduna 1 1 1 2 1 33 1 33 2 32 2 32 34 1
Kano 32 32 34 35 34 42 40 42 47 45
Katsina 1 1 1 1 1 1 1 1 1 1 27 29 29 29 21
Kebbi 1 1 1 1 1 1 1 1 1 1 1 1 1 1
Kogi 1 1 2 2 25 23 2 25 1 24 25
Kwara 16 17 4 14 3 12 16 16
Lagos 1 1 3 4 27 2 27 1 30 33 30 2 1 1 4
Nasarawa 1 1 1 1 24 24 1 23 24 24 5 5 5 5 5
Niger 1 1 1 1 1 1 3 1
Ogun 1 1 1 21 20 20 20 21 21 20 20 18 19
Ondo 1 1 1 1 1 25 1 25 1 25 3 25 2 24
Osun 1 1 1 1 1 15 1 17 1 18 20 23 7 6 6 6 3
Oyo 1 1 1 1 1 1 1 1 1 1 3 21 24 1 23 1 2 22
Plateau 1 2 15 1 15 1 17 1 15 1 13 2 22 1 23 1 23 1 23 1 23
Rivers 1 1 22 1 25 4 27 3 28 25 1 6
Sokoto 1 1 2 1 1 2 30 30 30 30 30 30 30 30 30 30
Taraba 24 1 23 1 23 1 23 24
Yobe 1 1 1 1 1 1 1 1 1 1
Zamfara 1 1 1 1 1 1 1 1 14 14 14 14 18
FCT 0 0 0 0 0 0 0 0 0 0 0 0 0 0 0 0 0 0 0 0 0 0 0 0 0 0 0 0 0 0 0 0 0 0 0 0 0 0 0 0
Total 1 20 1 18 2 15 2 17 0 20 0 71 3 68 1 68 1 68 0 73 16 513 50 492 38 557 50 549 33 574 5 323 6 324 9 314 15 283 22 287
2015-2019 1999-2003 2003-2007 2007-2011 2011-2015 2015-20192011-2015 2015-2019 1999-2003 2003-2007 2007-2011 2011-20152007-2011 2011-2015 2015-2019 1999-2003 2003-2007 2007-20111999-2003 2003-2007
OTHER MEMBERSHOUSE MINORITY WHIP DEPUTY HOUSE MINORITY WHIP COMMITTEE CHAIRPERSONS
State

82
References
Population
1. United Nations, Department of Economics and Social Affairs, population Division
(2015). World Population Prospects: The 2015 Revision: New York: United Nations (sited
06/11/2017
Health
2. WHO, 1948. Preamble to the Constitution of the World Health Organization as adopted
by the International Health Conference, New York, 19-22 June, 1946; signed on 22 July
1946 by the representatives of 61 States (Official Records of the World Health
Organization, no. 2, p. 100) and entered into force on 7 April
1948.http://www.epacha.org/pages/UN_WHO_World_Health_Organisation.aspx. Sited
on 06/11/2017
3. United Nations, 1996. Report of the Fourth World Conference on Women, Beijing, 4-
15 September 1995. Sales No.E.96, iv.13 para. 89.
http://www.un.org/womenwatch/daw/beijing. Site on 06/11/2017
Education
4. Colclough, Christopher, Al-Samarrai, Samer, Rose, Pauline and Tembon,
Mercy (2004) Achieving schooling for All in Africa: Costs, Commitments and
Gender. Ashgate Press. ISBN 0754638073
5. UNESCO (United Nations Educational, Scientific and Cultural Organisation), 2003,
EFA and Global Monitoring Report 2003/4: Gender and Education for All: The Leap to
Equality. Paris: UNESCO.
Work
6. United Nations, 1996. Report of the Fourth World Conference on Women, Beijing, 4-
15 September 1995. Sales No.E.96. iv.13.

83
Power and Decision making
7. United Nations, 1996. The Universal Declaration of Human Rights.
http://www.un.org/en/documents/udb/shtmt (Site on 06/11/2017)
8. United Nations, 1979, Convention on the Elimination of All forms of Discrimination
Against Women, 18 December, Treaty Series, Vol.1949, no.20378,
http://www.un.org/women.org.womenwatch/9aw/cedaw/ text/econvention.htm
Violence against Women
9. UN Millennium Project, 2005. Taking Action: Achieving Gender Equality and
Empowering Women Task Force on Education and Gender Equality. London: Earthssan.

84