statistical report february 2012 · sgx mainboard (non s$) volume (million shares) ... value...
TRANSCRIPT
Statistical ReportFebruary 2012
SGX The Asian Gateway

SGX Monthly Market StatisticsFebruary 2012
SGX Statistics At A GlanceJan 2011 Feb 2012
Number of Trading Days (Securities) 19 21
Securities market Turnover Volume (million shares) 24,585 53,389
Securities market Turnover Value ($million) 24,457 38,240
Securities Daily Average ($million) 1,287 1,821
Derivatives Volume 4,775,572 6,566,350
Derivatives Daily Average Volume 265,590 323,058
Total Number of Listed Securities 773 770
Total Market Capitalisation 836,096 860,463
1

Securities MarketSecurities Market Turnover (1)
FY 2012 Q1 FY 2012 Q2 Dec 2011 Jan 2012 Feb 2012 FYTD 2012 (2) CYTD 2012 (2) Feb 2011 YoY %
SGX Mainboard (S$)Volume (Million Shares) 70,208 52,058 12,571 20,180 42,115 184,561 62,294 21,160 99%Value ($Million) 91,766 62,942 14,584 21,809 33,990 210,507 55,799 29,623 15%
SGX Mainboard (Non S$)Volume (Million Shares) 2,238 1,636 429 528 1,011 5,413 1,539 140 623%Value ($Million) 4,403 3,449 1,102 1,401 2,362 11,615 3,763 873 170%
SGX CatalistVolume (Million Shares) 7,660 7,189 1,882 3,271 8,054 26,173 11,325 1,969 309%Value ($Million) 775 1,204 296 555 1,122 3,656 1,677 117 856%
SGX GlobalQuoteVolume (Million Shares) 950 646 89 318 361 2,275 679 363 -1%Value ($Million) 479 276 38 173 224 1,151 396 203 10%
Exchange Traded FundsVolume (Million Shares) 200 125 30 30 32 387 62 41 -22%Value ($Million) 3,104 1,730 640 509 518 5,861 1,027 628 -17%
Company WarrantsVolume (Million Shares) 1,405 1,121 107 259 1,816 4,602 2,076 487 273%Value ($Million) 29 20 6 10 25 84 35 23 6%
Total Market TurnoverVolume (Million Shares) 82,660 62,775 15,107 24,585 53,389 223,410 77,975 24,159 121%Value ($Million) 100,556 69,620 16,665 24,457 38,240 232,873 62,697 31,467 22%
Securities Daily Average Volume (Million Shares) 1,292 1,013 719 1,294 2,542 1,346 1,949 1,342 89%Value ($Million) 1,571 1,123 794 1,287 1,821 1,403 1,567 1,748 4%
(1) Includes Primary and Secondary Listed Securities.
(2) FYTD refers to Financial Year-to-Date, and CYTD refers to Calendar Year-to-Date. Financial Year is between July to June, and Calendar Year is between January to December.
2

FY 2012 Q1 FY 2012 Q2 Dec 2011 Jan 2012 Feb 2012 FYTD 2012 CYTD 2012 Feb 2011 YoY %
Singapore CompaniesVolume (Million Shares) 41,971 27,274 6,158 11,322 27,260 107,827 38,583 10,107 170%Value ($Million) 58,880 39,274 10,110 13,731 18,808 130,692 32,538 17,363 8%
Overseas Companies (excluding China)
Volume (Million Shares) 28,392 26,297 6,923 9,963 17,481 82,133 27,444 8,797 99%Value ($Million) 34,135 26,212 5,673 9,205 15,782 85,333 24,987 10,901 45%
China CompaniesVolume (Million Shares) 12,298 9,204 2,026 3,300 8,648 33,451 11,948 5,256 65%Value ($Million) 7,542 4,135 883 1,521 3,651 16,848 5,172 3,203 14%
Total Market Turnover Volume (Million Shares) 82,660 62,775 15,107 24,585 53,389 223,410 77,975 24,159 121%Value ($Million) 100,556 69,620 16,665 24,457 38,240 232,873 62,697 31,467 22%
3
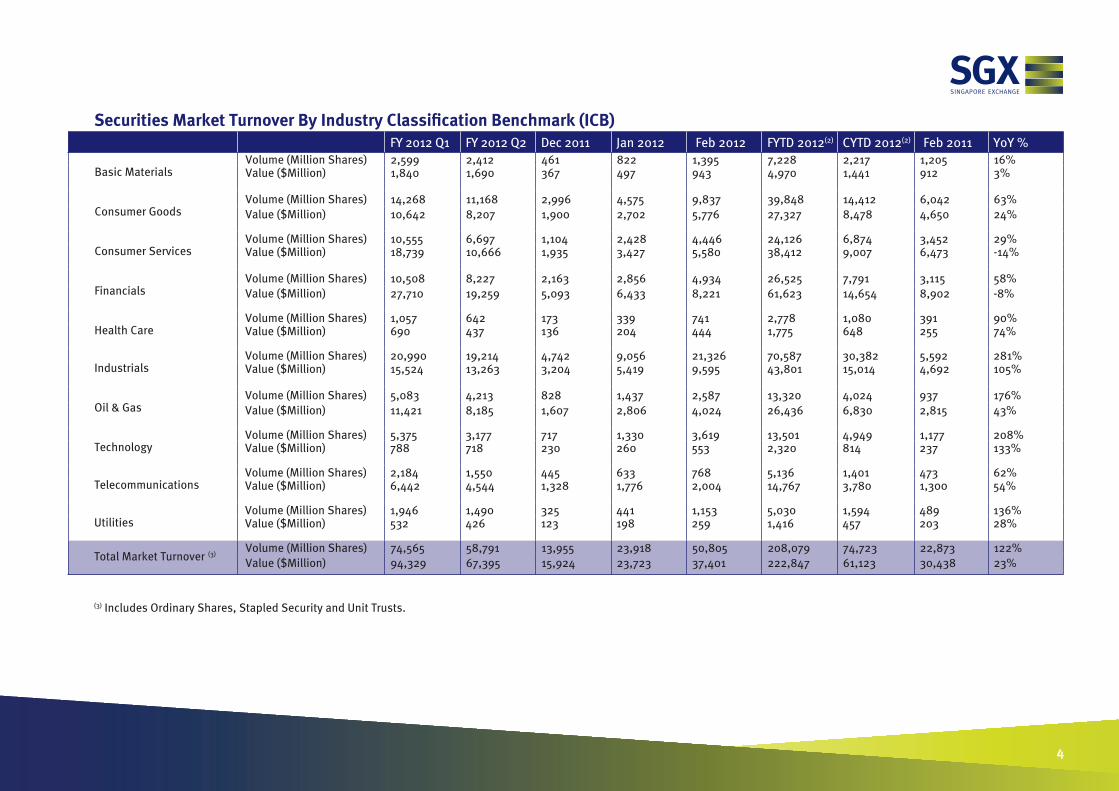
(3) Includes Ordinary Shares, Stapled Security and Unit Trusts.
Securities Market Turnover By Industry Classification Benchmark (ICB) FY 2012 Q1 FY 2012 Q2 Dec 2011 Jan 2012 Feb 2012 FYTD 2012(2) CYTD 2012(2) Feb 2011 YoY %
Basic MaterialsVolume (Million Shares) 2,599 2,412 461 822 1,395 7,228 2,217 1,205 16%Value ($Million) 1,840 1,690 367 497 943 4,970 1,441 912 3%
Consumer GoodsVolume (Million Shares) 14,268 11,168 2,996 4,575 9,837 39,848 14,412 6,042 63%Value ($Million) 10,642 8,207 1,900 2,702 5,776 27,327 8,478 4,650 24%
Consumer ServicesVolume (Million Shares) 10,555 6,697 1,104 2,428 4,446 24,126 6,874 3,452 29%Value ($Million) 18,739 10,666 1,935 3,427 5,580 38,412 9,007 6,473 -14%
FinancialsVolume (Million Shares) 10,508 8,227 2,163 2,856 4,934 26,525 7,791 3,115 58%Value ($Million) 27,710 19,259 5,093 6,433 8,221 61,623 14,654 8,902 -8%
Health CareVolume (Million Shares) 1,057 642 173 339 741 2,778 1,080 391 90%Value ($Million) 690 437 136 204 444 1,775 648 255 74%
IndustrialsVolume (Million Shares) 20,990 19,214 4,742 9,056 21,326 70,587 30,382 5,592 281%Value ($Million) 15,524 13,263 3,204 5,419 9,595 43,801 15,014 4,692 105%
Oil & GasVolume (Million Shares) 5,083 4,213 828 1,437 2,587 13,320 4,024 937 176%Value ($Million) 11,421 8,185 1,607 2,806 4,024 26,436 6,830 2,815 43%
TechnologyVolume (Million Shares) 5,375 3,177 717 1,330 3,619 13,501 4,949 1,177 208%Value ($Million) 788 718 230 260 553 2,320 814 237 133%
TelecommunicationsVolume (Million Shares) 2,184 1,550 445 633 768 5,136 1,401 473 62%Value ($Million) 6,442 4,544 1,328 1,776 2,004 14,767 3,780 1,300 54%
UtilitiesVolume (Million Shares) 1,946 1,490 325 441 1,153 5,030 1,594 489 136%Value ($Million) 532 426 123 198 259 1,416 457 203 28%
Total Market Turnover (3)Volume (Million Shares) 74,565 58,791 13,955 23,918 50,805 208,079 74,723 22,873 122%Value ($Million) 94,329 67,395 15,924 23,723 37,401 222,847 61,123 30,438 23%
4
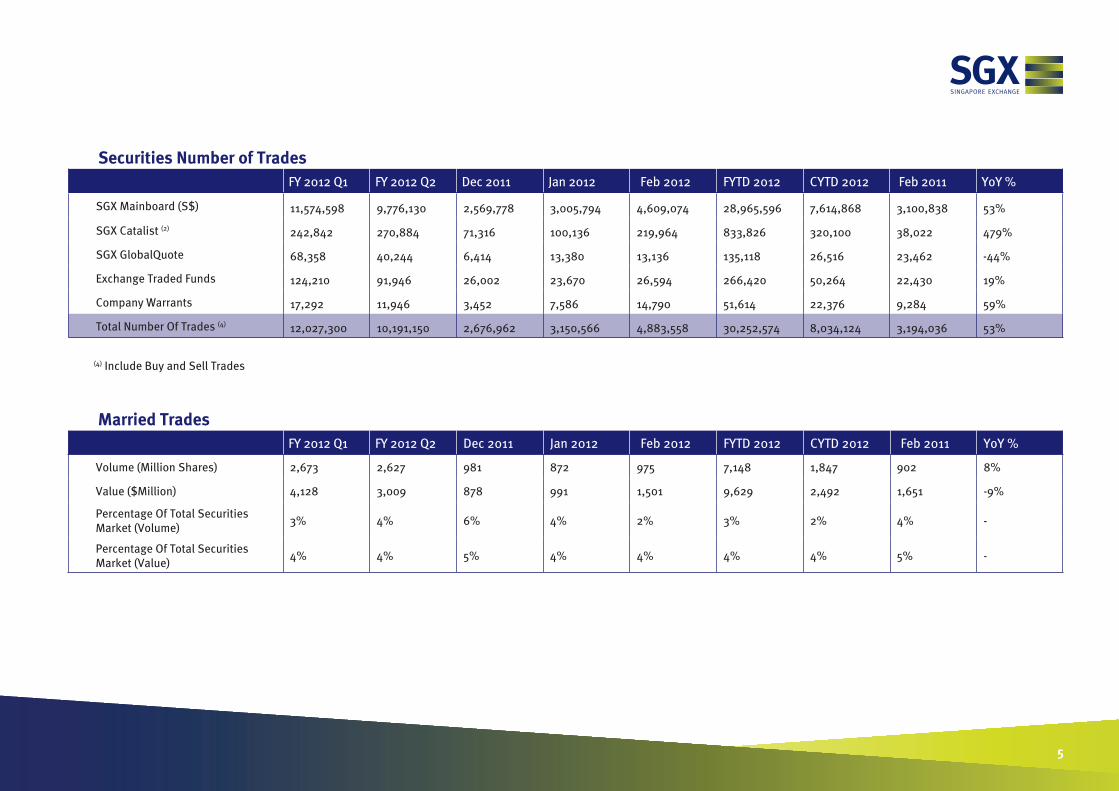
Securities Number of Trades FY 2012 Q1 FY 2012 Q2 Dec 2011 Jan 2012 Feb 2012 FYTD 2012 CYTD 2012 Feb 2011 YoY %
SGX Mainboard (S$) 11,574,598 9,776,130 2,569,778 3,005,794 4,609,074 28,965,596 7,614,868 3,100,838 53%
SGX Catalist (2) 242,842 270,884 71,316 100,136 219,964 833,826 320,100 38,022 479%
SGX GlobalQuote 68,358 40,244 6,414 13,380 13,136 135,118 26,516 23,462 -44%
Exchange Traded Funds 124,210 91,946 26,002 23,670 26,594 266,420 50,264 22,430 19%
Company Warrants 17,292 11,946 3,452 7,586 14,790 51,614 22,376 9,284 59%
Total Number Of Trades (4) 12,027,300 10,191,150 2,676,962 3,150,566 4,883,558 30,252,574 8,034,124 3,194,036 53%
Married Trades FY 2012 Q1 FY 2012 Q2 Dec 2011 Jan 2012 Feb 2012 FYTD 2012 CYTD 2012 Feb 2011 YoY %
Volume (Million Shares) 2,673 2,627 981 872 975 7,148 1,847 902 8%
Value ($Million) 4,128 3,009 878 991 1,501 9,629 2,492 1,651 -9%
Percentage Of Total Securities Market (Volume)
3% 4% 6% 4% 2% 3% 2% 4% -
Percentage Of Total Securities Market (Value)
4% 4% 5% 4% 4% 4% 4% 5% -
5
(4) Include Buy and Sell Trades

Securities Borrowing & Lending FY 2012 Q1 FY 2012 Q2 Dec 2011 Jan 2012 Feb 2012 FYTD 2012 CYTD 2012
Volume Transfer (Million Shares) 11,746 8,857 2,451 2,033 2,964 25,600 4,996
Top 5 Securities On Loan Under CDP SBL Programme By Volume and Value
Stock Average Daily Volume Stock Average Daily Value (S$)
MIDAS Holdings Limited 3,037,310 Noble Group Limited 3,401,351
Noble Group Limited 2,353,931 Cosco Corporation (S) Limited 2,784,034
Cosco Corporation (S) Limited 2,273,634 Genting Singapore Plc 2,170,402
United Fiber System Limited 1,754,206 Neptune Orient Lines Limited 1,392,625
Golden Agri Resources Limited 1,606,344 Golden Agri Resources Limited 1,229,207
6

STI Constituent StocksMarket Capitalisation ($million) % of Total Trading Value (6)
CAPITALAND LIMITED 13,072 2%
CAPITAMALLS ASIA LIMITED 5,983 1%
CAPITAMALL TRUST 5,993 1%
CITY DEVELOPMENTS LIMITED 10,121 1%
COMFORTDELGRO CORPORATION LTD 3,199 0%
DBS GROUP HOLDINGS LTD 34,297 3%
FRASER AND NEAVE, LIMITED 9,493 1%
GENTING SINGAPORE PLC 19,700 10%
GOLDEN AGRI-RESOURCES LTD 8,861 4%
HONGKONG LAND HOLDINGS LIMITED 16,145 2%
JARDINE CYCLE & CARRIAGE LTD 17,000 1%
JARDINE MATHESON HLDGS LTD 41,983 1%
JARDINE STRATEGIC HLDGS LTD 42,736 0%
KEPPEL CORPORATION LIMITED 19,749 3%
Turnover Velocity (5)
FY 2012 Q1 FY 2012 Q2 Dec 2011 Jan 2012 Feb 2012 FYTD 2012 CYTD 2012 Feb 2011
SGX Overall 61% 47% 33% 51% 70% 56% 61% 66%
SGX Mainboard 61% 47% 33% 50% 68% 56% 60% 67%
SGX Catalist 57% 92% 67% 130% 224% 102% 181% 26%
(5) Includes Ordinary Shares, Investment Funds, SDR, Stapled Securities and Unit Trusts.
7

Market Capitalisation ($million) % of Total Trading Value (6)
NEPTUNE ORIENT LINES LIMITED 3,462 1%
NOBLE GROUP LIMITED 9,072 6%
OLAM INTERNATIONAL LIMITED 5,813 3%
OVERSEA-CHINESE BANKING CORP 30,776 2%
SEMBCORP INDUSTRIES LTD 9,436 1%
SEMBCORP MARINE LTD 11,144 2%
SIA ENGINEERING CO LTD 4,124 0%
SINGAPORE AIRLINES LTD 12,969 1%
SINGAPORE EXCHANGE LIMITED 7,727 1%
SINGAPORE PRESS HLDGS LTD 6,045 1%
SINGAPORE TECH ENGINEERING LTD 9,726 0%
SINGTEL 50,535 5%
SMRT CORPORATION LTD 2,638 0%
STARHUB LTD 5,037 0%
UNITED OVERSEAS BANK LTD 28,398 2%
WILMAR INTERNATIONAL LIMITED 32,712 4%
Total 477,946 59%
(6) Trading Value of counter as a percentage of Trading Value of Total Securities Market excluding SGX GlobalQuote, Exchange Traded Funds and Company Warrants.
8
9
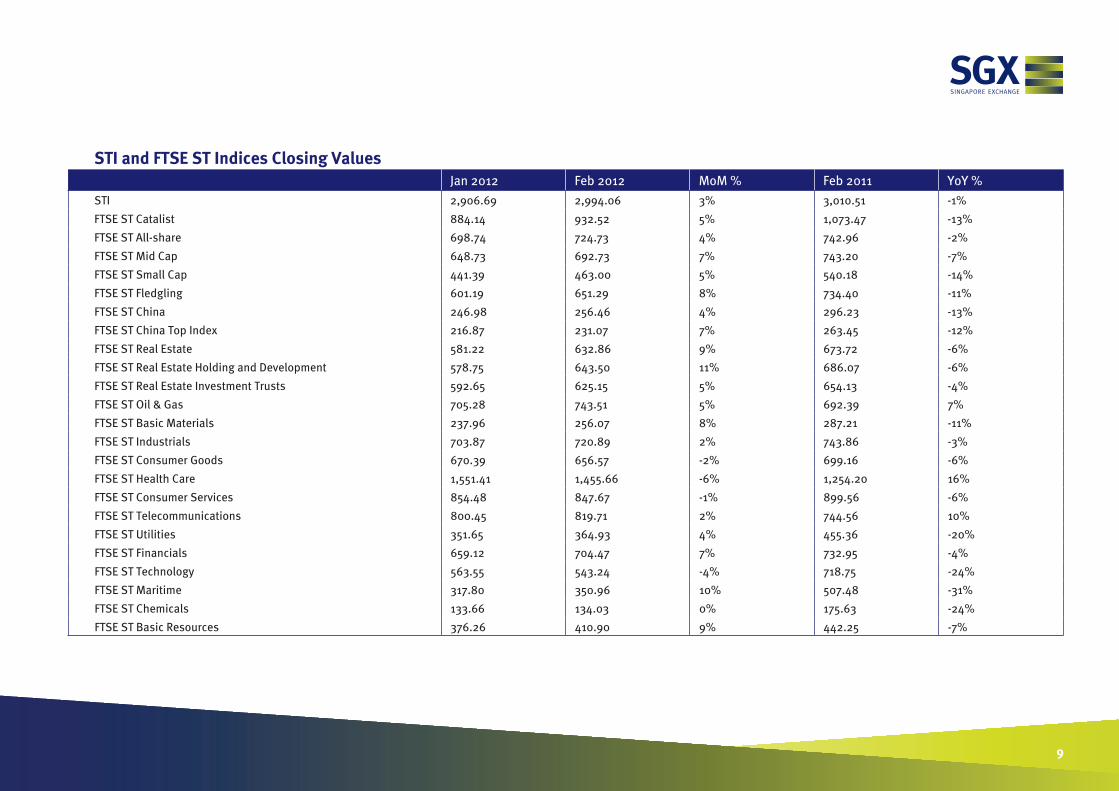
STI and FTSE ST Indices Closing Values Jan 2012 Feb 2012 MoM % Feb 2011 YoY %
STI 2,906.69 2,994.06 3% 3,010.51 -1%
FTSE ST Catalist 884.14 932.52 5% 1,073.47 -13%
FTSE ST All-share 698.74 724.73 4% 742.96 -2%
FTSE ST Mid Cap 648.73 692.73 7% 743.20 -7%
FTSE ST Small Cap 441.39 463.00 5% 540.18 -14%
FTSE ST Fledgling 601.19 651.29 8% 734.40 -11%
FTSE ST China 246.98 256.46 4% 296.23 -13%
FTSE ST China Top Index 216.87 231.07 7% 263.45 -12%
FTSE ST Real Estate 581.22 632.86 9% 673.72 -6%
FTSE ST Real Estate Holding and Development 578.75 643.50 11% 686.07 -6%
FTSE ST Real Estate Investment Trusts 592.65 625.15 5% 654.13 -4%
FTSE ST Oil & Gas 705.28 743.51 5% 692.39 7%
FTSE ST Basic Materials 237.96 256.07 8% 287.21 -11%
FTSE ST Industrials 703.87 720.89 2% 743.86 -3%
FTSE ST Consumer Goods 670.39 656.57 -2% 699.16 -6%
FTSE ST Health Care 1,551.41 1,455.66 -6% 1,254.20 16%
FTSE ST Consumer Services 854.48 847.67 -1% 899.56 -6%
FTSE ST Telecommunications 800.45 819.71 2% 744.56 10%
FTSE ST Utilities 351.65 364.93 4% 455.36 -20%
FTSE ST Financials 659.12 704.47 7% 732.95 -4%
FTSE ST Technology 563.55 543.24 -4% 718.75 -24%
FTSE ST Maritime 317.80 350.96 10% 507.48 -31%
FTSE ST Chemicals 133.66 134.03 0% 175.63 -24%
FTSE ST Basic Resources 376.26 410.90 9% 442.25 -7%

Proportion of Contract Values (8)
FY 2012 Q1 FY 2012 Q2 Dec 2011 Jan 2012 Feb 2012 FYTD 2012 CYTD 2012 Feb 2011
Contract Values < $1.5 million 54% 58% 59% 60% 58% 57% 59% 54%
Contract Values > $1.5 million 46% 42% 41% 40% 42% 43% 41% 46%
(8) Contract Values < $1.5 million represents uncapped trades, whereas Contract Values > $1.5 million represents capped trades.
(7) FTSE ST Insurance Index is not available as there is currently no constituent within this sector.
10
Jan 2011 Feb 2012 MoM % Feb 2011 YoY %
FTSE ST Construction & Materials Index 595.62 634.13 6% 634.57 0%
FTSE ST Industrial Goods & Services Index 713.15 729.32 2% 753.47 -3%
FTSE ST Automobiles & Parts Index 624.97 635.05 2% 685.45 -7%
FTSE ST Food & Beverage Index 823.60 806.01 -2% 835.10 -3%
FTSE ST Personal & Household Goods Index 82.61 83.22 1% 174.72 -52%
FTSE ST Retail Index 1,320.51 1,236.51 -6% 944.68 31%
FTSE ST Media Index 832.70 850.65 2% 870.85 -2%
FTSE ST Travel & Leisure Index 770.19 773.06 0% 900.07 -14%
FTSE ST Banks Index 797.79 833.33 4% 838.72 -1%
FTSE ST Insurance Index (7) N.A. N.A. N.A. N.A. N.A.
FTSE ST Financials Services 519.60 569.26 10% 555.27 3%
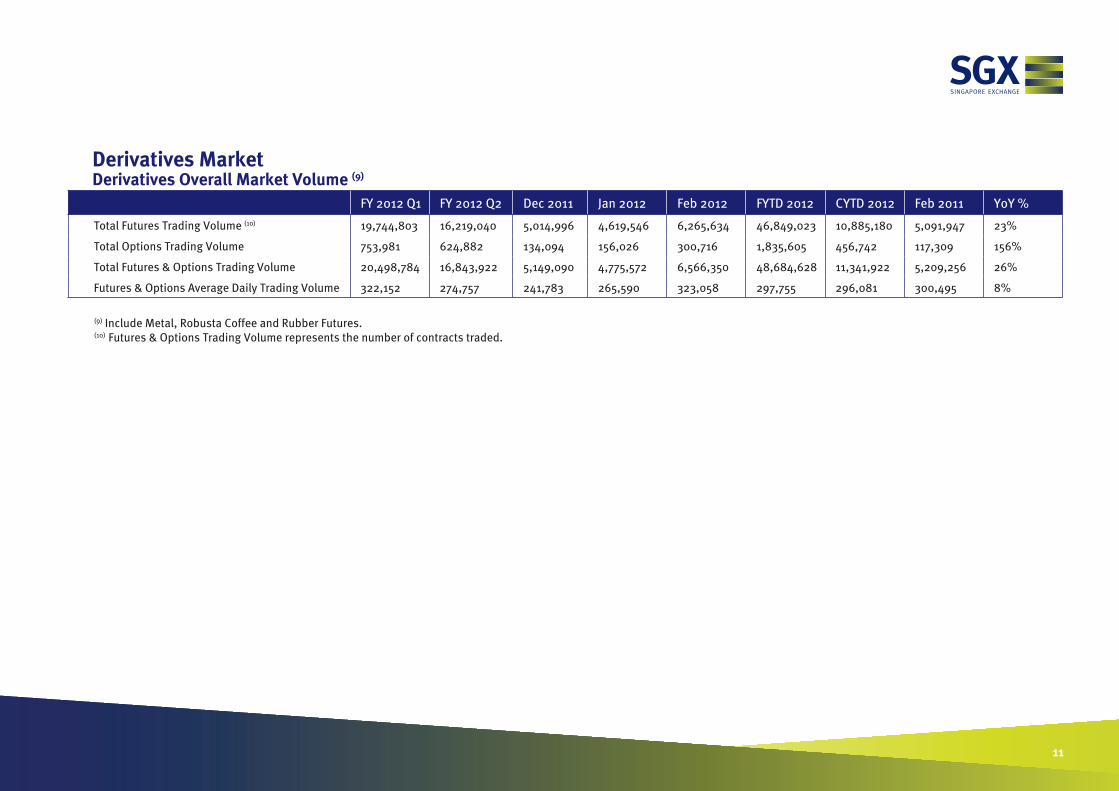
Derivatives MarketDerivatives Overall Market Volume (9)
FY 2012 Q1 FY 2012 Q2 Dec 2011 Jan 2012 Feb 2012 FYTD 2012 CYTD 2012 Feb 2011 YoY %
Total Futures Trading Volume (10) 19,744,803 16,219,040 5,014,996 4,619,546 6,265,634 46,849,023 10,885,180 5,091,947 23%
Total Options Trading Volume 753,981 624,882 134,094 156,026 300,716 1,835,605 456,742 117,309 156%
Total Futures & Options Trading Volume 20,498,784 16,843,922 5,149,090 4,775,572 6,566,350 48,684,628 11,341,922 5,209,256 26%
Futures & Options Average Daily Trading Volume 322,152 274,757 241,783 265,590 323,058 297,755 296,081 300,495 8%
(9) Include Metal, Robusta Coffee and Rubber Futures.(10) Futures & Options Trading Volume represents the number of contracts traded.
11
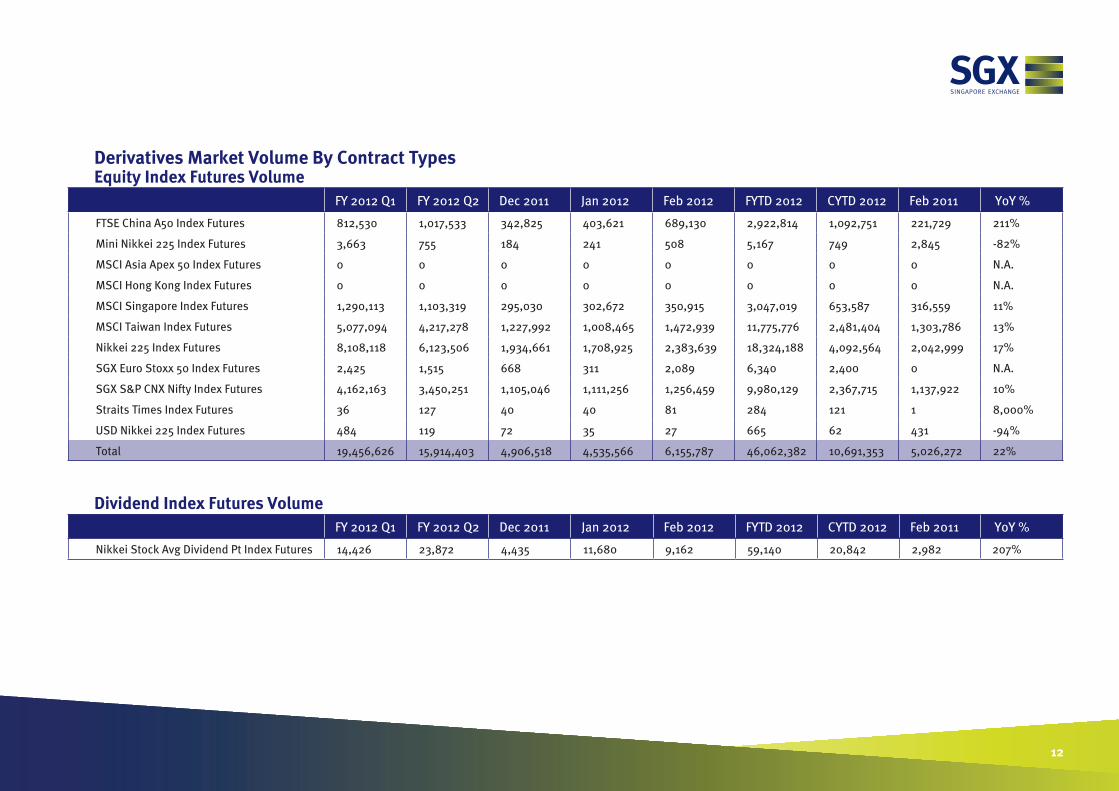
Derivatives Market Volume By Contract TypesEquity Index Futures Volume
FY 2012 Q1 FY 2012 Q2 Dec 2011 Jan 2012 Feb 2012 FYTD 2012 CYTD 2012 Feb 2011 YoY %
FTSE China A50 Index Futures 812,530 1,017,533 342,825 403,621 689,130 2,922,814 1,092,751 221,729 211%
Mini Nikkei 225 Index Futures 3,663 755 184 241 508 5,167 749 2,845 -82%
MSCI Asia Apex 50 Index Futures 0 0 0 0 0 0 0 0 N.A.
MSCI Hong Kong Index Futures 0 0 0 0 0 0 0 0 N.A.
MSCI Singapore Index Futures 1,290,113 1,103,319 295,030 302,672 350,915 3,047,019 653,587 316,559 11%
MSCI Taiwan Index Futures 5,077,094 4,217,278 1,227,992 1,008,465 1,472,939 11,775,776 2,481,404 1,303,786 13%
Nikkei 225 Index Futures 8,108,118 6,123,506 1,934,661 1,708,925 2,383,639 18,324,188 4,092,564 2,042,999 17%
SGX Euro Stoxx 50 Index Futures 2,425 1,515 668 311 2,089 6,340 2,400 0 N.A.
SGX S&P CNX Nifty Index Futures 4,162,163 3,450,251 1,105,046 1,111,256 1,256,459 9,980,129 2,367,715 1,137,922 10%
Straits Times Index Futures 36 127 40 40 81 284 121 1 8,000%
USD Nikkei 225 Index Futures 484 119 72 35 27 665 62 431 -94%
Total 19,456,626 15,914,403 4,906,518 4,535,566 6,155,787 46,062,382 10,691,353 5,026,272 22%
Dividend Index Futures Volume FY 2012 Q1 FY 2012 Q2 Dec 2011 Jan 2012 Feb 2012 FYTD 2012 CYTD 2012 Feb 2011 YoY %
Nikkei Stock Avg Dividend Pt Index Futures 14,426 23,872 4,435 11,680 9,162 59,140 20,842 2,982 207%
12

Interest Rates Futures VolumeFY 2012 Q1 FY 2012 Q2 Dec 2011 Jan 2012 Feb 2012 FYTD 2012 CYTD 2012 Feb 2011 YoY %
3-Mth Singapore Interest Rate Futures 0 0 0 0 0 0 0 0 N.A.
5-Yr Singapore Government Bond Futures 0 0 0 0 0 0 0 0 N.A.
Eurodollar Futures 0 0 0 0 0 0 0 0 N.A.
Euroyen Libor Futures 0 0 0 0 0 0 0 0 N.A.
Euroyen Tibor Futures 9,380 14,419 5,035 973 1,875 26,647 2,848 5,389 -65%
Japanese Government Bond Futures 0 0 0 0 0 0 0 0 N.A.
Mini Japanese Government Bond Futures 196,458 196,293 81,673 51,837 76,936 521,524 128,773 40,580 90%
Total 205,838 210,712 86,708 52,810 78,811 548,171 131,621 45,969 71%
13

Equity Index Options Volume FY 2012 Q1 FY 2012 Q2 Dec 2011 Jan 2012 Feb 2012 FYTD 2012 CYTD 2012 Feb 2011 YoY %
MSCI Singapore Index Options 2,784 1,035 150 240 64 4,123 304 732 -91%
MSCI Taiwan Index Options 3,693 1,547 372 222 106 5,568 328 1,755 -94%
Nikkei 225 Index Options 747,504 622,300 133,572 155,564 300,546 1,825,914 456,110 114,822 162%
SGX Euro Stoxx 50 Index Options 0 0 0 0 0 0 0 0 N.A.
Total 753,981 624,882 134,094 156,026 300,716 1,835,605 456,742 117,309 156%
Interest Rates Options Volume FY 2012 Q1 FY 2012 Q2 Dec 2011 Jan 2012 Feb 2012 FYTD 2012 CYTD 2012 Feb 2011 YoY %
Eurodollar Options 0 0 0 0 0 0 0 0 N.A.
Euroyen Libor Options 0 0 0 0 0 0 0 0 N.A.
Euroyen Tibor Options 0 0 0 0 0 0 0 0 N.A.
Mini Japanese Government Bond Options 0 0 0 0 0 0 0 0 N.A.
Total 0 0 0 0 0 0 0 0 N.A.
Agri-Commodities Volume FY 2012 Q1 FY 2012 Q2 Dec 2011 Jan 2012 Feb 2012 FYTD 2012 CYTD 2012 Feb 2011 YoY %
Crude Palm Oil Futures 0 0 0 0 0 0 0 0 N.A.
SGX Robusta Coffee Futures 0 0 0 0 0 0 0 40 -100%
SICOM RSS3 Rubber Futures 8,403 4,487 899 809 1,037 14,736 1,846 1,262 -18%
SICOM TSR20 Rubber Futures 55,894 64,822 16,364 18,548 20,721 159,985 39,269 10,816 92%
Total 64,297 69,309 17,263 19,357 21,758 174,721 41,115 12,118 80%
14

Metal Futures Volume
FY 2012 Q1 FY 2012 Q2 Dec 2011 Jan 2012 Feb 2012 FYTD 2012 CYTD 2012 Feb 2011 YoY %
LME-SGX Aluminium Futures 689 186 21 4 31 910 35 2,401 -99%
LME-SGX Copper Futures 1,776 373 13 83 79 2,311 162 6,688 -99%
LME-SGX Zinc Futures 1,151 185 38 46 6 1,388 52 6,733 -100%
Total 3,616 744 72 133 116 4,609 249 15,822 -99%
Energy Futures Volume
FY 2012 Q1 FY 2012 Q2 Dec 2011 Jan 2012 Feb 2012 FYTD 2012 CYTD 2012 Feb 2011 YoY %
Fuel Oil 380 Futures 0 0 0 0 0 0 0 862 -100%
SGX AsiaClear Cleared Volume FY 2012 Q1 FY 2012 Q2 Dec 2011 Jan 2012 Feb 2012 FYTD 2012 CYTD 2012 Feb 2011 YoY %
OTC Forward Freight Agreements 33,029 19,336 4,285 14,515 11,409 78,289 25,924 10,284 11%
OTC Iron Ore Swaps 24,146 35,138 7,413 8,929 11,971 80,184 20,900 2,453 388%
OTC Sub-Bit Coal 930 630 30 175 225 1,975 400 50 350%
OTC Energy Swaps 1,452 1,181 286 713 969 4,315 1,682 2,784 -65%
OTC Rubber Futures 405 600 220 180 85 1,270 265 35 143%
Total 59,962 56,885 12,234 24,512 24,659 166,033 49,171 15,606 58%
15

OTC Financial Derivatives Cleared Volume
FY 2012 Q1
FY 2012 Q2 Dec 2011 Jan 2012 Feb 2012 FYTD
2012CYTD 2012
Total to Date (Nov 2010 to Feb 2012
Feb 2011 (11) YoY %
Interest Rate Swap 58,936 17,155 1,257 12,916 5,074 94,081 17,990 203,774 12,989 -61%
Total (Notional Amount In SGD million equivalent)
58,936 17,155 1,257 12,916 5,074 94,081 17,990 203,774 12,989 -61%
16
Structured Warrants and Extended Settlement Volume and Value FY 2012 Q1 FY 2012 Q2 Dec 2011 Jan 2012 Feb 2012 FYTD 2012 CYTD 2012 Feb 2011 YoY %
Structured Warrants Trading Volume (million units)
15,846 18,775 4,436 3,543 5,111 43,275 8,655 2,162 136%
Equities - Indices 11,919 15,704 3,731 2,554 3,767 33,945 6,322 1,346 180%
Equities - Stocks 3,927 3,071 705 989 1,344 9,331 2,333 816 65%
Extended Settlement Contracts Trading Volume (shares)
2,783,000 7,996,000 2,744,000 2,239,000 4,847,000 17,865,000 7,086,000 458,000 958%
Structured Warrants Trading Value ($ million) 2,193 2,198 455 368 611 5,370 979 470 30%
Equities - Indices 1,800 1,916 402 274 466 4,456 739 316 48%
Equities - Stocks 393 282 54 95 145 915 240 154 -6%
Extended Settlement Contracts Trading Value ($) 10,624,060 21,770,215 6,314,905 6,731,820 10,859,180 49,985,275 17,591,000 2,140,050 407%
FY 2012 Q1 FY 2012 Q2 Dec 2011 Jan 2012 Feb 2012 FYTD 2012 CYTD 2012 Feb 2011 YoY %
Structured Warrants Total Number of Trades (4) 644,768 518,348 102,794 85,522 108,826 1,357,464 194,348 104,174 4%
(11) Volume for Feb 2011 includes backloaded transactions.

Derivatives Market Open Interest By Contract TypeEquity Index Futures Open Interest
FY 2012 Q1 FY 2012 Q2 Dec 2011 Jan 2012 Feb 2012 Feb 2011 YoY %
FTSE China A50 Index Futures 61,628 63,687 63,687 83,017 129,266 35,233 267%
Mini Nikkei 225 Index Futures 73 58 58 101 141 1,171 -88%
MSCI Asia Apex 50 Index Futures 0 0 0 0 0 0 N.A.
MSCI Hong Kong Index Futures 0 0 0 0 0 0 N.A.
MSCI Singapore Index Futures 55,958 49,356 49,356 39,473 48,608 44,412 9%
MSCI Taiwan Index Futures 168,882 160,340 160,340 168,137 216,928 134,207 62%
Nikkei 225 Index Futures 192,211 202,632 202,632 220,129 251,573 270,777 -7%
SGX Euro Stoxx 50 Index Futures 48 50 50 35 142 151 -6%
SGX S&P CNX Nifty Index Futures 234,299 242,237 242,237 226,333 282,116 208,969 35%
Straits Times Index Futures 0 0 0 0 20 6 233%
USD Nikkei 225 Index Futures 8,211 5,275 5,275 6,201 15,435 15,617 -1%
Total 721,310 723,635 723,635 743,426 944,229 710,543 33%
Dividend Index Futures Open Interest FY 2012 Q1 FY 2012 Q2 Dec 2011 Jan 2012 Feb 2012 Feb 2011 YoY %
Nikkei Stock Avg Dividend Pt Index Futures 20,879 24,720 24,720 26,354 30,109 9,196 227%
17

Interest Rates Futures Open Interest FY 2012 Q1 FY 2012 Q2 Dec 2011 Jan 2012 Feb 2012 Feb 2011 YoY %
3-Mth Singapore Interest Rate Futures 0 0 0 0 0 0 N.A.
5-Yr Singapore Government Bond Futures 0 0 0 0 0 0 N.A.
Eurodollar Futures 9,535 12,953 12,953 7,630 6,986 16,412 -57%
Euroyen Libor Futures 0 0 0 0 0 0 N.A.
Euroyen Tibor Futures 6,755 4,882 4,882 5,060 5,829 11,578 -50%
Japanese Government Bond Futures 0 0 0 0 0 0 N.A.
Mini Japanese Government Bond Futures 22,614 21,465 21,465 25,413 24,039 13,471 78%
Total 38,904 39,300 39,300 38,103 36,854 41,461 -11%
Equity Index Options Open Interest FY 2012 Q1 FY 2012 Q2 Dec 2011 Jan 2012 Feb 2012 Feb 2011 YoY %
MSCI Singapore Index Options 249 24 24 38 10 1,602 -99%
MSCI Taiwan Index Options 124 53 53 33 41 1,551 -97%
Nikkei 225 Index Options 502,648 392,597 392,597 403,159 528,875 211,530 150%
SGX Euro Stoxx 50 Index Options 0 0 0 0 0 0 N.A.
Total 503,021 392,674 392,674 403,230 528,926 214,683 146%
18

Interest Rates Options Open Interest FY 2012 Q1 FY 2012 Q2 Dec 2011 Jan 2012 Feb 2012 Feb 2011 YoY %
Eurodollar Options 0 0 0 0 0 0 N.A.
Euroyen Libor Options 0 0 0 0 0 0 N.A.
Euroyen Tibor Options 0 0 0 0 0 0 N.A.
Mini Japanese Government Bond Options 0 0 0 0 0 0 N.A.
Total 0 0 0 0 0 0 N.A.
Agri-Commodities Open Interest FY 2012 Q1 FY 2012 Q2 Dec 2011 Jan 2012 Feb 2012 Feb 2011 YoY %
Crude Palm Oil Futures 0 0 0 0 0 0 N.A.
SGX Robusta Coffee Futures 0 0 0 0 0 24 -100%
SICOM RSS3 Rubber Futures 2,279 1,784 1,784 1,485 1,407 1,594 -12%
SICOM TSR20 Rubber Futures 15,545 15,758 15,758 15,662 17,047 8,992 90%
Total 17,824 17,542 17,542 17,147 18,454 10,610 74%
Metal Futures Open Interest FY 2012 Q1 FY 2012 Q2 Dec 2011 Jan 2012 Feb 2012 Feb 2011 YoY %
LME-SGX Aluminium Futures 185 58 58 45 31 60 -48%
LME-SGX Copper Futures 149 49 49 33 44 211 -79%
LME-SGX Zinc Futures 192 41 41 30 9 137 -93%
Total 526 148 148 108 84 408 -79%
19

Energy Futures Open Interest FY 2012 Q1 FY 2012 Q2 Dec 2011 Jan 2012 Feb 2012 Feb 2011 YoY %
Fuel Oil 380 Futures 0 0 0 0 0 172 -100%
SGX AsiaClear Open Interest FY 2012 Q1 FY 2012 Q2 Dec 2011 Jan 2012 Feb 2012 Feb 2011 YoY %
OTC Energy Swaps 580 544 544 549 852 1,612 -47%
OTC Forward Freight Agreements 17,836 16,278 16,278 17,295 20,202 17,998 12%
OTC Iron Ore Swaps 9,799 11,313 11,313 11,647 11,466 3,201 258%
OTC Rubber Futures 110 95 95 115 100 45 122%
Total 28,325 28,230 28,230 29,606 32,620 22,856 43%
Extended Settlement Contracts Open Interest FY 2012 Q1 FY 2012 Q2 Dec 2011 Jan 2012 Feb 2012 Feb 2011 YoY %
Extended Settlement Contracts (shares) 107,000 524,000 524,000 351,000 1,352,000 272,000 397%
20

Depository ServicesDistinct Clients (12)
Dec 2011 Jan 2012 Feb 2012 FYTD 2012 CYTD 2012 Feb 2011 YoY %
Number of Distinct Clients 87,996 106,125 137,154 294,968 168,121 150,343 -9%
Issuer ServicesNumber of Listings (month-end)
FY 2012 Q1 FY 2012 Q2 Dec 2011 Jan 2012 Feb 2012 Feb 2011
SGX Mainboard 640 637 637 636 (#) 635 650
- Primary Listings 612 609 609 608 607 624
- Secondary Listings 28 28 28 28 28 26
- IPOs 1 3 0 0 0 1
- Delistings 8 7 3 1 1 3
SGX Catalist 132 136 136 136 135 134
- Primary Listings 132 136 136 136 135 134
- Secondary Listings 0 0 0 0 0 0
- IPOs 4 5 1 0 0 1
- Delistings 1 1 0 0 1 0
Total Number of Listed Securities (13) 772 773 773 772 770 784
SGX GlobalQuote 50 65 50 65 65 23
RTOs into existing vehicles 0 1 0 0 0 0
(12) Distinct Clients represent the number of unique trading accounts participating in the market.Each account is reflected as one count regardless of number of transactions made.
21
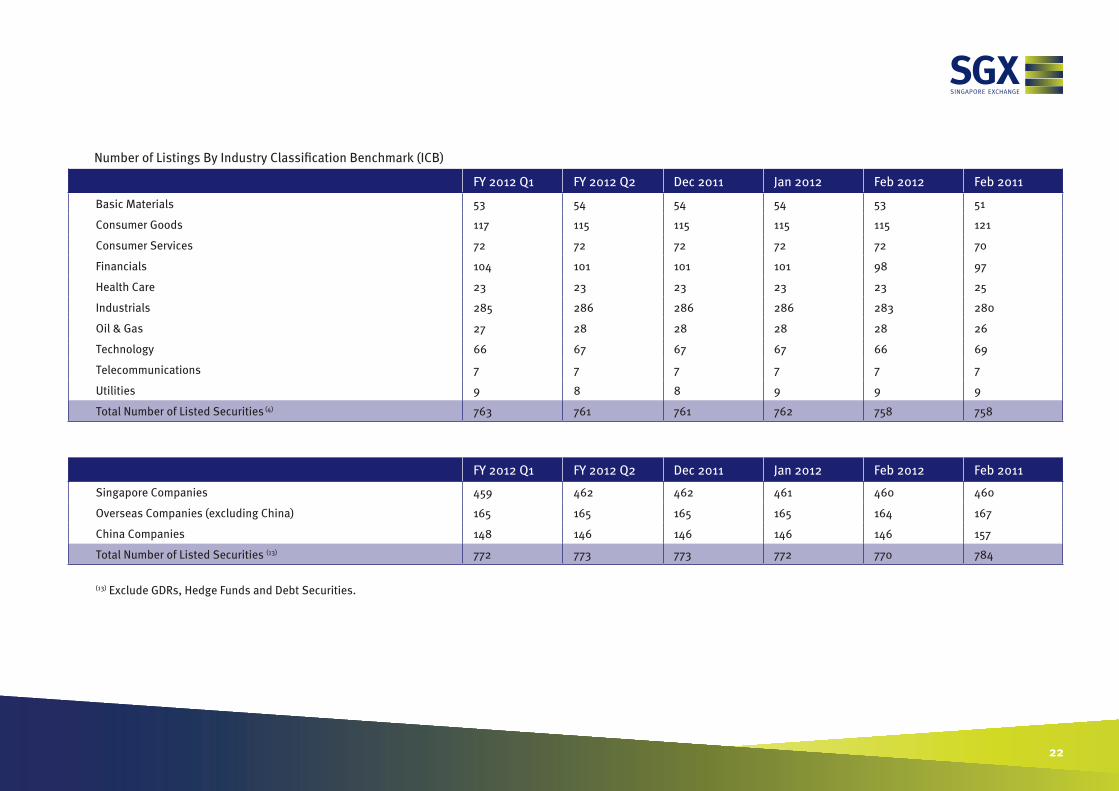
Number of Listings By Industry Classification Benchmark (ICB)
FY 2012 Q1 FY 2012 Q2 Dec 2011 Jan 2012 Feb 2012 Feb 2011
Basic Materials 53 54 54 54 53 51
Consumer Goods 117 115 115 115 115 121
Consumer Services 72 72 72 72 72 70
Financials 104 101 101 101 98 97
Health Care 23 23 23 23 23 25
Industrials 285 286 286 286 283 280
Oil & Gas 27 28 28 28 28 26
Technology 66 67 67 67 66 69
Telecommunications 7 7 7 7 7 7
Utilities 9 8 8 9 9 9
Total Number of Listed Securities (4) 763 761 761 762 758 758
FY 2012 Q1 FY 2012 Q2 Dec 2011 Jan 2012 Feb 2012 Feb 2011
Singapore Companies 459 462 462 461 460 460
Overseas Companies (excluding China) 165 165 165 165 164 167
China Companies 148 146 146 146 146 157
Total Number of Listed Securities (13) 772 773 773 772 770 784
(13) Exclude GDRs, Hedge Funds and Debt Securities.
22

FY 2012 Q1 FY 2012 Q2 Dec 2011 Jan 2012 Feb 2012 Feb 2011
Exchange Traded Funds 84 90 90 90 92 80
Structured Warrants 286 246 246 219 254 306
Company Warrants 66 62 62 62 59 79
Bonds/Notes 1,148 1,134 1,134 1,149 1,164 1,088
Funds Raised Through IPOs ($million) FY 2012 Q1 FY 2012 Q2 Dec 2011 Jan 2012 Feb 2012 FYTD 2012 CYTD 2012
SGX Mainboard 116 172 0 0 0 288 0
SGX Catalist 36 42 6 0 0 78 0
Funds Raised Through New Bonds ($million) FY 2012 Q1 FY 2012 Q2 Dec 2011 Jan 2012 Feb 2012 FYTD 2012 CYTD 2012
Bonds Listings 25,195 18,982 8,270 13,522 16,450 74,149 29,972
23

Month End Market Capitalisation (S$million) FY 2012 Q1 FY 2012 Q2 Dec 2011 Jan 2012 Feb 2012 Feb 2011 YoY %
Primary Listed
SGX Mainboard 549,938 539,489 539,489 590,001 615,501 621,310 -1%
- Singapore Companies 400,259 396,523 396,523 432,804 453,988 445,212 2%
- Overseas Companies (excluding China) 125,711 120,475 120,475 131,526 133,557 130,966 2%
- China Companies 23,967 22,491 22,491 25,671 27,956 45,131 -38%
SGX Catalist 4,829 5,347 5,347 5,663 6,018 6,735 -11%
- Singapore Companies 3,167 3,210 3,210 3,441 3,544 4,083 -13%
- Overseas Companies (excluding China) 1,003 1,418 1,418 1,490 1,654 1,923 -14%
- China Companies 659 719 719 732 820 729 12%
Total Market Capitalisation For Primary Listed Securities 554,767 544,836 544,836 595,665 621,519 628,045 -1%
Secondary Listed
SGX Mainboard 219,618 230,944 230,944 240,431 238,944 231,007 3%
- Singapore Companies 54 51 51 56 39 62 -36%
- Overseas Companies (excluding China) 215,808 228,061 228,061 237,577 236,110 226,471 4%
- China Companies 3,755 2,833 2,833 2,798 2,795 4,474 -38%
SGX Catalist 0 0 0 0 0 0 N.A.
- Singapore Companies 0 0 0 0 0 0 N.A.
- Overseas Companies (excluding China) 0 0 0 0 0 0 N.A.
- China Companies 0 0 0 0 0 0 N.A.
Total Market Capitalisation For Secondary Listed Securities 219,618 230,944 230,944 240,431 238,944 231,007 3%
Total Market Capitalisation (14) 774,385 775,780 775,780 836,096 860,463 859,052 0%
(14) Total Market Capitalisation of Listed Securities.
(#) Numbers have been restated.
24

Month-end Market Capitalisation ($million) by Industry Classification Benchmark (ICB) FY 2012 Q1 FY 2012 Q2 Dec 2011 Jan 2012 Feb 2012 Feb 2011 YoY %
Basic Materials 7,551 7,534 7,534 8,490 9,044 11,533 -22%
Consumer Goods 84,583 80,528 80,528 87,743 88,489 91,019 -3%
Consumer Services 80,347 80,803 80,803 86,421 86,702 88,650 -2%
Financials 189,362 182,035 182,035 202,063 215,741 219,243 -2%
Health Care 6,369 6,773 6,773 7,332 7,335 6,809 8%
Industrials 78,372 75,553 75,553 84,979 90,245 93,124 -3%
Oil & Gas 31,922 37,301 37,301 44,750 47,708 44,395 7%
Technology 5,992 5,793 5,793 6,335 6,833 7,987 -14%
Telecommunications 66,358 65,071 65,071 63,766 65,381 59,292 10%
Utilities 2,718 2,274 2,274 2,595 2,735 3,352 -18%
Total Market Capitalisation (4) 553,576 543,664 543,664 594,473 620,215 625,404 -1%
25
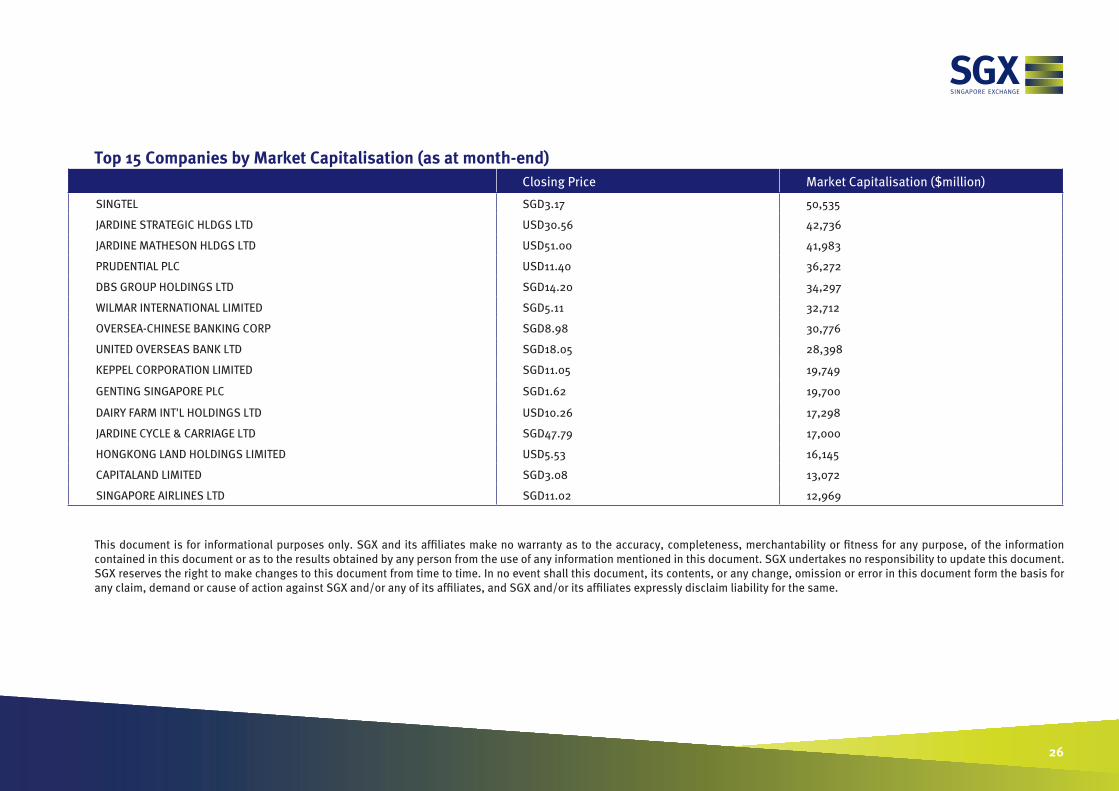
Top 15 Companies by Market Capitalisation (as at month-end) Closing Price Market Capitalisation ($million)
SINGTEL SGD3.17 50,535
JARDINE STRATEGIC HLDGS LTD USD30.56 42,736
JARDINE MATHESON HLDGS LTD USD51.00 41,983
PRUDENTIAL PLC USD11.40 36,272
DBS GROUP HOLDINGS LTD SGD14.20 34,297
WILMAR INTERNATIONAL LIMITED SGD5.11 32,712
OVERSEA-CHINESE BANKING CORP SGD8.98 30,776
UNITED OVERSEAS BANK LTD SGD18.05 28,398
KEPPEL CORPORATION LIMITED SGD11.05 19,749
GENTING SINGAPORE PLC SGD1.62 19,700
DAIRY FARM INT'L HOLDINGS LTD USD10.26 17,298
JARDINE CYCLE & CARRIAGE LTD SGD47.79 17,000
HONGKONG LAND HOLDINGS LIMITED USD5.53 16,145
CAPITALAND LIMITED SGD3.08 13,072
SINGAPORE AIRLINES LTD SGD11.02 12,969
This document is for informational purposes only. SGX and its affiliates make no warranty as to the accuracy, completeness, merchantability or fitness for any purpose, of the information contained in this document or as to the results obtained by any person from the use of any information mentioned in this document. SGX undertakes no responsibility to update this document. SGX reserves the right to make changes to this document from time to time. In no event shall this document, its contents, or any change, omission or error in this document form the basis for any claim, demand or cause of action against SGX and/or any of its affiliates, and SGX and/or its affiliates expressly disclaim liability for the same.
26