statistical process control douglas m. stewart, ph.d. the anderson schools of management the...
Post on 21-Dec-2015
223 views
TRANSCRIPT
Statistical Process Control
Douglas M. Stewart, Ph.D.
The Anderson Schools of Management
The University of New Mexico
Quality Control (QC)
Control – the activity of ensuring conformance to requirements and taking corrective action when necessary to correct problems
ImportanceDaily management of processesPrerequisite to longer-term improvements
Designing the QC System
Quality Policy and Quality ManualContract management, design control and
purchasingProcess control, inspection and testingCorrective action and continual improvementControlling inspection, measuring and test
equipment (metrology, measurement system analysis and calibration)
Records, documentation and audits
Example of QC: HACCP System1. Hazard analysis2. Critical control points3. Preventive measures with critical limits for
each control point4. Procedures to monitor the critical control
points5. Corrective actions when critical limits are
not met6. Verification procedures7. Effective record keeping and documentation
5
Inspection/Testing Points
Receiving inspectionIn-process inspectionFinal inspection
6
Receiving Inspection
Spot check procedures100 percent inspectionAcceptance sampling
7
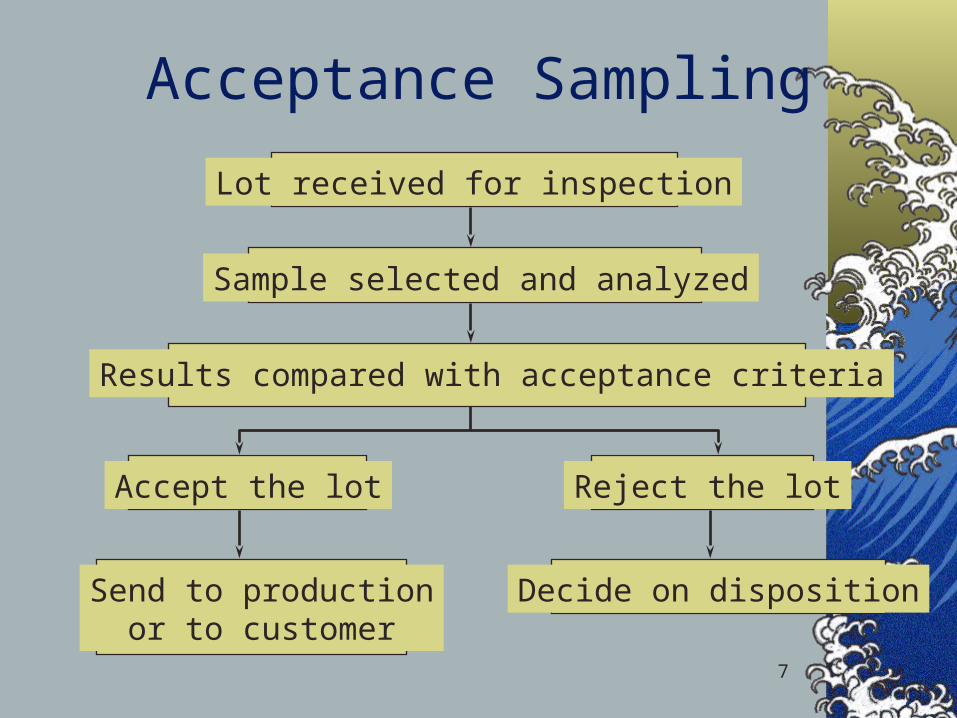
Acceptance Sampling
Lot received for inspection
Sample selected and analyzed
Results compared with acceptance criteria
Accept the lot
Send to production or to customer
Reject the lot
Decide on disposition
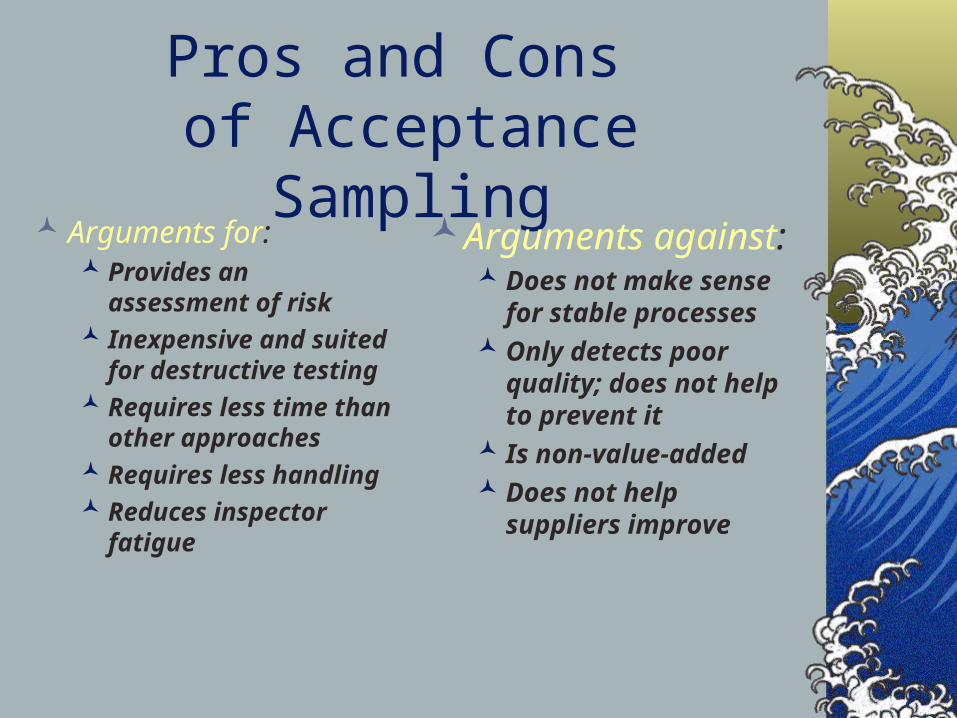
Pros and Cons of Acceptance Sampling
Arguments for: Provides an assessment
of risk Inexpensive and suited
for destructive testing Requires less time than
other approaches Requires less handling Reduces inspector
fatigue
Arguments against: Does not make sense for
stable processes Only detects poor quality;
does not help to prevent it Is non-value-added Does not help suppliers
improve
9
In-Process Inspection
What to inspect?Key quality characteristics that are related
to cost or quality (customer requirements)Where to inspect?
Key processes, especially high-cost and value-added
How much to inspect?All, nothing, or a sample
10
Economic Model
C1 = cost of inspection and removal of nonconforming itemC2 = cost of repair p = true fraction nonconforming
Breakeven Analysis: p*C2 = C1
If p > C1 / C2 , use 100% inspection
If p < C1 / C2 , do nothing
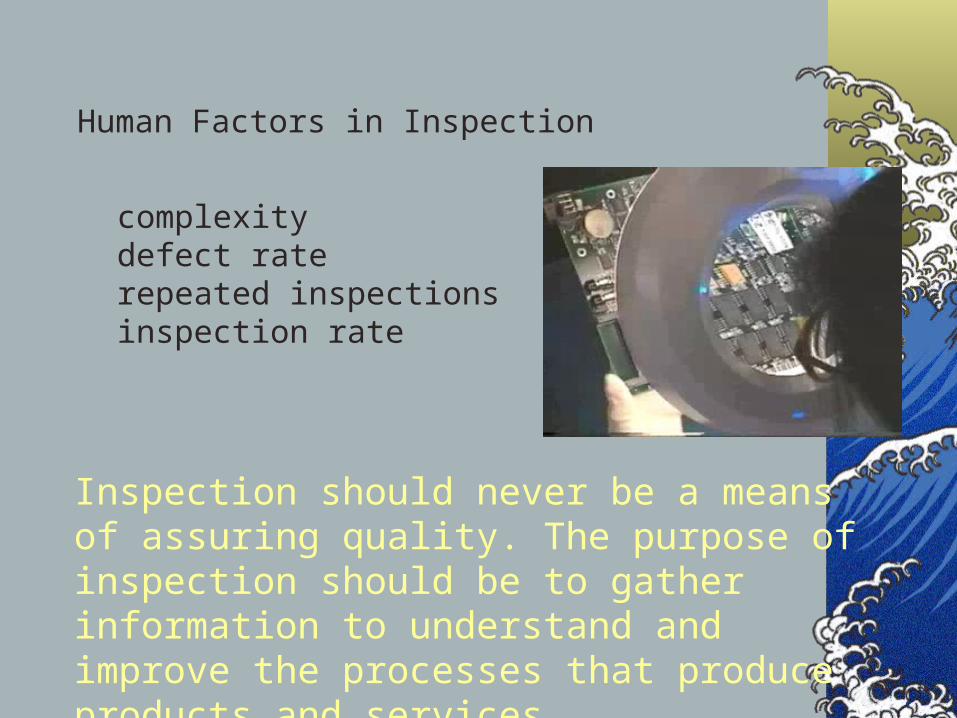
Human Factors in Inspection
complexitydefect raterepeated inspectionsinspection rate
Inspection should never be a means of assuring quality. The purpose of inspection should be to gather information to understand and improve the processes that produce products and services.
12
Gauges and Measuring Instruments
Variable gaugesFixed gaugesCoordinate measuring machineVision systems
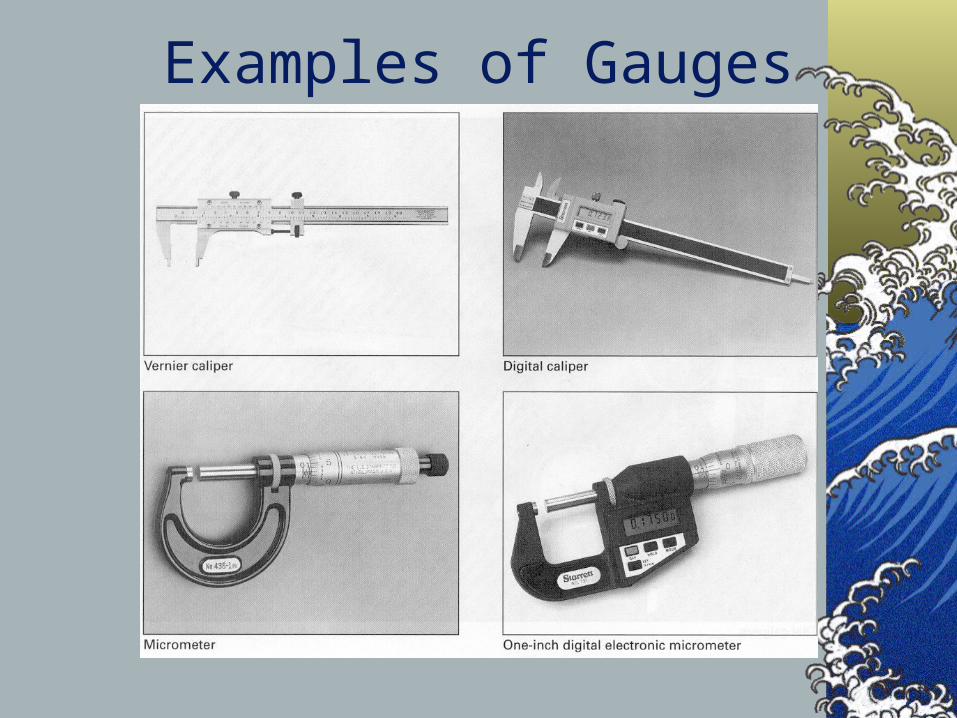
Examples of Gauges
Metrology - Science of Measurement
Accuracy - closeness of agreement between an observed value and a standardPrecision - closeness of agreement between randomly selected individual measurements
Repeatability and Reproducibility
Repeatability (equipment variation) – variation in multiple measurements by an individual using the same instrument.
Reproducibility (operator variation) - variation in the same measuring instrument used by different individuals
Repeatability and Reproducibility Studies
Quantify and evaluate the capability of a measurement systemSelect m operators and n partsCalibrate the measuring instrumentRandomly measure each part by each
operator for r trialsCompute key statistics to quantify
repeatability and reproducibility
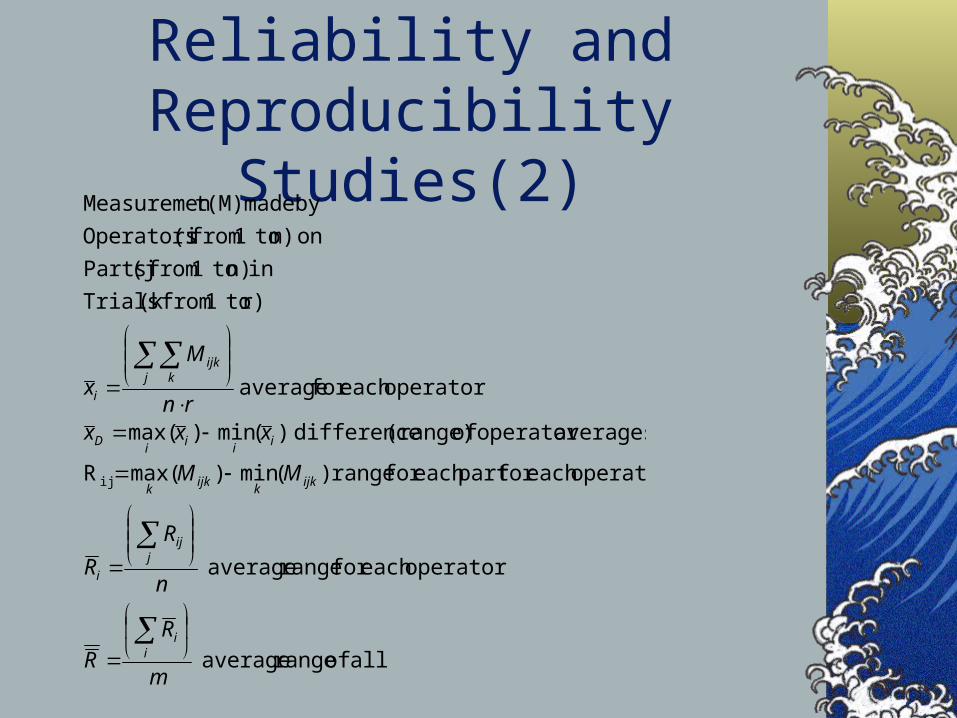
Reliability and Reproducibility Studies(2)
all of range average
operatoreach for range average
operatoreach for part each for range )(min)(maxR
averagesoperator of (range) difference )(min)(max
operatoreach for average
r) to1 from(k Trials
in n) to1 from (j Parts
on m) to1 from (i Operators
by made (M)t Measuremen
ij
m
R
R
n
R
R
MM
xxxrn
M
x
ii
jij
i
ijkk
ijkk
ii
ii
D
j kijk
i
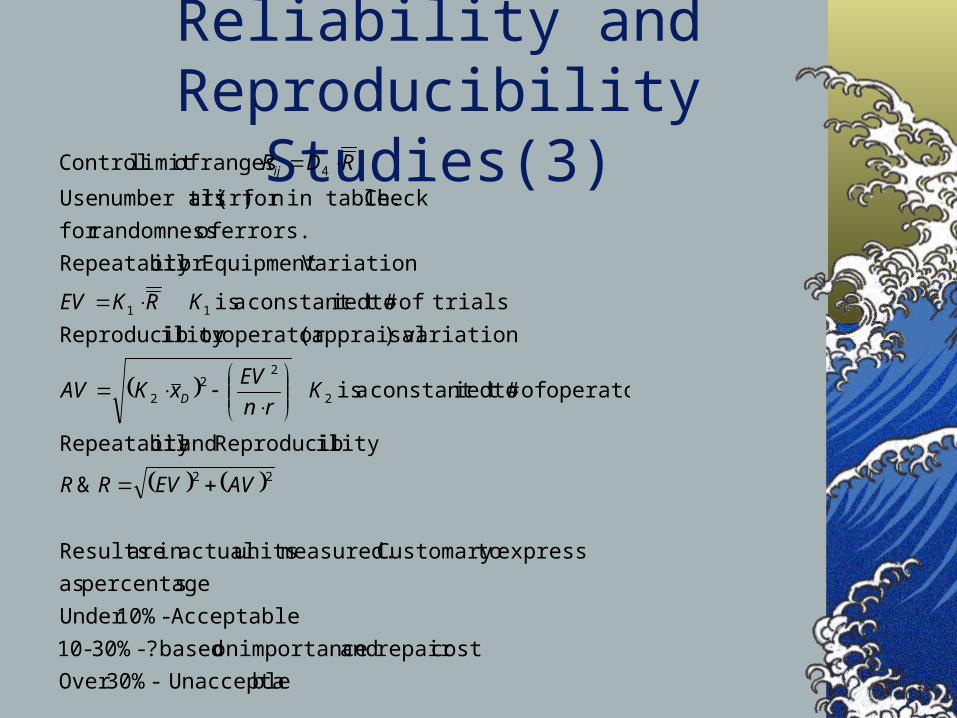
Reliability and Reproducibility Studies(3)
ble Unaccepta- 30%Over
costrepair and importanceon based ? - 30%-10
Acceptable - 10%Under
s.percentage as
express toCustomary measured. units actualin are Results
&
ilityReproducib andity Repeatabil
operators of # toiedconstant t a is
variation)(appraisaloperator or ility Reproducib
trialsof # toiedconstant t a is
VariationEquipment or ity Repeatabil
errors. of randomnessfor
Check in table.n for (r) alsnumber tri Use
ranges oflimit Control
22
2
22
2
11
4
AVEVRR
Krn
EVxKAV
KRKEV
RDR
D
ij
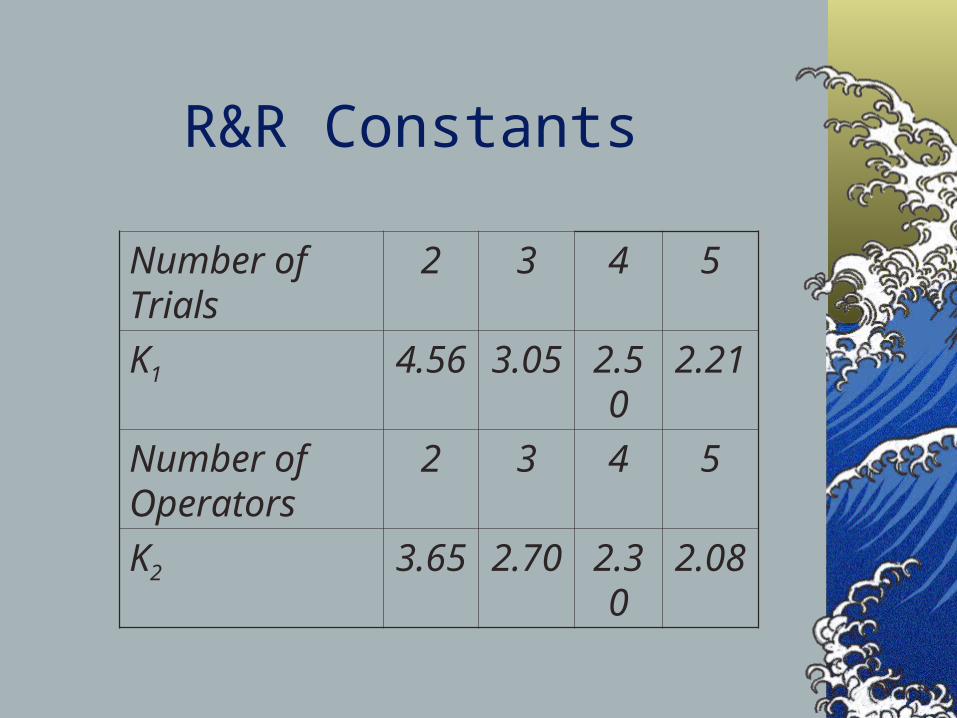
R&R Constants
Number of Trials
2 3 4 5
K1 4.56 3.05 2.50 2.21
Number of Operators
2 3 4 5
K2 3.65 2.70 2.30 2.08
R&R Evaluation
Under 10% error - OK10-30% error - may be OKover 30% error - unacceptable
R&R Example
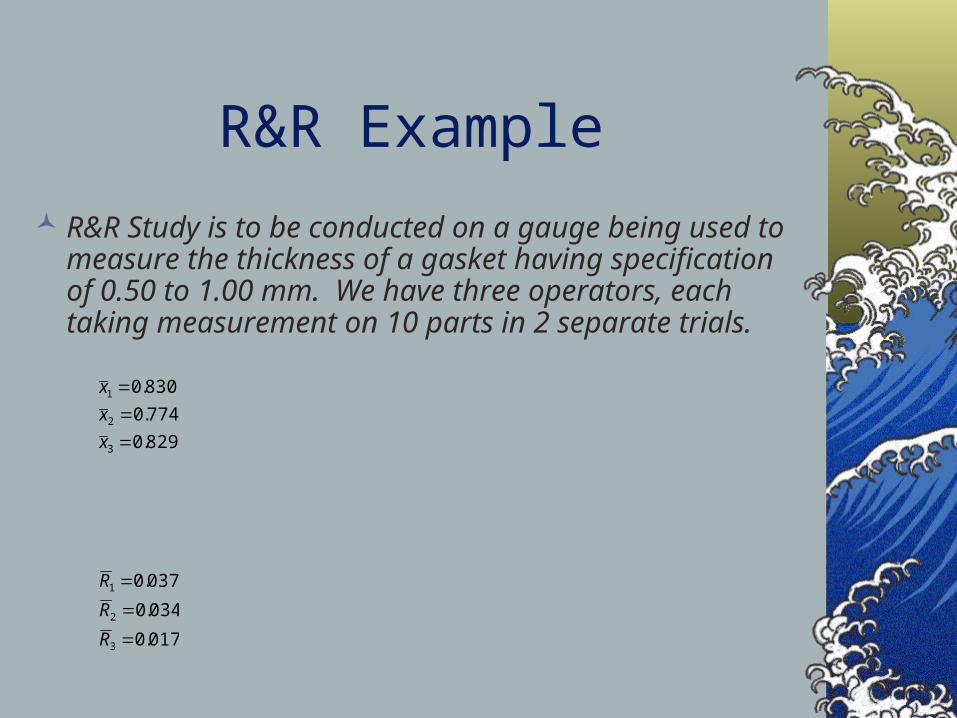
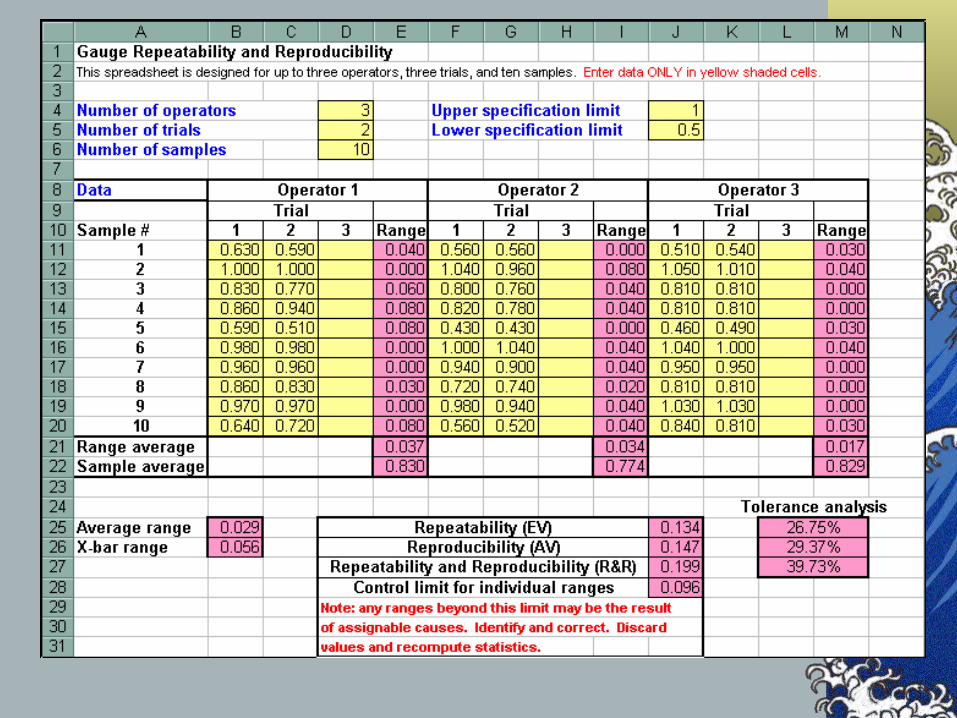
R&R Study is to be conducted on a gauge being used to measure the thickness of a gasket having specification of 0.50 to 1.00 mm. We have three operators, each taking measurement on 10 parts in 2 separate trials.
017.0
034.0
037.0
829.0
774.0
830.0
3
2
1
3
2
1
R
R
R
x
x
x
Calibration
Calibration - comparing a measurement device or system to one having a known relationship to national standards
Traceability to national standards maintained by NIST, National Institute of Standards and Technology
24
Statistical Process Control (SPC)A methodology for monitoring a process
to identify special causes of variation and signal the need to take corrective action when appropriate
SPC relies on control charts
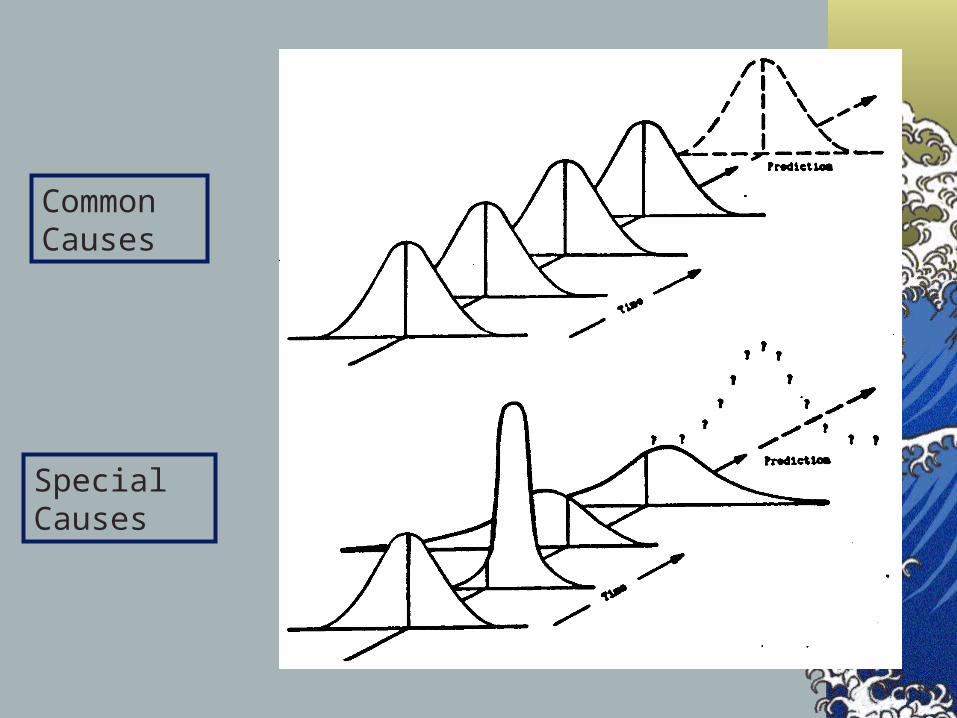
Common Causes
Special Causes
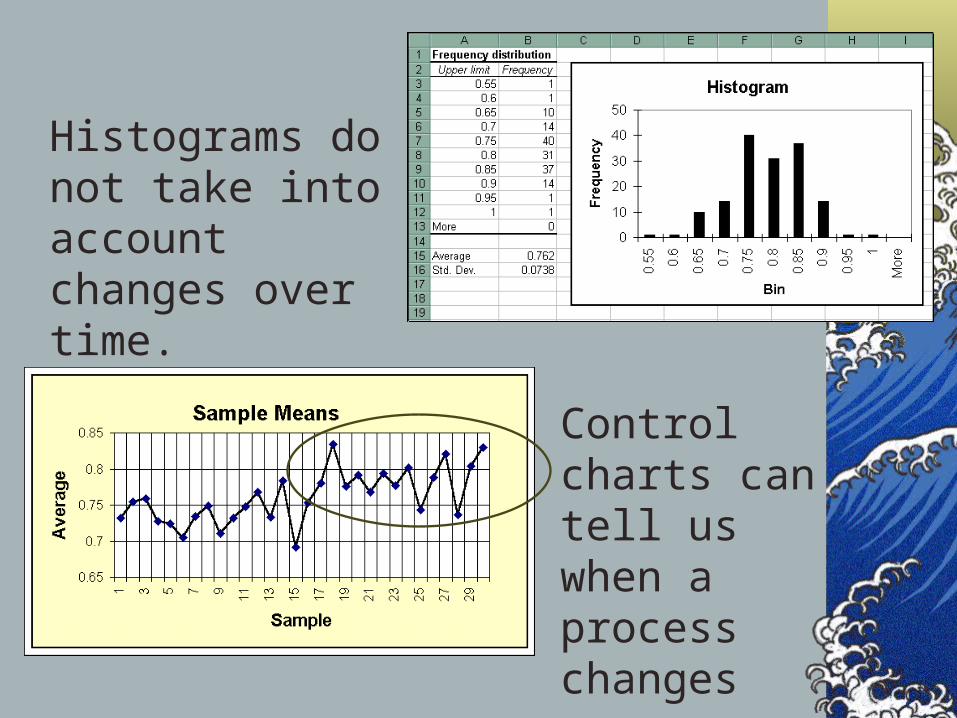
Histograms do not take into account changes over time.
Control charts can tell us when a process changes
27
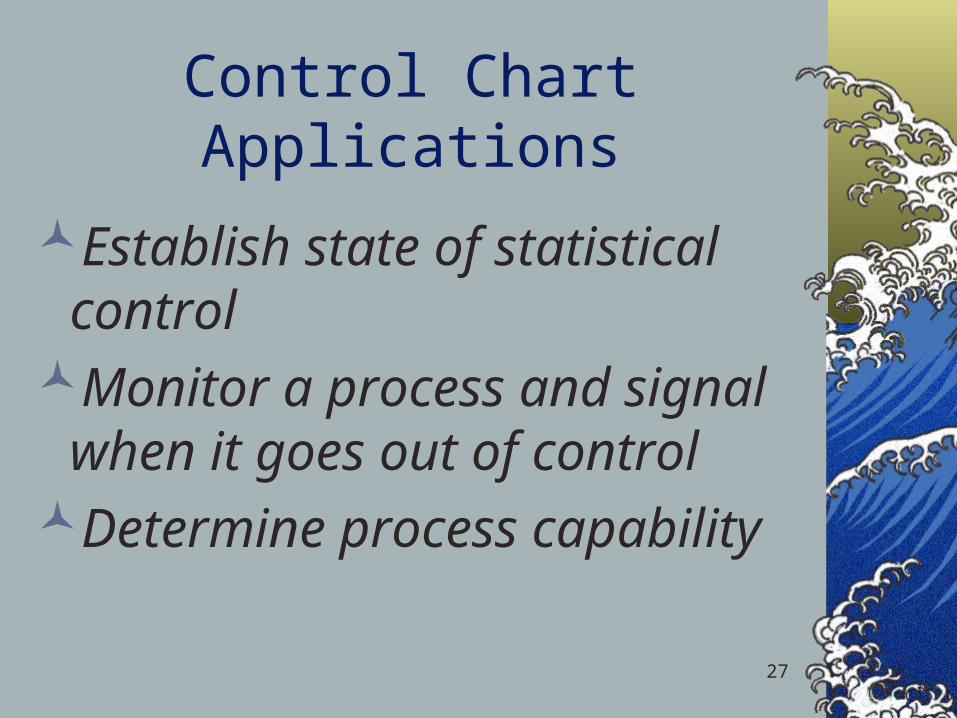
Control Chart Applications
Establish state of statistical control
Monitor a process and signal when it goes out of control
Determine process capability
28
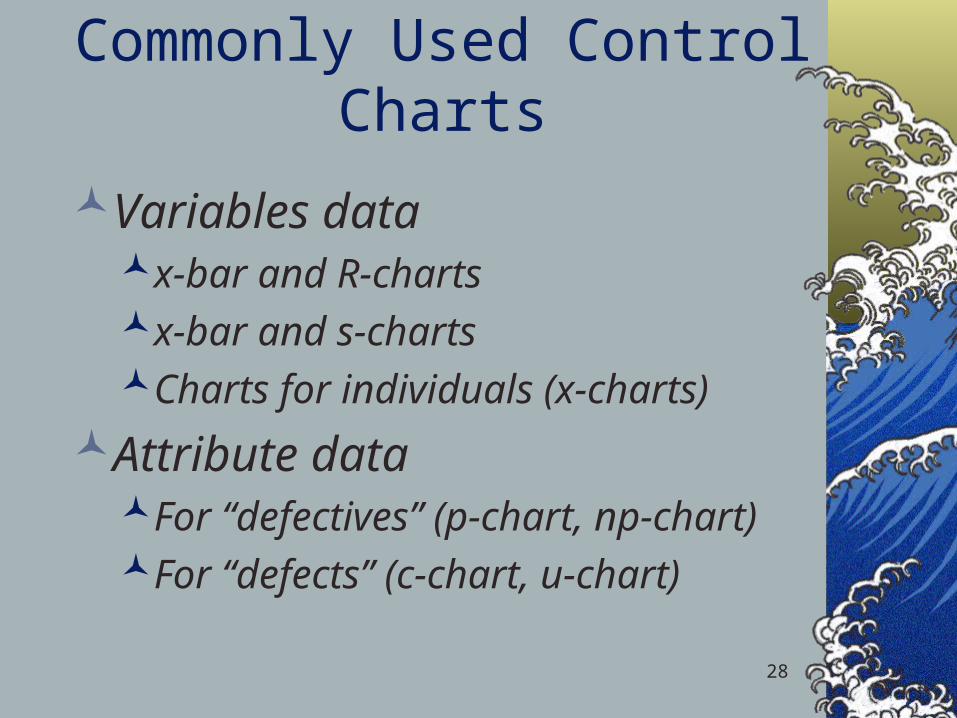
Commonly Used Control Charts
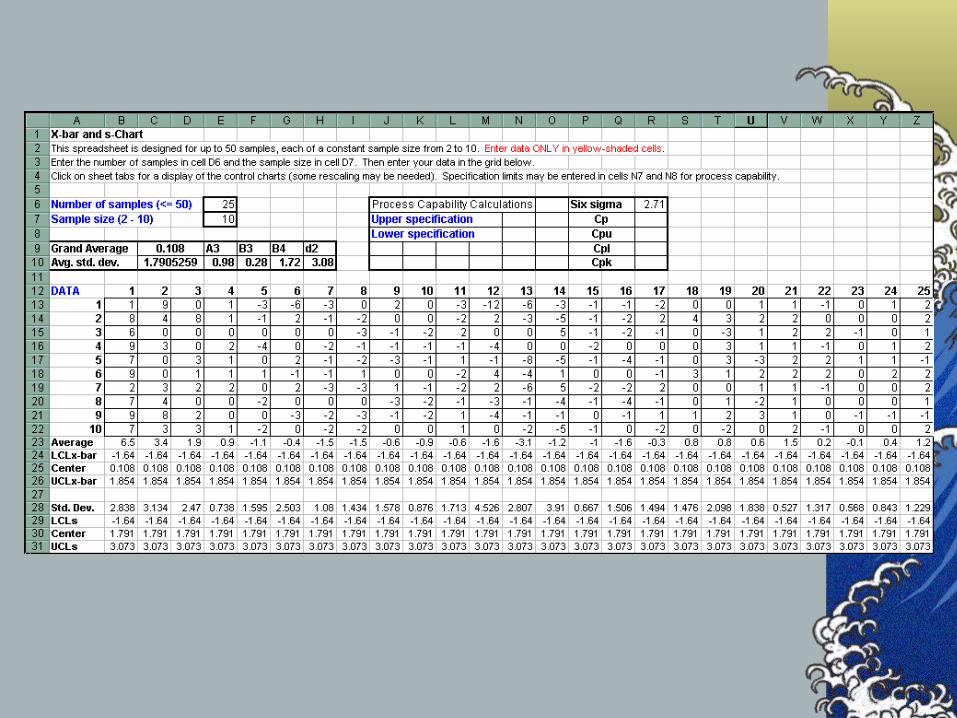
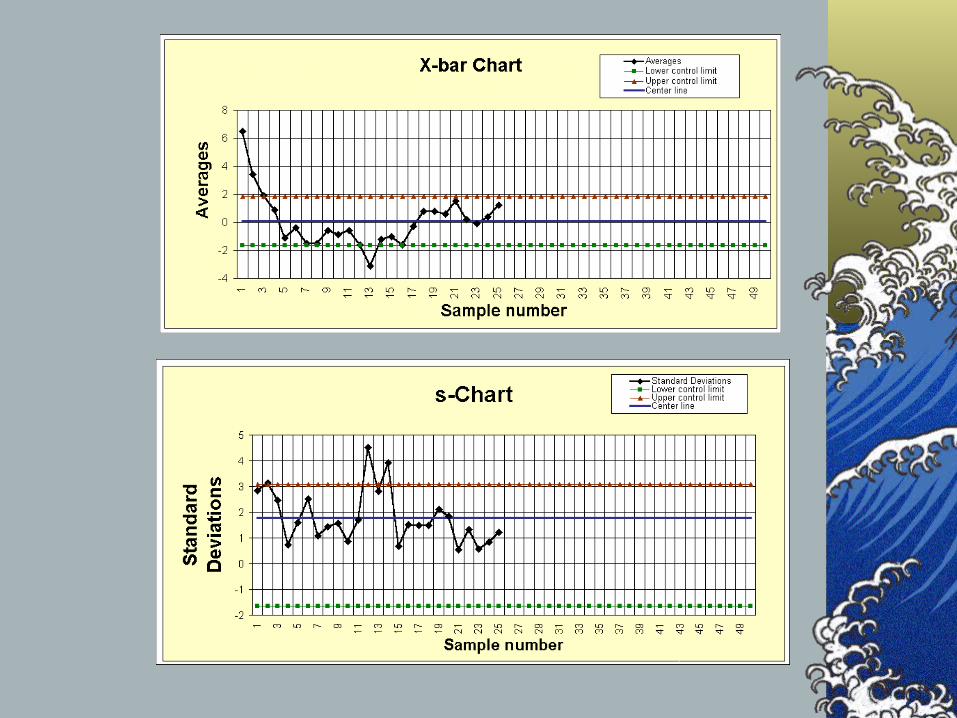
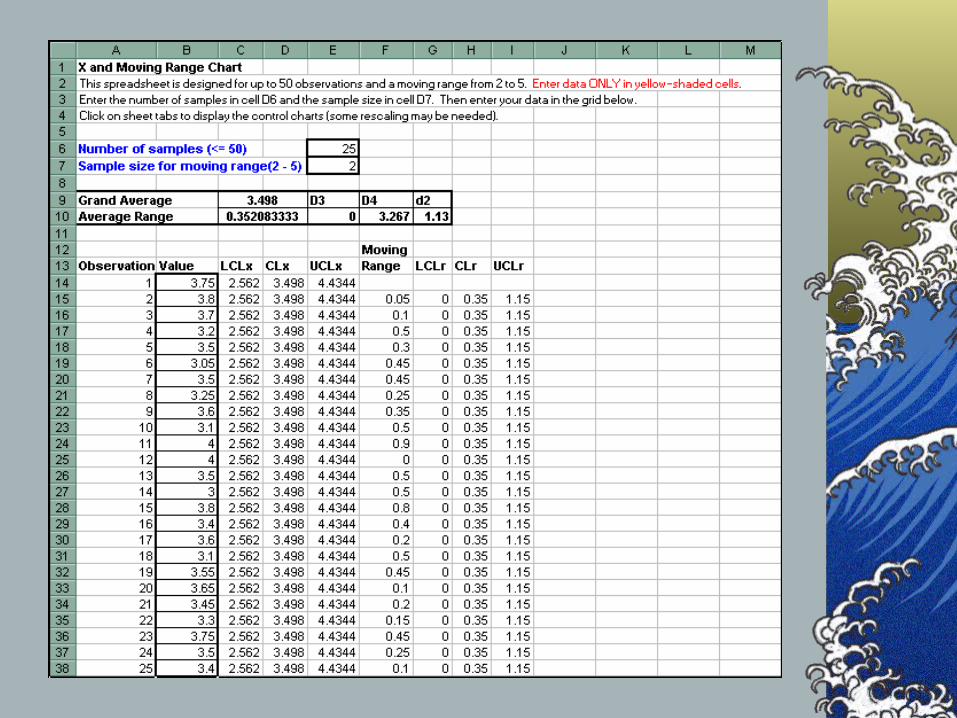
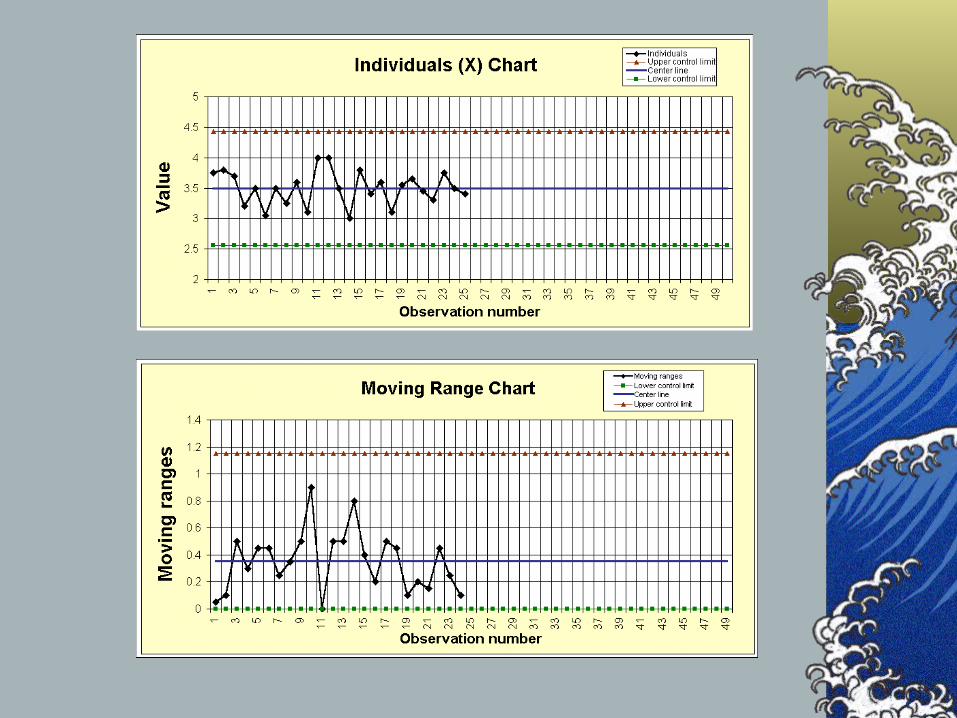
Variables datax-bar and R-chartsx-bar and s-chartsCharts for individuals (x-charts)
Attribute dataFor “defectives” (p-chart, np-chart)For “defects” (c-chart, u-chart)
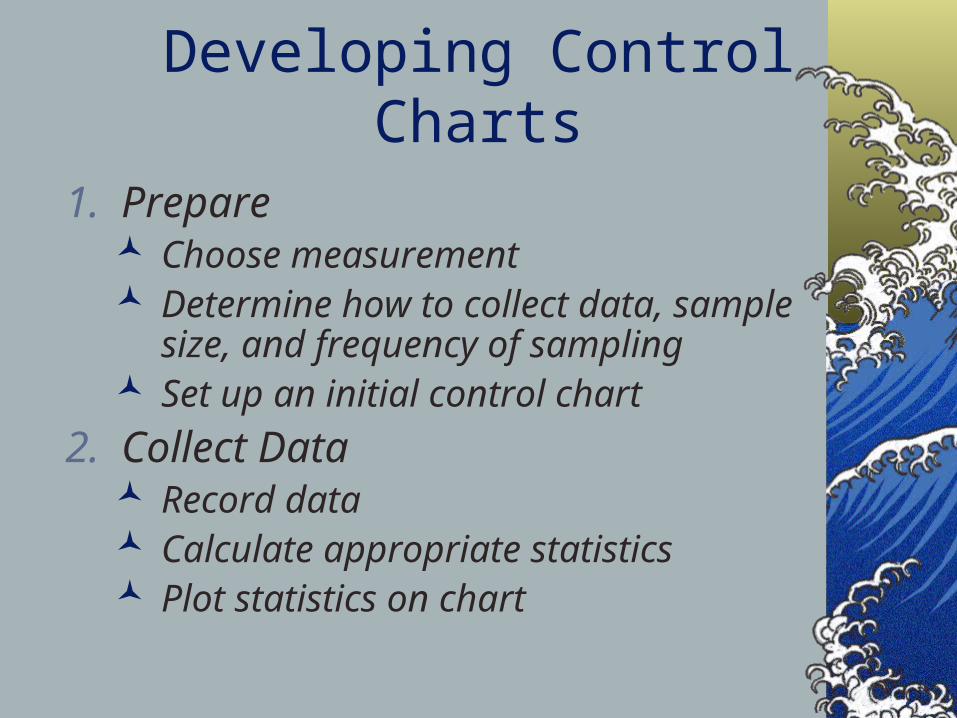
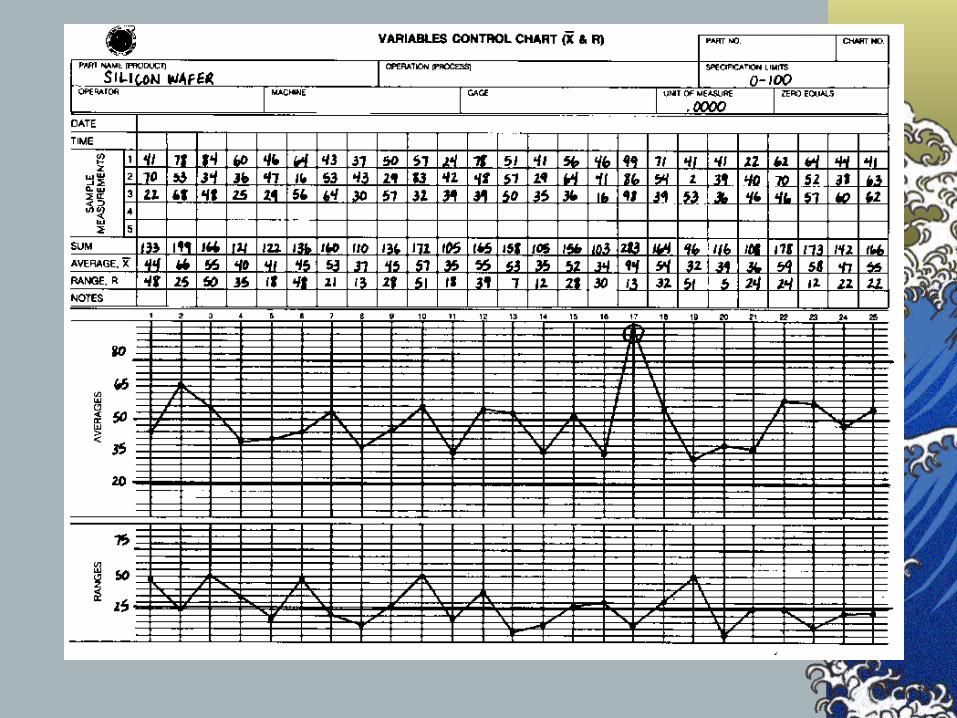
Developing Control Charts
1. Prepare Choose measurement Determine how to collect data, sample size,
and frequency of sampling Set up an initial control chart
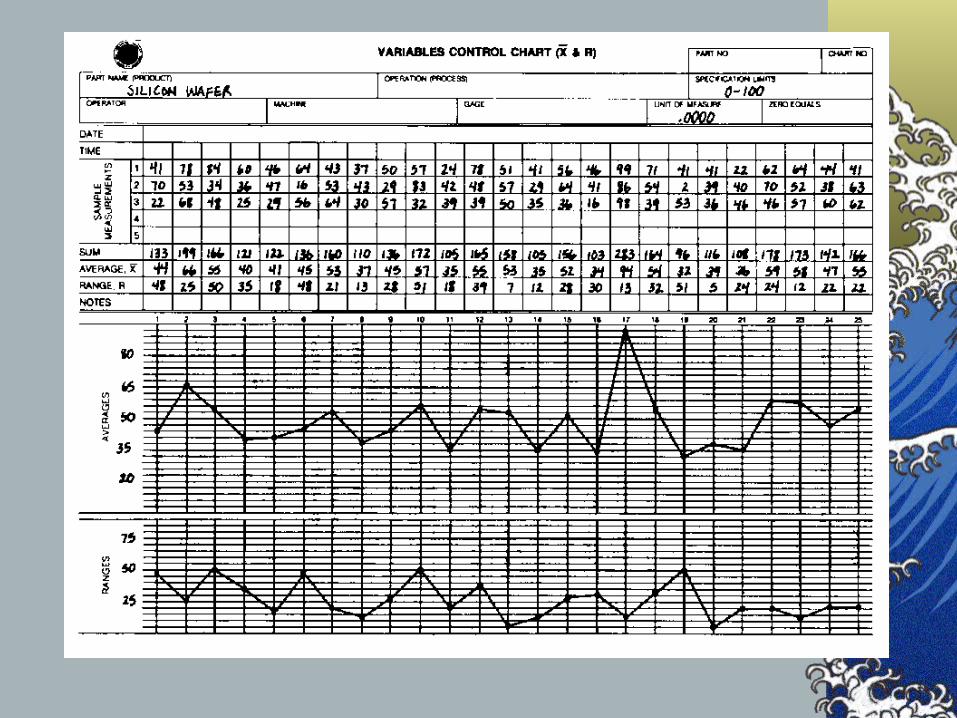
2. Collect Data Record data Calculate appropriate statistics Plot statistics on chart
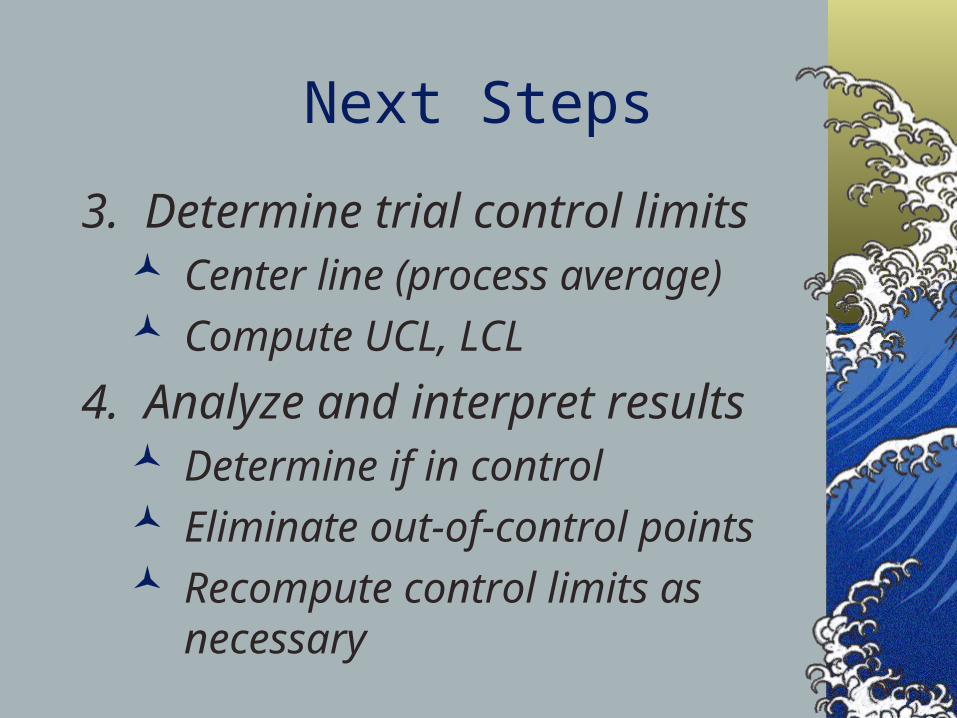
Next Steps
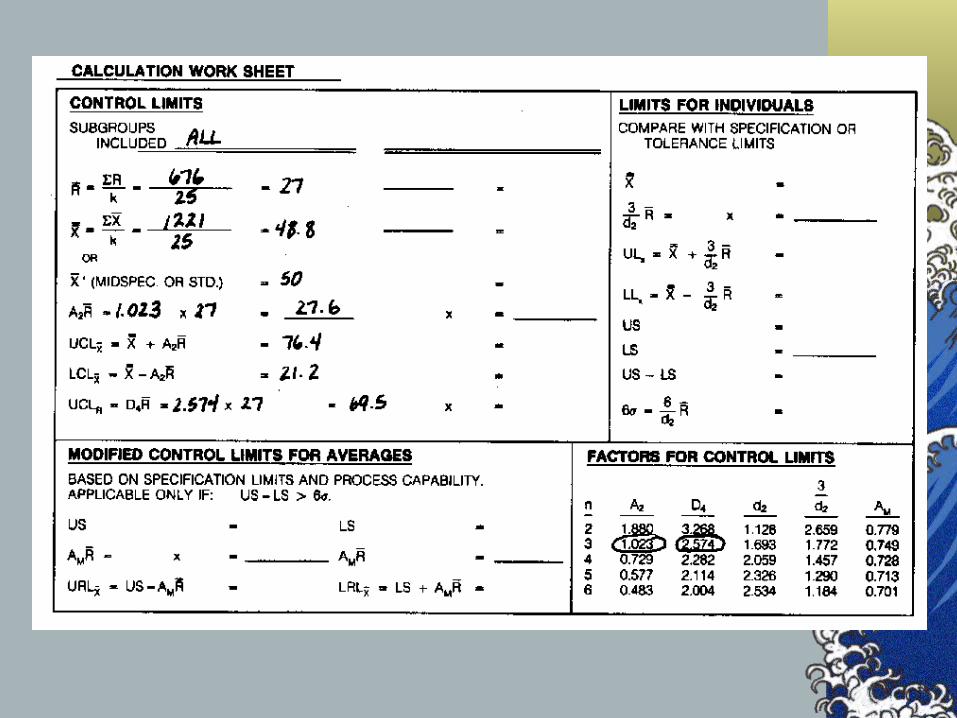
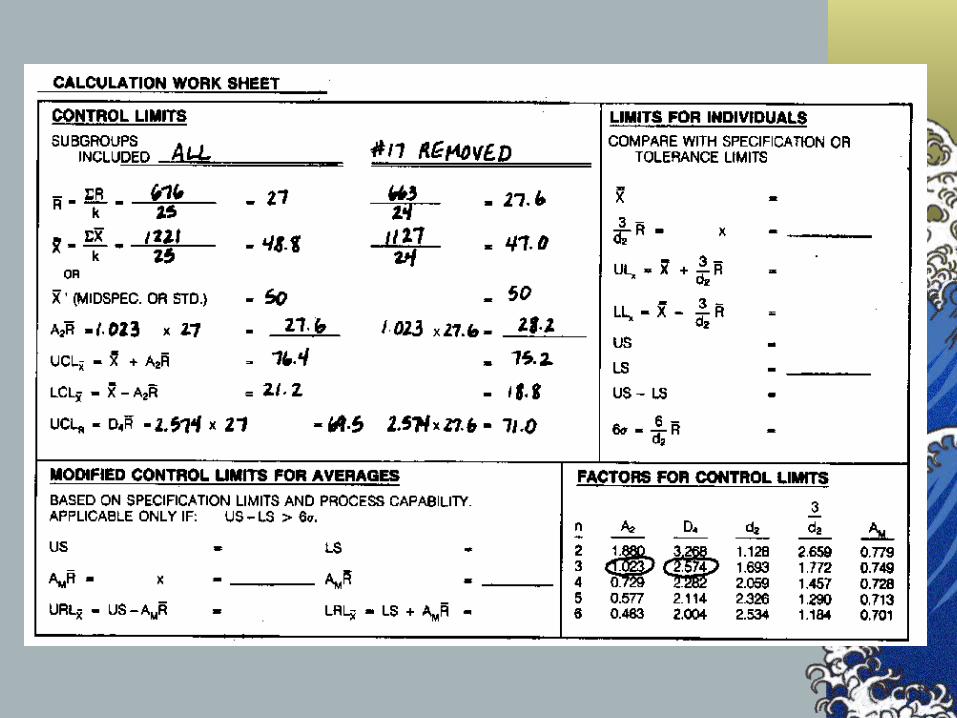
3. Determine trial control limits Center line (process average) Compute UCL, LCL
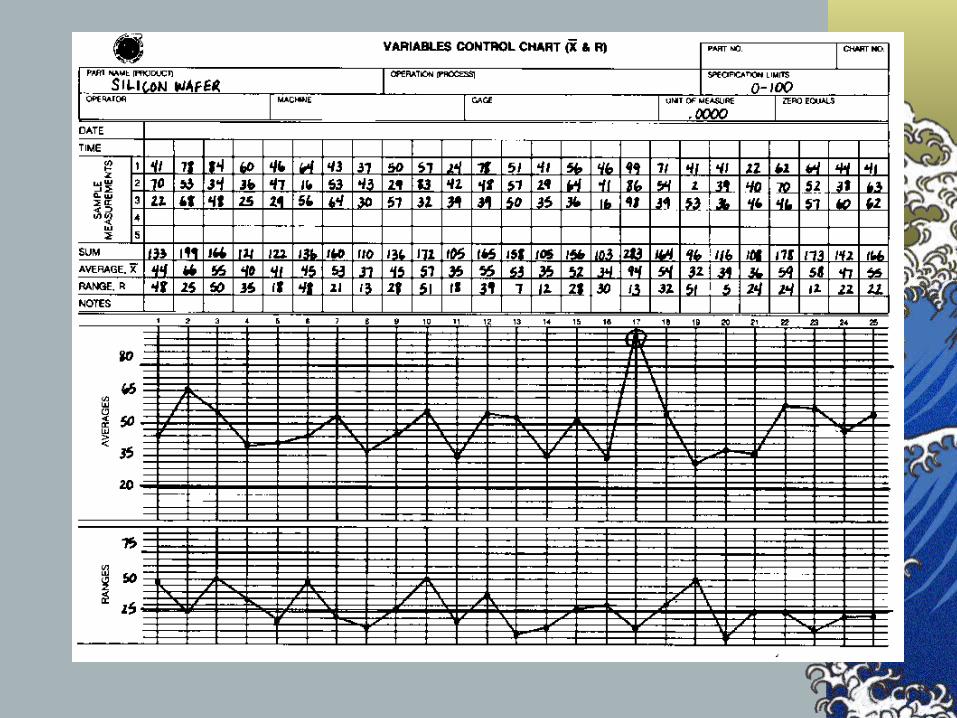
4. Analyze and interpret results Determine if in control Eliminate out-of-control points Recompute control limits as
necessary
36
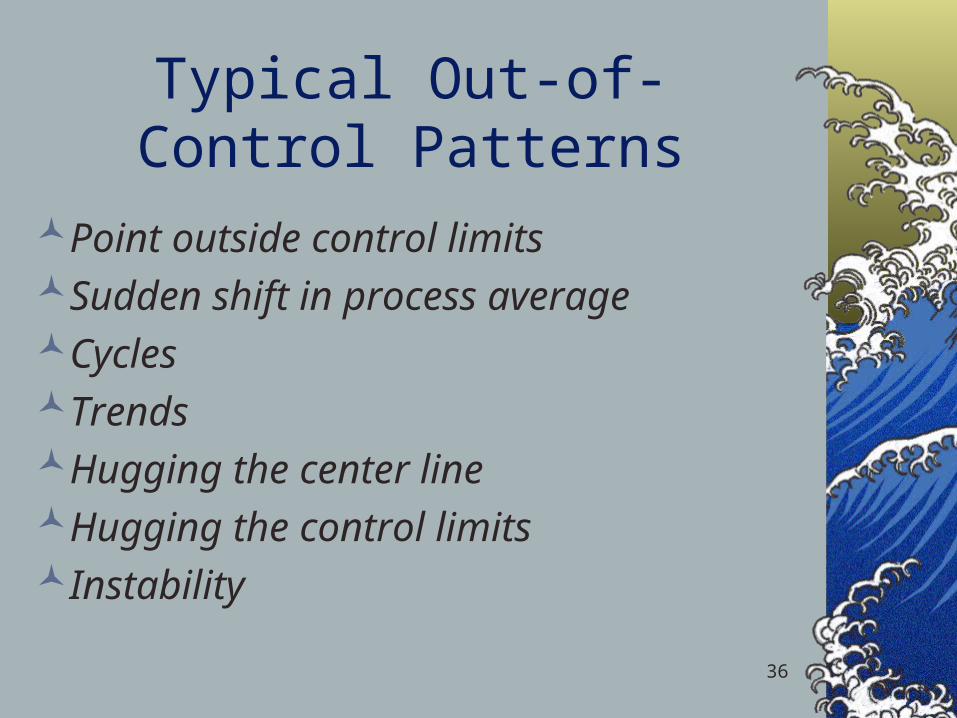
Typical Out-of-Control PatternsPoint outside control limitsSudden shift in process averageCyclesTrendsHugging the center lineHugging the control limitsInstability
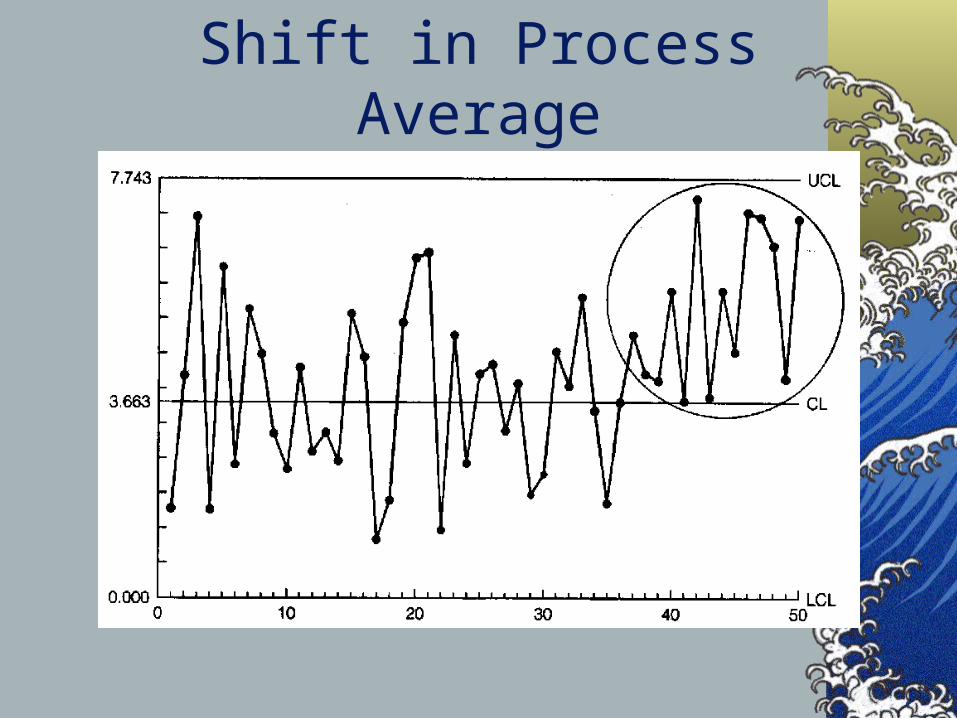
Shift in Process Average
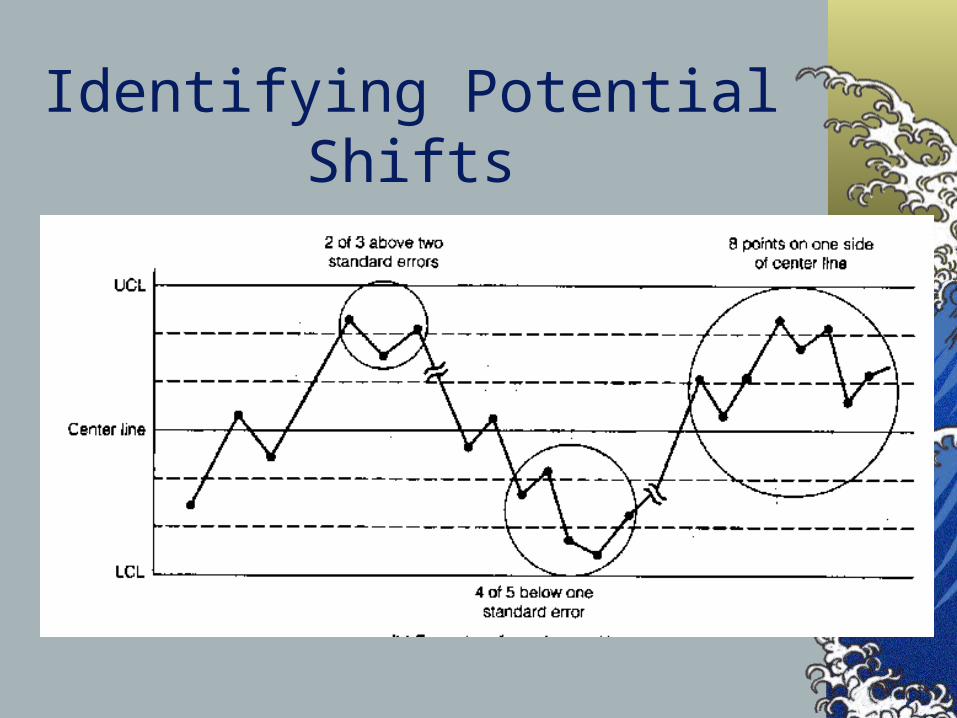
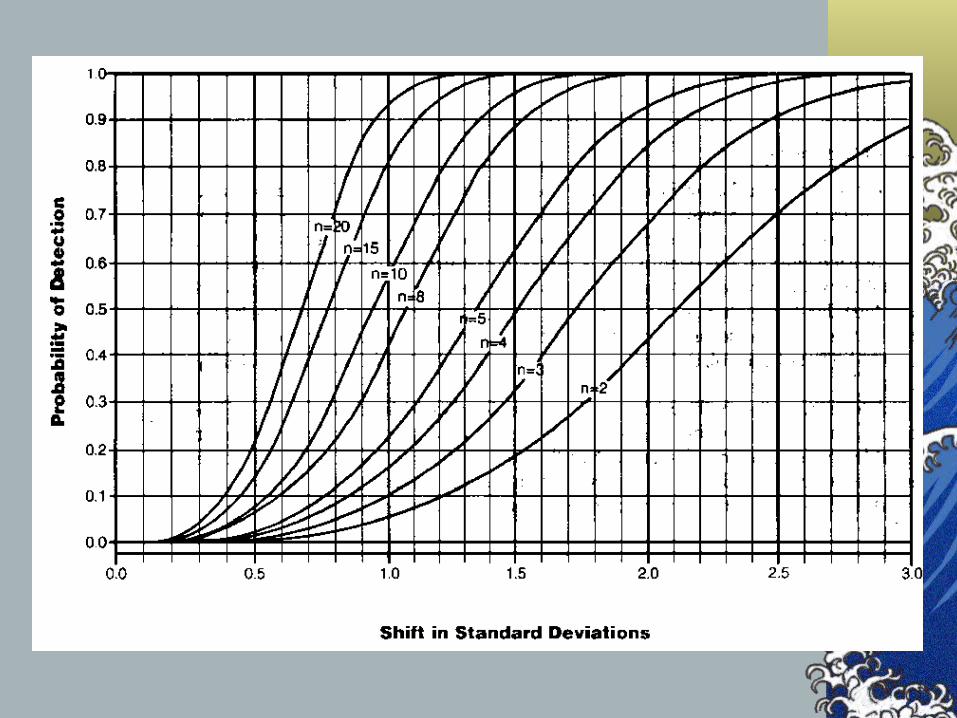
Identifying Potential Shifts
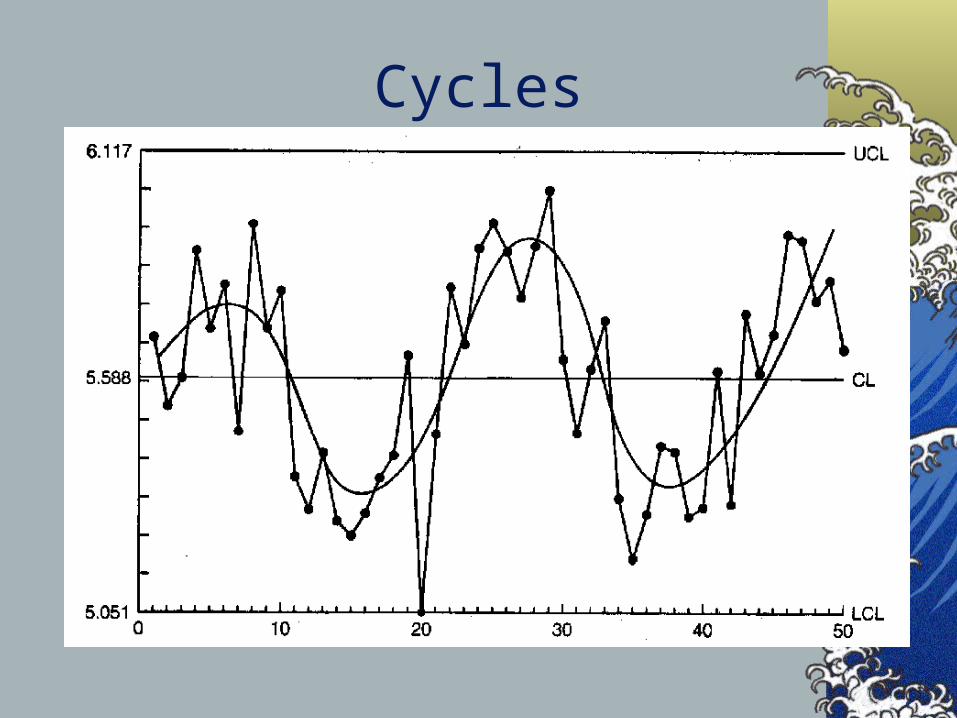
Cycles
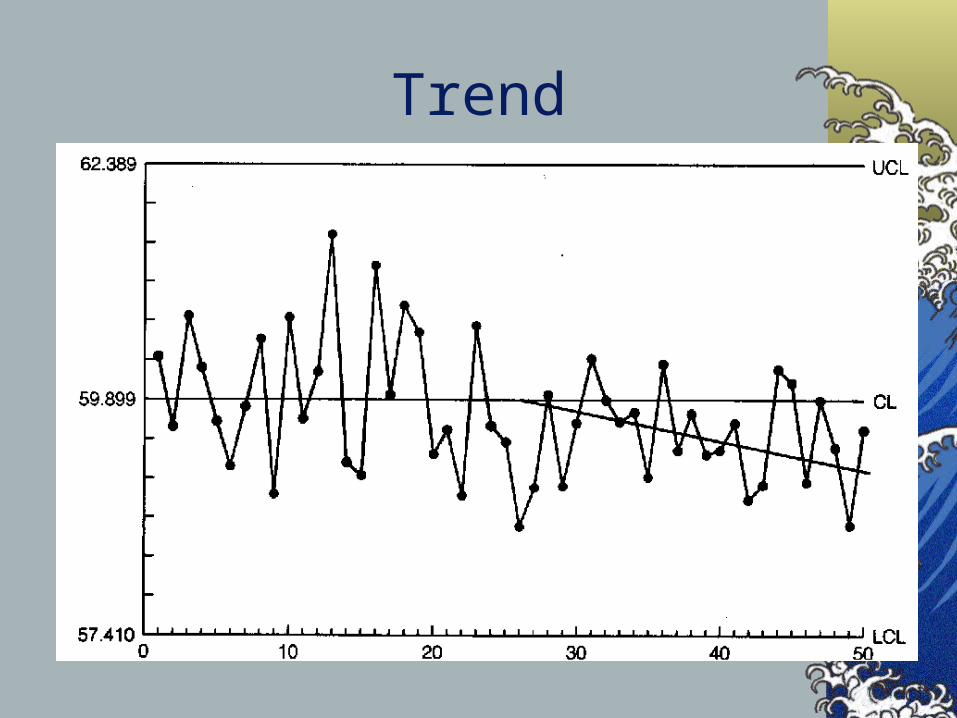
Trend
Final Steps
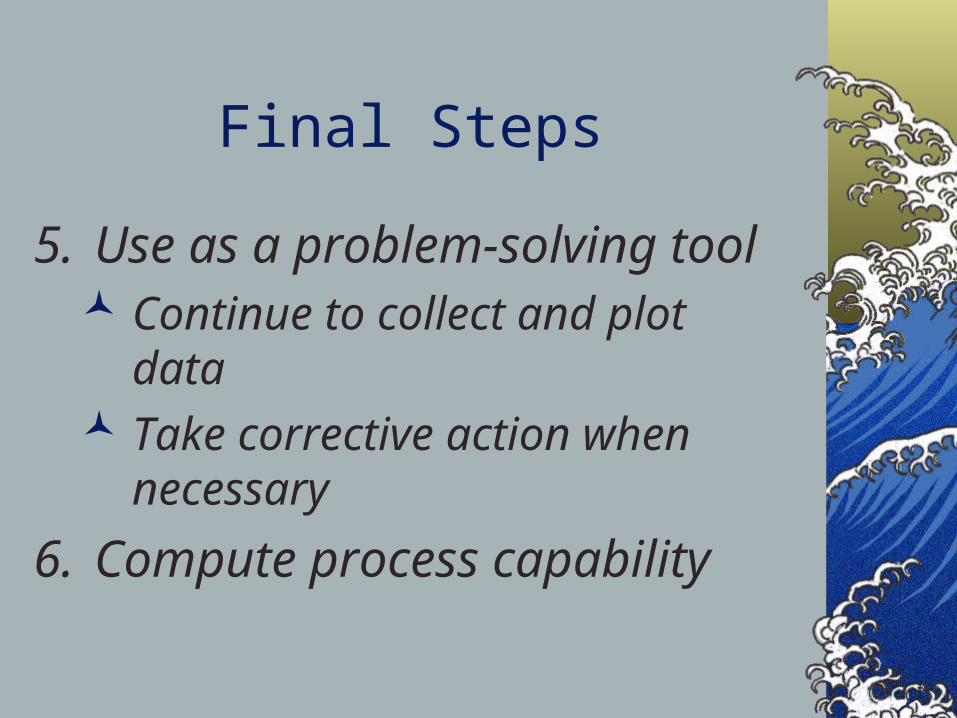
5. Use as a problem-solving tool Continue to collect and plot data Take corrective action when
necessary
6. Compute process capability
Process Capability
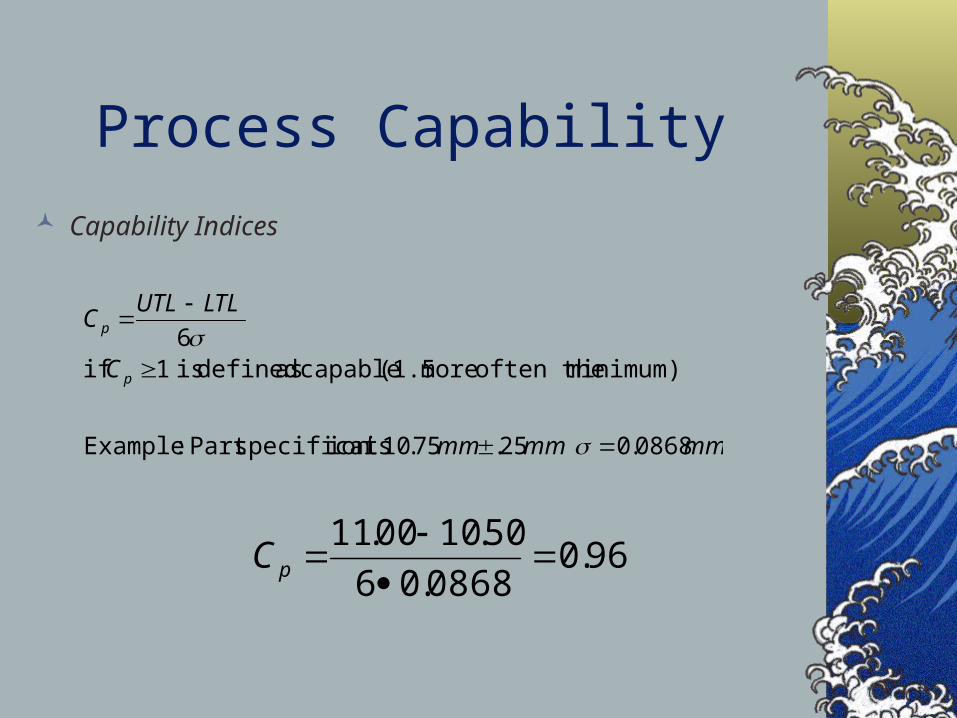
Capability Indices
mmmmmm
C
LTLUTLC
p
p
0868.0 25.75.10 ision specificatPart :Example
minimum) often the more (1.5 capable as defined is 1 if6
96.00868.06
50.1000.11
pC
Target theis T
12
2 T
CC p
pm
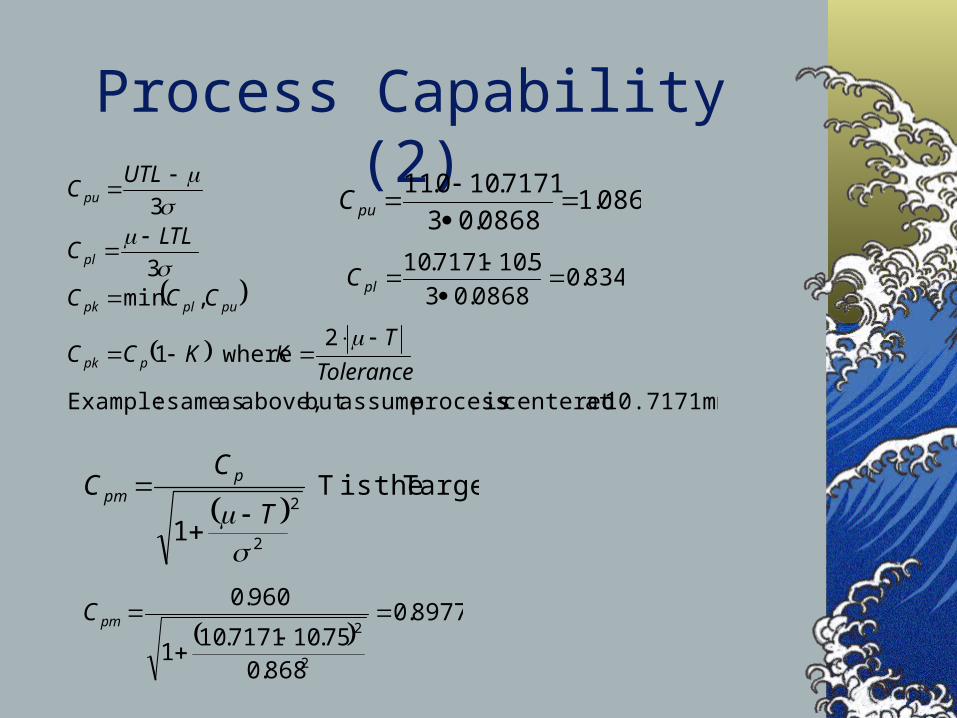
10.7171mmat centered is process assumebut above, as same :Example
2 where1
,min3
3
Tolerance
TKKCC
CCC
LTLC
UTLC
ppk
puplpk
pl
pu
Process Capability (2)086.1
0868.03
7171.100.11
puC
834.00868.03
5.107171.10
plC
8977.0
868.075.107171.10
1
960.0
2
2
pmC
44
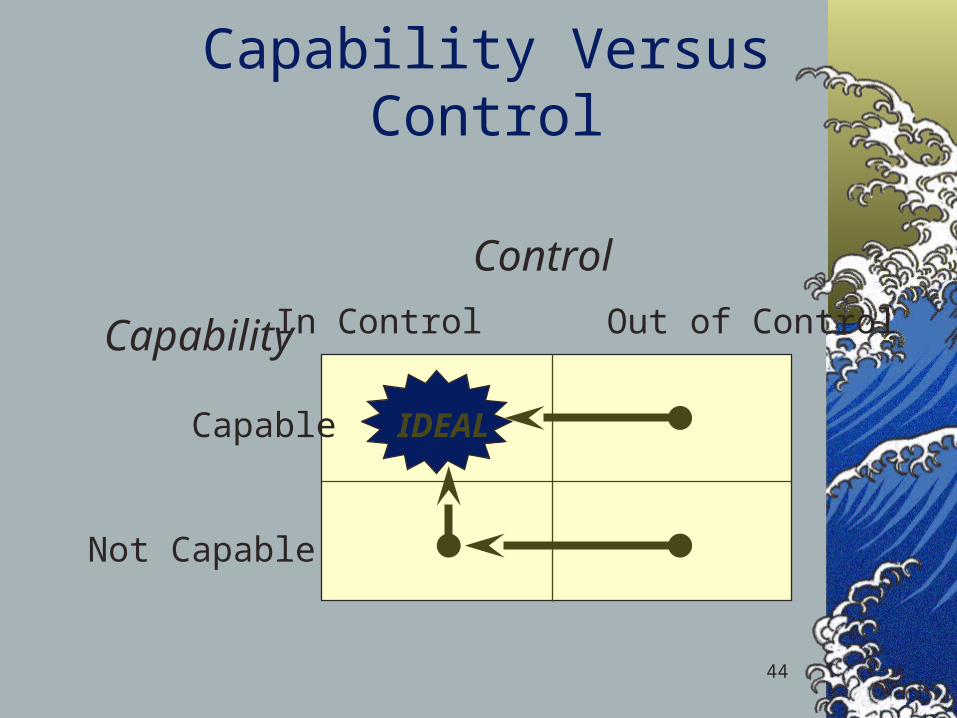
Capability Versus Control
Control
Capability
Capable
Not Capable
In Control Out of Control
IDEAL
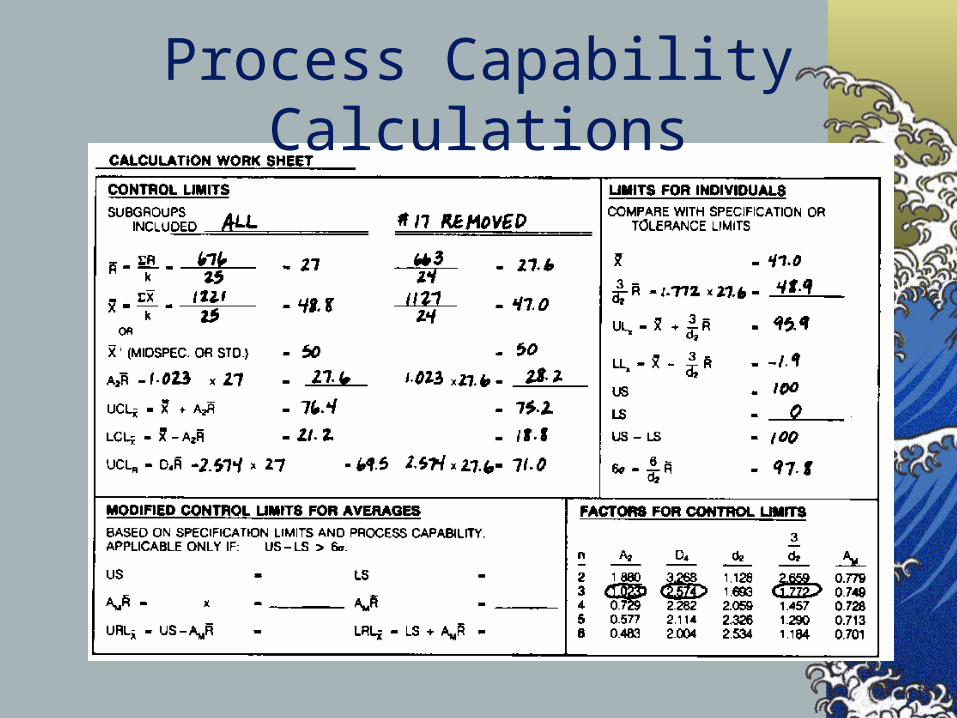
Process Capability Calculations
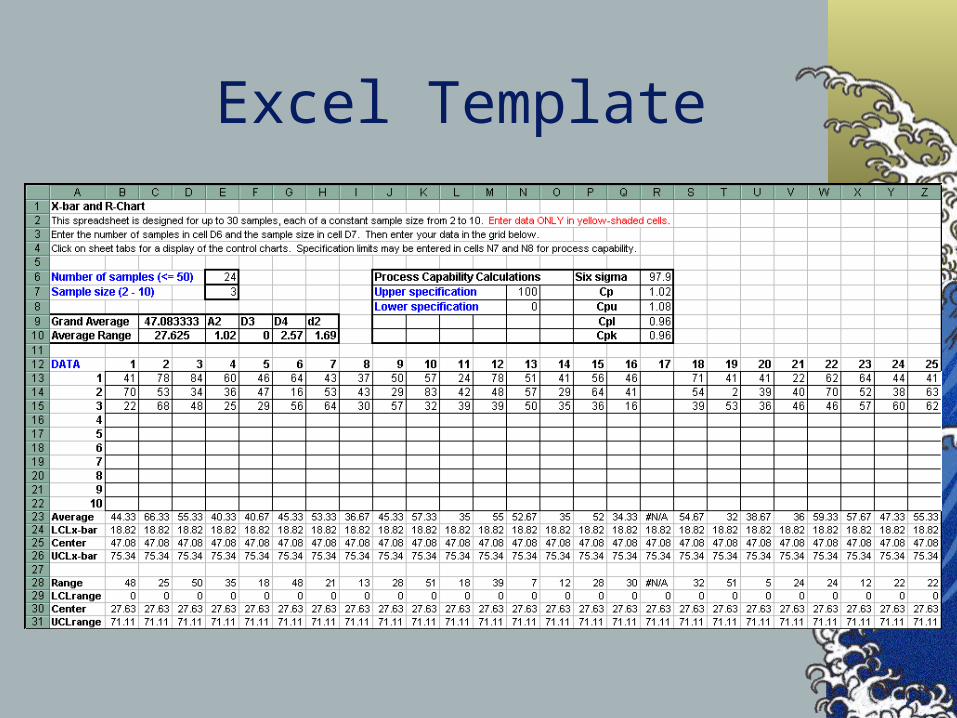
Excel Template
Special Variables Control Charts
x-bar and s chartsx-chart for individuals
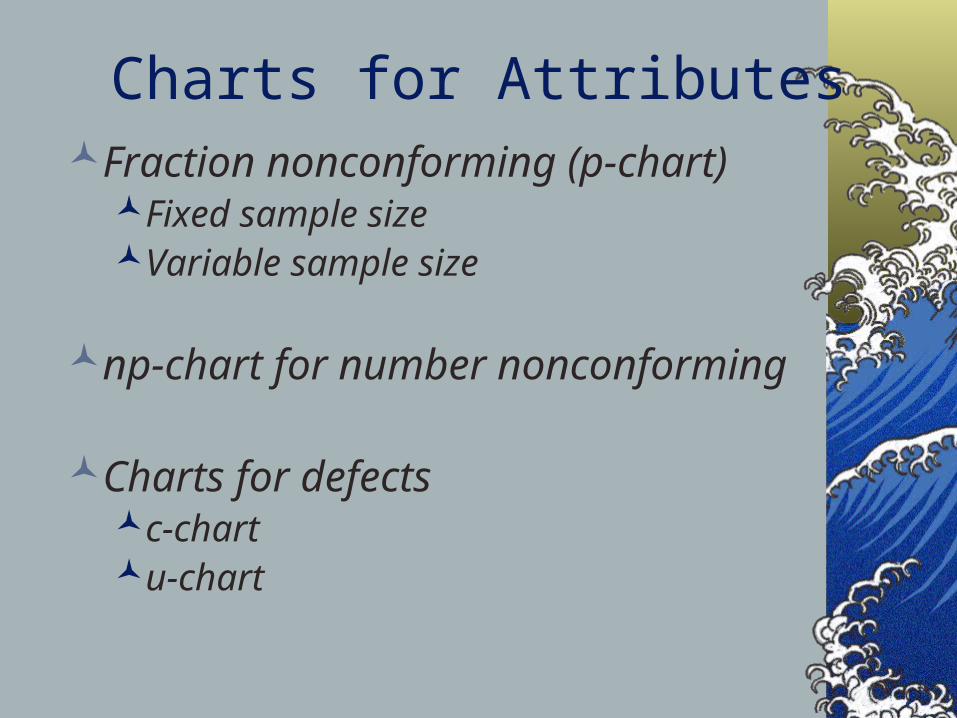
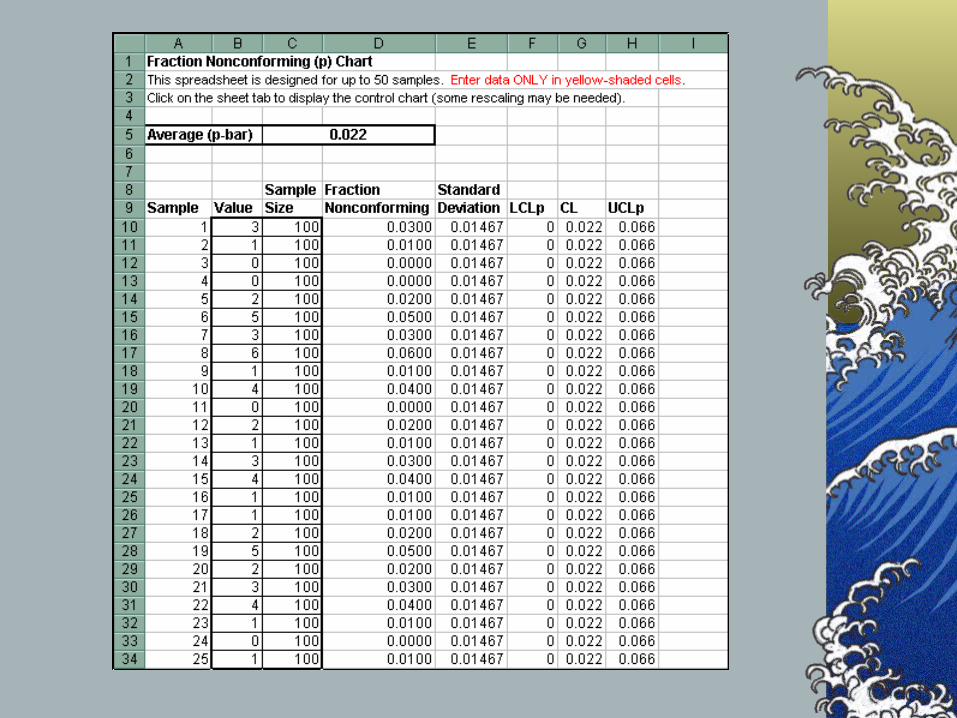
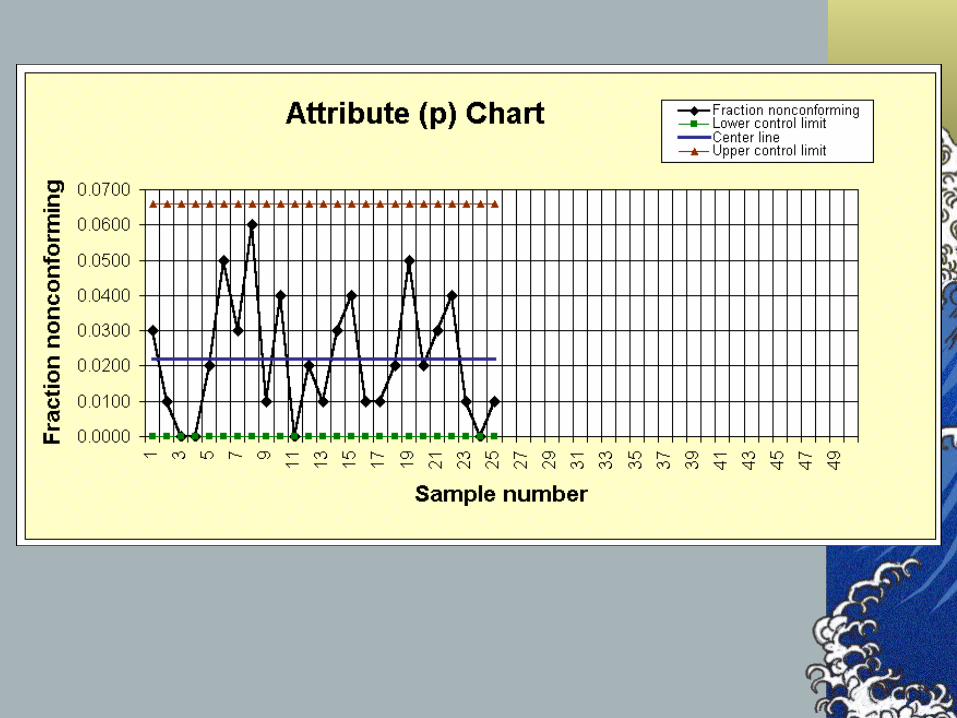
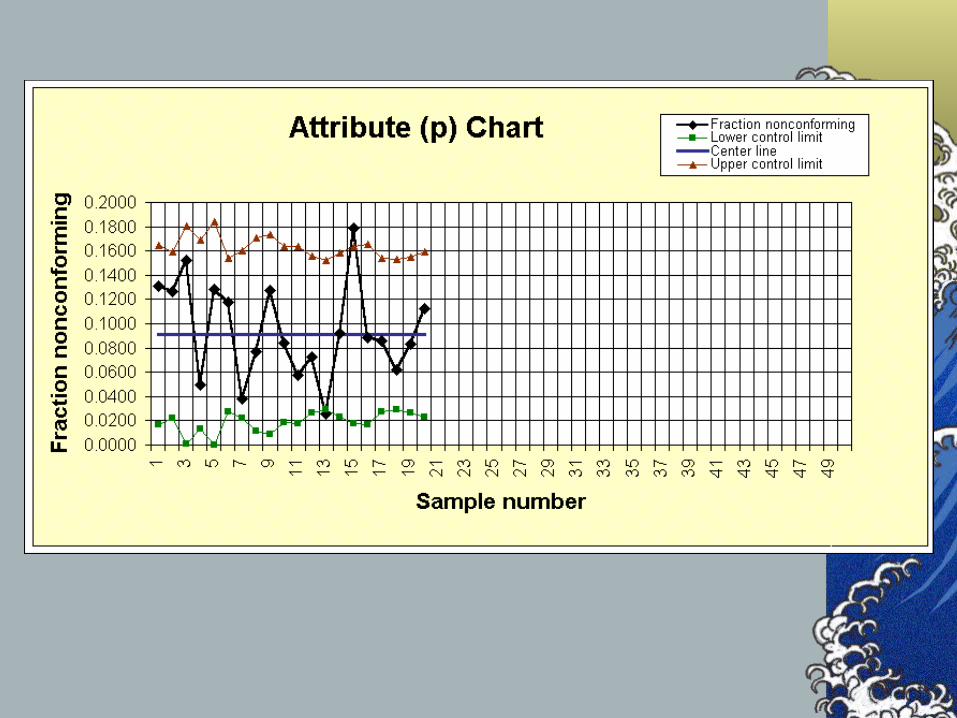
Charts for AttributesFraction nonconforming (p-chart)
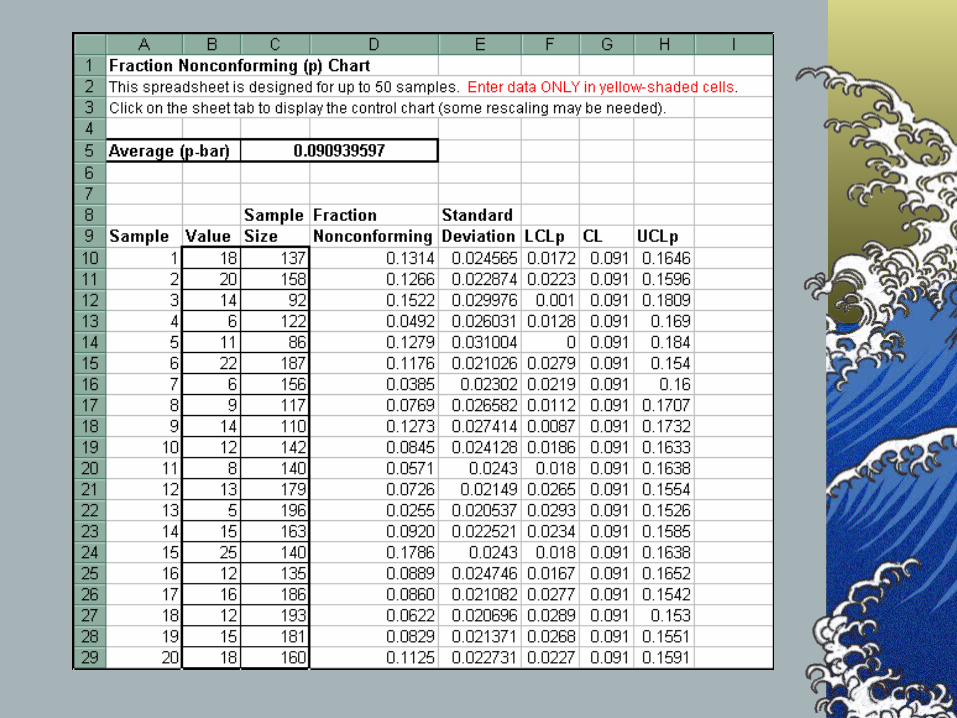
Fixed sample sizeVariable sample size
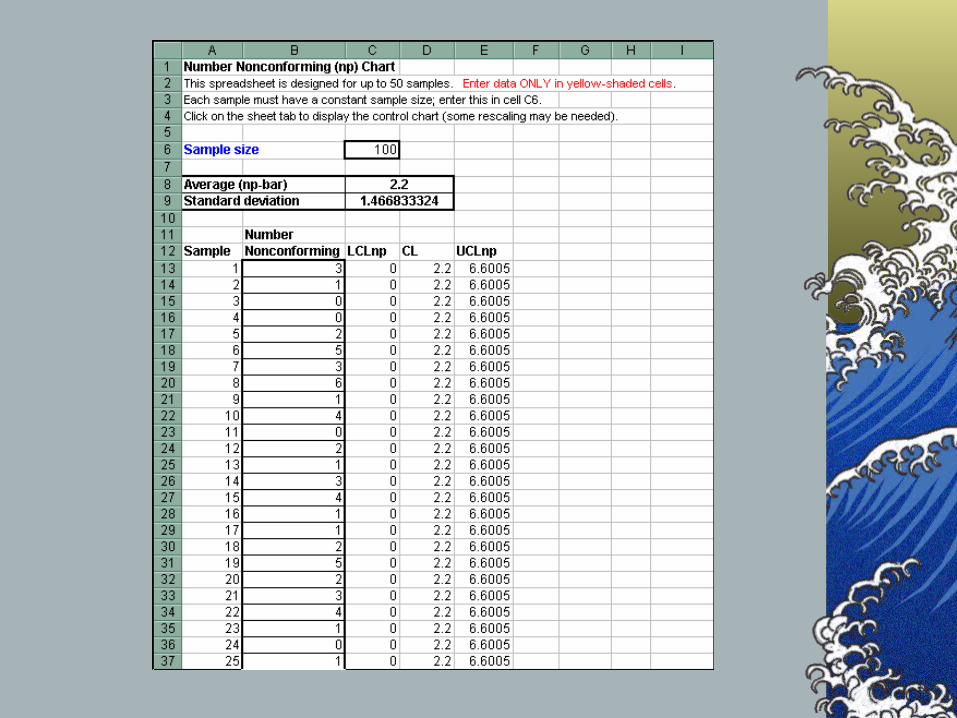
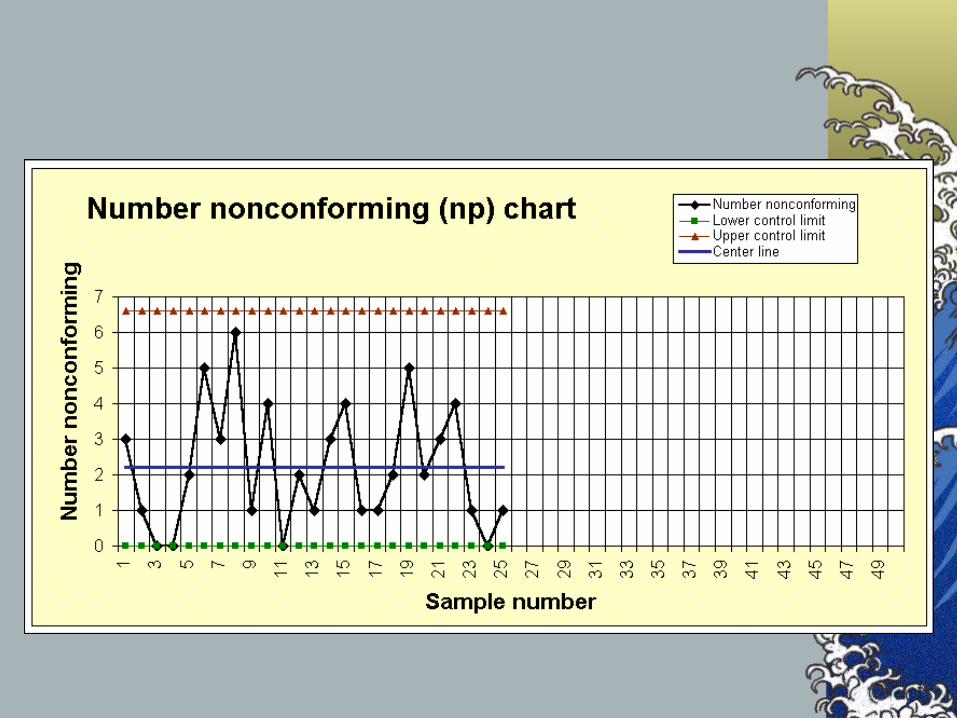
np-chart for number nonconforming
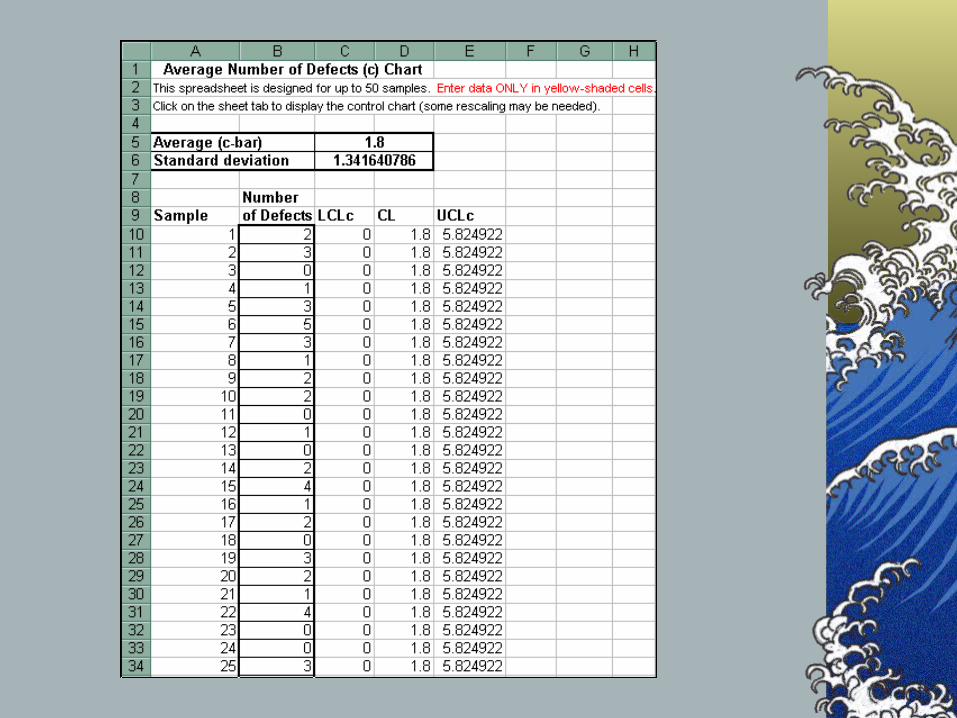
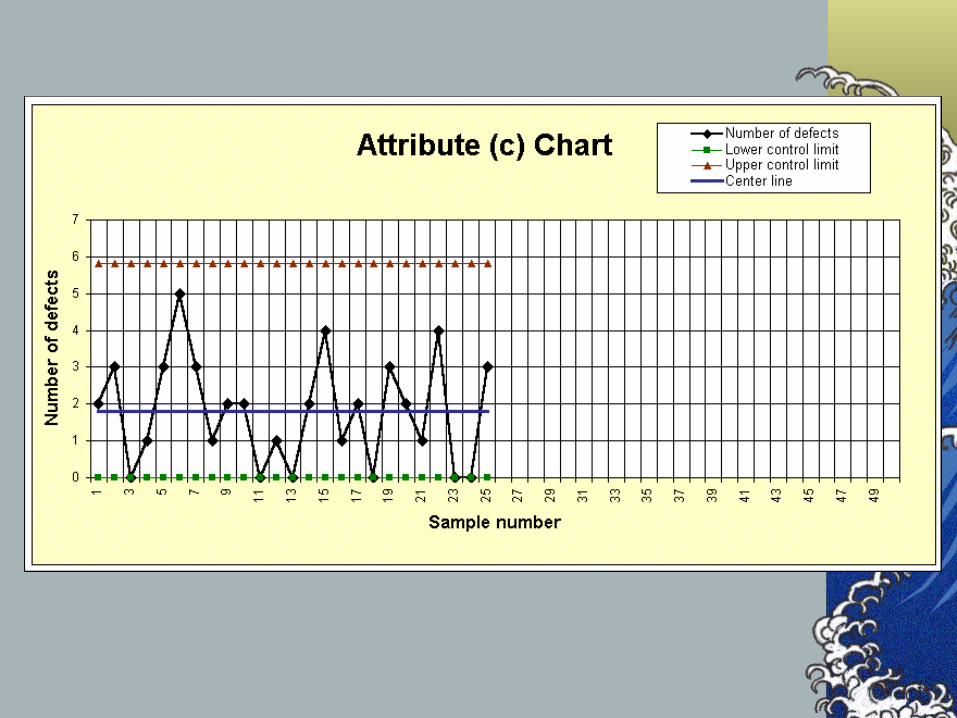
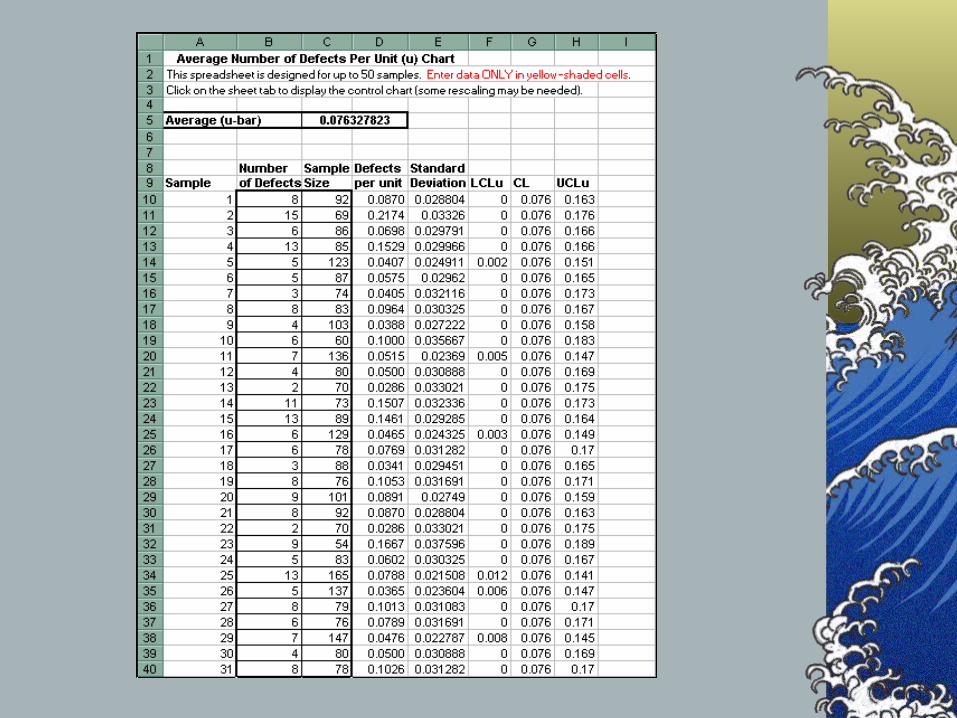
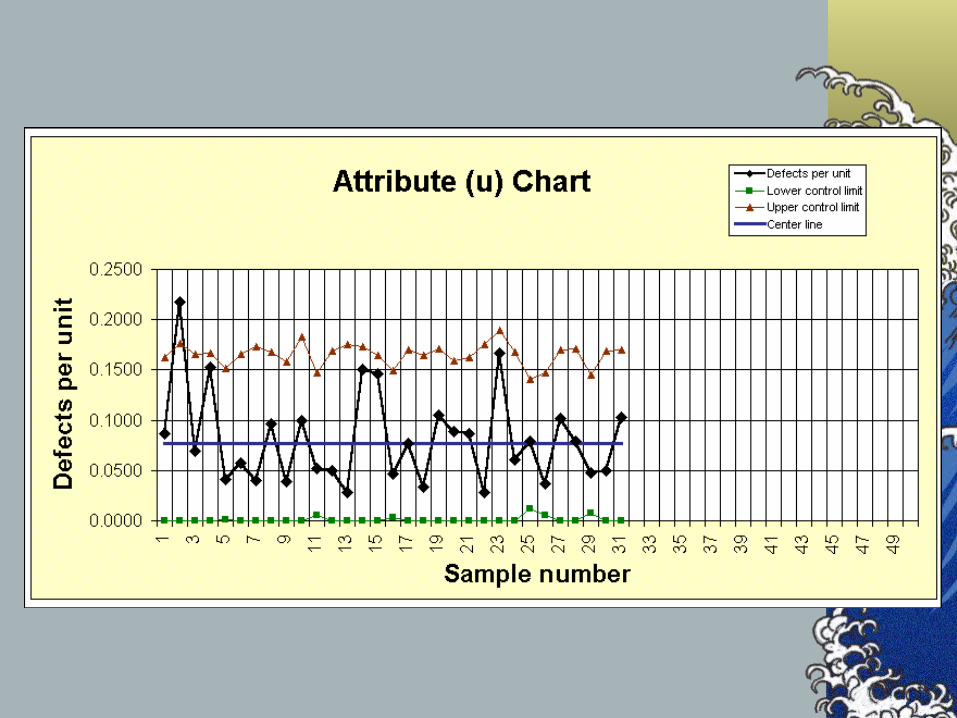
Charts for defectsc-chartu-chart
64
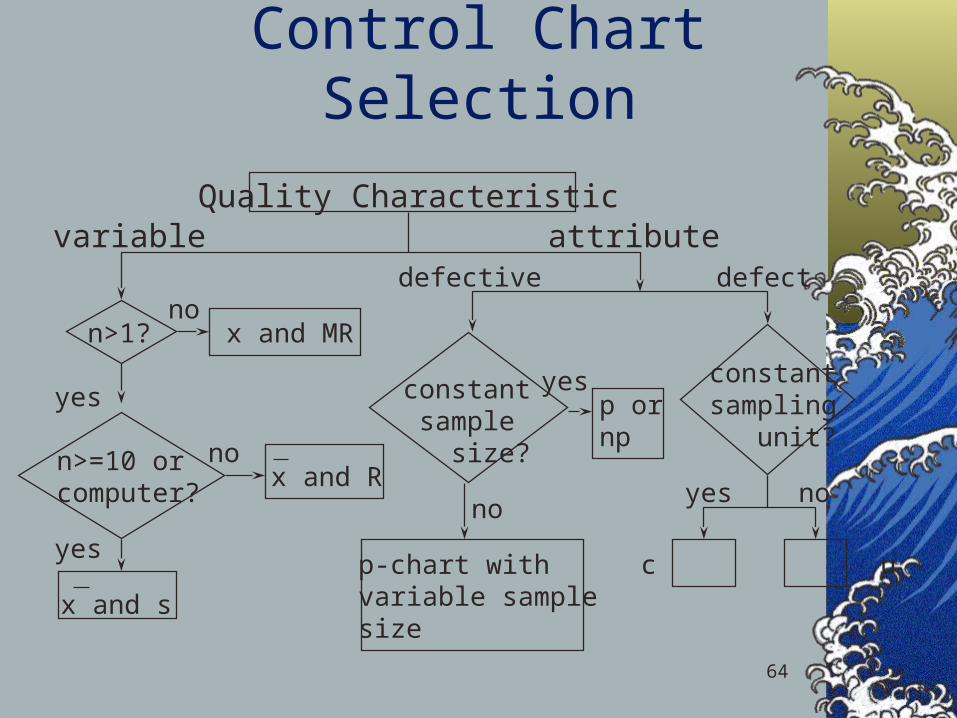
Control Chart Selection
Quality Characteristicvariable attribute
n>1?
n>=10 or computer?
x and MRno
yes
x and s
x and Rno
yes
defective defect
constant sample size?
p-chart withvariable samplesize
no
p ornp
yes constantsampling unit?
c u
yes no
65
Control Chart Design Issues
Basis for samplingSample sizeFrequency of samplingLocation of control limits
67
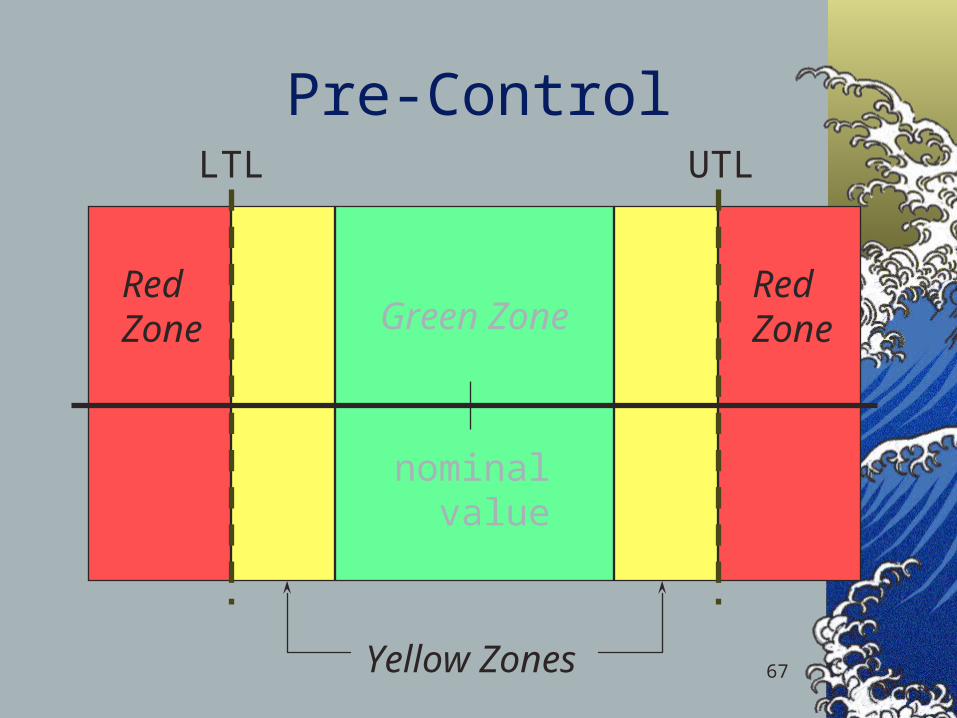
Pre-Control
nominal value
Green Zone
Yellow Zones
RedZone
RedZone
LTL UTL
68
SPC Implementation Requirements
Top management commitmentProject championInitial workable projectEmployee education and trainingAccurate measurement system