statistical first release · the november 2011 results for publicly funded la maintained schools...
TRANSCRIPT

Statistical First Release
15
SFR 06/2012
25th April 2012
Coverage: England
Theme: Children, Education and Skills
Issued by Department for Education, Sanctuary Buildings Great Smith Street London SW1P 3BT
Telephone: Press Office 020 7925 6789 Public Enquiries 0370 000 2288 Statistician Richard Howe
Email [email protected]
Internet http://www.education.gov.uk/rsgateway/DB/SFR/s001062/index.shtml
SCHOOL WORKFORCE IN ENGLAND: NOVEMBER 2011 INTRODUCTION This statistical first release (SFR) contains the latest information on the size (and characteristics) of the school workforce employed in local authority maintained schools and Academy schools in England. The SFR is based on data collected from schools and local authorities in November 2011 as part of the second annual School Workforce Census. The census collects detailed information on teachers, teaching assistants and other non-classroom based school support staff. The SFR includes statistics showing the time series of school staff numbers by grade/role and by school phase. It also provides detailed characteristic data on school staff e.g. their age, gender, ethnicity and whether they work full or part-time. The SFR also includes statistics on teachers’ salaries, qualifications and sickness absence. Plus, for a sample of secondary school teachers, statistics are published on the curriculum subject taught, whether teachers have qualifications in the subjects they teach and the hours spent teaching by subject. In addition the SFR includes statistics on the number of teaching vacancies (and by subject) and the number of teaching posts that are filled on a temporary basis. The statistics in this SFR are the second in the series of data published from the annual School Workforce Census. The previous statistics were published in April 2011 and can be found at the following link: http://www.education.gov.uk/researchandstatistics/statistics/allstatistics/a00196713/school-workforce-sfr KEY FIGURES In November 2011 there were a total of just under 0.9 million full-time equivalent (FTE) school workforce employees working in publicly funded schools in England with a contract of over 28 days duration (See Table 1). The school workforce has seen substantial increases in the numbers of school support staff employed in recent years whilst the number of school teachers has remained relatively flat. Between spring 2000 and November 2011 the numbers of full-time equivalent teachers in service has increased by 32,200 from 405,800 to 438,000. This represents an increase of 7.9%. However, in the most recent year there has been a decrease in teacher numbers after a period where teacher numbers have remained relatively flat. For example, teacher numbers increased by 8,800 (2.0%) from 439,300 in 2007 to 448,100 in November 2010. Teacher numbers fell by 10,000 (2%) between November 2010 and November 2011.

In comparison, the numbers of FTE teaching assistants has increased by almost threefold from 79,000 in spring 2000 to 219,800 in November 2011 with the rate of growth slowing between 2007 and 2011. Similarly, the numbers of other school support staff have increased by over 50,000 between spring 2000 and November 2011. The November 2011 census also collected information on school auxiliary staff (school maintenance and ground staff and dinner ladies etc.) of which there were 84,200 FTE employed in schools. This is information is not available for earlier years. Table 1: The number of full-time equivalent school staff in local authority (LA) maintained schools and Academy schools in England: 2000 and 2007-2011.
(numbers in thousands) Spring
2000 Spring 2007
Spring 2008
Spring 2009
November 2010
November 2011
Teachers
405.8 439.3 441.1 442.6 448.1 438.0
Teaching assistants 79.0 163.8 177.0 183.7 213.9 219.8 Non-classroom based school support staff
83.0 144.4 149.6 162.2 .. 133.9
Auxiliary staff .. .. .. .. .. 84.2 Total 567.8 747.5 767.7 788.5 .. 875.9 SCHOOL WORKFORCE NUMBERS
• The November 2011 results for publicly funded LA maintained schools and Academy schools show that the full-time equivalent (please see paragraph 41 of the technical notes for the definition of full-time equivalent) number of regular teachers and support staff in publicly funded schools was 791,700 (excluding auxiliary staff). In January 2010 the equivalent number reported was 810,900. There is no comparable figure available for November 2010 because the data necessary to calculate the FTE figures for non-classroom based school support staff wasn’t collected. In November 2011 there were 84,200 auxiliary staff employed by third party service providers, this is the first time this data has been published.
• The number of FTE teachers in service was 438,000. In November 2010 the number
reported was 448,100. This represents a decrease of 10.1 thousand teachers – 2.3%
• The FTE number of regular teaching assistants in service was 219,800. In November 2010 the number reported was 213,900. This represents an increase of 5.9 thousand teaching assistants – 2.8%.
• The FTE number of other regular support staff in service was 133,900 (excluding auxiliary staff). In January 2010 the number reported was 168,600. A figure is not available for November 2010.
• The FTE number of regular teachers in LA maintained schools was 358,700. The number reported in November 2010 was 425,200. This reflects the number of schools that have left the sector and have become academies.
• The FTE number of regular teachers in Academy schools was 79,300. In November 2010 the number reported was 22,800. In November 2011 there were 1,449 academies compared to 345 in November 2010.
• There were also 11,500 occasional teachers and 84,200 FTE regular auxiliary support staff in service. The FTE numbers of auxiliary staff was not previously available.

SHOOL WORKFORCE CHARACTERISTICS – as at November 2011 Gender
• 73.2 per cent of the FTE number of full and part-time regular teachers were female.
• 65.2 per cent of the FTE number of full and part-time head teachers were female.
• 93.4 per cent of the head count number of full and part-time teaching assistants were female.
• 83.8 per cent of the head count number of full and part-time other support staff were female.
Age
• 23.0 per cent of the full-time equivalent number of teachers were aged under 30.
• 22.8 per cent of full-time equivalent number of teachers were aged 50 or over.
• 53.4 per cent of full-time equivalent number of head teachers were aged 50 or over.
Ethnicity
• 93.6 per cent of teachers in service were recorded in the White ethnic groups. In November 2010 the figure was 93.7 per cent.
• Of the non-White ethnic groups, Asian teachers made up the next largest group with 3.0 per cent of those in service. Black Afro-Caribbean teachers made up 1.8 per cent of those in service followed by Mixed White/Other, 0.9 per cent, and the final 0.7 per cent of teachers in service came from other ethnic backgrounds.
• 97.6 per cent of head teachers were recorded in the White ethnic groups.
• 91.5 per cent of teaching assistants and all other support staff were recorded in the White ethnic groups. In November 2010 the figure was 91.9 per cent.
TEACHERS PAY
• The average gross salary of full-time regular qualified classroom teachers in LA maintained schools in England was £34,400, the figure for November 2010 was £34,700. This change is likely to be due to the reduction in the number of secondary schools that have converted to Academy schools.
• Table 9a of this SFR shows a small difference in the average pay of full-time regular qualified classroom teachers in maintained schools (£34,400) and those working in Academy schools (£35,700). Previous analysis published at :
https://www.education.gov.uk/publications/eOrderingDownload/DFE-RR151.pdf
shows that this differential is primarily due to the mix of schools being different for LA maintained and Academy schools. The latter have a different geographical distribution and higher proportion of secondary phase schools where salaries tend to be higher. This previous analysis shows that when controlling for this, the differential disappears. The Department will be updating this analysis using the November 2011 School Workforce Census data and will publish the findings in the summer.
• The average gross salary of leadership level teachers in LA maintained nursery and primary schools was £51,800 and £60,900 in secondary schools. The equivalent figure for leadership level teachers in Academy schools, including primary and secondary academies, was £61,500.

TEACHER QUALIFICATIONS AND CURRICULUM
• The majority (94.8 per cent) of teachers held degree level qualifications or higher. Head teachers and teachers working in nursery and primary schools were more likely to hold Bachelor of Education qualifications than teachers working in other publicly funded schools.
• Over half (54.4 per cent) of the time spent teaching the curriculum in secondary schools was in English Baccalaureate subjects; English, mathematics, history, geography, the sciences and languages.
• 73 per cent of teachers of mathematics to years 7-13 held a relevant post A-level qualification. Similarly, 78 per cent of English teachers and 91 per cent of teachers of combined/general science held a relevant post A-level qualification.
• 84 per cent of the total hours taught of mathematics to years 7-13 were by a teacher who held a relevant post A-level qualification. This compares with 88 per cent of total hours taught of English, and 94 per cent of the total hours taught of combined/general science.
PUPIL TO TEACHER AND PUPIL TO ADULT RATIOS
• The within school pupil to teacher ratios in local authority maintained primary and secondary schools were 21.0 and 15.5 respectively (compared to 20.9 and 15.6 in November 2010). The change may be due to the increasing number of primary school pupils and a reduction in secondary school pupils. Direct comparisons are difficult due to the number of schools that have converted to academy status during the year. The pupil to teacher ratio in academies was 16.0 compared to 15.9 in November 2011. This change is due in part to the increase in the proportion of primary academies that tend to have a higher pupil to teacher ratio.
• The overall pupil to teacher ratio was 17.6 compared to 17.3 in November 2010. The Local Authority Maintained Overall PTR has increased in part because the proportion of secondary school pupils and teachers included in this figure has decreased as more schools have converted to academy status. For the definition of the overall pupil to teacher ratio please see paragraph 41 of the technical notes.
• The pupil to adult ratios in local authority maintained primary and secondary schools was 11.9 and 10.9 respectively. No equivalent figures are available for 2010 and any comparisons with earlier years need to be treated with caution due to the change in the data collection. The pupil to adult ratio in academies was 11.1. This is the first year for which this figure is available.
TEACHER VACANCIES
• In November 2011 there were 350 teacher vacancies reported for full-time permanent teachers in publicly funded schools, a rate of 0.1 per cent. The rate in November 2010 was also 0.1 per cent.
• In addition to the standard definition of vacancies there were a further 1,450 full-time posts
that were temporarily filled by a teacher on a contract of at least a term but less than 1 year. In 2010 there were 1,790.
TEACHER SICKNESS ABSENCE
• In the academic year 2010-2011 56 per cent of teachers in service at any time during the year took sickness absence compared with 52 per cent in 2009-2010.
• An average 4.6 days sickness absence leave was taken by each teacher (who was in
service at any time during the year). This is a small increase from an average of 4.2 days in the previous year.

• An average of 8.2 days was taken by each teacher who took one or more periods of sickness absence. The same as the previous year.
LIST OF TABLES These tables are available within this document or separately (in excel format) on the Department’s statistics website at the following link: http://www.education.gov.uk/rsgateway/DB/SFR/s001062/index.shtml Table 1 Full-time equivalent (FTE) number of teachers and support staff in publicly funded
schools, 2000 and 2005 to 2011. Table 2 Full-time equivalent (FTE) number of teachers, teaching assistants and other
support staff in publicly funded schools by sector and grade or post, 2002, and 2005 to 2011.
Table 3 Head count and full-time equivalent teachers, teaching assistants and support staff
in publicly funded schools, by sector, 2011. Table 4 Full-time equivalent number of regular qualified and unqualified teachers in publicly
funded schools by sector, grade, gender and age, 2011. Table 5 Proportions of the head count of regular qualified and unqualified teachers in
publicly funded schools by sector, grade, gender and ethnic origin, 2011. Table 6 Proportions of the head count of teaching assistants and school support staff in
publicly funded schools by sector, grade, gender and ethnic origin, 2011. Table 7a Full-time regular qualified classroom teachers in publicly funded schools:
Percentage distribution of teachers on the classroom teachers' pay scales by sector, 2011.
Table 7b Part-time regular qualified classroom teachers in publicly funded schools:
Percentage distribution of teachers on the classroom teachers' pay scales by sector, 2011, (new table).
Table 8 Full-time regular qualified teachers in publicly funded schools by gender, pay scale
point, sector and age, 2011. Table 9a Full-time regular qualified classroom teachers in publicly funded schools by salary
bands, average salary, sector, gender and age, 2011. Table 9b Full-time regular qualified school leadership teachers in publicly funded schools by
salary bands, average salary, sector, gender and age, 2011. Table 10 Full-time regular qualified teachers in publicly funded schools by salary bands,
average salary, sector, gender and age, 2011, (new table). Table 11 Head count of regular teachers in all publicly funded schools by phase, grade and
highest level of post A level qualification, 2011. Table 12 Head count of teachers and number of hours taught by subject and Key Stage to
year groups 7-13 in all publicly funded secondary schools, 2011. Table 13 Highest post A-level qualifications held by publicly funded secondary school
teachers (head count) in the subjects they taught to year groups 7-13, 2011,

(Provisional). Table 14 Hours taught in a typical week in 2011 to pupils in years 7 to 13 by highest post A-
level qualifications of the teacher teaching the lesson, (Provisional). Table 15 Full-time vacancies and temporarily filled posts with rates in publicly funded schools
by sector and grade, 2000 and 2005 to 2011. Table 16 Full-time classroom teacher vacancies and temporary filled post numbers and rates
in publicly funded secondary schools by subject, 2010 and 2011. Table 17 Pupil:teacher ratios in local authority maintained nursery, primary, secondary and
special schools and academies, 2000, 2005 to 2011. Table 18 Full and part-time teacher sickness absence in publicly funded schools, academic
year 2010/11. SCHOOL, LOCAL AUTHORITY AND REGIONAL DATA In addition to the national figures published in this statistical release a broad range of school level data will be published in June 2012 as part of the Department’s transparency commitment to publish the underlying data used to create its statistical publications. The school level school workforce statistics will also be aggregated to both local authority and regional level. The data will become available (in an accompanying file) on the same webpage as this release and will replace the tables that were previously published. A subset of the school level school workforce data will also be published as part of the 2012 School Performance Tables. This will be the second time that school level school workforce data will have been included in the School Performance Tables. The current set of School Performance Tables can be found at the following link: http://www.education.gov.uk/schools/performance/?pid=pt2011_&cre=bannerpurple TECHNICAL NOTES Data source and coverage
1. The School Workforce Census (SWF) was introduced in November 2010 and this SFR contains the results of the second collection in November 2011. The SWF collects information from all publicly funded schools including local authority (LA) maintained schools, Academy schools and City Technology Colleges in England. It excludes sixth form and other further education colleges. It includes LA centrally employed teachers (including those working in Pupil Referral Units (PRU)) and centrally employed education support staff who spend the majority of their time in schools. The SWF also has a count of educational psychologists in service in local authority.
2. SWF data are collected at the individual level for all staff in regular employment with a contract of 28 days or more. This includes contracts that were open on the census date and also those that were open but ended during the previous academic year. School staff that did not have an open contract on the census date are not included in the SFR but their information is collected as it essential for the calculation of staff turnover and teacher absence rates.
3. The SWF includes teacher and support staff characteristics such as gender, age, ethnicity and disability as well as contract information, post, roles and pay. Individual absence records are also collected for all absence types for all teachers in service during the academic year previous to that of the census date. The census also collects information on the post A-level qualifications held by teachers. In addition, for a sample of secondary schools (and Academy schools), the census collects information on the curriculum taught by teachers to pupils in years 7-13. At present the curriculum data is only available for around 70 per cent of schools that have the necessary management information systems in place to supply it.

4. In addition to the individual level information that is collected, aggregate counts are also available at the school level for teacher vacancies, occasional teachers and support staff employed through an Agency/third party service provider.
5. The SWF collects contract information on the weekly hours worked and pay details of those whose individual level data is collected. The hours worked, together with the full-time weekly hours, are used to calculate the full-time equivalent ratio for each staff member. This calculation takes into account where school staff members have more than one open contract. A ratio of one indicates a full-time staff member.
Comparisons with previous years’ data (pre- SWF)
6. The SWF was introduced to replace the various school workforce data collections that existed prior to 2010; collections that often had different purposes, coverage, completeness and reference periods. By introducing the SWF the aim was to both reduce the number of data collection exercises (and the data supply burden on schools and local authorities) and to improve the quality of some of the key school workforce statistics required to monitor and evaluate the performance of the school workforce e.g. the total numbers of teachers by post/role broken down by age, gender, ethnicity and teachers’ pay.
7. For example, prior to the introduction of the SWF, to produce statistics on the total number of teachers by post/role broken down by pay band, age and gender data was required from both Form 618g and the Database of Teacher Records (DTR). Form 618g was an annual local authority return providing local authority aggregate counts of teacher numbers by role/grade and the DTR is an individual level teacher database that is a by-product of the administration of the Teachers’ Pension Scheme. The estimates produced were generally reliable at national level but were difficult to produce at regional or local authority level due to the DTR not always being complete (certain data items, i.e. those not required for pensions purposes, were not mandatory) and it not being as timely as the Form 618g teacher counts – usually being around 18 months behind.
8. By introducing the SWF, and collecting all the important school workforce information in one single data source, the Department is now able to produce consistent and timely statistics with greater reliability/accuracy that meets the needs of data users. However, whilst the SWF uses the same definitions as the main previous data collections, it is possible that the earlier statistics are not wholly comparable with those from the new census.
9. SFR Tables 1, 2, 15 and 18 show the time series statistics for the numbers of school workforce employees and the numbers of teaching vacancies. The statistics presented come from the various data sources that were in existence at the time. By changing the data collection methodology and the time of the year the collection is run (from January to the preceding November) it is possible that the data have been provided in a different way. For example, the SWF includes a broader range of staff than Form 618g/DTR e.g. counts of auxiliary staff and Agency staff who may have previously been included in the school support staff counts.
10. The vacancy information contained in Tables 15 and 16 from the SWF is not comparable with those from earlier years due to the change in the survey date. Previously the Form 618g survey collected vacancies that were available towards the beginning of the spring term. As the SWF is now collected earlier in the academic year - in the autumn term - it is felt this is likely to reduce the number of reported vacancies as schools will have successfully filled or temporarily filled vacancies that were available at the beginning of the new school year.
11. For further information on the data collections that the SWF replaced please consult the notes to editors in the November 2010 edition of this SFR that is available at the following web link:
http://www.education.gov.uk/researchandstatistics/statistics/allstatistics/a00196713/school-workforce-sfr

Differences between the November 2010 and November 2011 School Workforce Census
12. A major addition to the November 2011 School Workforce Census was the collection of FTE hours in respect of non-classroom based support staff. In 2010 the absence of this information meant that the FTE figure produced for this group of staff in Table 1 was an estimate and the previous publication only provided headcount figures for this group. This had limitations as many support staff were double counted where they were employed in different posts. The use of headcount information for support staff in this publication is now limited to Table 6 (ethnicity data). Pay and qualifications information is now collected for all staff for whom an individual record is required. As this is the first time such information has been collected for the other support staff categories analysis of data quality will be required before any release of the information can be made.
Data collection process and impact on data quality
13. Diagram 1 is a process map that shows the flow of data from schools and local authorities to the Department. It describes the five key stages that the data go through to support schools and local authorities in their task of providing high quality data. The five key stages are all internal processes and the SWF data is not used publicly until the final stage when it is formally published with the SFR.
Diagram 1: Description of the data collection process
START (November)
COLLECT and the Department provide feedback to schools/LAs regarding their data. Schools and
LAs have the opportunity to edit/change or resubmit data.
The SCHOOL provides data on their
staff
The LA provides data on their centrally
employed education staff
COLLECT: where data is checked and validated
Provide data for inclusion in the
School Performance Tables
Statistical First Release
School level: underlying data
Final dataset
producedProvide data to key users e.g. Teaching
Agency and the National College
Upload
Formatting and calculation checks in COLLECT. Flags warning to Schools/LAs.
School and LA software suppliers develop extraction routines using the technical specification published by the Department. These routines allow schools and LAs to extract data from their MI systems and upload to COLLECT.
Upload
Census day is in early November and providers have 28 days to submit their data. A four week data cleaning period follows.
1
2
1
March
April
3
5
November and December
4
14. The school workforce data required from both schools and local authorities is determined in
advance of the census in such a way that schools and LAs can engage the suppliers of their management information software (MIS) with sufficient time to incorporate any new data items (or changes to existing data items) into their local systems. The software suppliers build data extraction routines based on the data requirements set out in the technical specification published by the Department. Typically a near final version of the technical specification is shared with software suppliers around a year before the next census date. This allows software suppliers the opportunity to see and comment on the data requirement and any changes from the previous year. Their comments and views are taken into account to ensure the Department is asking for data in a way that is straightforward to deliver. A final version of the technical specification is published, after review, in January for all schools, local authorities

and software suppliers to see and use. The November 2011 technical specification can be found at the following link:
http://www.education.gov.uk/schools/adminandfinance/schooladmin/ims/datacollections/swf/docsandtools/a0063775/school-workforce-census-information-for-software-suppliers
15. Stage 1: By census day (November 3rd 2011 for the 2011 School Workforce Census) schools
and local authorities should have ensured their management information systems held accurate details for all their staff in scope of the census. They would then ensure that the information required by the Department (as set out in the published School Workforce Census data requirement) is extracted and uploaded to the Department’s COLLECT system. Schools and LAs will have had the opportunity to test out the quality of their data and the data extraction routines provided by their software suppliers by using the familiarisation version of the Department’s COLLECT system. The SWF data requirement can be found at the following link:
http://www.education.gov.uk/schools/adminandfinance/schooladmin/ims/datacollections/swf/a0063745/information-for-academies-and-schools
16. Stage 2: Once the schools and local authorities have successfully loaded their data onto
COLLECT they can review and inspect their data. The COLLECT system has a range of checks that it runs on the data: e.g. simple formatting checks, arithmetic checks and validations rules that specific data items must meet. The checks made within COLLECT are published in advance at the following link:
http://media.education.gov.uk/assets/files/pdf/2/2011%20swf%20school%20summary%20technical%20specification.pdf
Software suppliers often build these checks into their data extraction routines and/or MIS
system upgrades. The checks within COLLECT will flag up where the data provided has either failed (an error) to meet the standards required or doesn’t conform (a warning) to what was expected. For example, an error would result if no pay scale information was provided and a warning would result if the date of birth placed the teacher’s age as less than 21 or over 90.
17. Schools and local authorities then check their data - especially the errors and warnings - to
ensure the data is accurate and accurately reflects the staffing levels at their school at the time of the census. Changes and or corrections to the data provided can either be done on-line in COLLECT or within the local MIS system. If the changes are done locally then the data has to be resubmitted to the Department. Once schools and local authorities have resolved their errors and warnings they authorise their data – which signals to the Department that the data can move to the next stage.
18. Stage 3: Once the data has been authorised for use by schools and local authorities the
Department runs a further set of checks on the data. These checks look within the data to spot any problem areas, for example, where schools have provided substantial numbers of records that are missing particular data items e.g. staff with no contract information and staff whose pay rate is not credible. The results of these checks are provided as feedback to local authorities to help them work with their schools to ensure a complete set of data exists for all schools in their area.
19. Throughout the first three stages of the collection the Department operates a helpdesk which
staff at schools and local authorities can contact if they are unsure about any aspect of the School Workforce Census. The helpdesk operated throughout the census period, November to December, and throughout the period immediately afterwards where the majority of the data cleaning takes place – typically December into January.
20. Stage 4: Once all the schools and local authorities have provided, checked, corrected (where

necessary) and signed-off their data a database is created which allows the Department’s statisticians to prepare the data for publication.
21. Stage 5: The SFR series “School Workforce in England” is the first part of the dissemination
strategy where national (England) aggregate statistics are published covering all the main data areas collected in the census. School level data is then released as part of the commitment to release the underlying data used to create all national statistics. In addition, some school level school workforce data was included, for the first time, in the 2011 School and College Performance Tables which can be found at the following link:.
http://www.education.gov.uk/schools/performance/?pid=pt2011_&cre=bannerpurple
22. The school workforce census data are used in many ways. Publishing data at school level
allows the general public to see the numbers and types of staff schools choose to employ. By publishing the data alongside pupil data, pupil attainment data and finance data the public can see the wider picture of school spending and performance. The census data is also used to model future staffing requirements (teacher and head teacher numbers) and influences the number of teacher training places available. Statistics on teacher numbers, characteristics and pay are used by the Department, Teaching Unions and others to develop school workforce policies.
Data quality (general information and specific information for each SFR table) 23. The information contained in this statistical release is deemed to be final data and no further
data is expected to be received from schools and local authorities. A full and correct SWF return (i.e. a return for every LA maintained school and a return from the authority covering its centrally employed education staff) was received from 136 out of 152 local authorities. Of the 16 local authorities where a complete return was not received this was because: a full and usable return was not received from 192 schools and/or ten authorities were unable to supply a return for their centrally employed staff. Of the 1,449 Academy schools open in November 2011 136 were unable to submit a return. In addition after checking the data quality of all returns it was found that a further 201 schools had submitted data that lacked sufficient staff contract information to correctly allocate school staff to their correct groups and therefore they were not included in this SFR.
24. The 406 schools that we did not receive approved or authorised data or were otherwise not included represent around 1.9 per cent of the total number of publicly funded schools. To fill this gap estimates of the missing staff numbers have been taken from the November 2010 School Workforce Census (where available) and used in Tables 1 – 2 (i.e. the time series data of overall staff numbers). This method provided figures for 307 out of the 406 schools missing schools. No adjustments have been made for the remaining 99 schools who have never submitted a SWF return and therefore staff numbers are likely to have been underestimated by around 0.5 per cent. This small reduction does not affect changes reported in staffing numbers substantially.
25. Where returns were not submitted estimates have not been made for inclusion in the characteristics, pay and other tables. Estimates have only been included Tables 1 to 2 and for Table 18, teacher sickness absence.
26. In Tables 5 and 6 where headcount figures are given, teachers who have more than one post in a school are counted only once under their highest graded post. The post of head teacher is ranked highest and classroom teacher lowest. If they had more than one post at the same grade then only one is counted. For the headcount number of teaching assistants and other support staff presented in Table 6 there is no natural hierarchy of posts available and therefore staff with more than one post are counted once under each post. As around 9 per cent of support staff have more than one role the headcount figures provided in Tables 5 and 6 should not be used as a measure of the overall size of the school workforce. The full-time equivalent

figures provided in Table 1 and 2 should be used instead.
27. Centrally employed staff are included as a separate entry in the SFR tables from November 2010. In previous school workforce publications teachers in this category were generally proportioned between the nursery/primary and secondary phases. FTE figures for nursery/primary and secondary schools and centrally employed totals from the SWF cannot therefore be directly compared with the earlier years data presented in Tables 1 and 2.
28. The staff breakdown by type of post, including the grade of teacher, is taken from the information in the post description provided in the contract and not the additional role information which provides greater detail. The further information available in the role has not been used to decide the post held except for teaching assistants where they were recorded as support staff in the Post description field in error. The further breakdown of the role for teaching assistants and support staff provided in Table 2 is provided by the first role descriptor supplied for the contract.
29. The ethnicity categories are based on those used in the 2001 national population census. A more detailed breakdown is not available.
30. Tables 7a, 7b and 8 include data on the numbers of teachers and where they are on their pay scale. This will only include teachers whose post description agrees with the pay scale given - where it has been provided. Where a contract pay band does not agree with the post then they are placed in the “Other” and “Unknown” categories as appropriate. Academy schools do not have to place their teachers on the pay scales agreed under the School Teachers Pay and Conditions Document (STPCD). Teachers to whom this applies will also be placed in the other category. The STPCD is available at the following web link:
http://www.education.gov.uk/schools/careers/payandpensions/a0064179/school-teachers-pay-and-conditions-document-2011
31. Tables 9 and 10 give average pay information for teachers. The gross pay for teachers with a contract that provides STPCD information is calculated from the pay spine and area pay band provided plus any additional allowances recorded. Any teachers whose salary lies below the lower limit of the lowest point on the relevant pay scale are shown as misreported. This category also includes teachers with missing salary details.
32. Table 9a of the SFR shows a small difference in the average pay of full-time regular qualified classroom teachers in maintained schools, (£34,400), and those working in Academy schools (£35,700). Previous analysis published at :
https://www.education.gov.uk/publications/eOrderingDownload/DFE-RR151.pdf
shows that this differential is primarily due to the mix of schools being different for LA maintained and Academy Schools. The latter have a different geographical distribution and higher proportion of secondary phase schools where salaries tend to be higher. This previous analysis shows that when controlling for this, the differential disappears. The Department will be updating this analysis using the November 2011 School Workforce Census data and will publish the findings in the summer.
33. Additional allowances have been included in the gross salary and noted once for each contract for each type of allowance. Where two or more allowances of the same type are noted then the higher amount is taken as the allowance in payment on the census date and included in the gross salary. The only exception is unspecified allowances where the sum of all these is included as representing the amount included in the salary over the course of a year as these are likely to be one-off rather than continuous monthly payments.
34. Table 11 provides information on teachers’ highest level of post A-level qualification. Qualifications information was received for 91% of teachers. The percentage of teachers

holding a particular level of qualification was derived using a baseline of the total teachers for whom qualifications information was provided. Where a teacher was reported as holding more than one post A-level qualification, the qualification level was determined by the highest level, from degree or higher to other qualification at National Qualifications Framework (NQF) level 4 and non-UK qualifications for which an equivalent NQF level was not provided.
35. Curriculum information was requested from all secondary, middle deemed secondary and all-through schools including relevant academies, with timetabling software that interfaces with their Management Information System. A total of 2,762 schools provided this information, therefore Table 12 is based on a large sample of teachers (around 79 per cent) teaching secondary school aged pupils. As not all teachers in the schools providing curriculum information had qualifications information as well, the proportion of teachers included in the sample for Tables 13 and 14 is reduced somewhat. The data have been weighted and grossed so that all totals presented in the tables provide a representative, national picture.
36. Tables 13 and 14 provide information on the proportion of teachers, and of hours taught by teachers, holding relevant post A-level qualifications by subject taught. The tables record the highest qualification gained in each subject taught, rather than each qualification. A teacher’s qualification was deemed as ‘relevant’ to the subject taught if the subject of their qualification, reported using the Joint Academic Coding System (JACS), appeared in the list of JACS codes in the Department’s subject mapping.
37. The subjects of qualifications were not received for all qualifications submitted and in a small number of other cases they were incomplete or incorrect. Overall, useable qualifications data was received from 92 per cent of teachers in schools submitting curriculum returns, and this was consistent across subjects. Confidence intervals have been calculated around the proportions to show the statistical accuracy of the data, and give a range within which we can be reasonably sure (95% certain) that the true value actually lies.
38. A change has been made to the methodology of the creation of the qualifications proportions by subject in table 13 and 14. Where a teacher is recorded as having a PGCE they must also have a first degree recorded as well to be included in the table. This change might slightly raise the proportion of teachers with a degree in the subject.
39. Tables 13 and 14 have been marked as provisional as further updates to the qualifications of newly qualified teachers are likely to be received allowing a revision to these tables.
40. The pupil numbers used to calculate the Pupil Teacher Ratio (PTR) and Pupil Adult Ratio (PAR) are from the January 2012 Pupil Census. It is not thought that the difference in the timing of the two censuses affects the accuracy of the PTR data. Only those schools that provided both pupil and workforce information are included in the figures. The pupil numbers used in the calculation of the PTR statistics now include dual registered pupils. Previously only sole registered pupils were included. Dual registered pupils are registered in more than one school.
41. The overall PTR is based on the total FTE number of pupils on roll in local authority maintained nursery, primary and secondary schools and the FTE of all teachers in these schools (including: centrally employed; occasional teachers; those on employment based routes to QTS; others without QTS, those on paid absence and any replacements). Special schools are excluded. Prior to 2010 the teacher numbers are from the 618g survey. The overall PAR also includes support staff excluding administrative, clerical and auxiliary staff.

42. Teacher sickness absence information was received for around 97 per cent of local authority maintained schools. A local authority was deemed to have made a full return where 95 per cent of schools or more had supplied absence information because small schools may not have had any absence to report. 22 local authorities had less than the required 95 per cent return rate and in these cases estimates based on the national rate were added (to the statistics in Table 18) to account for the schools with missing information. All but 2 local authorities had a return rate of over 75 per cent of their schools.
43. The majority of academies did not have a complete teacher sickness absence return because they were not open as an Academy for the full academic year. Teacher sickness absence statistics are based on the absences taken by teachers in the 12 months up to the census date. Only 247 academies made a full absence return, around 17 per cent. It did not prove possible to accurately estimate the teacher sickness absences missing for these schools and therefore an estimate based on the local authority schools absence rates were used where information for an Academy was not available.
General notes and definitions
44. Definitions for SWF data shown in the SFR.
a. Full-time and part-time staff are defined by the proportion of the full-time hours upon which they are employed.
b. The main count of individual level records of school workforce staff is based on all those staff with a contract of 28 days or more in service on the census date in November.
c. Teachers in occasional service are those with a contract of less than one month, 28 days for SWF, and are employed on census day.
d. Third party support staff are not directly employed by the school and are in service on the census date.
e. Teachers provided by teacher employment agencies are included in the main count or as in occasional service depending on the length of their contract.
f. Centrally employed staff are those employed by the local authority and include the following types of employee: peripatetic teachers; home tutors; and teachers who are employed by education authorities to provide education in institutions other than schools (e.g. hospitals, home tuition, assessment centres and pupil referral units). Advisory teachers were previously counted as teachers within the old Form 618g collection but have since been re-classified as other education support staff.
g. A teacher vacancy refers to a full-time or part-time appointment of at least one term's duration that, on the census date, had been advertised but not filled. Vacancies include those filled on a temporary basis unless filled by someone with a fixed term contract of one term or more.
h. A temporarily filled post is one where a permanent vacancy is available but it is being filled by a teacher with a contract of at least a term but less than one year’s duration. This is irrespective of whether the post has been advertised.
i. The teacher vacancy rate is the number of vacancies expressed as a percentage of qualified teachers in post e.g. full (or head count number of part-time) regular teachers in (or on secondment from) the relevant sector.
j. The rate for secondary school vacancies including temporarily filled posts broken down by subject is calculated as a percentage of the number qualified full-time teachers in post that are required to teach the individual subjects. This is calculated from the proportion that each subject is taught out of the total teaching time available.

k. Middle schools are classed as deemed, i.e. as either primary or secondary.
l. City Technology Colleges and Free Schools are included with Academy schools.
m. Sickness absence periods, and days taken, include all periods of sickness absence leave taken in the academic year (1 September 2010 to 31 August 2011). They include any that were ongoing on the 1 September 2010 and exclude any that were ongoing after the 31 August 2011.
Teacher status
45. Qualified teachers are those who have been awarded qualified teacher status (QTS) either by successfully completing a course of initial teacher training (ITT) or through other approved routes.
46. Teachers are comprised of the following:
a. Teachers with QTS or with the equivalent gained elsewhere in the European Economic Area (EEA);
b. Teachers without QTS, but with a professional qualification gained outside the EEA who have been in service for less than the 4 years (beyond which full QTS status gained in the UK is required);
c. Instructors without QTS, but with special qualifications in, or experience of, a particular subject.
Rounding and symbols used
47. Totals in the text and in the tables may not always equal the sum of their component parts because of rounding. Similarly, differences quoted in the text may not always be the same as the differences shown in the tables because of rounding. Symbols are used in the tables as follows:
. not applicable
.. not available
- nil or negligible

Queries Enquiries about the figures contained in this press release should be addressed to: Department for Education 1F, Area G Mowden Hall Staindrop Road Darlington DL3 9BG Telephone Number: 01325 735470 Email: [email protected] Press enquiries should be made to the Department’s Press Office at: Press Office News Desk Department for Education Sanctuary Buildings Great Smith Street LONDON SW1P 3BT Telephone Number: 020 7925 6789
A National Statistics publication
National Statistics are produced to high professional standards set out in the National Statistics Code of Practice. They undergo regular quality assurance reviews to ensure that they meet customer needs. They are produced free from any political interference.

January 2000, 2005 to 2010 and November 2010 and 2011
(Thousands)
2000 2005 2006 2007 2008 2009 2010 2010 2011
193.1 196.3 198.2 197.1 198.1 198.5 200.9 196.3 194.9174.7 166.9 166.7 165.2 165.2 165.0 166.8 161.0 158.8
16.7 23.0 25.3 26.4 27.6 28.8 30.2 31.2 31.9Unqualified FTE teachers 6 1.5 6.4 6.2 5.5 5.2 4.8 3.9 4.1 4.2
10.5 8.6 7.4 7.5 7.4 7.0 8.2 7.9 7.5Total Teachers 203.6 204.8 205.6 204.6 205.5 205.6 209.1 204.2 202.5
FTE regular teaching assistants 7,8 53.4 97.9 99.0 105.8 115.0 118.3 126.3 133.5 134.1FTE regular other support staff 9 39.1 46.6 55.3 57.4 57.6 63.2 63.4 .. 48.6FTE auxiliary staff 10 .. .. .. .. .. .. .. .. 39.1Headcount third party support staff 11 .. .. .. .. .. .. .. .. 20.9
285.5 340.8 352.6 360.2 370.7 380.0 390.6 .. 416.8
193.2 215.1 216.3 216.8 215.3 212.6 210.3 195.6 138.1176.5 186.5 187.5 188.0 185.5 182.1 179.9 166.5 117.3
14.5 17.5 18.3 18.9 19.5 20.2 21.3 21.0 15.3Unqualified FTE teachers 6 2.1 11.0 10.4 9.9 10.2 10.3 9.0 8.1 5.4
5.3 5.7 4.6 4.8 4.6 4.1 3.7 3.2 2.4Total Teachers 198.5 220.8 220.9 221.7 219.9 216.6 213.9 198.8 140.4
FTE regular teaching assistants 7,8 12.5 30.0 33.5 35.7 37.8 39.3 39.9 45.4 35.2FTE regular other support staff 9 38.7 63.1 70.7 76.4 79.9 83.8 86.1 .. 45.9FTE auxiliary staff 10 .. .. .. .. .. .. .. .. 15.4Headcount third party support staff 11 .. .. .. .. .. .. .. .. 11.5
244.4 308.1 320.5 328.9 333.0 335.6 336.3 .. 234.6
14.3 14.3 14.5 14.5 14.8 14.9 15.1 15.1 15.012.8 11.8 11.8 11.8 12.0 12.0 12.3 12.1 11.8
1.3 1.5 1.7 1.7 1.8 1.8 2.0 2.0 2.1Unqualified FTE teachers 6 0.2 1.0 1.0 1.0 1.0 1.1 0.9 1.1 1.1
0.7 0.6 0.6 0.6 0.5 0.5 0.5 0.5 0.5Total Teachers 15.0 14.9 15.1 15.1 15.4 15.4 15.6 15.6 15.4
FTE regular teaching assistants 7,8 12.7 17.1 18.6 19.4 20.5 21.3 22.0 23.0 23.9FTE regular other support staff 9 4.4 7.4 7.5 7.9 8.0 9.0 9.4 .. 6.3FTE auxiliary staff 10 .. .. .. .. .. .. .. .. 3.4Headcount third party support staff 11 .. .. .. .. .. .. .. .. 2.6
31.4 38.8 40.6 41.8 43.2 45.2 46.5 .. 48.5
4.0 6.2 6.6 6.8 6.7 6.8 6.5 18.2 10.73.1 4.6 4.9 5.1 5.0 4.9 4.4 11.4 5.90.9 1.3 1.4 1.4 1.4 1.5 1.5 4.6 3.6
Unqualified FTE teachers 6 - 0.2 0.3 0.3 0.3 0.3 0.6 2.2 1.20.1 0.3 0.3 0.3 0.2 0.1 0.1 - -
Total Teachers 4.1 6.5 6.9 7.1 6.8 6.9 6.5 18.2 10.7
FTE regular teaching assistants 7,8 0.5 2.1 2.0 2.1 2.3 2.7 2.3 5.8 5.8FTE regular other support staff 9 0.4 0.7 0.9 1.0 1.3 1.4 2.0 .. 6.1FTE auxiliary staff 10 .. .. .. .. .. .. .. .. 15.0Headcount third party support staff 11 .. .. .. .. .. .. .. .. -
4.9 9.0 9.4 9.9 10.3 10.9 10.7 .. 37.6
404.6 431.9 435.6 435.2 434.9 432.8 432.7 425.2 358.7367.1 369.9 371.0 370.1 367.7 364.1 363.3 350.9 293.8
33.3 43.4 46.7 48.4 50.4 52.3 55.0 58.7 53.0Unqualified FTE teachers 6 3.8 18.6 17.9 16.7 16.8 16.4 14.4 15.6 11.9
16.7 15.1 12.9 13.2 12.8 11.7 12.5 11.6 10.4Total Teachers 421.3 447.0 448.4 448.4 447.6 444.5 445.2 436.8 369.0
FTE regular teaching assistants 7,8 79.0 147.0 153.1 163.0 175.7 181.6 190.5 207.7 198.9FTE regular other support staff 9 82.6 117.8 134.4 142.6 146.7 157.3 160.9 .. 106.9FTE auxiliary staff 10 .. .. .. .. .. .. .. .. 72.9Headcount third party support staff 11 .. .. .. .. .. .. .. .. 34.9
566.2 696.7 723.1 740.8 757.3 771.7 784.2 .. 737.5continued overleaf
CENTRALLY EMPLOYED 13
Total regular FTE teachers 4
Part-time FTE regular qualified 5
Total regular FTE workforce 12
Head count occasional teachers
Total regular FTE workforce 12
SPECIALTotal regular FTE teachers 4
Total regular FTE workforce 12
TOTAL MAINTAINED SECTORTotal regular FTE teachers 4
Full-time regular qualified 5
Head count occasional teachers
Head count occasional teachers
Total regular FTE workforce 12
JANUARY NOVEMBER
NURSERY AND PRIMARYTotal regular FTE teachers 4
SECONDARYTotal regular FTE teachers 4
Full-time regular qualified 5
Part-time FTE regular qualified 5
Full-time regular qualified 5
Part-time FTE regular qualified 5
Table 1
Full-time regular qualified 5
Part-time FTE regular qualified 5
Head count occasional teachers
Total regular FTE workforce 12
Head count occasional teachers
Full-time equivalent (FTE1) teachers 2 and support staff 2 in publicly 3 funded schools.
England
Full-time regular qualified 5
Part-time FTE regular qualified 5

Table 1 continued
January 2000, 2005 to 2010 and November 2010 and 2011
(Thousands)
2000 2005 2006 2007 2008 2009 2010 2010 2011
1.1 2.3 2.9 4.0 6.2 9.8 15.3 22.8 79.3.. .. .. .. .. .. .. 19.1 67.2.. .. .. .. .. .. .. 1.5 8.2
Unqualified FTE teachers 6 .. .. .. .. .. .. .. 2.2 3.9.. .. .. .. .. .. .. 0.7 1.1
Total Teachers .. .. .. .. .. .. .. 23.5 80.5
FTE regular teaching assistants 7,8 - 0.2 0.4 0.8 1.3 2.1 3.7 6.2 20.8FTE regular other support staff 9 0.4 0.9 1.2 1.8 2.9 4.9 7.7 .. 27.0FTE auxiliary staff 10 .. .. .. .. .. .. .. .. 11.2Headcount third party support staff 11 .. .. .. .. .. .. .. .. 6.2
1.6 3.5 4.5 6.6 10.4 16.8 26.7 38.4 138.4
405.8 434.2 438.4 439.3 441.1 442.6 448.0 448.1 438.0.. .. .. .. .. .. .. 370.1 361.0.. .. .. .. .. .. .. 60.3 61.2
Unqualified FTE teachers 6 .. .. .. .. .. .. .. 17.8 15.8.. .. .. .. .. .. .. 12.2 11.5
Total Teachers .. .. .. .. .. .. .. 460.3 449.5
FTE regular teaching assistants 7,8 79.0 147.2 153.5 163.8 177.0 183.7 194.2 213.9 219.8FTE regular other support staff 9 83.0 118.7 135.6 144.4 149.6 162.2 168.6 .. 133.9FTE auxiliary staff 10 .. .. .. .. .. .. .. .. 84.2Headcount third party support staff 11 .. .. .. .. .. .. .. .. 41.1
567.8 700.1 727.6 747.5 767.7 788.5 810.9 .. 875.9Sources: Form 618g and the School Census (January 2000 to 2010) and School Workforce Census (November 2010 to 2011)
3. Publicly funded schools include all local authority maintained schools, academies and city technology colleges. Excludes direct nurseries.
Numbers below 50 are rounded to nil or negligible... Not available.- Nil or negligible.
Totals may not appear equal to the sum of the component parts because of rounding.
12. Excludes third party support staff and the headcount of occasional teachers. 2011 figures include auxiliary staff which are not present for earlier years.13. The "Centrally Employed" category from November 2010 includes all staff who are employed directly by local authorities who are either teachers or support staff who spend the majority of their time in schools. In earlier years this section only includes staff employed in pupil referral units and in the delivery of education outside of schools. Previously these centrally employed staff were apportioned between the primary and secondary phases.
8. Includes higher level teaching assistants, special needs, minority ethnic pupil support staff and other staff with pupil support roles.9. The actual hours worked which is used to calculate the FTE of support staff was not collected in the November 2010 School Workforce Census and therefore this figure is not available.10. Includes staff employed in roles which were not collected by the Department before November 2010. These include catering and school maintenance staff. The FTE is not available for these staff prior to November 2011.
11. Third party support staff were not directly employed by the school or the local authority but were in service in the school on the census day.
Head count occasional teachers
Total regular FTE workforce 12
1. Part-time FTE is calculated as a proportion of the full-time hours that part-time teachers have worked. Total FTE is the total head count of full-time plus the FTE proportion of part-time staff.2. From 2000 to 2009 teacher numbers were sourced from Form 618g and teaching assistant and support staff numbers were sourced from the School Census. During the same period all data on academies was sourced from the School Census. The January 2010 figures were derived from both Form 618g and the School Workforce Census (SWF). 83 local authorities provided complete SWF returns of a good enough quality to include in the National Statistics. The November 2010 figures are all sourced from the SWF.
4. Excludes occasional teachers.5. Teachers who have attained qualified teacher status. 6. An unqualified teacher is either a trainee working towards QTS; an overseas trained teacher who has not exceeded the four years they are allowed to teach without having QTS; or an instructor who has a particular skill who can be employed for so long as a qualified teacher is not available.
7. The total number of full-time equivalent teaching assistants was estimated for November 2010 due to 15% of teaching assistants having missing "hours worked" data. To produce this estimate it has been assumed the teaching assistants with missing data have similar hours worked to those for whom we received data.
Full-time regular qualified 5
Part-time FTE regular qualified 5
Total regular FTE teachers 4
Head count occasional teachers
Full-time equivalent (FTE1) teachers 2 and support staff 2 in publicly 3 funded schools.
England
Total regular FTE workforce 12
TOTAL PUBLICLY FUNDED SCHOOLS 3
Part-time FTE regular qualified 5
Total regular FTE teachers 4
Full-time regular qualified 5
NOVEMBER
ACADEMIES
JANUARY
Table 1

January 2002, 2005 to 20102, November 2010 and 2011
(Thousands)
2002 2005 2006 2007 2008 2009 2010 2010 2011
NURSERY AND PRIMARY
TeachersFull-time Heads 18.5 18.0 17.8 17.6 17.2 17.1 16.8 16.0 15.4Full-time deputy heads 14.2 13.0 12.6 12.4 11.9 11.8 11.7 11.1 10.8Full-time assistant heads 1.8 3.0 3.8 5.2 6.0 6.4 6.5 6.2 6.4Part-time FTE leadership 0.2 0.5 0.7 0.9 1.1 1.4 1.6 . 2.4All FTE classroom and others 3 158.3 155.5 157.1 155.6 156.7 157.2 160.4 . 155.6
Total FTE qualified teachers 193.0 189.9 192.0 191.6 192.9 193.8 197.0 192.2 190.7Total FTE unqualified teachers 4 4.3 6.4 6.2 5.5 5.2 4.8 3.9 4.1 4.2Head count occasional teachers 10.1 8.6 7.4 7.5 7.4 7.0 8.2 7.9 7.5
Total teachers 207.4 204.8 205.6 204.6 205.5 205.6 209.1 204.2 202.5
Teaching assistantsTeaching assistants 5 44.9 70.6 71.4 77.6 86.5 90.0 98.3 . 123.5
of which higher level teaching assistants . . 3.7 6.1 7.9 9.3 10.9 . 8.0Special needs support staff 24.9 25.4 25.6 26.0 26.3 26.2 26.0 . 10.0Minority ethnic pupil support staff 1.9 1.9 2.0 2.2 2.2 2.1 2.1 . 0.5
Total 71.8 97.9 99.0 105.8 115.0 118.3 126.3 133.5 134.1
Administrative staffSchool secretaries and managers 6 14.8 13.9 16.7 16.7 17.6 17.7 17.8 . 8.7Bursars and finance managers 1.9 2.9 3.2 3.7 4.2 4.8 5.3 . 6.8Other admin/clerical staff 6.7 8.9 6.7 7.2 6.6 7.0 7.4 . 18.8
Total 23.4 25.7 26.6 27.6 28.4 29.5 30.4 . 34.3
Technicians 7 0.6 1.3 1.5 1.6 1.7 1.8 1.7 . 1.5
Other Support StaffMatrons/nurses/medical staff 0.5 0.5 0.5 0.4 0.4 0.4 0.4 . 1.3Child care staff - . . . . . . . 8.3Other education support staff 8 26.5 19.0 26.7 27.7 27.1 31.4 30.9 . 3.3
Total 27.0 19.5 27.2 28.2 27.4 31.8 31.3 . 12.8
Auxiliary staff 9 . . . . . . . . 39.1
Headcount third party support staff 10 . . . . . . . . 20.9
Total FTE Workforce 11 320.1 340.8 352.6 360.2 370.7 380.0 390.6 . 416.8
SECONDARY
TeachersFull-time Heads 3.6 3.5 3.5 3.5 3.4 3.3 3.2 2.9 2.1Full-time deputy heads 6.0 5.8 5.6 5.6 5.5 5.5 5.3 4.7 3.3Full-time assistant heads 7.1 9.5 10.0 11.0 11.4 11.5 11.4 10.2 7.6Part-time FTE leadership 0.1 0.1 0.2 0.2 0.3 0.4 0.7 . 0.5All FTE classroom and others 3 179.8 185.1 186.6 186.6 184.4 181.6 180.7 . 119.2
Total FTE qualified teachers 196.5 204.1 205.9 206.9 205.0 202.3 201.2 187.5 132.7Total FTE unqualified teachers 4 6.6 11.0 10.4 9.9 10.2 10.3 9.0 8.1 5.4Head count occasional teachers 6.4 5.7 4.6 4.8 4.6 4.1 3.7 3.2 2.4
Total teachers 209.5 220.8 220.9 221.7 219.9 216.6 213.9 198.8 140.4
Teaching assistantsTeaching assistants 5 4.7 13.9 17.6 19.9 23.1 24.7 26.2 . 29.1
of which higher level teaching assistants . . 1.2 2.0 2.6 3.1 3.5 . 1.8Special needs support staff 14.4 15.6 15.4 15.2 14.1 13.9 13.0 . 5.9Minority ethnic pupil support staff 0.4 0.5 0.5 0.6 0.7 0.7 0.6 . 0.2
Total 19.5 30.0 33.5 35.7 37.8 39.3 39.9 45.4 35.2
Administrative staffSchool secretaries and managers 6 9.4 13.0 13.3 13.9 16.2 17.4 18.0 . 4.1Bursars and finance managers 2.7 3.0 3.2 3.3 3.3 3.3 3.3 . 3.8Other admin/clerical staff 11.5 14.0 16.4 18.1 17.0 17.3 16.8 . 16.5
Total 23.6 30.0 32.9 35.3 36.6 37.9 38.1 . 24.4
Technicians 7 15.6 19.9 21.0 21.5 21.9 22.0 21.5 . 13.9
Other Support StaffMatrons/nurses/medical staff 0.7 0.7 0.7 0.7 0.7 0.7 0.7 . -Child care staff - . . . . . . . 0.3Other education support staff 8 9.3 12.4 16.0 18.9 20.7 23.1 25.8 . 7.2
Total 9.9 13.1 16.8 19.6 21.4 23.8 26.5 . 7.5
Auxiliary staff 9 . . . . . . . . 15.4
Headcount third party support staff 10 . . . . . . . . 11.5
Total FTE Workforce 11 271.8 308.1 320.5 328.9 333.0 335.6 336.3 324.8 234.6
continuued overleaf
Table 2Full-time equivalent (FTE) teachers, teaching assistants and other support staff in publicly funded schools by sector and grade 1 or post.
England
JANUARY NOVEMBER

Table 2 continued
January 2002, 2005 to 20102, November 2010 and 2011
(Thousands)
2002 2005 2006 2007 2008 2009 2010 2010 2011
SPECIAL AND CENTRALLY EMPLOYED 12
TeachersFull-time Heads 1.3 1.4 1.4 1.4 1.4 1.4 1.1 1.2 1.2Full-time deputy heads 1.2 1.2 1.2 1.2 1.3 1.3 1.1 1.1 1.1Full-time assistant heads 0.4 0.7 0.9 1.1 1.2 1.2 1.2 1.2 1.2Part-time FTE leadership - 0.1 0.1 0.1 0.1 0.1 0.2 . 0.3All FTE classroom and others 3 15.5 15.9 16.2 16.1 16.1 16.2 16.5 . 19.7
Total FTE qualified teachers 18.5 19.3 19.8 20.0 20.2 20.3 20.1 30.0 23.4Total FTE unqualified teachers 4 0.6 1.2 1.3 1.3 1.3 1.4 1.5 3.3 2.2Head count occasional teachers 1.0 0.9 0.9 0.9 0.7 0.6 0.6 0.5 0.5
Total teachers 20.0 21.4 22.0 22.2 22.2 22.3 22.2 33.8 26.1
Teaching assistantsTeaching assistants 5 6.7 12.0 13.9 14.3 15.7 16.3 16.1 . 24.2
of which higher level teaching assistants . . 0.6 0.9 1.2 1.5 1.6 . 1.4Special needs support staff 7.3 7.0 6.6 7.1 7.1 7.7 8.1 . 5.4Minority ethnic pupil support staff 0.1 0.1 0.1 0.1 0.1 0.1 0.1 . 0.1
Total 14.1 19.1 20.6 21.6 22.8 24.0 24.3 28.8 29.7
Administrative staffSchool secretaries and managers 6 1.2 1.3 1.4 1.4 1.4 1.5 1.6 . 1.0Bursars and finance managers 0.3 0.4 0.4 0.4 0.5 0.5 0.5 . 1.0Other admin/clerical staff 1.1 1.3 1.2 1.3 1.5 1.6 1.7 . 4.8
Total 2.5 2.9 3.0 3.1 3.4 3.6 3.9 . 6.8
Technicians 7 0.3 0.4 0.4 0.4 0.5 0.5 0.5 . 0.8
Other Support StaffMatrons/nurses/medical staff 0.4 0.5 0.5 0.4 0.4 0.4 0.4 . 0.2Child care staff 1.3 1.8 1.6 1.8 1.6 1.4 1.3 . 1.4Other education support staff 8 3.4 2.6 2.9 3.1 3.3 4.4 5.3 . 3.2
Total 5.1 4.8 5.0 5.3 5.3 6.3 7.0 . 4.8
Auxiliary staff 9 . . . . . . . . 18.4
Headcount third party support staff 10 . . . . . . . . 2.6
Total FTE Workforce 11 40.9 47.8 50.0 51.7 53.5 56.1 57.2 80.1 86.1
TOTAL MAINTAINED SECTOR
TeachersFull-time Heads 23.4 22.9 22.7 22.5 22.1 21.8 21.1 20.1 18.8Full-time deputy heads 21.4 20.0 19.4 19.2 18.7 18.6 18.2 16.8 15.2Full-time assistant heads 9.3 13.2 14.8 17.4 18.5 19.1 19.0 17.6 15.2Part-time FTE leadership 0.3 0.7 1.0 1.2 1.5 1.9 2.5 . 3.2All FTE classroom and others 3 353.6 356.5 359.8 358.2 357.3 355.0 357.6 . 294.5
Total FTE qualified teachers 408.0 413.3 417.6 418.5 418.1 416.4 418.4 409.6 346.8Total FTE unqualified teachers 4 11.5 18.6 17.9 16.7 16.8 16.4 14.4 15.6 11.9Head count occasional teachers 17.5 15.1 12.9 13.2 12.8 11.7 12.5 11.6 10.4
Total teachers 436.9 447.0 448.4 448.4 447.6 444.5 445.2 436.8 369.0
Teaching assistantsTeaching assistants 5 56.3 96.5 102.9 111.8 125.2 130.9 140.7 . 176.8
of which higher level teaching assistants . . 5.5 9.0 11.7 13.9 16.0 . 11.2Special needs support staff 46.6 48.0 47.5 48.2 47.5 47.8 47.1 . 21.3Minority ethnic pupil support staff 2.4 2.5 2.7 3.0 3.0 2.9 2.8 . 0.8
Total 105.4 147.0 153.1 163.0 175.7 181.6 190.5 207.7 198.9
Administrative staffSchool secretaries and managers 6 25.4 28.3 31.4 31.9 35.3 36.6 37.4 . 13.8Bursars and finance managers 4.8 6.3 6.8 7.4 8.1 8.7 9.1 . 11.7Other admin/clerical staff 19.3 24.1 24.3 26.6 25.1 25.9 25.9 . 40.1
Total 49.5 58.7 62.5 66.0 68.5 71.1 72.3 . 65.5
Technicians 7 16.5 21.6 23.0 23.6 24.1 24.3 23.8 . 16.3
Other Support StaffMatrons/nurses/medical staff 1.6 1.7 1.7 1.6 1.5 1.5 1.4 . 1.5Child care staff 1.3 1.8 1.6 1.8 1.6 1.4 1.3 . 9.9Other education support staff 8 39.2 34.0 45.7 49.7 51.0 59.0 62.1 . 13.7
Total 42.1 37.5 48.9 53.1 54.1 61.9 64.8 . 25.1
Auxiliary staff 9 . . . . . . . . 72.9
Headcount third party support staff 10 . . . . . . . . 34.9
Total FTE Workforce 11 632.9 696.7 723.1 740.8 757.3 771.7 784.2 811.7 737.5
continued overleaf
Table 2Full-time equivalent (FTE) teachers, teaching assistants and other support staff in publicly funded schools by sector and grade 1 or post.
England
JANUARY NOVEMBER

Table 2 continued
January 2002, 2005 to 20102, November 2010 and 2011
(Thousands)
2002 2005 2006 2007 2008 2009 2010 2010 2011
ACADEMIES 16
TeachersFull-time Heads . . . . . . . 0.3 1.4Full-time deputy heads . . . . . . . 0.7 2.1Full-time assistant heads . . . . . . . 1.2 4.0Part-time FTE leadership . . . . . . . . 0.2All FTE classroom and others 3 . . . . . . . . 67.7
Total FTE qualified teachers . 2.1 2.6 3.5 5.5 8.8 13.6 20.7 75.4Total FTE unqualified teachers 4 . 0.3 0.3 0.5 0.8 1.0 1.7 2.2 3.9Head count occasional teachers . . . . . . . 0.7 1.1
Total teachers . . . . . . . 23.5 80.5
Teaching assistantsTeaching assistants 5 . 0.1 0.2 0.5 0.9 1.4 2.6 . 17.1
of which higher level teaching assistants . . - 0.1 0.1 0.2 0.3 . 1.1Special needs support staff . 0.1 0.2 0.3 0.4 0.6 1.0 . 3.6Minority ethnic pupil support staff . - - - - 0.1 0.1 . 0.1
Total . 0.2 0.4 0.8 1.3 2.1 3.7 6.2 20.8Administrative staff
School secretaries and managers 6 . 0.2 0.2 0.3 0.6 1.0 1.5 . 2.4Bursars and finance managers . - - 0.1 0.1 0.2 0.2 . 2.4Other admin/clerical staff . 0.2 0.2 0.4 0.6 0.9 1.5 . 9.6
Total . 0.4 0.5 0.8 1.3 2.0 3.3 . 14.4
Technicians 7 . 0.3 0.4 0.5 0.7 1.1 1.6 . 8.0
Other Support StaffMatrons/nurses/medical staff . - - - - - 0.1 . -Child care staff . - - - - - - . 0.4Other education support staff 8 . 0.2 0.3 0.5 0.8 1.7 2.7 . 4.1
Total . 0.2 0.3 0.5 0.9 1.8 2.8 . 4.5Auxiliary staff 9 . . . . . . . . 11.2
Headcount third party support staff 10 . . . . . . . . 6.2
Total FTE Workforce 11 . 3.5 4.5 6.6 10.4 16.8 26.7 38.4 138.4
TOTAL PUBLICLY FUNDED SCHOOLS
TeachersFull-time Heads . . . . . . . 20.5 20.1Full-time deputy heads . . . . . . . 17.5 17.3Full-time assistant heads . . . . . . . 18.8 19.2Part-time FTE leadership . . . . . . . . 3.4All FTE classroom and others 3 . . . . . . . . 362.1
Total FTE qualified teachers . 415.4 420.2 422.1 423.6 425.2 432.0 430.3 422.2Total FTE unqualified teachers 4 . 18.8 18.2 17.2 17.5 17.4 16.0 17.8 15.8Head count occasional teachers . . . . . . . 12.2 11.5
Total teachers . . . . . . . 460.3 449.5
Teaching assistantsTeaching assistants 5 . 96.6 103.1 112.3 126.1 132.4 143.3 . 194.0
of which higher level teaching assistants . . 5.5 9.0 11.8 14.1 16.3 . 12.3Special needs support staff . 48.1 47.7 48.5 47.9 48.4 48.1 . 24.9Minority ethnic pupil support staff . 2.6 2.7 3.0 3.0 2.9 2.9 . 0.9
Total . 147.2 153.5 163.8 177.0 183.7 194.2 213.9 219.8Administrative staff
School secretaries and managers 6 . 28.5 31.6 32.3 35.8 37.6 38.9 . 16.2Bursars and finance managers . 6.3 6.8 7.5 8.2 8.8 9.3 . 14.0Other admin/clerical staff . 24.3 24.6 26.9 25.7 26.7 27.4 . 49.7
Total . 59.0 63.0 66.7 69.7 73.1 75.6 . 79.9Technicians 7 . 21.9 23.3 24.1 24.9 25.4 25.4 . 24.3Other Support Staff
Matrons/nurses/medical staff . 1.7 1.7 1.6 1.5 1.6 1.5 . 1.6Child care staff . 1.8 1.6 1.8 1.6 1.4 1.3 . 10.3Other education support staff 8 . 34.2 46.0 50.2 51.8 60.7 64.8 . 17.8
Total . 37.7 49.3 53.6 55.0 63.7 67.6 . 29.7Auxiliary staff 9 . . . . . . . . 84.2Headcount third party support staff 10 . . . . . . . . 41.1Total FTE Workforce 11 . 700.1 727.6 747.5 767.7 788.5 810.9 850.1 875.9
Source: (Form 618g (teachers) and the School Census (support staff) (January 2002 to 2010)) and School Workforce Census (November 2010 and 2011)
3. Includes advanced skilled teachers, excellent teachers and post-threshold teachers.
7. Includes laboratory assistants, design technology assistants, home economics and craft technicians and IT technicians.
Numbers below 50 are rounded to nil or negligible. . Not applicable. - Nil or negligible.Totals may not appear equal to the sum of the component parts because of rounding.
10. Third party support staff are staff that are not directly employed by the school or the local authority but were in service in the school on the census day.11. Excludes third party support staff.
12. The "Centrally Employed" category for November 2010 includes all staff who are employed directly by local authorities who are either teachers or support staff who spend the majority of their time in schools. In earlier years this section only includes staff employed in pupil referral units and in the delivery of education outside of schools. Previously these centrally employed staff were apportioned between the primary and secondary phases.
9. These staff are employed in posts that were not previously collected. Examples of staff included are those employed in catering and school maintenance.
Table 2Full-time equivalent (FTE) teachers, teaching assistants and other support staff in publicly funded schools by sector and grade 1 or post.
England
6. Includes office data and premises and other administrative managers excluding finance and business managers who are included with bursars.
8. Includes librarians, welfare assistants, pastorsal support workers employed at the school and any other non-teaching staff regularly employed at the school not covered under teaching assistants prior to November 2010 it included learning mentors.
JANUARY NOVEMBER
1. 2002 is the earliest data available by grade for both full and part-time except for individual leadership grades which are only available seperately for full-time only from November 2010 and 2011.2. January 2010 teacher figures are based on 83 local authority SWF returns and 69 local authority 618g returns. The definitions used in the SWF are as close as possible to the 618g survey.
4. An unqualified teacher is either a trainee working towards QTS; an overseas trained teacher who has not exceeded the four years they are allowed to teach without having QTS; or an instructor who has a particular skill who can be employed for so long as a qualified teacher is not available.
5. Includes higher level teaching assistants, nursery nurses, nursery assistants, literacy and numeracy support staff, learning mentors and any other non-teaching staff regularly employed to support teachers in the classroom except for special needs and minority ethnic pupils support staff.

November 2011England
(Thousands)
NURSERY AND
PRIMARY SECONDARY SPECIALCENTRALLY EMPLOYED
TOTAL MAINTAINED
SECTOR ACADEMIES
TOTAL PUBLICLY FUNDED
SCHOOLS
Full-time head count 158.8 117.3 11.8 5.9 293.8 67.2 361.0Part-time FTE 31.9 15.3 2.1 3.6 53.0 8.2 61.2
190.7 132.7 13.9 9.5 346.8 75.4 422.2
Full-time head count 3.6 4.6 0.9 0.7 9.8 3.4 13.2Part-time FTE 0.6 0.8 0.2 0.4 2.1 0.5 2.6
4.2 5.4 1.1 1.2 11.9 3.9 15.8
TOTAL TEACHERS
Full-time head count 162.4 121.9 12.7 6.7 303.6 70.6 374.2Part-time FTE 32.6 16.2 2.3 4.0 55.1 8.8 63.8
194.9 138.1 15.0 10.7 358.7 79.3 438.0
7.5 2.4 0.5 - 10.4 1.1 11.5
TEACHING ASSISTANTSFull-time head count 17.8 11.7 6.5 2.3 38.4 7.0 45.4Part-time FTE 116.3 23.4 17.3 3.5 160.6 13.8 174.4
Full-time equivalent 134.1 35.2 23.9 5.8 198.9 20.8 219.8
OTHER SUPPORT STAFFFull-time head count 19.9 29.2 3.5 3.7 56.3 17.7 73.9Part-time FTE 28.8 16.7 2.8 2.4 50.7 9.3 60.0
Full-time equivalent 48.6 45.9 6.3 6.1 106.9 27.0 133.9
AUXILIARY STAFF Full-time head count 7.8 5.5 0.8 0.9 15.0 4.2 19.2Part-time FTE 31.3 10.0 2.5 14.1 57.9 7.0 64.9
Full-time equivalent 39.1 15.4 3.4 15.0 72.9 11.2 84.1
THIRD PARTY SUPPORT STAFF 3 20.9 11.5 2.6 - 34.9 6.2 41.1
TOTAL WORKFORCE 4
Full-time head count 207.8 168.3 23.6 13.6 413.2 99.5 512.7Part-time FTE 209.0 66.2 25.0 24.0 324.2 38.9 363.2
Full-time equivalent 416.8 234.6 48.5 37.6 737.5 138.4 875.9
Source: School Workforce Census
Totals may not appear equal to the sum of the component parts because of rounding.
- Nil or negligible.
Table 3Head count and full-time equivalent numbers of regular qualified 1 and unqualified 2 teachers, occasional teachers, teaching assistants and support staff in publicly funded schools by sector.
QUALIFIED TEACHERS 1
Total regular FTE
UNQUALIFIED TEACHERS 2
Total regular FTE
1. Teachers who have attained qualified teacher status. 2. An unqualified teacher is either a trainee working towards QTS; an overseas trained teacher who has not exceeded the four years they are allowed to teach without having QTS; or an instructor who has a particular skill who can be employed for so long as a qualified teacher is not available. 3. Third party support staff are staff that are not directly employed by the school or the local authority but were in service in the school on the census 4. Excludes occassionals.
Total regular FTE
OCCASIONAL TEACHERSTotal head count

November 2011
(Thousands)
Heads
Deputy and
assistant heads
Classroom teachers 4
Total qualified Unqualified Total Heads
Deputy and
assistant heads
Classroom teachers 4
Total qualified Unqualified Total
Under 25 - - 1.3 1.3 0.2 1.4 - - 1.6 1.6 0.3 1.925-29 - 0.1 3.9 4.1 0.3 4.3 - 0.1 7.0 7.0 0.4 7.430-34 0.1 0.7 3.8 4.6 0.2 4.8 - 0.4 8.1 8.6 0.2 8.835-39 0.7 0.9 2.8 4.3 0.1 4.4 0.1 1.1 6.5 7.6 0.2 7.840-44 0.9 0.7 2.1 3.7 0.1 3.8 0.2 1.2 5.6 7.0 0.2 7.145-49 0.9 0.5 1.7 3.1 - 3.2 0.3 0.9 4.8 6.0 0.1 6.250-54 0.8 0.3 1.2 2.3 - 2.3 0.4 1.0 4.6 5.9 0.1 6.055-59 0.9 0.3 1.0 2.2 - 2.2 0.3 0.8 3.8 4.9 0.1 5.060 and over 0.2 0.1 0.3 0.6 - 0.6 0.1 0.1 1.2 1.4 0.1 1.4All ages 4.6 3.5 18.1 26.1 0.9 27.0 1.3 5.7 43.0 50.0 1.8 51.8
Under 25 - - 10.9 10.9 0.5 11.4 - - 4.1 4.1 0.6 4.825-29 - 0.5 28.2 28.7 0.8 29.5 - 0.1 15.3 15.3 0.6 15.930-34 0.2 2.5 23.9 26.6 0.4 27.0 - 0.4 14.9 15.3 0.3 15.635-39 1.0 3.0 17.7 21.7 0.3 22.0 - 0.9 10.3 11.3 0.3 11.640-44 1.7 2.5 15.3 19.5 0.5 20.0 0.1 0.9 8.0 9.0 0.3 9.345-49 2.4 2.3 14.1 18.7 0.4 19.1 0.2 0.9 7.0 8.0 0.4 8.450-54 2.6 2.0 11.9 16.5 0.2 16.8 0.3 1.2 7.1 8.6 0.3 8.955-59 2.9 2.0 10.9 15.8 0.1 15.9 0.2 0.8 5.7 6.8 0.2 6.960 and over 0.6 0.4 2.6 3.6 0.1 3.7 - 0.1 1.4 1.6 0.1 1.6All ages 11.5 15.1 135.6 162.1 3.2 165.3 0.8 5.4 73.7 80.0 3.1 83.1
Under 25 - - 12.2 12.2 0.7 12.9 - - 5.7 5.7 1.0 6.725-29 - 0.6 32.2 32.8 1.0 33.9 - 0.1 22.2 22.4 1.0 23.430-34 0.3 3.2 27.7 31.2 0.6 31.8 - 0.9 23.0 23.9 0.6 24.535-39 1.7 3.9 20.5 26.1 0.4 26.5 0.1 2.0 16.8 18.9 0.5 19.440-44 2.6 3.2 17.4 23.2 0.6 23.8 0.3 2.2 13.5 15.9 0.5 16.545-49 3.3 2.7 15.8 21.8 0.4 22.3 0.4 1.8 11.8 14.1 0.6 14.650-54 3.5 2.3 13.1 18.8 0.3 19.1 0.7 2.1 11.7 14.5 0.4 14.955-59 3.8 2.3 11.9 18.0 0.2 18.1 0.6 1.6 9.5 11.7 0.3 12.060 and over 0.9 0.4 2.9 4.2 0.1 4.3 0.1 0.3 2.5 2.9 0.1 3.1All ages 16.1 18.6 153.8 188.4 4.1 192.5 2.2 11.1 116.9 130.1 5.0 135.1
MEN
Table 4Full-time equivalent number1 of regular qualified2 and unqualified 3 teachers in publicly funded schools by sector, grade, gender and age.
England
NURSERY AND PRIMARY SECONDARY
continued overleaf
WOMEN
MEN AND WOMEN 4

November 2011
(Thousands)
Heads
Deputy and
assistant heads
Classroom teachers 4
Total qualified Unqualified Total Heads
Deputy and
assistant heads
Classroom teachers 4
Total qualified Unqualified Total
Under 25 - - 0.1 0.1 - 0.1 - - - - - 0.125-29 - - 0.3 0.3 - 0.3 - - 0.2 0.2 0.1 0.230-34 - - 0.3 0.4 0.1 0.4 - - 0.2 0.2 0.1 0.335-39 - 0.1 0.4 0.5 - 0.5 - - 0.2 0.3 0.1 0.340-44 - 0.1 0.3 0.5 - 0.5 - - 0.2 0.3 0.1 0.445-49 0.1 0.1 0.3 0.5 - 0.5 - - 0.3 0.3 0.1 0.450-54 0.1 0.1 0.4 0.6 - 0.6 - - 0.3 0.4 0.1 0.555-59 0.1 0.1 0.4 0.6 - 0.7 - - 0.4 0.5 - 0.560 and over - - 0.2 0.2 - 0.2 - - 0.2 0.3 - 0.3All ages 0.4 0.6 2.6 3.6 0.3 3.9 0.1 0.2 2.1 2.4 0.5 2.9
Under 25 - - 0.2 0.2 - 0.2 - - 0.1 0.1 - 0.225-29 - - 1.0 1.1 0.1 1.2 - - 0.4 0.4 0.1 0.530-34 - 0.1 1.2 1.3 0.1 1.4 - - 0.6 0.6 0.1 0.735-39 - 0.2 1.1 1.2 0.1 1.3 - - 0.6 0.7 0.1 0.840-44 - 0.2 0.9 1.1 0.1 1.2 - 0.1 0.8 0.9 0.1 1.045-49 0.1 0.2 1.1 1.4 0.1 1.5 - 0.1 1.0 1.1 0.1 1.250-54 0.2 0.3 1.2 1.6 0.1 1.7 0.1 0.1 1.1 1.3 0.1 1.355-59 0.1 0.3 1.3 1.8 - 1.8 0.1 0.1 1.3 1.5 0.1 1.660 and over - 0.1 0.3 0.4 - 0.5 - - 0.6 0.6 - 0.7All ages 0.5 1.4 8.4 10.2 0.6 10.9 0.2 0.4 6.5 7.1 0.7 7.8
Under 25 - - 0.3 0.3 - 0.3 - - 0.2 0.2 0.1 0.225-29 - - 1.3 1.3 0.2 1.5 - - 0.6 0.6 0.1 0.730-34 - 0.1 1.5 1.7 0.1 1.8 - - 0.8 0.8 0.2 1.035-39 - 0.3 1.4 1.7 0.1 1.8 - 0.1 0.9 0.9 0.1 1.140-44 0.1 0.2 1.3 1.6 0.1 1.7 - 0.1 1.0 1.2 0.2 1.345-49 0.2 0.3 1.4 1.9 0.2 2.1 0.1 0.1 1.2 1.4 0.2 1.550-54 0.3 0.4 1.6 2.2 0.1 2.4 0.1 0.1 1.4 1.6 0.2 1.855-59 0.3 0.5 1.7 2.4 0.1 2.5 0.1 0.1 1.7 2.0 0.1 2.160 and over 0.1 0.1 0.5 0.6 - 0.7 - - 0.8 0.9 0.1 1.0All ages 0.9 1.9 11.0 13.8 1.0 14.8 0.4 0.5 8.6 9.5 1.2 10.7
continued overleaf
Table 4 continued
Table 4Full-time equivalent number1 of regular qualified2 and unqualified 3 teachers in publicly funded schools by sector, grade, gender and age.
WOMEN
MEN AND WOMEN 5
England
SPECIAL CENTRALLY EMPLOYED
MEN

Table 4 continued
November 2011
(Thousands)
Heads
Deputy and
assistant heads
Classroom teachers 4
Total qualified Unqualified Total Heads
Deputy and
assistant heads
Classroom teachers 4
Total qualified Unqualified Total
Under 25 - - 2.9 2.9 0.5 3.5 - - 1.1 1.1 0.3 1.425-29 - 0.2 11.3 11.5 0.8 12.3 - - 4.3 4.3 0.4 4.730-34 0.2 1.2 12.5 13.8 0.5 14.3 - 0.3 4.4 4.7 0.2 4.935-39 0.8 2.1 9.9 12.8 0.4 13.1 0.1 0.7 3.6 4.3 0.1 4.540-44 1.1 2.0 8.2 11.4 0.3 11.7 0.1 0.7 3.1 3.9 0.1 4.145-49 1.3 1.5 7.1 9.9 0.3 10.2 0.2 0.5 2.5 3.1 0.1 3.250-54 1.3 1.4 6.5 9.2 0.3 9.5 0.2 0.5 2.5 3.1 0.1 3.255-59 1.4 1.2 5.6 8.2 0.2 8.4 0.2 0.4 2.0 2.6 0.1 2.660 and over 0.3 0.2 1.9 2.4 0.1 2.5 0.1 0.1 0.7 0.8 0.1 0.9All ages 6.4 9.9 65.9 82.2 3.4 85.6 0.8 3.2 24.0 28.0 1.4 29.4
Under 25 - - 15.4 15.4 1.2 16.6 - - 2.9 2.9 0.5 3.425-29 - 0.5 44.9 45.5 1.6 47.0 - 0.1 9.3 9.4 0.5 9.930-34 0.2 3.0 40.5 43.8 0.9 44.7 - 0.4 8.3 8.7 0.3 9.035-39 1.0 4.1 29.7 34.9 0.7 35.6 - 0.5 5.7 6.2 0.2 6.440-44 1.9 3.6 25.0 30.5 1.0 31.5 0.1 0.5 4.4 5.0 0.3 5.345-49 2.7 3.5 23.1 29.2 1.0 30.2 0.1 0.5 4.0 4.6 0.3 4.950-54 3.2 3.6 21.3 28.0 0.7 28.7 0.2 0.6 3.8 4.6 0.2 4.855-59 3.3 3.3 19.3 25.9 0.4 26.3 0.2 0.4 3.1 3.7 0.1 3.860 and over 0.8 0.6 4.9 6.3 0.2 6.5 - 0.1 0.8 0.9 - 1.0All ages 13.0 22.2 224.1 259.4 7.7 267.1 0.6 3.1 42.3 46.0 2.4 48.4
Under 25 - - 18.4 18.4 1.7 20.2 - - 4.0 4.0 0.8 4.725-29 - 0.7 56.3 57.1 2.4 59.5 - 0.1 13.7 13.8 0.9 14.630-34 0.4 4.2 53.0 57.6 1.5 59.1 - 0.7 12.7 13.4 0.5 13.935-39 1.8 6.2 39.6 47.7 1.1 48.8 0.1 1.2 9.3 10.6 0.3 10.940-44 3.0 5.7 33.2 41.9 1.4 43.3 0.2 1.3 7.5 8.9 0.4 9.345-49 4.0 5.0 30.2 39.2 1.3 40.5 0.3 1.0 6.5 7.7 0.4 8.150-54 4.5 4.9 27.8 37.2 0.9 38.2 0.4 1.0 6.3 7.7 0.3 8.055-59 4.7 4.5 24.9 34.1 0.6 34.7 0.4 0.8 5.1 6.3 0.2 6.560 and over 1.1 0.8 6.8 8.7 0.3 9.0 0.1 0.2 1.5 1.7 0.1 1.8All ages 19.5 32.1 290.3 341.9 11.3 353.1 1.4 6.3 66.5 74.1 3.9 78.0
continued overleaf
Table 4Full-time equivalent number1 of regular qualified2 and unqualified 3 teachers in publicly funded schools by sector, grade, gender and age.
England
TOTAL MAINTAINED SECTOR ACADEMIES
MEN
WOMEN
MEN AND WOMEN 5

November 2011
(Thousands)
Heads
Deputy and
assistant heads
Classroom teachers 4
Total qualified Unqualified Total
Under 25 - - 4.0 4.0 0.8 4.825-29 - 0.2 15.6 15.9 1.1 17.030-34 0.2 1.5 16.8 18.5 0.7 19.235-39 0.8 2.8 13.4 17.1 0.5 17.640-44 1.2 2.8 11.3 15.3 0.5 15.845-49 1.5 2.0 9.6 13.0 0.4 13.450-54 1.5 1.8 9.0 12.3 0.3 12.755-59 1.6 1.6 7.6 10.8 0.2 11.160 and over 0.4 0.3 2.5 3.2 0.2 3.4All ages 7.2 13.0 89.9 110.2 4.8 115.0
Under 25 - - 18.3 18.3 1.7 20.025-29 - 0.6 54.3 54.9 2.1 56.930-34 0.2 3.4 48.9 52.5 1.2 53.735-39 1.1 4.6 35.4 41.1 0.9 42.040-44 1.9 4.2 29.4 35.5 1.3 36.845-49 2.8 3.9 27.0 33.8 1.3 35.150-54 3.3 4.2 25.1 32.6 0.9 33.555-59 3.5 3.7 22.4 29.6 0.6 30.160 and over 0.8 0.7 5.7 7.2 0.3 7.4All ages 13.6 25.3 266.5 305.4 10.1 315.5
Under 25 - - 22.4 22.4 2.5 24.925-29 - 0.8 70.0 70.8 3.2 74.130-34 0.4 4.9 65.7 71.0 2.0 73.035-39 1.9 7.5 48.9 58.3 1.4 59.740-44 3.2 6.9 40.8 50.9 1.8 52.745-49 4.3 6.0 36.6 46.9 1.7 48.550-54 4.9 6.0 34.1 45.0 1.3 46.255-59 5.1 5.3 30.0 40.4 0.8 41.260 and over 1.2 1.0 8.3 10.4 0.4 10.8All ages 20.9 38.4 356.7 416.0 15.2 431.1
Source: School Workforce Census
4. Includes Advanced Skills Teachers, post threshold and grade unknown.
Numbers below 50 are shown as nil or negligible.
Totals may not appear equal to the sum of the component parts because of rounding.
5. Includes gender unspecified, therefore totals may not equal to the sum of the component parts.
- Nil or negligible.
WOMEN
MEN AND WOMEN 5
2. Teachers who have attained qualified teacher status. 3. An unqualified teacher is either a trainee working towards QTS; an overseas trained teacher who has not exceeded the four years they are allowed to teach without having QTS; or an instructor who has a particular skill who can be employed for so long as a qualified teacher is not available.
1. Totals will not agree with tables 1 to 3 because no estimates are included for schools who did not submit a return for their staff. Please see paragraph 23 and 24 of the SFR technical notes for further information.
England
TOTAL PUBLICLY FUNDED SCHOOLS
MEN
Full-time equivalent number of regular qualified 1 and unqualified 2 teachers in publicly funded schools by sector, grade, gender and age.
Table 4 continued
Table 4

November 2011
(Percentages)
White - British 95.6 93.7 90.8 92.0 78.1 91.5 25.2 92.9 92.1 86.4 87.2 80.6 87.0 44.5White - Irish 1.5 1.4 2.0 1.8 2.0 1.8 0.5 3.2 2.3 1.8 1.9 1.5 1.9 1.0Any other white background 1.3 2.3 2.6 2.3 10.0 2.6 0.7 1.3 1.3 2.9 2.7 6.9 2.9 1.5White and Black Caribbean - 0.1 0.2 0.2 0.4 0.2 0.1 0.2 0.1 0.2 0.2 0.6 0.2 0.1White and Black African 0.1 0.1 0.1 0.1 0.3 0.1 - 0.1 - 0.1 0.1 0.1 0.1 0.1White and Asian 0.2 0.2 0.4 0.3 0.2 0.3 0.1 0.3 0.1 0.3 0.3 0.3 0.3 0.1Any other mixed background 0.1 0.3 0.4 0.3 0.4 0.3 0.1 0.2 0.1 0.3 0.3 0.4 0.3 0.1Indian 0.3 0.4 0.8 0.7 1.0 0.7 0.2 0.7 1.3 1.8 1.7 1.4 1.7 0.9Pakistani 0.1 0.3 0.4 0.3 0.8 0.3 0.1 0.2 0.6 1.3 1.2 1.5 1.2 0.6Bangladeshi - 0.1 0.4 0.3 0.3 0.3 0.1 - 0.1 0.6 0.5 0.7 0.5 0.3Any other Asian Background 0.1 0.1 0.4 0.3 0.4 0.3 0.1 0.2 0.4 0.6 0.6 0.7 0.6 0.3Black Caribbean 0.4 0.3 0.5 0.5 3.3 0.6 0.2 0.5 0.8 0.9 0.9 1.8 0.9 0.5Black - African - 0.2 0.4 0.3 1.4 0.4 0.1 0.2 0.4 1.6 1.4 1.6 1.4 0.7Any other Black background - 0.1 0.1 0.1 0.5 0.1 - 0.1 0.1 0.3 0.3 0.8 0.3 0.2Chinese - - 0.1 0.1 - 0.1 - - 0.1 0.1 0.1 0.3 0.1 0.1Any other ethnic group 0.2 0.4 0.4 0.4 1.1 0.4 0.1 - 0.4 0.7 0.6 0.8 0.6 0.3Ethnicity details provided 97.3 97.6 96.5 96.8 94.3 96.7 27.6 96.1 96.8 95.2 95.4 92.4 95.3 51.1Refused 0.6 0.4 0.6 0.6 0.5 0.6 0.2 0.8 0.5 1.1 1.0 1.0 1.0 0.5Information not yet obtained 2.1 2.1 2.9 2.7 5.2 2.8 0.8 3.1 2.7 3.7 3.6 6.6 3.7 2.0Numbers (Thousands) 4.7 3.5 19.2 27.4 1.1 28.5 1.3 5.7 44.4 51.5 2.2 53.7
White - British 94.7 92.7 91.0 91.3 75.1 91.0 169.2 90.7 91.3 85.3 85.7 76.8 85.3 74.2White - Irish 1.7 1.4 1.3 1.3 1.3 1.3 2.5 3.7 2.4 1.8 1.9 1.2 1.8 1.6Any other white background 1.0 1.5 2.3 2.1 13.7 2.4 4.4 1.2 2.1 4.5 4.3 10.0 4.6 4.0White and Black Caribbean 0.1 0.2 0.2 0.2 0.4 0.2 0.3 0.9 0.1 0.3 0.3 0.5 0.3 0.2White and Black African - - 0.1 0.1 0.2 0.1 0.1 0.1 0.1 0.1 0.1 0.2 0.1 0.1White and Asian 0.2 0.2 0.2 0.2 0.3 0.2 0.4 0.1 0.1 0.3 0.2 0.2 0.2 0.2Any other mixed background 0.2 0.2 0.3 0.3 0.7 0.3 0.5 0.5 0.2 0.4 0.4 0.5 0.4 0.3Indian 0.7 1.2 1.5 1.4 2.1 1.4 2.6 0.5 1.2 2.0 1.9 2.7 2.0 1.7Pakistani 0.2 0.5 0.8 0.7 1.3 0.7 1.4 0.2 0.3 1.0 0.9 1.3 1.0 0.8Bangladeshi 0.1 0.1 0.3 0.3 0.6 0.3 0.6 0.1 0.2 0.4 0.4 0.6 0.4 0.4Any other Asian Background 0.1 0.3 0.3 0.3 0.5 0.3 0.6 0.5 0.3 0.7 0.6 0.6 0.6 0.6Black Caribbean 0.7 1.0 0.8 0.8 1.1 0.8 1.5 0.6 1.1 1.3 1.3 2.0 1.3 1.1Black - African 0.1 0.3 0.3 0.3 0.7 0.3 0.6 0.2 0.3 0.9 0.8 1.1 0.8 0.7Any other Black background 0.1 0.2 0.1 0.1 0.3 0.1 0.3 0.4 0.1 0.3 0.3 0.3 0.3 0.2Chinese - 0.1 0.1 0.1 0.3 0.1 0.2 0.1 - 0.2 0.2 0.6 0.2 0.2Any other ethnic group 0.1 0.2 0.3 0.3 1.7 0.4 0.7 0.1 0.2 0.6 0.6 1.3 0.6 0.6Ethnicity details provided 98.1 97.8 97.0 97.1 94.8 97.1 186.0 97.4 96.8 95.5 95.6 92.9 95.5 87.0Refused 0.3 0.3 0.5 0.4 0.4 0.4 0.8 0.4 0.7 0.9 0.8 0.9 0.8 0.8Information not yet obtained 1.6 1.9 2.5 2.4 4.7 2.5 4.7 2.3 2.5 3.6 3.6 6.2 3.7 3.3Numbers (Thousands) 11.9 15.6 159.8 187.3 4.2 191.5 0.8 5.5 80.7 87.1 4.1 91.1
White - British 94.9 92.8 90.9 91.4 75.7 91.1 194.6 92.0 91.7 85.7 86.3 78.1 85.9 118.8White - Irish 1.6 1.4 1.4 1.4 1.5 1.4 3.0 3.4 2.3 1.8 1.9 1.3 1.9 2.6Any other white background 1.1 1.6 2.3 2.2 12.9 2.4 5.2 1.3 1.7 4.0 3.7 8.9 4.0 5.5White and Black Caribbean 0.1 0.2 0.2 0.2 0.4 0.2 0.4 0.4 0.1 0.2 0.2 0.5 0.2 0.3White and Black African - - 0.1 0.1 0.2 0.1 0.2 0.1 0.1 0.1 0.1 0.2 0.1 0.2White and Asian 0.2 0.2 0.3 0.2 0.2 0.2 0.5 0.2 0.1 0.3 0.3 0.3 0.3 0.4Any other mixed background 0.1 0.3 0.3 0.3 0.6 0.3 0.6 0.3 0.1 0.4 0.3 0.4 0.3 0.5Indian 0.6 1.1 1.4 1.3 1.8 1.3 2.9 0.6 1.3 1.9 1.8 2.3 1.9 2.6Pakistani 0.2 0.5 0.7 0.7 1.2 0.7 1.5 0.2 0.4 1.1 1.0 1.4 1.0 1.4Bangladeshi - 0.1 0.3 0.3 0.5 0.3 0.6 - 0.1 0.5 0.4 0.6 0.5 0.6Any other Asian Background 0.1 0.3 0.3 0.3 0.4 0.3 0.7 0.3 0.3 0.7 0.6 0.7 0.6 0.9Black Caribbean 0.6 0.9 0.8 0.8 1.6 0.8 1.7 0.6 0.9 1.1 1.1 1.9 1.2 1.6Black - African 0.1 0.3 0.3 0.3 0.9 0.3 0.7 0.2 0.4 1.1 1.0 1.3 1.1 1.5Any other Black background - 0.1 0.1 0.1 0.3 0.1 0.3 0.2 0.1 0.3 0.3 0.5 0.3 0.4Chinese - 0.1 0.1 0.1 0.2 0.1 0.2 - 0.1 0.2 0.2 0.5 0.2 0.3Any other ethnic group 0.1 0.3 0.4 0.3 1.5 0.4 0.8 - 0.3 0.7 0.6 1.1 0.6 0.9Ethnicity details provided 97.8 97.8 97.0 97.1 93.4 97.0 213.7 96.6 96.8 95.4 95.5 91.8 95.4 138.3Refused 0.4 0.3 0.5 0.5 0.4 0.5 1.0 0.6 0.6 0.9 0.9 0.9 0.9 1.3Information not yet obtained 1.8 1.9 2.6 2.4 6.2 2.5 5.6 2.8 2.6 3.7 3.6 7.2 3.7 5.4Numbers (Thousands) 16.7 19.1 179.1 214.9 5.4 220.3 2.2 11.2 125.2 138.6 6.4 145.0
continued overleaf
Heads
Deputies and assis-
tants
Class-room and others 5
Unqual-ified
teachersAll tea-chers
Total qual-ified
Table 5Proportions of the head count of regular 1 qualified 2 and unqualified 3 teachers 4 in publicly funded schools by sector, grade, gender and ethnic origin.
England
NURSERY AND PRIMARY SECONDARY
Number of teachers
(Thousands) Heads
Deputies and assis-
tants
Class-room and
others 5Total qual-
ified
Unqual-ified
teachers
MEN
WOMEN
MEN AND WOMEN 6
All tea-chers
Number of teachers
(Thousands)

Table 5 continued
November 2011
(Percentages)
MENWhite - British 94.3 94.2 88.6 90.1 83.3 89.5 3.5 90.3 88.3 88.1 88.2 87.2 88.0 2.8White - Irish 3.1 1.2 1.8 1.8 0.9 1.7 0.1 1.9 1.6 1.8 1.8 0.7 1.6 -Any other white background 1.8 1.9 5.1 4.2 7.6 4.5 0.2 4.9 4.7 4.4 4.4 6.1 4.8 0.2White and Black Caribbean - 0.2 0.2 0.2 0.9 0.3 - - 0.8 0.3 0.3 0.3 0.3 -White and Black African - - 0.1 0.1 0.3 0.1 - - - - - - - -White and Asian - 0.2 0.2 0.2 - 0.2 - 1.0 - 0.3 0.4 0.2 0.3 -Any other mixed background 0.3 - 0.3 0.2 0.6 0.3 - - 1.6 0.3 0.3 0.3 0.3 -Indian 0.3 0.4 0.6 0.5 0.9 0.6 - - - 0.9 0.9 1.2 0.9 -Pakistani - 0.2 0.6 0.5 0.3 0.5 - - - 0.3 0.3 0.3 0.3 -Bangladeshi - - 0.1 0.1 - 0.1 - - - 0.2 0.2 - 0.1 -Any other Asian Background 0.3 - 0.2 0.2 - 0.2 - - - 0.3 0.3 0.3 0.3 -Black Caribbean - 0.7 0.7 0.6 2.7 0.8 - - 1.6 1.0 1.0 1.7 1.1 -Black - African - 0.5 0.7 0.6 0.6 0.6 - 1.0 1.6 1.0 1.0 0.2 0.9 -Any other Black background - 0.4 0.2 0.2 0.9 0.3 - - - 0.4 0.4 0.5 0.4 -Chinese - - - - - - - - - 0.1 0.1 - 0.1 -Any other ethnic group - 0.2 0.6 0.5 0.9 0.5 - 1.0 - 0.7 0.7 0.9 0.7 -Ethnicity details provided 97.7 98.3 95.0 95.8 95.9 95.8 4.0 77.4 76.6 71.8 72.2 73.3 72.4 3.2Refused 0.5 0.3 0.9 0.8 0.6 0.8 - 2.3 1.2 2.4 2.4 4.6 2.8 0.1Information not yet obtained 1.8 1.4 4.1 3.4 3.5 3.4 0.1 20.3 22.2 25.8 25.4 22.1 24.8 1.1Numbers (Thousands) 0.4 0.6 2.8 3.8 0.3 4.1 0.1 0.2 3.3 3.6 0.8 4.4
WOMENWhite - British 95.9 94.3 90.2 91.0 84.7 90.6 10.7 91.1 90.7 91.8 91.8 82.2 91.0 10.4White - Irish 0.8 1.4 1.2 1.2 0.7 1.2 0.1 1.0 1.2 0.8 0.8 1.2 0.8 0.1Any other white background 1.4 2.1 4.8 4.3 8.9 4.6 0.5 3.0 2.5 3.2 3.2 8.6 3.6 0.4White and Black Caribbean 0.4 - 0.1 0.1 0.4 0.1 - - 0.3 0.1 0.1 0.6 0.2 -White and Black African 0.2 0.1 0.1 0.1 0.1 0.1 - 0.5 - 0.1 0.1 0.4 0.1 -White and Asian 0.2 0.1 0.3 0.2 0.1 0.2 - - - 0.1 0.1 - 0.1 -Any other mixed background 0.2 - 0.3 0.2 0.4 0.3 - 0.5 0.6 0.2 0.3 0.1 0.3 -Indian 0.4 0.4 0.8 0.8 1.1 0.8 0.1 - 0.6 1.0 1.0 1.3 1.0 0.1Pakistani - 0.1 0.2 0.2 0.7 0.2 - 0.5 - 0.2 0.2 0.2 0.2 -Bangladeshi - - 0.1 0.1 0.1 0.1 - 0.5 - - - 0.4 0.1 -Any other Asian Background 0.2 0.1 0.3 0.3 0.1 0.3 - - - 0.3 0.2 1.1 0.3 -Black Caribbean 0.2 0.7 0.8 0.7 1.5 0.8 0.1 2.0 2.8 0.8 0.9 0.7 0.9 0.1Black - African 0.2 0.4 0.2 0.3 0.1 0.2 - 0.5 - 0.3 0.3 0.9 0.4 -Any other Black background - 0.1 0.2 0.2 - 0.1 - 0.5 0.9 0.1 0.2 0.2 0.2 -Chinese - - 0.1 0.1 0.1 0.1 - - - 0.1 0.1 0.2 0.1 -Any other ethnic group - 0.4 0.4 0.4 0.9 0.4 - - 0.3 0.6 0.6 2.0 0.7 0.1Ethnicity details provided 97.2 97.1 96.3 96.5 98.3 96.6 11.8 80.6 83.2 74.0 74.3 74.6 74.3 11.4Refused 0.2 0.6 0.7 0.7 0.1 0.6 0.1 2.4 0.8 1.9 1.9 3.3 2.0 0.3Information not yet obtained 2.6 2.3 2.9 2.9 1.6 2.8 0.3 17.1 16.0 24.1 23.8 22.1 23.7 3.6Numbers (Thousands) 0.5 1.4 9.5 11.4 0.8 12.2 0.3 0.4 13.6 14.2 1.1 15.4
White - British 95.2 94.3 89.9 90.8 84.3 90.3 14.2 90.8 90.0 91.1 91.1 84.2 90.4 13.2White - Irish 1.8 1.4 1.3 1.4 0.7 1.3 0.2 1.3 1.3 1.0 1.0 1.0 1.0 0.1Any other white background 1.5 2.0 4.8 4.3 8.5 4.5 0.7 3.6 3.1 3.4 3.4 7.6 3.8 0.6White and Black Caribbean 0.2 0.1 0.2 0.1 0.6 0.2 - - 0.4 0.2 0.2 0.5 0.2 -White and Black African 0.1 0.1 0.1 0.1 0.2 0.1 - 0.3 - 0.1 0.1 0.2 0.1 -White and Asian 0.1 0.1 0.2 0.2 0.1 0.2 - 0.3 - 0.2 0.2 0.1 0.2 -Any other mixed background 0.2 - 0.3 0.2 0.5 0.3 - 0.3 0.9 0.3 0.3 0.2 0.3 -Indian 0.3 0.4 0.8 0.7 1.0 0.7 0.1 - 0.4 1.0 1.0 1.3 1.0 0.1Pakistani - 0.1 0.3 0.2 0.6 0.3 - 0.3 - 0.3 0.2 0.3 0.2 -Bangladeshi - - 0.1 0.1 0.1 0.1 - 0.3 - 0.1 0.1 0.2 0.1 -Any other Asian Background 0.2 0.1 0.3 0.2 0.1 0.2 - - - 0.3 0.3 0.8 0.3 -Black Caribbean 0.1 0.7 0.8 0.7 1.8 0.8 0.1 1.3 2.4 0.9 0.9 1.1 0.9 0.1Black - African 0.1 0.4 0.4 0.3 0.3 0.3 0.1 0.7 0.4 0.5 0.5 0.6 0.5 0.1Any other Black background - 0.2 0.2 0.2 0.3 0.2 - 0.3 0.7 0.2 0.2 0.3 0.2 -Chinese - - 0.1 - 0.1 0.1 - - - 0.1 0.1 0.1 0.1 -Any other ethnic group - 0.3 0.4 0.4 0.9 0.4 0.1 0.3 0.2 0.6 0.6 1.5 0.7 0.1Ethnicity details provided 97.4 97.5 96.0 96.3 93.3 96.1 15.7 79.5 81.3 73.5 73.9 74.0 73.9 14.6Refused 0.3 0.5 0.8 0.7 0.3 0.7 0.1 2.3 0.9 2.0 2.0 3.9 2.2 0.4Information not yet obtained 2.3 2.0 3.2 3.0 6.5 3.3 0.5 18.2 17.8 24.5 24.1 22.1 23.9 4.7Numbers (Thousands) 0.9 2.0 12.3 15.2 1.2 16.4 0.4 0.6 16.9 17.8 1.9 19.7
continued overleaf
SPECIAL CENTRALLY EMPLOYED
Table 5Proportions of the head count of regular 1 qualified 2 and unqualified 3 teachers 4 in publicly funded schools by sector, grade, gender and ethnic origin.
England
Heads
Deputies and assis-
tants
Class-room and others 5
Total qual-ified
Unqual-ified
teachersAll tea-chers
Number of teachers
(Thousands) HeadsAll tea-chers
Number of teachers
(Thousands)
MEN AND WOMEN 6
Deputies and assis-
tants
Class-room and
others 5Total qual-
ified
Unqual-ified
teachers

Table 5 continued
November 2011
(Percentages)
White - British 94.9 92.7 87.8 88.9 81.1 88.6 76.0 94.4 92.9 87.5 88.3 81.7 87.9 25.5White - Irish 1.9 1.9 1.9 1.9 1.5 1.8 1.6 2.0 1.3 1.7 1.6 1.5 1.6 0.5Any other white background 1.4 1.7 3.0 2.7 7.6 2.9 2.5 1.7 2.0 3.3 3.1 6.4 3.3 1.0White and Black Caribbean 0.1 0.1 0.2 0.2 0.5 0.2 0.2 - 0.1 0.2 0.2 0.7 0.2 0.1White and Black African 0.1 - 0.1 0.1 0.1 0.1 0.1 - - 0.2 0.1 0.1 0.1 -White and Asian 0.2 0.1 0.3 0.3 0.2 0.3 0.2 - 0.2 0.3 0.3 0.2 0.3 0.1Any other mixed background 0.1 0.2 0.3 0.3 0.4 0.3 0.3 0.1 0.3 0.3 0.3 0.7 0.3 0.1Indian 0.4 0.9 1.4 1.3 1.2 1.3 1.1 0.9 1.2 1.4 1.4 1.5 1.4 0.4Pakistani 0.1 0.4 1.0 0.8 1.0 0.8 0.7 - 0.4 0.8 0.7 1.0 0.7 0.2Bangladeshi - 0.1 0.5 0.4 0.4 0.4 0.4 - 0.2 0.3 0.3 0.5 0.3 0.1Any other Asian Background 0.2 0.3 0.5 0.5 0.5 0.5 0.4 0.1 0.2 0.5 0.5 0.8 0.5 0.1Black Caribbean 0.4 0.6 0.8 0.8 2.3 0.8 0.7 0.4 0.5 0.9 0.9 1.6 0.9 0.3Black - African 0.1 0.3 1.2 1.0 1.3 1.0 0.9 - 0.3 1.4 1.3 1.8 1.3 0.4Any other Black background - 0.1 0.3 0.2 0.7 0.3 0.2 0.3 0.1 0.3 0.3 0.4 0.3 0.1Chinese - 0.1 0.1 0.1 0.2 0.1 0.1 - 0.1 0.2 0.2 0.5 0.2 0.1Any other ethnic group 0.1 0.3 0.6 0.5 0.9 0.6 0.5 0.1 0.3 0.7 0.6 0.8 0.7 0.2Ethnicity details provided 96.7 96.8 94.4 94.9 89.7 94.6 85.8 96.1 96.1 94.4 94.6 89.5 94.3 29.0Refused 0.7 0.5 1.0 0.9 1.5 0.9 0.9 0.7 0.8 1.1 1.0 1.7 1.1 0.3Information not yet obtained 2.7 2.7 4.6 4.2 8.8 4.4 4.0 3.2 3.2 4.5 4.3 8.8 4.6 1.4Numbers (Thousands) 6.6 9.9 69.7 86.2 4.5 90.7 0.8 3.2 25.0 29.0 1.7 30.7
White - British 94.4 92.4 89.2 89.7 77.2 89.3 264.5 92.8 91.7 86.5 86.9 79.0 86.5 43.9White - Irish 1.8 1.6 1.4 1.5 1.2 1.4 4.3 1.3 1.3 1.4 1.4 1.7 1.4 0.7Any other white background 1.1 1.7 3.1 2.9 11.3 3.2 9.4 2.5 2.5 4.7 4.5 10.0 4.8 2.4White and Black Caribbean 0.2 0.2 0.2 0.2 0.4 0.2 0.6 0.4 0.2 0.2 0.2 0.3 0.2 0.1White and Black African - 0.1 0.1 0.1 0.2 0.1 0.3 - - 0.1 0.1 0.3 0.1 0.1White and Asian 0.2 0.1 0.2 0.2 0.2 0.2 0.7 0.5 0.3 0.2 0.2 0.3 0.2 0.1Any other mixed background 0.2 0.2 0.3 0.3 0.5 0.3 0.9 - 0.1 0.4 0.4 0.8 0.4 0.2Indian 0.7 1.2 1.6 1.5 2.2 1.5 4.6 0.7 0.8 1.9 1.8 1.6 1.8 0.9Pakistani 0.2 0.4 0.8 0.7 1.2 0.8 2.3 0.2 0.5 0.7 0.7 0.9 0.7 0.4Bangladeshi 0.1 0.1 0.3 0.3 0.5 0.3 0.9 0.2 0.1 0.2 0.2 0.2 0.2 0.1Any other Asian Background 0.1 0.3 0.4 0.4 0.6 0.4 1.2 - 0.4 0.5 0.5 0.4 0.5 0.3Black Caribbean 0.7 1.0 0.9 0.9 1.5 1.0 2.8 0.5 1.2 1.1 1.1 1.4 1.1 0.6Black - African 0.2 0.3 0.5 0.5 0.8 0.5 1.4 0.2 0.4 0.8 0.7 0.7 0.7 0.4Any other Black background 0.1 0.2 0.2 0.2 0.3 0.2 0.5 - 0.2 0.3 0.3 0.6 0.3 0.2Chinese - - 0.1 0.1 0.4 0.1 0.4 - 0.1 0.2 0.2 0.8 0.3 0.1Any other ethnic group 0.1 0.2 0.4 0.4 1.5 0.4 1.3 0.7 0.3 0.7 0.6 1.1 0.7 0.3Ethnicity details provided 97.7 97.3 95.3 95.6 92.1 95.5 296.2 95.2 95.1 94.5 94.6 90.2 94.3 50.7Refused 0.4 0.4 0.7 0.6 0.9 0.6 2.0 0.7 0.6 0.8 0.8 1.1 0.8 0.5Information not yet obtained 2.0 2.3 4.0 3.8 7.0 3.9 12.0 4.1 4.3 4.6 4.6 8.7 4.8 2.6Numbers (thousands) 13.5 22.9 263.6 300.0 10.2 310.2 0.6 3.2 47.0 50.8 3.0 53.8
White - British 94.6 92.5 88.9 89.5 78.4 89.1 340.8 93.8 92.3 86.8 87.4 79.9 87.0 69.4White - Irish 1.8 1.7 1.5 1.5 1.3 1.5 5.9 1.7 1.3 1.5 1.5 1.6 1.5 1.2Any other white background 1.2 1.7 3.1 2.9 10.2 3.1 11.9 2.0 2.2 4.2 4.0 8.7 4.3 3.4White and Black Caribbean 0.1 0.2 0.2 0.2 0.5 0.2 0.8 0.1 0.1 0.2 0.2 0.4 0.2 0.2White and Black African 0.1 0.1 0.1 0.1 0.2 0.1 0.4 - - 0.1 0.1 0.2 0.1 0.1White and Asian 0.2 0.1 0.3 0.2 0.2 0.2 0.9 0.2 0.2 0.2 0.2 0.3 0.2 0.2Any other mixed background 0.2 0.2 0.3 0.3 0.5 0.3 1.2 0.1 0.2 0.4 0.4 0.8 0.4 0.3Indian 0.6 1.1 1.6 1.5 1.9 1.5 5.7 0.8 1.0 1.7 1.6 1.6 1.6 1.3Pakistani 0.2 0.4 0.8 0.8 1.1 0.8 3.0 0.1 0.5 0.8 0.7 0.9 0.7 0.6Bangladeshi 0.1 0.1 0.4 0.3 0.5 0.3 1.3 0.1 0.1 0.2 0.2 0.3 0.2 0.2Any other Asian Background 0.1 0.3 0.4 0.4 0.5 0.4 1.6 0.1 0.3 0.5 0.5 0.5 0.5 0.4Black Caribbean 0.6 0.9 0.9 0.9 1.7 0.9 3.5 0.4 0.9 1.0 1.0 1.5 1.0 0.8Black - African 0.1 0.3 0.6 0.6 1.0 0.6 2.3 0.1 0.3 1.0 0.9 1.1 0.9 0.8Any other Black background 0.1 0.1 0.2 0.2 0.4 0.2 0.7 0.1 0.1 0.3 0.3 0.5 0.3 0.2Chinese - 0.1 0.1 0.1 0.3 0.1 0.5 - 0.1 0.2 0.2 0.7 0.2 0.2Any other ethnic group 0.1 0.3 0.5 0.4 1.3 0.5 1.8 0.4 0.3 0.7 0.6 1.1 0.7 0.5Ethnicity details provided 97.3 97.1 95.2 95.4 90.2 95.2 382.3 95.7 95.5 94.5 94.6 89.2 94.3 79.8Refused 0.5 0.5 0.7 0.7 1.1 0.7 2.9 0.7 0.7 0.9 0.9 1.3 0.9 0.8Information not yet obtained 2.2 2.4 4.1 3.9 8.7 4.1 16.3 3.6 3.8 4.6 4.5 9.5 4.8 4.1Numbers (Thousands) 20.1 32.8 333.5 386.5 14.9 401.4 1.4 6.4 72.1 79.8 4.8 84.6
continued overleaf
Table 5
Number of teachers
(Thousands) HeadsHeads
Deputies and assis-
tants
Class-room and others 5
Total qual-ified
Proportions of the head count of regular 1 qualified 2 and unqualified 3 teachers 4 in publicly funded schools by sector, grade, gender and ethnic origin.
England
TOTAL MAINTAINED SECTOR ACADEMIES
All tea-chers
Number of teachers
(Thousands)
MEN
WOMEN
Deputies and assis-
tants
Class-room and
others 5Total qual-
ified
Unqual-ified
teachers
Unqual-ified
teachersAll tea-chers
MEN AND WOMEN 6

Table 5 continued
November 2011
(Percentages)
White - British 94.8 92.8 87.7 88.8 81.3 88.4 101.5White - Irish 1.9 1.7 1.8 1.8 1.5 1.8 2.1Any other white background 1.4 1.8 3.1 2.8 7.3 3.0 3.5White and Black Caribbean 0.1 0.1 0.2 0.2 0.6 0.2 0.2White and Black African 0.1 - 0.1 0.1 0.1 0.1 0.1White and Asian 0.2 0.2 0.3 0.3 0.2 0.3 0.3Any other mixed background 0.1 0.2 0.3 0.3 0.5 0.3 0.3Indian 0.4 1.0 1.4 1.3 1.3 1.3 1.5Pakistani 0.1 0.4 0.9 0.8 1.0 0.8 0.9Bangladeshi - 0.1 0.4 0.4 0.5 0.4 0.4Any other Asian Background 0.2 0.3 0.5 0.5 0.6 0.5 0.6Black Caribbean 0.4 0.6 0.8 0.8 2.1 0.8 1.0Black - African 0.1 0.3 1.3 1.1 1.4 1.1 1.3Any other Black background 0.1 0.1 0.3 0.2 0.6 0.3 0.3Chinese - 0.1 0.1 0.1 0.3 0.1 0.1Any other ethnic group 0.1 0.3 0.6 0.6 0.9 0.6 0.7Ethnicity details provided 96.6 96.6 94.4 94.8 89.7 94.6 114.8Refused 0.7 0.6 1.0 1.0 1.5 1.0 1.2Information not yet obtained 2.7 2.8 4.5 4.2 8.8 4.5 5.4Numbers (Thousands) 7.4 13.1 94.6 115.2 6.2 121.4
White - British 94.4 92.3 88.8 89.3 77.6 88.9 308.4White - Irish 1.7 1.6 1.4 1.4 1.3 1.4 5.0Any other white background 1.1 1.8 3.3 3.1 11.0 3.4 11.8White and Black Caribbean 0.2 0.2 0.2 0.2 0.4 0.2 0.7White and Black African - 0.1 0.1 0.1 0.2 0.1 0.3White and Asian 0.2 0.2 0.2 0.2 0.2 0.2 0.8Any other mixed background 0.2 0.2 0.3 0.3 0.6 0.3 1.2Indian 0.7 1.1 1.6 1.6 2.1 1.6 5.5Pakistani 0.2 0.4 0.8 0.7 1.1 0.8 2.6Bangladeshi 0.1 0.1 0.3 0.3 0.4 0.3 1.0Any other Asian Background 0.1 0.3 0.4 0.4 0.5 0.4 1.5Black Caribbean 0.7 1.1 1.0 1.0 1.5 1.0 3.4Black - African 0.2 0.3 0.5 0.5 0.8 0.5 1.8Any other Black background 0.1 0.2 0.2 0.2 0.3 0.2 0.7Chinese - 0.1 0.2 0.1 0.5 0.2 0.6Any other ethnic group 0.1 0.2 0.5 0.4 1.4 0.5 1.7Ethnicity details provided 97.6 97.0 95.2 95.4 91.6 95.3 346.9Refused 0.4 0.5 0.7 0.7 1.0 0.7 2.4Information not yet obtained 2.1 2.5 4.1 3.9 7.4 4.0 14.6Numbers (thousands) 14.1 26.1 310.6 350.8 13.2 364.0
White - British 94.5 92.5 88.6 89.2 78.7 88.8 410.2White - Irish 1.8 1.6 1.5 1.5 1.4 1.5 7.1Any other white background 1.2 1.8 3.3 3.1 9.9 3.3 15.3White and Black Caribbean 0.1 0.2 0.2 0.2 0.5 0.2 0.9White and Black African - 0.1 0.1 0.1 0.2 0.1 0.5White and Asian 0.2 0.2 0.3 0.2 0.2 0.2 1.1Any other mixed background 0.2 0.2 0.3 0.3 0.6 0.3 1.5Indian 0.6 1.1 1.6 1.5 1.8 1.5 7.0Pakistani 0.2 0.4 0.8 0.8 1.1 0.8 3.6Bangladeshi 0.1 0.1 0.3 0.3 0.5 0.3 1.5Any other Asian Background 0.1 0.3 0.5 0.4 0.5 0.4 2.0Black Caribbean 0.6 0.9 0.9 0.9 1.6 0.9 4.4Black - African 0.1 0.3 0.7 0.6 1.0 0.7 3.1Any other Black background 0.1 0.1 0.2 0.2 0.4 0.2 1.0Chinese - 0.1 0.2 0.1 0.4 0.2 0.7Any other ethnic group 0.1 0.3 0.5 0.5 1.3 0.5 2.3Ethnicity details provided 97.2 96.9 95.0 95.3 90.0 95.1 462.1Refused 0.5 0.5 0.8 0.7 1.1 0.7 3.6Information not yet obtained 2.3 2.6 4.2 4.0 8.9 4.2 20.3Numbers (Thousands) 21.6 39.2 405.6 466.4 19.7 486.0
Source: School Workforce Census1. Excludes occasionals.
4. Includes full-time and part-time.
Numbers below 50 are shown as nil or negligible.
Totals may not appear equal to the sum of the component parts because of rounding.
TOTAL PUBLICLY FUNDED SCHOOLS
Number of teachers
(Thousands)
Table 5Proportions of the head count of regular 1 qualified 2 and unqualified 3 teachers 4 in publicly funded schools by sector, grade, gender and ethnic origin.
England
MEN
Heads
Deputies and assis-
tants
Class-room and others 5
Total qual-ified
Unqual-ified
teachersAll tea-chers
5. Includes Advanced Skilled Teachers, Excellent Teachers, post threshold teachers and grade unknown.6. Includes gender unspecified therefore totals may not equal to the sum of the component parts.
- Nil or negligible.
WOMEN
MEN AND WOMEN 6
2. Teachers who have attained qualified teacher status. 3. An unqualified teacher is either a trainee working towards QTS; an overseas trained teacher who has not exceeded the four years they are allowed to teach without having QTS; or an instructor who has a particular skill who can be employed for so long as a qualified teacher is not available.

November 2011
(Percentages)
White - British 79.6 88.7 85.0 81.9 89.5 86.6 22.1 79.6 89.7 88.3 87.2 87.2 86.1 23.1White - Irish 0.7 1.6 0.3 1.6 1.1 1.0 0.3 0.6 1.5 0.4 1.4 1.2 0.9 0.2Any Other White Background 2.7 2.0 2.1 2.3 2.4 2.4 0.6 3.3 2.0 2.4 2.3 3.7 3.0 0.8White and Black Caribbean 1.2 0.2 0.1 0.6 0.4 0.6 0.1 0.9 0.3 0.2 0.2 0.2 0.4 0.1White and Black African 0.3 0.1 - - 0.1 0.2 - 0.4 0.1 0.1 0.5 0.2 0.2 0.1White and Asian 0.3 0.2 0.2 - 0.2 0.2 0.1 0.2 0.2 0.2 0.2 0.1 0.2 -Any other mixed background 0.7 0.5 0.3 0.6 0.2 0.4 0.1 0.4 0.2 0.3 0.5 0.2 0.3 0.1Indian 1.2 1.1 3.5 1.6 0.8 1.1 0.3 1.4 1.2 2.5 1.0 1.1 1.6 0.4Pakistani 2.1 0.5 1.9 2.6 0.4 0.9 0.2 2.3 0.5 1.1 1.0 0.5 1.1 0.3Bangladeshi 1.5 0.5 0.7 2.6 0.2 0.6 0.2 1.6 0.8 0.4 0.5 0.2 0.7 0.2Any other Asian Background 0.5 0.3 1.1 0.6 0.5 0.5 0.1 0.6 0.5 0.9 0.2 0.5 0.7 0.2Black Caribbean 4.7 2.2 1.5 2.6 1.9 2.7 0.7 4.1 1.3 1.1 3.3 1.6 2.0 0.5Black - African 2.1 0.8 1.4 - 1.3 1.4 0.4 2.2 0.7 0.9 1.0 1.8 1.4 0.4Any other Black background 0.9 0.3 0.4 0.6 0.3 0.5 0.1 1.1 0.4 0.3 0.5 0.5 0.6 0.2Chinese 0.1 0.1 0.5 - - 0.1 - 0.1 0.1 0.3 0.1 0.2 0.2 0.1Any Other Ethnic Group 1.3 0.8 1.0 2.3 0.7 0.9 0.2 1.1 0.4 0.6 0.3 0.9 0.7 0.2Ethnicity details provided 95.0 95.7 95.4 93.1 96.3 95.8 25.5 93.5 94.3 94.8 94.7 95.0 94.5 26.8Refused 0.4 0.5 1.2 0.3 0.5 0.5 0.1 1.2 0.9 1.0 1.2 0.9 1.0 0.3Information Not Yet Obtained 4.6 3.8 3.4 6.6 3.2 3.7 1.0 5.2 4.8 4.2 4.1 4.1 4.5 1.3Numbers (Thousands) 6.7 3.7 1.4 0.3 14.5 26.6 6.5 3.7 8.1 1.2 8.8 28.3
White - British 88.7 92.9 91.7 85.0 86.7 88.4 349.9 87.6 92.6 90.7 91.7 87.5 89.4 90.7White - Irish 0.7 1.0 0.8 0.9 0.8 0.8 3.2 0.8 0.9 0.9 1.0 1.0 0.9 0.9Any Other White Background 2.1 1.3 2.2 2.1 2.0 2.0 7.9 3.6 1.6 2.6 2.0 2.8 2.7 2.7White and Black Caribbean 0.3 0.2 - 0.4 0.2 0.2 0.9 0.3 0.2 0.2 0.3 0.2 0.2 0.2White and Black African 0.1 - - 0.1 0.1 0.1 0.2 0.1 - - - 0.1 0.1 0.1White and Asian 0.1 0.1 0.1 0.1 0.1 0.1 0.5 0.2 0.1 0.1 0.1 - 0.1 0.1Any other mixed background 0.2 0.2 - 0.3 0.2 0.2 0.9 0.3 0.2 0.2 0.2 0.2 0.2 0.2Indian 2.2 1.3 2.2 3.2 2.9 2.4 9.5 1.7 1.3 2.0 1.4 2.6 1.8 1.8Pakistani 1.8 0.7 0.7 2.4 2.4 1.9 7.6 1.0 0.4 0.5 0.4 0.8 0.7 0.7Bangladeshi 0.8 0.3 0.1 1.3 0.9 0.8 3.2 0.5 0.3 0.2 0.2 0.2 0.4 0.4Any other Asian Background 0.5 0.2 0.7 0.5 0.8 0.6 2.3 0.5 0.3 0.9 0.3 0.9 0.6 0.6Black Caribbean 1.1 1.0 0.6 1.9 1.1 1.1 4.5 1.7 1.2 0.6 1.3 1.2 1.3 1.4Black - African 0.4 0.2 0.1 0.8 0.7 0.5 2.0 0.5 0.3 0.3 0.4 1.3 0.6 0.6Any other Black background 0.2 0.1 - 0.3 0.2 0.2 0.7 0.4 0.2 0.2 0.3 0.4 0.3 0.3Chinese 0.1 0.1 0.1 0.1 0.2 0.1 0.4 0.2 0.2 0.3 0.1 0.2 0.2 0.2Any Other Ethnic Group 0.6 0.3 0.6 0.6 0.7 0.6 2.3 0.6 0.2 0.5 0.3 0.7 0.5 0.5Ethnicity details provided 96.7 97.3 97.7 95.7 95.9 96.4 395.9 95.2 96.5 95.8 96.4 94.5 95.5 101.5Refused 0.4 0.4 0.7 0.4 0.5 0.5 1.9 0.7 0.6 0.7 0.8 0.7 0.7 0.7Information Not Yet Obtained 2.9 2.3 1.5 3.9 3.7 3.1 12.8 4.1 2.9 3.5 2.7 4.8 3.8 4.1Numbers (Thousands) 206.4 46.2 1.4 20.4 136.2 410.6 38.4 25.5 8.6 8.6 25.2 106.3
White - British 88.4 92.6 88.4 84.9 87.0 88.3 372.1 86.5 92.3 89.6 91.1 87.4 88.7 113.8White - Irish 0.7 1.0 0.6 1.0 0.9 0.8 3.4 0.7 1.0 0.7 1.0 1.0 0.9 1.1Any Other White Background 2.1 1.4 2.2 2.1 2.1 2.0 8.5 3.5 1.6 2.5 2.0 3.1 2.8 3.5White and Black Caribbean 0.3 0.2 0.1 0.4 0.2 0.3 1.1 0.4 0.2 0.2 0.3 0.2 0.3 0.3White and Black African 0.1 - - 0.1 0.1 0.1 0.3 0.1 - - 0.1 0.1 0.1 0.1White and Asian 0.1 0.1 0.1 0.1 0.1 0.1 0.5 0.2 0.1 0.1 0.1 0.1 0.1 0.2Any other mixed background 0.3 0.2 0.1 0.3 0.2 0.2 0.9 0.3 0.2 0.3 0.2 0.2 0.3 0.3Indian 2.2 1.3 2.9 3.2 2.7 2.3 9.7 1.7 1.3 2.2 1.3 2.2 1.8 2.3Pakistani 1.9 0.7 1.3 2.4 2.2 1.9 7.9 1.2 0.4 0.8 0.5 0.7 0.8 1.0Bangladeshi 0.8 0.3 0.4 1.3 0.8 0.8 3.3 0.7 0.4 0.3 0.3 0.2 0.4 0.5Any other Asian Background 0.5 0.2 0.9 0.5 0.8 0.6 2.4 0.5 0.3 0.9 0.3 0.8 0.6 0.8Black Caribbean 1.2 1.1 1.0 1.9 1.2 1.2 5.2 2.0 1.2 0.8 1.5 1.3 1.5 1.9Black - African 0.5 0.3 0.7 0.8 0.8 0.6 2.4 0.8 0.3 0.6 0.5 1.4 0.8 1.0Any other Black background 0.2 0.1 0.2 0.3 0.2 0.2 0.9 0.5 0.2 0.3 0.3 0.4 0.4 0.5Chinese 0.1 0.1 0.3 0.1 0.2 0.1 0.5 0.1 0.1 0.3 0.1 0.2 0.2 0.2Any Other Ethnic Group 0.6 0.3 0.8 0.7 0.7 0.6 2.5 0.7 0.2 0.5 0.3 0.8 0.6 0.7Ethnicity details provided 96.6 97.1 96.6 95.6 95.9 96.4 421.6 95.0 96.2 95.3 96.2 94.6 95.3 128.3Refused 0.4 0.5 1.0 0.4 0.5 0.5 2.0 0.8 0.7 0.8 0.9 0.8 0.8 1.0Information Not Yet Obtained 2.9 2.4 2.5 4.0 3.6 3.2 13.8 4.2 3.1 3.9 2.9 4.6 4.0 5.3Numbers (Thousands) 213.1 50.0 2.8 20.7 150.8 437.4 45.0 29.1 16.7 9.8 34.1 134.7
continued overleaf
MEN
Admin-istrative staff 3
Table 6Proportions of the head count of teaching assistants and school support staff 1 in publicly funded schools by sector, grade, gender and ethnic origin.
England
NURSERY AND PRIMARY SECONDARY
Teaching assistants 2
Admin-istrative staff 3
Number of non teaching staff (Thousands)
Auxil-iary
staff 6
Total non-teaching
staff
WOMEN
MEN AND WOMEN 7
Tech-nicians 4
Other support staff 5
Tech-nicians 4
Other support staff 5
Auxil-iary
staff 6
Total non-teaching
staff
Number of non teaching
staff (Thousands)
Teaching assistants 2

Table 6 continued
November 2011
(Percentages)
MENWhite - British 84.9 90.6 88.0 90.5 89.7 87.2 5.1 72.7 86.1 82.9 84.3 76.8 78.6 2.8White - Irish 0.9 1.3 0.7 0.3 0.9 0.9 0.1 0.8 0.7 - 2.0 0.6 0.8 -Any Other White Background 2.8 1.5 2.6 2.3 3.4 2.8 0.2 4.4 2.5 1.2 3.4 2.8 3.0 0.1White and Black Caribbean 0.9 0.6 0.2 1.3 0.2 0.7 - 1.3 0.2 - 0.8 0.2 0.5 -White and Black African 0.3 - 0.2 - 0.1 0.2 - 0.3 0.2 - 0.3 0.3 0.3 -White and Asian 0.2 0.4 - - 0.6 0.3 - 0.5 - - - 0.1 0.1 -Any other mixed background 0.8 0.2 0.2 0.5 0.1 0.5 - 0.5 0.2 1.2 0.6 0.1 0.3 -Indian 0.7 1.0 2.2 0.8 0.8 0.9 0.1 2.3 1.8 3.2 1.1 2.1 2.1 0.1Pakistani 0.7 - - 0.3 0.8 0.6 - 1.5 0.7 4.8 0.8 0.7 1.2 -Bangladeshi 0.4 0.2 0.5 - 0.1 0.3 - 1.5 0.5 2.4 0.3 1.6 1.3 -Any other Asian Background 0.6 0.6 1.2 0.5 0.3 0.6 - 0.9 0.7 1.6 0.8 1.1 1.0 -Black Caribbean 3.4 1.7 1.9 2.8 1.6 2.6 0.2 6.3 3.6 0.8 2.5 3.7 3.9 0.1Black - African 1.3 0.6 1.0 0.5 0.9 1.1 0.1 3.2 0.7 1.6 1.4 6.5 4.1 0.1Any other Black background 1.0 0.6 0.7 - 0.3 0.7 - 2.0 0.7 - 1.1 1.2 1.2 -Chinese - - - - 0.1 - - 0.1 0.2 0.4 0.3 0.4 0.3 -Any Other Ethnic Group 1.0 0.8 0.5 0.5 0.3 0.7 - 1.7 1.1 - 0.3 1.8 1.4 0.1Ethnicity details provided 94.9 95.6 95.2 97.1 96.0 95.4 5.9 67.7 81.7 91.6 75.0 84.1 79.2 3.6Refused 0.5 1.5 0.9 0.5 0.5 0.6 - 2.3 2.5 1.1 4.0 1.9 2.3 0.1Information Not Yet Obtained 4.6 2.9 3.9 2.4 3.5 4.0 0.2 30.0 15.8 7.3 21.0 13.9 18.5 0.8Numbers (Thousands) 3.3 0.5 0.4 0.4 1.5 6.2 1.1 0.7 0.3 0.5 2.0 4.5
WOMENWhite - British 91.0 93.3 88.3 91.1 86.8 90.4 35.6 85.9 89.2 82.7 87.9 87.1 87.1 33.1White - Irish 0.8 0.7 1.8 0.8 1.1 0.8 0.3 0.8 1.2 1.0 1.3 0.7 0.8 0.3Any Other White Background 2.1 1.1 2.9 1.8 2.0 2.0 0.8 3.0 1.6 1.0 2.2 1.4 1.7 0.7White and Black Caribbean 0.4 0.4 1.2 0.2 0.2 0.3 0.1 0.5 0.3 - 0.4 0.2 0.3 0.1White and Black African 0.1 0.1 - - 0.1 0.1 - 0.1 0.2 - 0.2 0.1 0.1 -White and Asian 0.1 0.2 - 0.1 0.1 0.1 - 0.1 0.2 - 0.1 0.1 0.1 -Any other mixed background 0.3 0.1 - 0.4 0.2 0.2 0.1 0.4 0.2 - 0.2 0.1 0.2 0.1Indian 1.2 1.1 1.8 1.5 2.0 1.4 0.5 1.7 1.4 4.1 2.3 3.2 2.8 1.1Pakistani 0.8 0.6 1.2 0.7 1.7 0.9 0.4 0.9 0.6 - 0.8 0.9 0.8 0.3Bangladeshi 0.3 0.2 0.6 0.1 0.8 0.4 0.1 0.7 0.1 - 0.2 0.3 0.4 0.1Any other Asian Background 0.4 0.2 - 0.3 1.1 0.5 0.2 0.4 0.2 1.0 0.2 0.5 0.5 0.2Black Caribbean 1.3 1.2 1.2 1.4 1.6 1.3 0.5 2.7 2.0 3.1 2.0 1.6 1.8 0.7Black - African 0.6 0.3 0.6 0.8 1.2 0.7 0.3 0.8 0.7 5.1 0.6 2.0 1.6 0.6Any other Black background 0.3 0.2 - 0.2 0.4 0.3 0.1 0.6 0.4 1.0 0.3 0.5 0.5 0.2Chinese 0.1 0.2 - 0.1 0.2 0.1 - 0.3 0.1 1.0 - 0.3 0.2 0.1Any Other Ethnic Group 0.4 0.3 0.6 0.4 0.6 0.4 0.2 1.1 1.7 - 1.2 1.0 1.1 0.4Ethnicity details provided 95.8 97.1 95.0 97.4 95.5 96.0 39.3 79.8 84.5 89.1 79.8 87.1 85.3 37.9Refused 0.7 0.4 1.1 0.4 0.4 0.6 0.2 2.7 3.3 0.9 1.8 1.2 1.7 0.7Information Not Yet Obtained 3.5 2.5 3.9 2.2 4.1 3.4 1.4 17.4 12.2 10.0 18.4 11.7 13.0 5.8Numbers (Thousands) 26.4 3.9 0.2 2.6 7.9 41.0 7.1 3.6 0.1 2.8 30.9 44.5
White - British 90.3 93.0 88.1 91.0 87.2 90.0 40.7 84.4 88.7 82.8 87.4 86.5 86.4 35.9White - Irish 0.8 0.7 1.0 0.7 1.1 0.8 0.4 0.8 1.1 0.3 1.4 0.7 0.8 0.3Any Other White Background 2.1 1.1 2.7 1.9 2.3 2.1 0.9 3.2 1.8 1.1 2.4 1.5 1.8 0.8White and Black Caribbean 0.4 0.4 0.5 0.3 0.2 0.4 0.2 0.6 0.3 - 0.4 0.2 0.3 0.1White and Black African 0.1 - 0.2 - 0.1 0.1 - 0.2 0.2 - 0.2 0.1 0.1 0.1White and Asian 0.1 0.2 - 0.1 0.2 0.1 0.1 0.1 0.1 - 0.1 0.1 0.1 -Any other mixed background 0.3 0.1 0.2 0.5 0.2 0.3 0.1 0.4 0.2 0.9 0.3 0.1 0.2 0.1Indian 1.2 1.0 2.0 1.4 1.8 1.3 0.6 1.8 1.5 3.4 2.1 3.1 2.7 1.1Pakistani 0.8 0.6 0.3 0.6 1.5 0.9 0.4 1.0 0.6 3.4 0.8 0.8 0.9 0.4Bangladeshi 0.3 0.2 0.5 0.1 0.7 0.4 0.2 0.8 0.2 1.7 0.2 0.4 0.5 0.2Any other Asian Background 0.5 0.2 0.9 0.3 0.9 0.5 0.2 0.5 0.3 1.4 0.3 0.5 0.5 0.2Black Caribbean 1.5 1.3 1.7 1.6 1.6 1.5 0.7 3.1 2.2 1.4 2.1 1.7 2.0 0.8Black - African 0.7 0.3 0.9 0.7 1.2 0.7 0.3 1.0 0.7 2.6 0.7 2.2 1.8 0.8Any other Black background 0.4 0.2 0.5 0.2 0.4 0.3 0.2 0.7 0.4 0.3 0.4 0.5 0.5 0.2Chinese 0.1 0.1 - 0.1 0.2 0.1 - 0.3 0.1 0.6 - 0.3 0.2 0.1Any Other Ethnic Group 0.5 0.3 0.5 0.5 0.6 0.5 0.2 1.2 1.6 - 1.1 1.1 1.1 0.5Ethnicity details provided 95.7 97.0 95.1 97.4 95.5 95.9 45.2 78.2 84.1 90.6 79.1 86.9 84.7 41.5Refused 0.7 0.5 1.0 0.4 0.4 0.6 0.3 2.7 3.2 1.0 2.1 1.3 1.7 0.8Information Not Yet Obtained 3.6 2.5 3.9 2.2 4.1 3.5 1.7 19.2 12.8 8.3 18.8 11.8 13.6 6.6Numbers (Thousands) 29.7 4.4 0.6 3.0 9.5 47.2 8.2 4.3 0.4 3.3 32.9 49.0
continued overleaf
Auxil-iary
staff 6
Total non-teach-ing
staff
Number of non teach-ing
staff (Thousands)
Teaching assistants 2
Total non-teach-ing
staff
Number of non teach-ing staff (Thousands)
Admin-istrative staff 3
Tech-nicians 4
Other support staff 5
Auxil-iary
staff 6
England
SPECIAL CENTRALLY EMPLOYED
Teaching assistants 2
Admin-istrative staff 3
Tech-nicians 4
Other support staff 5
MEN AND WOMEN 7
Table 6Proportions of the head count of teaching assistants and school support staff 1 in publicly funded schools by sector, grade, gender and ethnic origin.

Table 6 continued
November 2011
White - British 80.3 89.1 87.7 86.6 87.9 86.0 53.0 81.7 91.0 88.9 89.5 87.2 87.1 13.7White - Irish 0.7 1.5 0.4 1.3 1.1 0.9 0.6 0.8 0.7 0.5 1.4 0.9 0.8 0.1Any Other White Background 3.0 2.0 2.3 2.5 2.9 2.7 1.7 4.2 2.2 2.7 1.8 3.5 3.2 0.5White and Black Caribbean 1.0 0.3 0.2 0.6 0.3 0.5 0.3 0.9 0.2 0.2 0.4 0.2 0.4 0.1White and Black African 0.3 0.1 0.1 0.3 0.2 0.2 0.1 0.3 0.1 - 0.3 0.1 0.1 -White and Asian 0.3 0.2 0.2 0.1 0.2 0.2 0.1 0.3 0.1 0.1 - 0.1 0.1 -Any other mixed background 0.6 0.3 0.4 0.5 0.2 0.4 0.2 0.7 0.3 0.4 0.1 0.2 0.4 0.1Indian 1.2 1.2 2.6 1.1 1.0 1.3 0.8 1.1 1.1 2.0 1.0 1.0 1.3 0.2Pakistani 1.9 0.5 1.2 1.1 0.5 1.0 0.6 1.1 0.6 0.9 0.4 0.4 0.7 0.1Bangladeshi 1.3 0.6 0.5 0.7 0.3 0.7 0.4 0.8 0.3 0.1 0.3 0.1 0.3 0.1Any other Asian Background 0.6 0.5 1.0 0.4 0.5 0.6 0.4 0.6 0.5 0.9 0.3 0.8 0.7 0.1Black Caribbean 4.3 1.9 1.2 3.0 1.9 2.5 1.5 3.4 0.7 1.2 2.3 1.4 1.7 0.3Black - African 2.0 0.7 1.0 0.8 1.8 1.5 1.0 2.1 0.9 0.8 1.1 2.2 1.6 0.2Any other Black background 1.0 0.4 0.4 0.5 0.4 0.6 0.4 0.8 0.2 0.2 0.6 0.6 0.5 0.1Chinese 0.1 0.1 0.3 0.1 0.1 0.1 0.1 0.2 0.1 0.3 - 0.1 0.2 -Any Other Ethnic Group 1.2 0.6 0.6 0.6 0.8 0.8 0.5 1.1 0.8 0.8 0.6 1.1 1.0 0.2Ethnicity details provided 92.7 94.0 94.8 91.0 95.0 94.1 61.7 92.9 92.8 93.9 91.6 94.7 93.7 15.7Refused 0.8 0.9 1.0 1.5 0.7 0.9 0.6 0.9 0.9 1.2 0.8 0.7 0.9 0.2Information Not Yet Obtained 6.4 5.1 4.1 7.5 4.3 5.1 3.3 6.1 6.2 4.8 7.6 4.6 5.3 0.9Numbers (Thousands) 17.5 8.6 10.3 2.4 26.8 65.6 3.5 2.2 4.6 0.8 5.7 16.8
White - British 88.7 92.7 90.7 87.3 86.9 88.6 509.1 88.5 93.2 91.3 91.8 88.5 90.1 56.8White - Irish 0.7 1.0 0.9 1.0 0.8 0.8 4.7 0.6 0.8 0.7 0.7 0.7 0.7 0.4Any Other White Background 2.3 1.4 2.5 2.0 2.1 2.1 12.0 4.0 1.8 2.6 2.1 2.9 3.0 1.9White and Black Caribbean 0.3 0.2 0.2 0.3 0.2 0.2 1.4 0.3 0.2 0.1 0.3 0.2 0.2 0.1White and Black African 0.1 - - 0.1 0.1 0.1 0.4 0.1 0.1 0.1 0.1 0.1 0.1 0.1White and Asian 0.1 0.1 0.1 0.1 0.1 0.1 0.7 0.2 0.2 - 0.1 0.1 0.1 0.1Any other mixed background 0.3 0.2 0.2 0.3 0.2 0.2 1.2 0.4 0.1 0.2 0.3 0.1 0.3 0.2Indian 2.0 1.3 2.0 2.6 2.9 2.2 12.9 1.4 1.2 1.7 1.4 2.0 1.5 1.0Pakistani 1.6 0.6 0.5 1.7 1.9 1.6 9.0 0.7 0.3 0.3 0.4 0.6 0.5 0.3Bangladeshi 0.7 0.3 0.2 0.8 0.7 0.7 3.8 0.2 - 0.2 0.1 0.2 0.2 0.1Any other Asian Background 0.5 0.3 0.8 0.4 0.8 0.6 3.2 0.5 0.2 0.5 0.3 0.8 0.5 0.3Black Caribbean 1.2 1.1 0.6 1.7 1.2 1.2 7.1 1.4 1.0 0.5 1.3 1.1 1.2 0.7Black - African 0.5 0.2 0.3 0.7 1.0 0.6 3.6 0.6 0.3 0.6 0.5 1.3 0.7 0.4Any other Black background 0.2 0.1 0.2 0.3 0.3 0.2 1.4 0.4 0.2 0.1 0.2 0.3 0.3 0.2Chinese 0.1 0.1 0.3 0.1 0.2 0.1 0.8 0.1 0.1 0.4 0.1 0.3 0.2 0.1Any Other Ethnic Group 0.6 0.3 0.5 0.6 0.7 0.6 3.4 0.6 0.3 0.7 0.4 0.9 0.6 0.4Ethnicity details provided 96.0 96.4 95.9 94.7 94.3 95.4 574.6 95.0 95.9 94.9 95.3 93.7 94.9 63.1Refused 0.6 0.6 0.7 0.6 0.6 0.6 3.6 0.7 0.5 1.0 0.7 0.9 0.7 0.5Information Not Yet Obtained 3.5 2.9 3.3 4.7 5.1 4.0 24.1 4.3 3.6 4.1 4.0 5.4 4.4 2.9Numbers (Thousands) 278.2 79.2 10.2 34.3 200.2 602.3 23.7 15.0 4.9 5.3 17.6 66.5
White - British 88.2 92.3 89.2 87.3 87.0 88.3 562.4 87.7 92.9 90.2 91.5 88.2 89.5 70.6White - Irish 0.7 1.0 0.6 1.0 0.9 0.8 5.3 0.6 0.8 0.6 0.8 0.8 0.7 0.5Any Other White Background 2.4 1.5 2.4 2.1 2.2 2.2 13.7 4.1 1.9 2.7 2.1 3.0 3.0 2.4White and Black Caribbean 0.3 0.2 0.2 0.4 0.2 0.3 1.7 0.4 0.2 0.2 0.3 0.2 0.2 0.2White and Black African 0.1 - - 0.1 0.1 0.1 0.5 0.1 0.1 - 0.1 0.1 0.1 0.1White and Asian 0.1 0.1 0.1 0.1 0.1 0.1 0.8 0.2 0.2 0.1 0.1 0.1 0.1 0.1Any other mixed background 0.3 0.2 0.3 0.3 0.2 0.2 1.5 0.5 0.2 0.3 0.2 0.2 0.3 0.2Indian 2.0 1.3 2.3 2.5 2.6 2.2 13.7 1.4 1.2 1.8 1.3 1.7 1.5 1.2Pakistani 1.6 0.6 0.9 1.6 1.8 1.5 9.6 0.8 0.4 0.6 0.4 0.5 0.6 0.4Bangladeshi 0.8 0.3 0.3 0.8 0.7 0.7 4.2 0.3 0.1 0.2 0.1 0.2 0.2 0.1Any other Asian Background 0.5 0.3 0.9 0.4 0.7 0.6 3.6 0.5 0.2 0.7 0.3 0.8 0.5 0.4Black Caribbean 1.4 1.2 0.9 1.8 1.3 1.4 8.6 1.7 1.0 0.8 1.4 1.1 1.3 1.0Black - African 0.6 0.3 0.6 0.7 1.1 0.7 4.5 0.8 0.3 0.7 0.5 1.5 0.9 0.7Any other Black background 0.3 0.2 0.3 0.3 0.3 0.3 1.7 0.4 0.2 0.2 0.2 0.4 0.3 0.3Chinese 0.1 0.1 0.3 0.1 0.2 0.1 0.8 0.1 0.1 0.3 0.1 0.2 0.2 0.1Any Other Ethnic Group 0.6 0.3 0.5 0.6 0.7 0.6 3.9 0.7 0.4 0.7 0.4 0.9 0.7 0.5Ethnicity details provided 95.8 96.2 95.4 94.5 94.4 95.3 636.7 94.7 95.5 94.4 94.8 93.9 94.6 78.9Refused 0.6 0.7 0.9 0.7 0.6 0.6 4.2 0.7 0.6 1.1 0.7 0.9 0.8 0.6Information Not Yet Obtained 3.6 3.2 3.8 4.9 5.0 4.1 27.4 4.5 3.9 4.5 4.5 5.2 4.6 3.8Numbers (Thousands) 295.9 87.8 20.5 36.7 227.2 668.2 27.2 17.3 9.5 6.1 23.3 83.4
continued overleaf
MEN AND WOMEN 7
Auxil-iary
staff 6
Auxil-iary
staff 6
Total non-teach-ing
staff
MEN
WOMEN
Admin-istrative staff 3
Tech-nicians 4
Table 6
Number of non teach-ing
staff (Thousands)
Teaching assistants 2
Teaching assistants 2
Admin-istrative staff 3
Tech-nicians 4
Other support staff 5
Total non-teach-ing
staff
Number of non teach-ing staff (Thousands)
Other support staff 5
(Percentages)
TOTAL MAINTAINED SECTOR ACADEMIES
Proportions of the head count of teaching assistants and school support staff 1 in publicly funded schools by sector, grade, gender and ethnic origin.
England

Table 6 continued
November 2011
White - British 80.5 89.5 88.1 87.3 87.8 86.2 66.7White - Irish 0.7 1.3 0.4 1.3 1.0 0.9 0.7Any Other White Background 3.2 2.0 2.4 2.3 3.0 2.8 2.2White and Black Caribbean 1.0 0.2 0.2 0.5 0.3 0.5 0.4White and Black African 0.3 0.1 - 0.3 0.2 0.2 0.1White and Asian 0.3 0.2 0.1 0.1 0.2 0.2 0.1Any other mixed background 0.6 0.3 0.4 0.4 0.2 0.4 0.3Indian 1.2 1.2 2.4 1.0 1.0 1.3 1.0Pakistani 1.8 0.5 1.1 0.9 0.5 0.9 0.7Bangladeshi 1.2 0.6 0.4 0.6 0.3 0.6 0.5Any other Asian Background 0.6 0.5 0.9 0.4 0.6 0.6 0.5Black Caribbean 4.2 1.7 1.2 2.8 1.8 2.3 1.8Black - African 2.1 0.8 0.9 0.9 1.8 1.6 1.2Any other Black background 1.0 0.4 0.3 0.5 0.5 0.6 0.4Chinese 0.1 0.1 0.3 0.1 0.1 0.1 0.1Any Other Ethnic Group 1.2 0.7 0.7 0.6 0.8 0.9 0.7Ethnicity details provided 92.8 93.8 94.6 91.1 94.9 94.0 77.4Refused 0.9 0.9 1.1 1.3 0.7 0.9 0.7Information Not Yet Obtained 6.4 5.3 4.4 7.5 4.4 5.1 4.2Numbers (Thousands) 21.0 10.8 14.8 3.2 32.5 82.3
White - British 88.7 92.8 90.9 88.0 87.0 88.7 566.0White - Irish 0.7 0.9 0.8 0.9 0.8 0.8 5.1Any Other White Background 2.4 1.5 2.6 2.1 2.1 2.2 13.9White and Black Caribbean 0.3 0.2 0.1 0.3 0.2 0.2 1.6White and Black African 0.1 - - 0.1 0.1 0.1 0.4White and Asian 0.1 0.1 0.1 0.1 0.1 0.1 0.8Any other mixed background 0.3 0.2 0.2 0.3 0.2 0.2 1.4Indian 2.0 1.3 1.9 2.4 2.8 2.2 13.8Pakistani 1.5 0.6 0.4 1.5 1.8 1.5 9.3Bangladeshi 0.7 0.3 0.2 0.7 0.7 0.6 3.9Any other Asian Background 0.5 0.2 0.7 0.4 0.8 0.6 3.5Black Caribbean 1.3 1.1 0.6 1.7 1.2 1.2 7.8Black - African 0.5 0.3 0.4 0.6 1.0 0.6 4.0Any other Black background 0.2 0.2 0.2 0.3 0.3 0.2 1.5Chinese 0.1 0.1 0.3 0.1 0.2 0.1 0.9Any Other Ethnic Group 0.6 0.3 0.5 0.6 0.8 0.6 3.7Ethnicity details provided 95.9 96.3 95.6 94.8 94.3 95.4 637.8Refused 0.6 0.6 0.8 0.6 0.6 0.6 4.1Information Not Yet Obtained 3.5 3.0 3.6 4.6 5.1 4.0 27.0Numbers (Thousands) 302.0 94.2 15.2 39.6 217.8 668.8
White - British 88.2 92.4 89.5 87.9 87.1 88.5 633.0White - Irish 0.7 1.0 0.6 1.0 0.9 0.8 5.8Any Other White Background 2.5 1.5 2.5 2.1 2.2 2.3 16.1White and Black Caribbean 0.3 0.2 0.2 0.4 0.2 0.3 1.9White and Black African 0.1 0.1 - 0.1 0.1 0.1 0.6White and Asian 0.1 0.1 0.1 0.1 0.1 0.1 0.9Any other mixed background 0.3 0.2 0.3 0.3 0.2 0.2 1.7Indian 1.9 1.3 2.2 2.3 2.6 2.1 14.9Pakistani 1.6 0.6 0.8 1.5 1.7 1.4 10.1Bangladeshi 0.7 0.3 0.3 0.7 0.6 0.6 4.4Any other Asian Background 0.5 0.3 0.8 0.4 0.8 0.6 4.0Black Caribbean 1.4 1.2 0.9 1.7 1.3 1.3 9.6Black - African 0.6 0.3 0.7 0.7 1.1 0.7 5.2Any other Black background 0.3 0.2 0.2 0.3 0.3 0.3 2.0Chinese 0.1 0.1 0.3 0.1 0.2 0.1 1.0Any Other Ethnic Group 0.6 0.3 0.6 0.6 0.8 0.6 4.4Ethnicity details provided 95.7 96.1 95.1 94.5 94.3 95.2 715.6Refused 0.6 0.6 0.9 0.7 0.7 0.6 4.8Information Not Yet Obtained 3.7 3.3 4.0 4.8 5.0 4.2 31.3Numbers (Thousands) 323.2 105.1 30.0 42.8 250.6 751.6
Source: School Workforce Census
Numbers below 50 are shown as nil or negligible.- Nil or negligible.
Totals may not appear equal to the sum of the component parts because of rounding.
6. Includes staff employed in roles which were not previously collected and include roles such as catering staff and school maintenance.7. Includes gender unspecified or not known, therefore totals mya not equal to the sum of the component parts.
2. Includes higher level teaching assistants, special needs support staff and minority ethnic pupil support staff.3. Includes secretaries, bursars and other admin/clerical staff.4. Includes laboratory assistants, design technology assistants, home economics and craft technicians and IT technicians. Excludes technicians in nursery schools and pupil referral units.5. Includes matrons, nurses, medical staff (excludes matrons/nurses/medical staff in nursery schools and pupil referral units), childcare staff and other education support staff (librarians, welfare assistants, learning mentors employed at the school and any other non-teaching staff regularly employed at the school not covered in teaching assistants). Includes technicians and matrons/nurses/medical staff in nursery schools and pupil referral units.
MEN
WOMEN
MEN AND WOMEN 7
1. Third party support staff are not available by ethnicity and are therefore excluded from these figures. Some double counting for support staff may be included.
TOTAL PUBLICLY FUNDED SCHOOLS
Teaching assistants 2
Admin-istrative staff 3
Tech-nicians 4
Other support staff 5
Auxil-iary
staff 6
Total non-teach-ing
staff
Number of non teach-ing
staff (Thousands)
Table 6Proportions of the head count of teaching assistants and school support staff 1 in publicly funded schools by sector, grade, gender and ethnic origin.
England(Percentages)

1 (£21,588) 8.9 5.7 4.0 3.2 7.2 6.3 7.12 (£23,295) 8.0 5.8 3.7 2.5 6.8 6.1 6.73 (£25,168) 7.6 5.8 4.4 1.9 6.6 5.8 6.54 (£27,104) 7.2 5.8 4.4 2.4 6.4 5.6 6.35 (£29,240) 6.5 5.9 4.4 2.1 6.1 5.2 6.06 (£31,552) 13.1 11.0 11.4 12.6 12.2 9.5 11.7
1 (£34,181) 13.5 12.3 11.5 9.6 12.8 10.8 12.52 (£35,447) 9.7 9.2 9.3 9.1 9.5 8.0 9.33 (£36,756) 19.0 29.8 29.2 41.6 24.5 24.2 24.7
(£37,461 - £56,950) 0.6 1.5 0.8 0.9 1.0 1.4 1.1
0.7 1.1 13.0 5.5 1.5 5.7 1.4
Other or unknown 4 5.1 6.0 3.9 8.7 5.5 11.6 6.8
100.0 100.0 100.0 100.0 100.0 100.0 100.0
Not in receipt 80.3 57.9 72.8 72.6 70.4 64.1 69.1In receipt - (£7,323 to £12,393) 0.3 12.6 1.3 2.9 5.6 9.8 6.4In receipt - (£2,535 to £6,197) 15.3 24.6 20.8 20.8 19.6 21.0 19.9In receipt - other amounts 4.0 4.9 5.0 3.7 4.4 5.1 4.6Total 100.0 100.0 100.0 100.0 100.0 100.0 100.0
Not in receipt 98.7 96.4 98.5 98.3 97.7 96.8 97.5In receipt 1.3 3.6 1.5 1.7 2.3 3.2 2.5Total 100.0 100.0 100.0 100.0 100.0 100.0 100.0
Not in receipt 98.9 99.5 33.1 74.8 96.1 99.6 96.8In receipt - £2,001 to £3,954 0.9 0.4 55.8 21.3 3.2 0.4 2.6In receipt - other amounts 0.2 0.1 11.1 3.9 0.7 0.1 0.6Total 100.0 100.0 100.0 100.0 100.0 100.0 100.0
Not in receipt 93.0 86.0 78.9 92.8 89.5 85.0 88.6In receipt 7.0 14.0 21.1 7.2 10.5 15.0 11.4Total 100.0 100.0 100.0 100.0 100.0 100.0 100.0
4. Includes teachers where scale point is not known or in the case of academies is not paid on the national pay scale.
1. The salary values displayed for the main and upper pay scales and Advanced Skills Teachers pay spine are for England and Wales (excluding London area). Teachers in Inner London, Outer London and the London Fringe areas are on higher pay scales. Details may be found in the School Teachers' Pay and Conditions Document 2011.2. The AST pay spine consists of 18 points, however, an individual AST will have a pay range of 5 consecutive points.3. Includes a proportion of teachers that are on other pay spines (Unqualified Teacher, Excellent Teachers and Leadership).
Recruitment and retention incentives and
Special Educational Needs allowances
Other allowances
Source: School Workforce Census
Upper pay scale
Advanced Skills Teachers 2
Table 7aFull-time regular qualified classroom teachers in publicly funded schools: Percentage distribution of teachers on the classroom teachers' pay scales by sector 1.November 2011England
(Percentages)
NURSERY AND
PRIMARY SECONDARY SPECIAL ACADEMIES
TOTAL PUBLICLY FUNDED
SCHOOLS
SCALE POINT 1
Main classroom pay scale 1
CENTRALLY EMPLOYED
TOTAL MAINTAINED
SECTOR
Not applicable 3
Total
CLASSROOM TEACHER ALLOWANCES
Teaching and Learning Responsibility (TLR) payments

1 (£21,588) 2.0 2.7 1.4 3.9 2.4 2.3 2.32 (£23,295) 1.8 2.1 1.2 1.7 1.8 1.8 1.83 (£25,168) 2.0 2.3 1.5 1.9 2.1 1.9 2.14 (£27,104) 2.1 2.4 1.7 1.8 2.1 2.3 2.15 (£29,240) 2.7 3.0 1.9 2.0 2.7 2.5 2.76 (£31,552) 21.7 12.4 16.0 25.2 19.7 12.6 18.8
1 (£34,181) 18.4 12.3 13.0 13.8 16.1 12.4 15.62 (£35,447) 15.8 12.3 14.1 10.4 14.2 11.3 13.83 (£36,756) 26.2 41.8 41.3 26.7 30.7 36.8 31.4
(£37,461 - £56,950) 0.4 1.0 0.4 0.2 0.5 1.0 0.6
0.3 0.8 1.0 3.7 0.9 1.2 0.9
Other or unknown 4 6.5 7.0 6.6 8.8 6.9 13.9 7.8
100.0 100.0 100.0 100.0 100.0 100.0 100.0
Not in receipt 91.3 78.9 84.9 94.8 88.4 84.4 87.9In receipt 8.7 21.1 15.1 5.2 11.6 15.6 12.1Total 100.0 100.0 100.0 100.0 100.0 100.0 100.0
Not in receipt 99.4 97.2 99.0 99.7 98.9 98.2 98.8In receipt 0.6 2.8 1.0 0.3 1.1 1.8 1.2Total 100.0 100.0 100.0 100.0 100.0 100.0 100.0
Not in receipt 97.8 98.8 37.9 91.6 95.2 99.1 95.7In receipt 2.2 1.2 62.1 8.4 4.8 0.9 4.3Total 100.0 100.0 100.0 100.0 100.0 100.0 100.0
Not in receipt 95.6 91.1 79.7 78.2 91.7 91.4 91.7In receipt 4.4 8.9 20.3 21.8 8.3 8.6 8.3Total 100.0 100.0 100.0 100.0 100.0 100.0 100.0
4. Includes teachers where scale point is not known or in the case of academies is not paid on the national pay scale.
1. The salary values displayed for the main and upper pay scales and Advanced Skills Teachers pay spine are for England and Wales (excluding London area). Teachers in Inner London, Outer London and the London Fringe areas are on higher pay scales. Details may be found in the School Teachers' Pay and Conditions Document 2011.2. The AST pay spine consists of 18 points, however, an individual AST will have a pay range of 5 consecutive points.3. Includes a proportion of teachers that are on other pay spines (Unqualified Teacher, Excellent Teachers and Leadership).
Recruitment and retention incentives and
Special Educational Needs allowances
Other allowances
Source: School Workforce Census
CLASSROOM TEACHER ALLOWANCES
Teaching and Learning Responsibility (TLR) payments
Table 7bPart-time regular qualified classroom teachers in publicly funded schools: Percentage distribution of teachers on the classroom teachers' pay scales by sector 1.November 2011England
(Percentages)
NURSERY AND
PRIMARYCENTRALLY EMPLOYED
TOTAL MAINTAINED
SECTOR ACADEMIES
TOTAL PUBLICLY FUNDED
SCHOOLS
Not applicable 3
Total
SCALE POINT 1
Main classroom pay scale 1
Upper pay scale
Advanced Skills Teachers 2
SECONDARY SPECIAL

Other2
1 - 3 4 - 5 6 1 2 3 Leadership Total %
Under 25 90.9 3.9 0.1 0.2 0.1 - 4.7 0.2 100.0 1.225-29 48.5 26.8 11.0 4.9 0.2 - 4.9 3.6 100.0 4.030-34 17.9 13.8 15.9 17.5 8.9 2.7 5.1 18.3 100.0 4.435-39 8.0 6.6 10.2 12.6 10.2 11.2 3.9 37.3 100.0 4.140-44 6.2 4.2 7.6 9.6 7.9 16.1 4.3 44.2 100.0 3.545-49 4.2 2.9 7.8 6.5 7.6 20.3 4.0 46.7 100.0 2.950-54 2.0 1.6 6.2 6.7 7.3 22.7 4.0 49.6 100.0 2.155-59 0.9 0.6 5.2 5.0 4.7 23.9 2.6 57.1 100.0 1.9
0.9 0.2 8.4 4.0 5.1 21.0 4.2 56.1 100.0 0.4All ages 18.6 9.2 9.4 9.2 6.4 11.2 4.3 31.6 100.0 24.6
Under 25 90.1 2.2 0.1 0.1 0.1 0.1 7.3 0.1 100.0 1.525-29 40.2 30.7 15.2 6.1 0.3 0.1 6.3 1.0 100.0 6.830-34 10.8 12.9 18.4 24.7 14.5 5.7 7.1 5.9 100.0 8.335-39 4.8 5.4 8.5 14.1 14.3 29.2 7.1 16.6 100.0 7.440-44 3.9 3.4 7.4 7.7 9.1 39.5 7.1 21.8 100.0 6.745-49 3.0 2.2 7.2 7.1 7.2 44.7 6.7 21.9 100.0 5.750-54 1.4 1.5 4.6 5.1 4.9 52.0 6.0 24.5 100.0 5.655-59 0.9 0.5 3.9 4.1 4.4 54.3 6.6 25.3 100.0 4.4
0.6 0.3 8.0 5.3 6.1 50.9 7.7 20.9 100.0 1.0All ages 12.5 8.6 9.7 10.4 8.1 28.7 6.8 15.1 100.0 47.4
Under 25 86.1 4.2 - 2.8 - - 6.9 - 100.0 0.125-29 44.9 29.3 11.6 3.8 0.3 - 8.3 1.8 100.0 0.430-34 13.2 15.5 19.4 18.5 8.5 4.5 8.1 12.3 100.0 0.535-39 4.0 4.9 14.8 14.8 13.7 20.7 5.6 21.6 100.0 0.740-44 4.2 3.4 12.5 9.1 10.3 26.8 6.8 27.0 100.0 0.645-49 2.6 2.5 9.2 9.5 8.6 32.8 7.2 27.6 100.0 0.750-54 1.8 0.8 7.8 5.3 7.5 38.5 6.2 32.2 100.0 0.955-59 1.5 0.4 5.6 4.7 5.1 40.1 6.7 35.9 100.0 0.9
0.4 0.4 12.1 7.4 6.2 41.6 10.1 21.8 100.0 0.3All ages 8.1 5.6 10.7 8.8 7.8 27.2 7.0 24.7 100.0 5.1
Under 25 90.3 3.0 0.1 0.2 0.1 - 6.1 0.1 100.0 2.825-29 43.3 29.3 13.6 5.6 0.3 0.1 5.9 2.0 100.0 11.230-34 13.3 13.3 17.6 22.1 12.4 4.6 6.4 10.3 100.0 13.335-39 5.8 5.8 9.4 13.6 12.9 22.6 5.9 23.9 100.0 12.240-44 4.7 3.7 7.7 8.4 8.8 31.2 6.2 29.3 100.0 10.845-49 3.3 2.4 7.5 7.1 7.4 36.2 5.9 30.1 100.0 9.350-54 1.6 1.4 5.3 5.5 5.7 43.4 5.5 31.4 100.0 8.655-59 1.0 0.5 4.5 4.4 4.6 44.4 5.5 35.1 100.0 7.3
0.7 0.3 8.8 5.3 5.9 41.7 7.2 30.2 100.0 1.6All ages 14.2 8.6 9.7 9.9 7.5 23.0 6.0 21.0 100.0 77.1
Under 25 83.8 3.1 - 0.1 - 0.1 12.6 0.4 100.0 1.125-29 39.4 28.0 11.5 5.8 0.2 - 13.1 1.9 100.0 4.330-34 10.5 11.2 15.7 22.0 13.3 5.3 13.0 9.0 100.0 4.635-39 5.3 5.1 7.5 11.3 12.8 25.7 12.6 19.8 100.0 4.240-44 4.2 3.4 6.8 7.9 8.2 34.8 11.6 23.2 100.0 3.845-49 3.1 2.9 6.5 6.6 7.0 39.6 11.9 22.5 100.0 3.050-54 2.0 1.6 4.9 5.4 5.3 45.2 12.8 22.9 100.0 3.055-59 1.2 0.5 4.0 4.5 4.6 46.8 11.3 27.2 100.0 2.3
0.9 0.3 6.3 5.9 5.0 42.9 16.7 22.0 100.0 0.6All ages 13.5 8.4 8.4 9.4 7.4 24.3 12.5 16.1 100.0 26.8
Under 25 88.5 3.0 0.1 0.2 0.1 0.1 7.9 0.2 100.0 3.925-29 42.2 28.9 13.0 5.6 0.3 0.1 7.9 2.0 100.0 15.530-34 12.6 12.8 17.1 22.0 12.6 4.8 8.1 10.0 100.0 17.935-39 5.7 5.6 8.9 13.0 12.9 23.4 7.6 22.8 100.0 16.440-44 4.5 3.6 7.5 8.3 8.6 32.1 7.6 27.7 100.0 14.645-49 3.3 2.5 7.3 7.0 7.3 37.0 7.4 28.3 100.0 12.350-54 1.7 1.5 5.2 5.5 5.6 43.8 7.4 29.2 100.0 11.555-59 1.0 0.5 4.4 4.4 4.6 45.0 6.9 33.2 100.0 9.6
0.7 0.3 8.1 5.4 5.7 42.0 9.6 28.1 100.0 2.2All ages 14.0 8.5 9.4 9.8 7.5 23.4 7.7 19.8 100.0 103.8
Table 8Full-time regular qualified1 teachers in publicly funded schools by gender, pay scale point, sector and age.November 2011England
MENPercentage of teachers in each age band
NURSERY AND PRIMARY
60 and over
Classroom teachers' pay scalesMain pay scale Upper Pay Scale
Total numbers (Thousands)4
continued overleaf
SECONDARY
60 and over
SPECIAL AND CENTRALLY EMPLOYED
60 and over
TOTAL MAINTAINED SECTOR
60 and over
ACADEMIES
60 and over
ALL PUBLICLY FUNDED SCHOOLS
60 and over

Other2
1 - 3 4 - 5 6 1 2 3 Leadership Total %
Under 25 89.1 5.1 0.1 - - - 5.4 0.2 100.0 10.625-29 36.5 32.2 15.6 7.9 0.4 0.1 5.3 1.9 100.0 27.130-34 11.6 11.4 16.8 24.0 13.9 4.8 5.6 11.8 100.0 21.635-39 8.1 5.7 10.7 14.5 13.3 19.7 4.8 23.1 100.0 15.440-44 9.1 6.5 10.3 10.7 9.5 22.3 4.9 26.7 100.0 14.545-49 6.2 5.5 9.8 10.7 9.7 23.8 4.6 29.8 100.0 14.750-54 2.7 2.6 7.5 8.6 9.8 31.3 4.5 33.1 100.0 13.355-59 1.0 0.6 4.0 5.2 8.6 39.7 4.4 36.5 100.0 12.5
1.9 0.5 5.6 5.0 8.3 37.8 3.5 37.4 100.0 2.4All ages 19.6 11.2 10.6 11.0 8.0 15.8 5.0 18.7 100.0 132.0
Under 25 91.9 1.9 0.1 0.1 0.1 0.1 5.7 0.2 100.0 4.025-29 37.9 33.2 14.6 6.8 0.3 0.1 6.5 0.6 100.0 14.530-34 9.8 12.1 16.7 26.9 16.7 6.5 7.4 3.8 100.0 13.235-39 6.0 6.0 9.1 13.2 15.7 31.6 7.5 10.9 100.0 8.740-44 6.2 5.8 7.6 9.9 9.4 39.4 7.2 14.5 100.0 7.045-49 4.0 4.3 7.7 9.3 8.7 42.5 6.9 16.5 100.0 6.650-54 1.5 1.6 4.1 5.6 6.6 52.9 6.9 20.9 100.0 7.255-59 0.9 0.5 3.0 3.6 4.6 61.1 6.7 19.6 100.0 5.5
0.6 0.1 4.7 4.4 5.2 60.1 8.2 16.7 100.0 1.1All ages 17.5 11.6 9.9 11.3 8.3 25.0 7.0 9.4 100.0 67.6
Under 25 87.7 4.8 0.3 - - - 6.8 0.3 100.0 0.325-29 37.5 31.1 16.0 7.4 0.3 0.2 5.9 1.6 100.0 1.330-34 9.1 12.3 21.2 24.5 13.8 4.4 6.8 8.0 100.0 1.535-39 7.1 4.8 13.4 14.9 14.2 21.5 8.3 15.9 100.0 1.340-44 6.8 4.6 10.2 11.7 10.6 30.1 7.3 18.9 100.0 1.445-49 3.7 3.7 8.4 8.9 8.0 35.5 7.1 24.7 100.0 1.750-54 2.3 1.3 6.0 5.8 7.2 41.8 7.4 28.3 100.0 2.155-59 1.0 0.6 4.1 3.6 6.7 50.9 5.9 27.2 100.0 2.4
1.1 0.7 9.1 5.1 4.7 46.2 7.7 25.4 100.0 0.5All ages 9.6 6.7 10.1 9.6 8.1 29.7 6.9 19.3 100.0 12.6
Under 25 89.8 4.3 0.1 0.1 0.1 - 5.5 0.2 100.0 14.925-29 37.0 32.5 15.3 7.5 0.4 0.1 5.8 1.5 100.0 42.930-34 10.9 11.7 17.0 25.1 14.9 5.4 6.3 8.7 100.0 36.235-39 7.3 5.8 10.3 14.1 14.2 23.9 5.9 18.5 100.0 25.440-44 8.1 6.2 9.4 10.5 9.6 28.0 5.8 22.5 100.0 22.845-49 5.4 5.0 9.1 10.1 9.3 30.0 5.4 25.6 100.0 23.050-54 2.3 2.1 6.2 7.4 8.5 39.1 5.5 28.8 100.0 22.655-59 1.0 0.5 3.8 4.6 7.3 46.8 5.2 30.9 100.0 20.3
1.5 0.4 5.9 4.8 7.0 44.8 5.3 30.4 100.0 4.0All ages 18.3 11.1 10.4 11.0 8.1 19.6 5.7 15.8 100.0 212.2
Under 25 84.8 2.9 0.1 0.1 - - 11.4 0.6 100.0 2.825-29 36.3 29.4 13.0 6.2 0.3 - 13.2 1.5 100.0 9.030-34 10.3 10.7 14.5 22.4 15.5 6.4 13.7 6.5 100.0 7.635-39 6.9 4.9 8.1 13.3 13.2 27.0 13.9 12.7 100.0 4.840-44 7.2 5.1 8.2 9.5 8.0 33.1 13.3 15.5 100.0 3.945-49 5.0 4.9 7.2 10.3 8.6 34.9 12.4 16.8 100.0 3.750-54 1.9 2.0 4.1 6.0 5.8 47.9 12.3 20.0 100.0 3.855-59 0.8 0.8 2.4 3.3 4.9 56.7 10.8 20.3 100.0 3.0
0.5 0.5 3.9 4.4 5.0 54.9 12.3 18.5 100.0 0.6All ages 18.7 10.9 8.9 10.2 7.3 20.9 12.9 10.1 100.0 39.1
Under 25 89.0 4.1 0.1 0.1 0.1 - 6.4 0.3 100.0 17.725-29 36.9 32.0 14.9 7.3 0.4 0.1 7.1 1.5 100.0 51.930-34 10.8 11.6 16.5 24.6 15.0 5.6 7.6 8.4 100.0 43.835-39 7.2 5.6 10.0 14.0 14.0 24.4 7.2 17.6 100.0 30.240-44 7.9 6.0 9.3 10.4 9.3 28.7 6.9 21.5 100.0 26.745-49 5.3 5.0 8.8 10.2 9.2 30.7 6.4 24.4 100.0 26.750-54 2.2 2.1 5.9 7.2 8.1 40.4 6.5 27.5 100.0 26.455-59 1.0 0.6 3.6 4.4 7.0 48.0 5.9 29.5 100.0 23.3
1.3 0.4 5.6 4.8 6.8 46.0 6.2 28.9 100.0 4.6All ages 18.4 11.0 10.1 10.9 8.0 19.8 6.8 14.9 100.0 251.3
continued overleaf
ALL PUBLICLY FUNDED SCHOOLS
60 and over
ACADEMIES
60 and over
Table 8 continued
Total numbers (Thousands)4
NURSERY AND PRIMARY
60 and over
Table 8Full-time regular qualified1 teachers in publicly funded schools by gender, pay scale point, sector and age.November 2011England
WOMENPercentage of teachers in each age band
TOTAL MAINTAINED SCHOOLS
60 and over
Classroom teachers' pay scalesMain pay scale Upper Pay Scale
SECONDARY
60 and over
SPECIAL AND CENTRALLY EMPLOYED
60 and over

Other2
1 - 3 4 - 5 6 1 2 3 Leadership Total %
Under 25 89.3 5.0 0.1 0.1 0.1 - 5.3 0.2 100.0 11.925-29 38.1 31.5 15.0 7.5 0.4 0.1 5.3 2.2 100.0 31.130-34 12.7 11.8 16.7 22.9 13.1 4.5 5.5 12.9 100.0 26.035-39 8.1 5.9 10.6 14.1 12.7 17.9 4.6 26.1 100.0 19.540-44 8.5 6.1 9.7 10.5 9.2 21.1 4.8 30.1 100.0 17.945-49 5.9 5.1 9.4 10.0 9.3 23.2 4.5 32.6 100.0 17.650-54 2.6 2.4 7.3 8.3 9.4 30.2 4.5 35.3 100.0 15.455-59 1.0 0.6 4.2 5.2 8.1 37.6 4.1 39.3 100.0 14.4
1.8 0.4 6.0 4.8 7.9 35.3 3.6 40.2 100.0 2.9All ages 19.5 10.9 10.4 10.8 7.7 15.1 4.9 20.8 100.0 156.8
Under 25 91.4 2.0 0.1 0.1 0.1 0.1 6.1 0.2 100.0 5.525-29 38.7 32.4 14.8 6.5 0.3 0.1 6.5 0.7 100.0 21.430-34 10.2 12.4 17.4 26.0 15.8 6.2 7.3 4.6 100.0 21.535-39 5.4 5.7 8.8 13.6 15.1 30.5 7.3 13.5 100.0 16.140-44 5.1 4.7 7.5 8.8 9.3 39.4 7.1 18.1 100.0 13.745-49 3.5 3.4 7.5 8.3 8.0 43.5 6.8 19.0 100.0 12.350-54 1.4 1.6 4.3 5.4 5.9 52.5 6.5 22.5 100.0 12.855-59 0.9 0.5 3.4 3.8 4.5 58.1 6.7 22.1 100.0 9.9
0.6 0.2 6.3 4.9 5.7 55.7 8.0 18.7 100.0 2.0All ages 15.5 10.4 9.8 10.9 8.2 26.5 6.9 11.8 100.0 115.1
Under 25 87.5 4.6 0.3 0.5 - - 6.8 0.3 100.0 0.425-29 39.2 30.7 15.0 6.6 0.3 0.2 6.4 1.7 100.0 1.730-34 10.2 13.1 20.7 23.0 12.4 4.4 7.1 9.1 100.0 2.035-39 6.1 4.8 13.9 14.9 14.0 21.1 7.4 17.8 100.0 2.040-44 6.0 4.2 10.9 10.8 10.5 29.1 7.2 21.4 100.0 2.045-49 3.4 3.4 8.7 9.0 8.2 34.7 7.2 25.5 100.0 2.450-54 2.1 1.2 6.5 5.6 7.3 40.8 7.0 29.4 100.0 3.055-59 1.1 0.5 4.5 4.0 6.3 47.8 6.1 29.7 100.0 3.3
0.9 0.6 10.0 5.8 5.2 44.8 8.4 24.2 100.0 0.8All ages 9.2 6.4 10.2 9.4 8.0 28.9 6.9 20.8 100.0 17.7
Under 25 89.9 4.1 0.1 0.1 0.1 - 5.6 0.2 100.0 17.825-29 38.4 31.9 14.9 7.1 0.3 0.1 5.8 1.6 100.0 54.230-34 11.5 12.2 17.2 24.3 14.2 5.2 6.3 9.2 100.0 49.535-39 6.8 5.8 10.0 13.9 13.8 23.4 5.9 20.3 100.0 37.640-44 7.0 5.4 8.9 9.8 9.3 29.0 5.9 24.7 100.0 33.645-49 4.8 4.3 8.6 9.3 8.7 31.8 5.6 26.9 100.0 32.350-54 2.1 1.9 6.0 6.9 7.8 40.3 5.5 29.5 100.0 31.255-59 1.0 0.5 3.9 4.6 6.6 46.1 5.3 32.0 100.0 27.6
1.2 0.4 6.7 5.0 6.7 43.9 5.8 30.3 100.0 5.7All ages 17.3 10.4 10.2 10.7 7.9 20.5 5.8 17.2 100.0 289.5
Under 25 84.6 3.0 0.1 0.1 - - 11.7 0.6 100.0 3.925-29 37.4 29.0 12.5 6.1 0.3 - 13.2 1.6 100.0 13.330-34 10.4 10.9 14.9 22.2 14.7 6.0 13.4 7.4 100.0 12.235-39 6.1 5.0 7.8 12.4 13.0 26.4 13.3 16.0 100.0 9.040-44 5.7 4.2 7.5 8.7 8.1 33.9 12.4 19.3 100.0 7.745-49 4.2 4.0 6.9 8.6 7.8 37.0 12.2 19.3 100.0 6.750-54 2.0 1.8 4.5 5.7 5.6 46.7 12.5 21.2 100.0 6.855-59 1.0 0.7 3.1 3.8 4.8 52.4 11.0 23.3 100.0 5.3
0.7 0.4 5.1 5.2 5.0 48.9 14.5 20.2 100.0 1.2All ages 16.7 9.9 8.7 9.9 7.3 22.3 12.7 12.5 100.0 65.9
Under 25 89.0 3.9 0.1 0.1 0.1 - 6.7 0.2 100.0 21.725-29 38.2 31.3 14.4 6.9 0.3 0.1 7.2 1.6 100.0 67.530-34 11.3 11.9 16.7 23.9 14.3 5.4 7.7 8.8 100.0 61.735-39 6.7 5.6 9.6 13.6 13.6 24.0 7.4 19.4 100.0 46.640-44 6.7 5.2 8.7 9.6 9.1 29.9 7.1 23.7 100.0 41.345-49 4.7 4.2 8.3 9.2 8.6 32.7 6.7 25.6 100.0 39.050-54 2.1 1.9 5.7 6.7 7.4 41.4 6.8 28.0 100.0 38.055-59 1.0 0.6 3.8 4.4 6.3 47.1 6.2 30.6 100.0 32.9
1.1 0.4 6.4 5.0 6.4 44.7 7.3 28.6 100.0 6.9All ages 17.1 10.3 9.9 10.6 7.8 20.8 7.1 16.3 100.0 355.4
3. Includes gender unspecified.
Totals may not appear equal to the sum of the component parts because of rounding.
Source: School Workforce Census1. Teachers who have attained qualified teacher status. 2. Includes a proportion of teachers that are on other pay spines (Unqualified Teacher, Excellent Teachers, ASTs and unspecified).
- Negligible
4. Will not agree with the equivalent totals in tables 1 to 3 because no estimates are included for schools who did not submit a return for their staff. Please see paragraph 23 and 24 of the SFR technical notes for further information.
SPECIAL AND CENTRALLY EMPLOYED
60 and over
TOTAL MAINTAINED SCHOOLS
60 and over
ACADEMIES
60 and over
ALLPUBLICLY FUNDED SCHOOLS
60 and over
NURSERY AND PRIMARY
60 and over
SECONDARY
60 and over
Table 8 continuedTable 8Full-time regular qualified1 teachers in publicly funded schools by gender, pay scale point, sector and age.
Total numbers (Thousands)4
November 2011England
MEN AND WOMEN 3
Percentage of teachers in each age band Classroom teachers' pay scales
Main pay scale Upper Pay Scale

(Thousands)
UNDER £25,000 3
£25,000-£29,999
£30,000-£34,999
£35,000-£39,999
£40,000-£45,999
£45,000-£49,999
£50,000 AND OVER
MIS-REPORTED SALARY 4 TOTAL 5
AVERAGE SALARY (£)
2
0.8 0.4 - - - - - - 1.2 £23,7001.1 1.7 0.7 0.3 - - - - 3.9 £27,7000.4 0.8 1.1 1.0 0.2 0.1 - - 3.6 £32,4000.2 0.3 0.7 1.0 0.3 0.1 - - 2.6 £34,6000.1 0.2 0.4 0.8 0.2 0.1 - - 1.9 £35,2000.1 0.1 0.3 0.8 0.2 0.1 - - 1.6 £36,100
- - 0.2 0.6 0.2 0.1 - - 1.1 £37,000- - 0.2 0.5 0.1 - - - 0.8 £37,600- - - 0.1 - - - - 0.2 £37,400
2.7 3.6 3.7 4.9 1.3 0.4 0.1 0.1 16.9 £32,300
6.7 3.7 0.2 - - - - 0.1 10.6 £24,0004.8 12.0 7.0 2.2 0.4 0.1 - 0.2 26.6 £28,8001.2 3.1 6.4 6.5 1.3 0.4 - 0.1 19.1 £33,8000.7 1.2 2.8 5.4 1.3 0.4 0.1 - 11.9 £35,2000.8 1.4 2.4 4.6 1.1 0.3 0.1 - 10.6 £34,7000.5 1.1 2.3 4.8 1.2 0.3 0.1 - 10.3 £35,4000.2 0.5 1.6 4.9 1.3 0.4 0.1 - 8.9 £36,700
- 0.1 0.9 5.0 1.4 0.4 0.1 - 8.0 £37,900- - 0.2 0.9 0.3 0.1 - - 1.5 £37,900
14.8 23.1 23.7 34.4 8.4 2.3 0.4 0.5 107.6 £32,600
Men and Women 7
7.5 4.0 0.2 - - - - 0.1 11.9 £23,9005.9 13.8 7.7 2.5 0.4 0.1 - 0.2 30.5 £28,7001.6 3.9 7.5 7.5 1.5 0.5 0.1 0.1 22.7 £33,5000.9 1.6 3.5 6.4 1.6 0.5 0.1 - 14.5 £35,1000.9 1.6 2.8 5.4 1.3 0.4 0.1 0.1 12.6 £34,8000.5 1.2 2.6 5.6 1.4 0.4 0.1 - 11.9 £35,5000.2 0.5 1.8 5.5 1.5 0.4 0.1 - 10.0 £36,8000.1 0.2 1.0 5.5 1.6 0.4 0.1 - 8.8 £37,900
- - 0.2 1.0 0.3 0.1 - - 1.7 £37,90017.6 26.8 27.4 39.3 9.7 2.7 0.5 0.6 124.5 £32,600
1.0 0.5 - - - - - - 1.5 £24,0001.4 2.5 1.5 0.9 0.3 0.1 - 0.1 6.8 £29,7000.4 1.1 1.8 2.2 1.7 0.5 0.2 - 7.9 £36,1000.2 0.5 0.8 1.8 1.7 1.0 0.2 - 6.2 £39,2000.2 0.3 0.6 1.5 1.4 1.0 0.3 - 5.3 £39,9000.1 0.2 0.5 1.5 1.2 0.8 0.2 - 4.5 £40,100
- 0.1 0.4 1.5 1.3 0.8 0.2 - 4.3 £40,800- - 0.2 1.1 1.0 0.7 0.2 - 3.4 £41,400- - 0.1 0.3 0.2 0.1 0.1 - 0.8 £40,600
3.3 5.2 5.9 10.7 8.8 5.1 1.4 0.3 40.6 £37,000
2.6 1.2 0.1 - - - - 0.1 4.0 £24,0002.6 5.7 3.4 1.9 0.6 0.1 - 0.1 14.5 £29,9000.6 1.7 2.9 3.9 2.5 0.9 0.3 0.1 12.8 £36,4000.3 0.6 1.1 2.5 2.1 1.0 0.3 - 7.8 £38,6000.2 0.5 0.8 1.8 1.6 0.9 0.3 - 6.0 £38,9000.1 0.3 0.7 1.7 1.4 0.9 0.3 - 5.5 £39,400
- 0.2 0.4 1.9 1.8 1.1 0.3 - 5.8 £40,900- 0.1 0.2 1.5 1.4 0.9 0.2 - 4.4 £41,400- - 0.1 0.3 0.3 0.2 0.1 - 0.9 £41,400
6.5 10.2 9.6 15.6 11.7 6.0 1.7 0.4 61.7 £35,700
Men and Women 7
3.6 1.7 0.1 - - - - 0.1 5.5 £24,0004.0 8.2 4.9 2.8 1.0 0.2 0.1 0.2 21.3 £29,8001.0 2.8 4.6 6.1 4.2 1.4 0.4 0.1 20.7 £36,3000.4 1.1 1.9 4.3 3.8 2.0 0.5 0.1 14.0 £38,9000.4 0.8 1.4 3.3 3.0 1.9 0.6 0.1 11.3 £39,3000.2 0.5 1.2 3.2 2.6 1.8 0.5 - 10.0 £39,7000.1 0.3 0.8 3.4 3.0 2.0 0.5 - 10.1 £40,900
- 0.1 0.5 2.7 2.4 1.7 0.4 - 7.8 £41,400- - 0.2 0.6 0.4 0.3 0.1 - 1.7 £41,000
9.8 15.4 15.5 26.4 20.5 11.1 3.1 0.6 102.3 £36,200
Table 9aFull-time regular qualified classroom teachers1 in publicly funded schools by salary bands, average salary 2, sector, gender and age.November 2011England
NURSERY AND PRIMARY Men
40-4445-49
Under 2525-2930-3435-39
45-4950-54
50-5455-5960 and overAll ages 6
WomenUnder 2525-2930-3435-3940-44
55-5960 and over
55-5960 and overAll ages 6
Under 2525-2930-3435-3940-4445-4950-54
55-5960 and over
All ages 6
SECONDARY Men
Under 2525-2930-3435-3940-4445-4950-54
60 and overAll ages 6
All ages 6
WomenUnder 2525-2930-3435-3940-4445-4950-5455-59
continued overleaf
Under 2525-2930-3435-3940-4445-4950-5455-5960 and overAll ages 6

(Thousands)
UNDER £25,000 3
£25,000-£29,999
£30,000-£34,999
£35,000-£39,999
£40,000-£45,999
£45,000-£49,999
£50,000 AND OVER
MIS-REPORTED SALARY 4 TOTAL 5
AVERAGE SALARY (£)
2
- - - - - - - - 0.1 £24,8000.1 0.2 0.1 - - - - - 0.4 £29,200
- 0.1 0.1 0.1 0.1 - - - 0.5 £35,000- - 0.1 0.2 0.2 - - - 0.5 £38,100- - 0.1 0.2 0.1 - - - 0.5 £38,200- - 0.1 0.2 0.2 - - - 0.5 £38,600- - 0.1 0.2 0.2 0.1 - - 0.6 £39,800- - - 0.2 0.2 0.1 - - 0.6 £40,200- - - 0.1 0.1 - - - 0.2 £38,900
0.2 0.4 0.6 1.3 1.0 0.3 0.1 - 3.9 £37,300
0.1 0.1 - - - - - - 0.3 £25,1000.2 0.5 0.4 0.2 - - - - 1.3 £30,400
- 0.2 0.4 0.5 0.2 0.1 - - 1.4 £35,800- 0.1 0.2 0.4 0.3 0.1 - - 1.1 £37,700- 0.1 0.2 0.4 0.3 0.1 - - 1.1 £38,000- 0.1 0.2 0.5 0.4 0.1 - - 1.3 £38,500- 0.1 0.1 0.6 0.6 0.2 0.1 - 1.6 £40,000- - 0.1 0.6 0.8 0.2 0.1 - 1.8 £40,700- - - 0.2 0.1 - - - 0.4 £39,700
0.5 1.1 1.6 3.4 2.7 0.7 0.3 - 10.3 £37,300
Men and Women 7
0.2 0.2 - - - - - - 0.4 £25,0000.2 0.6 0.5 0.2 - - - - 1.7 £30,1000.1 0.2 0.5 0.7 0.3 0.1 - - 1.9 £35,600
- 0.1 0.3 0.7 0.4 0.1 - - 1.7 £37,800- 0.1 0.2 0.6 0.4 0.1 - - 1.6 £38,000- 0.1 0.2 0.7 0.6 0.1 - - 1.8 £38,500- 0.1 0.2 0.8 0.8 0.2 0.1 - 2.2 £39,900- - 0.2 0.9 1.0 0.2 0.1 - 2.4 £40,500- - 0.1 0.2 0.2 0.1 - - 0.6 £39,500
0.6 1.5 2.2 4.7 3.7 1.0 0.4 0.1 14.2 £37,300
1.9 0.8 0.1 - - - - - 2.8 £23,9002.5 4.4 2.3 1.2 0.4 0.1 - 0.1 11.0 £29,0000.9 2.0 3.0 3.3 1.9 0.6 0.2 0.1 12.0 £34,9000.4 0.8 1.6 3.0 2.1 1.1 0.3 - 9.3 £37,8000.3 0.5 1.1 2.5 1.8 1.1 0.3 0.1 7.7 £38,6000.2 0.3 0.9 2.4 1.6 0.9 0.3 - 6.6 £39,0000.1 0.2 0.6 2.2 1.6 0.9 0.3 - 6.0 £40,000
- 0.1 0.4 1.8 1.4 0.9 0.2 - 4.8 £40,600- - 0.2 0.5 0.3 0.2 0.1 - 1.2 £39,800
6.2 9.2 10.2 17.0 11.1 5.7 1.6 0.4 61.3 £35,700
9.4 5.0 0.3 0.1 - - - 0.2 14.9 £24,0007.5 18.2 10.8 4.3 1.1 0.2 0.1 0.3 42.4 £29,2001.8 4.9 9.6 11.0 4.1 1.3 0.3 0.2 33.2 £34,9001.0 1.9 4.1 8.3 3.6 1.5 0.4 0.1 20.8 £36,6001.0 2.0 3.3 6.8 3.0 1.3 0.4 0.1 17.8 £36,3000.6 1.5 3.2 7.1 3.0 1.3 0.4 0.1 17.2 £36,9000.2 0.7 2.2 7.4 3.7 1.7 0.4 - 16.3 £38,5000.1 0.2 1.2 7.2 3.6 1.5 0.4 - 14.1 £39,300
- 0.1 0.3 1.4 0.7 0.3 0.1 - 2.8 £39,30021.7 34.4 34.9 53.4 22.8 9.1 2.4 0.9 179.6 £33,900
Men and Women 7
11.3 5.8 0.4 0.1 - - - 0.2 17.8 £24,00010.1 22.6 13.1 5.5 1.5 0.3 0.1 0.4 53.5 £29,200
2.7 6.9 12.7 14.3 6.0 1.9 0.5 0.2 45.2 £34,9001.4 2.7 5.7 11.3 5.8 2.6 0.6 0.1 30.2 £37,0001.3 2.5 4.4 9.3 4.8 2.4 0.7 0.1 25.5 £37,0000.8 1.8 4.1 9.5 4.6 2.3 0.6 0.1 23.8 £37,5000.3 0.8 2.8 9.6 5.3 2.6 0.7 0.1 22.2 £38,9000.1 0.3 1.6 9.0 5.0 2.3 0.6 0.1 19.0 £39,700
- 0.1 0.4 1.8 0.9 0.5 0.2 - 4.0 £39,40028.0 43.7 45.1 70.4 33.9 14.8 4.0 1.3 241.1 £34,400
40-4445-4950-5455-5960 and overAll ages 6
continued overleaf
50-5455-5960 and overAll ages 6
Under 2525-2930-3435-39
All ages 6
WomenUnder 2525-2930-3435-3940-4445-49
55-5960 and over
45-4950-54
Table 9a continued
40-4445-49
Table 9aFull-time regular qualified classroom teachers1 in publicly funded schools by salary bands, average salary 2, sector, gender and age.November 2011England
SPECIAL AND CENTRALLY EMPLOYED Men
Under 2525-2930-3435-39
45-4950-54
50-5455-5960 and overAll ages 6
WomenUnder 2525-2930-3435-3940-44
55-5960 and over
55-5960 and overAll ages 6
Under 2525-2930-3435-3940-4445-4950-54
35-3940-44
All ages 6
TOTAL MAINTAINED SECTOR Men
Under 2525-2930-34

(Thousands)
UNDER £25,000 3
£25,000-£29,999
£30,000-£34,999
£35,000-£39,999
£40,000-£45,999
£45,000-£49,999
£50,000 AND OVER
MIS-REPORTED SALARY 4 TOTAL 5
AVERAGE SALARY (£)
2
0.6 0.4 - - - - - - 1.1 £24,3000.9 1.5 0.9 0.5 0.2 - - 0.1 4.2 £29,7000.3 0.6 0.9 1.2 1.0 0.3 0.1 - 4.3 £36,4000.1 0.3 0.5 1.0 0.9 0.6 0.2 0.1 3.5 £39,2000.1 0.2 0.4 0.9 0.7 0.6 0.2 0.1 3.0 £39,8000.1 0.1 0.3 0.7 0.7 0.4 0.1 - 2.3 £40,000
- 0.1 0.2 0.7 0.7 0.5 0.1 - 2.3 £40,700- - 0.1 0.5 0.5 0.4 0.1 - 1.7 £41,400- - - 0.2 0.1 0.1 - - 0.5 £40,400
2.1 3.1 3.3 5.7 4.7 2.8 0.8 0.4 22.9 £36,700
1.8 0.9 0.1 - - - - 0.1 2.8 £24,1001.7 3.3 2.1 1.2 0.4 0.1 - 0.2 8.9 £29,8000.4 0.9 1.5 2.2 1.4 0.5 0.1 0.1 7.2 £36,2000.2 0.3 0.6 1.3 1.1 0.6 0.1 0.1 4.3 £38,3000.2 0.3 0.5 1.0 0.8 0.4 0.2 0.1 3.3 £38,3000.1 0.2 0.4 1.0 0.8 0.4 0.1 - 3.1 £38,600
- 0.1 0.3 1.1 0.9 0.6 0.1 - 3.1 £40,300- - 0.1 0.9 0.7 0.5 0.1 - 2.4 £41,300- - - 0.2 0.1 0.1 - - 0.5 £40,700
4.3 6.1 5.5 8.9 6.2 3.1 0.8 0.7 35.6 £35,100 Men and Women 7
2.4 1.2 0.1 - - - - 0.1 3.9 £24,2002.6 4.9 3.0 1.7 0.6 0.1 - 0.3 13.2 £29,8000.7 1.5 2.4 3.4 2.4 0.8 0.2 0.2 11.5 £36,3000.3 0.6 1.0 2.3 2.0 1.1 0.3 0.1 7.7 £38,7000.3 0.4 0.8 1.9 1.5 1.0 0.3 0.1 6.3 £39,0000.2 0.4 0.7 1.8 1.4 0.8 0.3 0.1 5.5 £39,2000.1 0.2 0.5 1.8 1.5 1.0 0.3 0.1 5.4 £40,500
- 0.1 0.3 1.4 1.2 0.8 0.2 0.1 4.1 £41,300- - 0.1 0.3 0.3 0.2 - - 0.9 £40,600
6.5 9.2 8.8 14.6 11.0 5.9 1.7 1.0 58.5 £35,700
2.5 1.2 0.1 - - - - 0.1 3.9 £24,0003.4 6.0 3.2 1.7 0.6 0.1 - 0.2 15.2 £29,2001.1 2.6 3.9 4.5 2.9 0.9 0.3 0.1 16.3 £35,3000.5 1.1 2.1 4.0 3.0 1.7 0.4 0.1 12.8 £38,2000.4 0.7 1.5 3.4 2.5 1.7 0.5 0.1 10.7 £38,9000.2 0.4 1.1 3.1 2.2 1.3 0.4 0.1 8.9 £39,3000.1 0.3 0.9 2.9 2.3 1.4 0.4 0.1 8.3 £40,200
- 0.1 0.6 2.4 1.9 1.2 0.3 0.1 6.5 £40,800- - 0.2 0.6 0.4 0.2 0.1 - 1.6 £40,000
8.3 12.3 13.5 22.7 15.8 8.5 2.4 0.8 84.2 £36,000
11.2 5.8 0.4 0.1 - - - 0.3 17.7 £24,0009.2 21.5 12.9 5.4 1.5 0.3 0.1 0.5 51.3 £29,3002.2 5.8 11.1 13.2 5.5 1.8 0.4 0.3 40.4 £35,1001.2 2.3 4.6 9.6 4.7 2.1 0.5 0.1 25.1 £36,9001.2 2.3 3.8 7.8 3.8 1.7 0.5 0.1 21.1 £36,6000.7 1.8 3.6 8.1 3.8 1.7 0.5 0.1 20.3 £37,2000.3 0.7 2.4 8.5 4.6 2.2 0.5 0.1 19.3 £38,8000.1 0.3 1.3 8.1 4.4 1.9 0.5 0.1 16.6 £39,600
- 0.1 0.3 1.5 0.8 0.4 0.1 - 3.3 £39,50026.1 40.5 40.3 62.3 29.0 12.1 3.2 1.6 215.1 £34,100
Men and Women 7
13.7 7.0 0.5 0.1 - - - 0.3 21.7 £24,00012.7 27.5 16.1 7.2 2.1 0.4 0.1 0.6 66.6 £29,300
3.4 8.4 15.0 17.7 8.4 2.7 0.7 0.4 56.7 £35,2001.7 3.3 6.7 13.6 7.7 3.7 0.9 0.2 37.9 £37,3001.6 3.0 5.2 11.2 6.3 3.4 1.0 0.2 31.8 £37,4000.9 2.2 4.7 11.3 6.1 3.0 0.9 0.2 29.2 £37,8000.4 1.0 3.3 11.4 6.9 3.6 0.9 0.2 27.6 £39,2000.1 0.3 1.9 10.4 6.2 3.1 0.9 0.1 23.1 £39,900
- 0.1 0.5 2.2 1.2 0.6 0.2 0.1 4.9 £39,60034.5 52.9 53.8 85.0 44.8 20.6 5.6 2.4 299.6 £34,700
Source: School Workforce Census
6. Includes a small number where age is not known or unspecified, therefore totals may not equal the sum of the component parts.7. Includes a small number where gender is unspecified or not known, therefore totals may not equal the sum of the component parts.
- Nil or negligible.Totals may not apprear to equal the sum of component parts because of rounding.
3. Includes those teachers earning at least £21,588, the lowest point on the classroom teachers' main pay scale in England, excluding Inner London, Outer London and London Fringe.4. Includes those whose salary was mis-reported or details were incomplete.
Numbers below 50 are shown as nil or negligible and average salaries based on totals below 50 are also are not provided.
5.Totals will not agree with tables 2 because no estimates are included for schools who did not submit information. Please see paragraph 23 and 24 of the SFR technical notes for further information.
8. The average salaries data for teachers in Academy schools shows a difference when compared with teachers in maintained schools. This difference is primarily due to the mix of schools being different for LA maintained and Academy schools. The latter have a different geographical distribution and higher proportion of secondary phase schools where salaries tend to be higher. See paragraph 32 in the technical notes.
40-4445-4950-5455-5960 and overAll ages 6
1. Includes full-time regular and qualified classroom teachers, advanced skills and excellent teachers.2. In each phase of education average salary is calculated by adding together the salaries of teachers in a given age band and dividing the total by the number of teachers in that age band. Please note this excludes those whose salary has been mis-reported.
50-5455-5960 and overAll ages 6
Under 2525-2930-3435-39
All ages 6
WomenUnder 2525-2930-3435-3940-4445-49
25-2930-3435-3940-4445-4950-5455-5960 and over
45-4950-5455-5960 and overAll ages 6
TOTAL PUBLICLY FUNDED SCHOOLS Men
Under 25
55-5960 and overAll ages 6
Under 2525-2930-3435-3940-44
WomenUnder 2525-2930-3435-3940-4445-4950-54
30-3435-3940-4445-4950-5455-5960 and overAll ages 6
Table 9aFull-time regular qualified classroom teachers1 in publicly funded schools by salary bands, average salary 2, sector, gender and age.November 2011England
ACADEMIES 8
MenUnder 2525-29
Table 9a continued

November 2011England
(Thousands)
UNDER £40,000 3
£40,000-£49,999
£50,000-£59,999
£60,000-£69,999
£70,000-£79,999
£80,000-£89,999
£90,000-£99,999
£100,000-£109,999
OVER £110,000 4
MIS-REPORTED SALARY 5 TOTAL6
AVERAGE SALARY (£) 2
- - - - - - - - - - - -- 0.1 - - - - - - - - 0.1 £42,500
0.1 0.5 0.2 - - - - - - - 0.8 £45,8000.1 0.8 0.5 0.1 - - - - - - 1.5 £50,000
- 0.6 0.6 0.2 0.1 - - - - - 1.5 £52,800- 0.4 0.6 0.3 0.1 - - - - - 1.4 £55,500- 0.2 0.4 0.3 0.1 - - - - - 1.0 £58,000- 0.2 0.4 0.3 0.1 - - - - - 1.1 £59,600- - 0.1 0.1 - - - - - - 0.2 £63,000
All ages 7 0.3 2.9 2.8 1.2 0.4 0.1 - - - - 7.8 £53,800
- - - - - - - - - - - -0.1 0.3 - - - - - - - - 0.5 £42,8000.3 1.8 0.3 - - - - - - - 2.5 £44,9000.2 2.2 1.0 0.1 - - - - - - 3.5 £48,0000.2 1.9 1.4 0.3 0.1 - - - - - 3.8 £50,3000.1 1.9 1.7 0.5 0.1 - - - - - 4.4 £51,9000.1 1.7 1.7 0.6 0.2 - - - - - 4.4 £53,1000.1 1.5 1.7 0.8 0.3 0.1 - - - - 4.5 £54,900
- 0.2 0.3 0.2 0.1 - - - - - 0.9 £57,900All ages 7 1.1 11.6 8.1 2.6 0.7 0.2 - - - - 24.4 £51,200
Men and Women 8
- - - - - - - - - - - -0.2 0.4 - - - - - - - - 0.6 £42,7000.4 2.4 0.5 - - - - - - - 3.3 £45,1000.2 3.0 1.5 0.2 - - - - - - 5.0 £48,6000.2 2.5 2.0 0.5 0.1 - - - - - 5.4 £51,0000.2 2.2 2.2 0.8 0.2 - - - - - 5.7 £52,8000.1 1.9 2.1 0.9 0.2 0.1 - - - - 5.5 £54,0000.1 1.7 2.2 1.1 0.4 0.1 - - - - 5.6 £55,800
- 0.3 0.4 0.3 0.1 0.1 - - - - 1.2 £59,000All ages 7 1.4 14.5 10.9 3.9 1.1 0.3 0.1 0.1 - 0.1 32.2 £51,800
- - - - - - - - - - - -- - - - - - - - - - 0.1 £50,600- 0.2 0.2 - - - - - - - 0.4 £52,400- 0.3 0.6 0.2 - - - - - - 1.2 £55,600- 0.2 0.7 0.3 0.1 0.1 - - - - 1.4 £59,300- 0.1 0.5 0.3 0.1 0.1 - - - - 1.2 £63,400- 0.1 0.5 0.3 0.1 0.1 0.1 - - - 1.3 £66,100- 0.1 0.4 0.2 0.1 0.1 0.1 - - - 1.1 £67,500- - 0.1 - - - - - - - 0.2 £73,200
All ages 7 0.1 0.9 3.1 1.3 0.5 0.4 0.2 0.1 0.1 - 6.8 £61,900
- - - - - - - - - - - -- - - - - - - - - - 0.1 £49,700- 0.2 0.2 - - - - - - - 0.4 £51,600- 0.2 0.5 0.1 - - - - - - 0.9 £54,000- 0.2 0.5 0.1 0.1 - - - - - 1.0 £57,300- 0.1 0.5 0.2 0.1 0.1 - - - - 1.0 £61,200- 0.2 0.7 0.3 0.1 0.1 0.1 - - - 1.4 £62,100- 0.1 0.4 0.2 0.1 0.1 0.1 - - - 1.0 £64,800- - 0.1 - - - - - - - 0.2 £67,200
All ages 7 - 1.0 2.9 1.0 0.4 0.3 0.2 0.1 - - 6.0 £59,700
Men and Women 8
- - - - - - - - - - - -- 0.1 - - - - - - - - 0.1 £50,200- 0.3 0.4 0.1 - - - - - - 0.8 £52,000- 0.5 1.1 0.3 0.1 - - - - - 2.0 £54,900- 0.3 1.2 0.4 0.2 0.1 - - - - 2.3 £58,500- 0.3 1.0 0.5 0.2 0.2 0.1 - - - 2.2 £62,400- 0.2 1.2 0.5 0.2 0.2 0.1 0.1 - - 2.7 £64,000- 0.2 0.9 0.4 0.2 0.2 0.1 0.1 - - 2.1 £66,200- - 0.1 0.1 - - - - - - 0.4 £70,400
All ages 7 0.1 1.9 6.0 2.3 0.9 0.7 0.4 0.2 0.1 - 12.8 £60,900
Table 9bFull-time regular qualified school leadership teachers 1 in publicly funded schools by salary bands, average salary 2, sector, gender and age.
NURSERY AND PRIMARY
MenUnder 2525-29
50-5455-59
30-3435-3940-4445-49
60 and over
Under 25
60 and over
WomenUnder 2525-2930-3435-3940-4445-4950-5455-59
Under 2525-29
25-2930-3435-3940-4445-4950-5455-5960 and over
SECONDARY
Men
30-3435-39
30-3435-3940-4445-4950-5455-5960 and over
WomenUnder 2525-29
45-4950-54
40-4445-4950-5455-5960 and over
Under 2525-2930-3435-3940-44
continued overleaf
55-5960 and over

November 2011England
(Thousands)
UNDER £40,000 3
£40,000-£49,999
£50,000-£59,999
£60,000-£69,999
£70,000-£79,999
£80,000-£89,999
£90,000-£99,999
£100,000-£109,999
OVER £110,000 4
MIS-REPORTED SALARY 5 TOTAL6
AVERAGE SALARY (£) 2
SPECIAL AND CENTRALLY EMPLOYED
- - - - - - - - - - - -- - - - - - - - - - - -- - - - - - - - - - 0.1 £50,200- 0.1 0.1 - - - - - - - 0.1 £53,000- 0.1 0.1 - - - - - - - 0.2 £55,400- 0.1 0.1 - - - - - - - 0.2 £59,000- - 0.1 0.1 - - - - - - 0.3 £63,600- 0.1 0.1 0.1 - - - - - - 0.3 £64,000- - - - - - - - - - 0.1 £62,500
All ages 7 - 0.3 0.4 0.2 0.1 0.1 - - - - 1.2 £60,000
- - - - - - - - - - - -- - - - - - - - - - - -- 0.1 - - - - - - - - 0.1 £48,700- 0.1 0.1 - - - - - - - 0.2 £51,100- 0.1 0.1 - - - - - - - 0.2 £54,000- 0.1 0.1 0.1 - - - - - - 0.4 £56,200- 0.2 0.2 0.1 0.1 - - - - - 0.6 £57,600- 0.2 0.2 0.1 0.1 - - - - - 0.6 £57,700- - - - - - - - - - 0.1 £60,600
All ages 7 - 0.8 0.8 0.4 0.2 0.1 - - - - 2.3 £56,100
Men and Women 8
- - - - - - - - - - - -- - - - - - - - - - - -- 0.1 0.1 - - - - - - - 0.2 £49,200- 0.2 0.1 - - - - - - - 0.3 £51,900- 0.2 0.2 0.1 - - - - - - 0.4 £54,600- 0.2 0.2 0.1 0.1 - - - - - 0.6 £57,100- 0.2 0.3 0.2 0.1 - - - - - 0.8 £59,600- 0.2 0.3 0.2 0.1 - - - - - 0.9 £59,900- - 0.1 - - - - - - - 0.2 £61,200
All ages 7 - 1.1 1.2 0.6 0.3 0.1 0.1 - - - 3.5 £57,400
- - - - - - - - - - - -- 0.1 - - - - - - - - 0.2 £44,700
0.1 0.7 0.4 0.1 - - - - - - 1.3 £48,2000.1 1.1 1.2 0.3 0.1 - - - - - 2.8 £52,5000.1 0.8 1.4 0.5 0.2 0.1 - - - - 3.1 £55,900
- 0.5 1.2 0.6 0.2 0.1 0.1 - - - 2.7 £59,200- 0.3 1.1 0.6 0.3 0.2 0.1 0.1 - - 2.6 £62,600- 0.3 0.9 0.6 0.3 0.2 0.1 0.1 - - 2.5 £63,600- 0.1 0.2 0.1 0.1 - - - - - 0.5 £67,000
All ages 7 0.3 4.1 6.4 2.7 1.1 0.6 0.3 0.2 0.1 - 15.8 £57,800
- - - - - - - - - - - -0.1 0.3 - - - - - - - - 0.5 £43,5000.3 2.1 0.6 0.1 - - - - - - 3.0 £45,9000.2 2.5 1.5 0.3 - - - - - - 4.6 £49,3000.2 2.2 2.0 0.5 0.1 - - - - - 5.0 £51,8000.1 2.1 2.3 0.8 0.2 0.1 - - - - 5.8 £53,9000.1 2.1 2.6 1.0 0.3 0.2 0.1 - - - 6.4 £55,5000.1 1.8 2.4 1.1 0.4 0.2 0.1 - - - 6.2 £56,900
- 0.3 0.4 0.3 0.1 0.1 - - - - 1.2 £59,500All ages 7 1.2 13.4 11.8 4.0 1.3 0.6 0.2 0.1 - 0.1 32.7 £53,100
Men and Women 8
- - - - - - - - - - - -0.2 0.5 0.1 - - - - - - - 0.7 £43,9000.4 2.8 0.9 0.1 - - - - - - 4.3 £46,6000.3 3.7 2.7 0.6 0.1 - - - - - 7.4 £50,5000.2 3.0 3.4 1.0 0.3 0.1 - - - - 8.1 £53,3000.2 2.7 3.4 1.4 0.4 0.2 0.1 - - - 8.5 £55,6000.2 2.4 3.7 1.6 0.6 0.3 0.2 0.1 - - 9.0 £57,5000.1 2.1 3.3 1.7 0.7 0.3 0.2 0.1 - - 8.7 £58,800
- 0.3 0.6 0.4 0.2 0.1 - - - - 1.7 £61,700All ages 7 1.5 17.5 18.2 6.8 2.3 1.2 0.5 0.3 0.1 0.1 48.4 £54,60060 and over
continued overleaf
Under 2525-2930-3435-3940-4445-4950-5455-59
25-2930-3435-3940-4445-4950-5455-5960 and over
WomenUnder 25
55-5960 and over
Table 9b continuedTable 9bFull-time regular qualified school leadership teachers 1 in publicly funded schools by salary bands, average salary 2, sector, gender and age.
35-3940-44
MenUnder 2525-2930-34
45-4950-54
45-4950-5455-5960 and over
WomenUnder 2525-2930-3435-3940-44
60 and over
TOTAL MAINTAINED SECTOR
55-5960 and over
Under 2525-2930-3435-3940-4445-4950-5455-59
45-4950-54
MenUnder 2525-2930-3435-3940-44

November 2011England
(Thousands)
UNDER £40,000 3
£40,000-£49,999
£50,000-£59,999
£60,000-£69,999
£70,000-£79,999
£80,000-£89,999
£90,000-£99,999
£100,000-£109,999
OVER £110,000 4
MIS-REPORTED SALARY 5 TOTAL6
AVERAGE SALARY (£) 2
ACADEMIES 9
- - - - - - - - - - - -- - - - - - - - - - - -- 0.1 0.2 - - - - - - - 0.3 £52,600- 0.1 0.4 0.1 - - - - - - 0.7 £56,700- 0.1 0.4 0.2 - - - - - - 0.8 £60,000- 0.1 0.3 0.1 0.1 0.1 - - - - 0.6 £64,900- - 0.2 0.1 0.1 - - - - - 0.6 £68,800- - 0.2 0.1 0.1 0.1 - 0.1 - - 0.6 £71,800- - - - - - - - - - 0.1 £77,700
All ages 7 - 0.5 1.7 0.7 0.3 0.2 0.2 0.2 0.1 0.1 3.9 £63,300
- - - - - - - - - - - -- - - - - - - - - - 0.1 £45,000- 0.2 0.2 - - - - - - - 0.4 £50,400- 0.1 0.3 0.1 - - - - - - 0.5 £54,600- 0.1 0.3 0.1 - - - - - - 0.6 £57,800- 0.1 0.3 0.1 - - - - - - 0.6 £60,500- 0.1 0.3 0.1 0.1 - - - - - 0.7 £63,000- 0.1 0.2 0.1 0.1 - - - - - 0.6 £65,400- - - - - - - - - - 0.1 £68,100
All ages 7 0.1 0.6 1.6 0.6 0.2 0.1 0.1 0.1 - 0.1 3.5 £59,400 Men and Women 8
- - - - - - - - - - - -- - - - - - - - - - 0.1 £46,600- 0.3 0.3 - - - - - - - 0.7 £51,400- 0.3 0.7 0.2 0.1 - - - - - 1.3 £55,900- 0.2 0.7 0.3 0.1 - - - - - 1.4 £59,100- 0.1 0.5 0.2 0.1 0.1 0.1 - - - 1.2 £62,800- 0.1 0.6 0.3 0.1 0.1 0.1 0.1 - - 1.4 £65,700- 0.1 0.4 0.2 0.1 0.1 0.1 0.1 - - 1.2 £68,700- - 0.1 0.1 - - - - - - 0.2 £73,300
All ages 7 0.1 1.1 3.3 1.3 0.5 0.3 0.3 0.2 0.1 0.1 7.4 £61,500
TOTAL PUBLICLY FUNDED SCHOOLS
- - - - - - - - - - - -- 0.1 - - - - - - - - 0.2 £45,400
0.1 0.8 0.5 0.1 - - - - - - 1.6 £49,0000.1 1.3 1.6 0.4 0.1 - - - - - 3.6 £53,3000.1 0.9 1.8 0.7 0.2 0.1 - - - - 3.9 £56,700
- 0.6 1.4 0.7 0.2 0.2 0.1 - - - 3.4 £60,200- 0.4 1.3 0.7 0.3 0.2 0.1 0.1 - - 3.3 £63,800- 0.3 1.1 0.7 0.3 0.2 0.1 0.1 - - 3.1 £65,100- 0.1 0.2 0.2 0.1 - - - - - 0.6 £69,100
All ages 7 0.4 4.6 8.1 3.5 1.3 0.8 0.4 0.3 0.1 0.1 19.7 £58,900
- - - - - - - - - - - -0.2 0.4 0.1 - - - - - - - 0.6 £43,7000.3 2.2 0.7 0.1 - - - - - - 3.4 £46,4000.2 2.6 1.8 0.3 0.1 - - - - - 5.1 £49,8000.2 2.3 2.3 0.6 0.2 0.1 - - - - 5.6 £52,4000.2 2.2 2.5 0.9 0.3 0.1 0.1 - - - 6.4 £54,5000.1 2.1 2.9 1.1 0.4 0.2 0.1 0.1 - - 7.1 £56,2000.1 1.9 2.6 1.2 0.5 0.2 0.1 0.1 - - 6.7 £57,600
- 0.3 0.5 0.3 0.1 0.1 - - - - 1.3 £60,200All ages 7 1.3 14.0 13.4 4.6 1.5 0.7 0.3 0.2 0.1 0.1 36.1 £53,700
Men and Women 8
- - - - - - - - - - - -0.2 0.5 0.1 - - - - - - - 0.8 £44,2000.4 3.1 1.2 0.2 - - - - - - 4.9 £47,2000.3 3.9 3.4 0.8 0.2 0.1 - - - - 8.7 £51,3000.2 3.2 4.1 1.3 0.4 0.2 0.1 - - - 9.5 £54,1000.2 2.8 4.0 1.6 0.5 0.3 0.1 0.1 - - 9.8 £56,5000.2 2.5 4.2 1.9 0.7 0.4 0.2 0.2 0.1 - 10.4 £58,6000.1 2.2 3.8 2.0 0.8 0.4 0.2 0.2 0.1 - 9.8 £60,000
- 0.4 0.7 0.4 0.2 0.1 0.1 0.1 - - 1.9 £63,000All ages 7 1.6 18.6 21.5 8.1 2.8 1.5 0.8 0.5 0.2 0.2 55.9 £55,500
Source: School Workforce Census1. Includes full-time heads, deputy and assistant heads.
5. Includes those whose salary was mis-reported or details were incomplete.
7. Includes a small number where age is not known or unspecified, therefore totals may not equal the sum of the component parts.8. Includes a small number where gender is unspecified or not known, therefore totals may not equal the sum of the component parts.9. See footnote 8 in Table 9a.
Totals may not apprear to equal the sum of component parts because of rounding.
3. Includes those leadership teachers earning at least £37,461, the lowest point on the leadership teachers' pay scale in England, excluding Inner London, Outer London and London Fringe.4. Includes those teachers earning a maximum of £200,000 per annum. The small number of salaries above this level appeared to be mis-reported.
Numbers below 50 are shown as nil or negligible and average salaries based on teachers below 50 are also are not provided.- Nil or negligible.
6.Totals will not agree with tables 2 because no estimates are included for schools who did not submit information. Please see paragraph 23 and 24 of the SFR technical notes for further information.
30-3435-3940-4445-4950-5455-5960 and over
2. In each phase of education average salary is calculated by adding together the salaries of leadership teachers in a given age band and dividing the total by the number of leadership teachers in that age band. Please note this excludes those whose salary has been mis-reported.
35-3940-4445-4950-5455-5960 and over
Under 2525-29
45-4950-5455-5960 and over
WomenUnder 2525-2930-34
55-5960 and over
MenUnder 2525-2930-3435-3940-44
60 and over
Under 2525-2930-3435-3940-4445-4950-54
Under 2525-2930-3435-3940-4445-4950-5455-59
30-3435-3940-4445-4950-5455-5960 and over
Women
Table 9b continuedTable 9bFull-time regular qualified school leadership teachers 1 in publicly funded schools by salary bands, average salary 2, sector, gender and age.
MenUnder 2525-29

November 2011England
(Thousands)
UNDER £30,0003
£30,000-£34,999
£35,000-£39,999
£40,000-£44,999
£45,000-£49,999
£50,000-£54,999
£55,000-£59,999
£60,000-£64,999
£65,000-£69,999
£70,000-£80,000
OVER £80,000
Mis-reported Salary4 Total5
Average salary (£)2
1.2 - - - - - - - - - - - 1.2 £23,7002.8 0.7 0.3 0.1 - - - - - - - - 4.0 £28,2001.2 1.1 1.1 0.6 0.3 0.1 - - - - - - 4.4 £34,8000.5 0.7 1.0 0.6 0.5 0.4 0.2 0.1 - - - - 4.1 £40,3000.3 0.4 0.9 0.5 0.4 0.4 0.3 0.1 0.1 0.1 - - 3.5 £43,0000.2 0.3 0.8 0.4 0.3 0.3 0.3 0.2 0.1 0.1 - - 2.9 £45,1000.1 0.2 0.6 0.2 0.2 0.2 0.2 0.2 0.1 0.1 - - 2.1 £47,500
- 0.2 0.5 0.2 0.2 0.2 0.2 0.2 0.1 0.1 - - 1.9 £50,200- - 0.1 - - - 0.1 - - - - - 0.4 £52,100
6.4 3.7 5.2 2.7 1.8 1.6 1.4 0.8 0.5 0.4 0.2 0.1 24.6 £39,100
10.3 0.2 - - - - - - - - - 0.1 10.6 £24,00016.8 7.0 2.3 0.6 0.2 - - - - - - 0.2 27.1 £29,1004.3 6.4 6.8 2.6 1.0 0.3 0.1 - - - - 0.1 21.6 £35,0001.9 2.8 5.6 2.5 1.4 0.7 0.3 0.1 - - - - 15.4 £38,1002.1 2.4 4.7 2.1 1.2 0.9 0.6 0.2 0.1 0.1 - - 14.5 £38,8001.6 2.3 5.0 2.2 1.2 1.0 0.7 0.3 0.2 0.1 - 0.1 14.7 £40,3000.6 1.6 5.0 2.1 1.3 1.0 0.8 0.4 0.2 0.2 0.1 - 13.3 £42,1000.2 0.8 5.1 2.1 1.2 0.9 0.9 0.5 0.3 0.3 0.1 - 12.5 £44,1000.1 0.2 0.9 0.4 0.3 0.2 0.2 0.1 0.1 0.1 0.1 - 2.4 £45,400
37.9 23.7 35.5 14.5 7.8 4.9 3.5 1.7 1.0 0.7 0.3 0.5 132.0 £36,100
11.5 0.2 - - - - - - - - - 0.1 11.9 £24,00019.6 7.7 2.6 0.7 0.2 - - - - - - 0.2 31.1 £29,0005.5 7.5 7.9 3.1 1.3 0.4 0.1 - - - - 0.1 26.0 £35,0002.5 3.5 6.6 3.1 1.9 1.0 0.5 0.2 0.1 - - - 19.5 £38,6002.5 2.8 5.6 2.6 1.6 1.2 0.8 0.3 0.2 0.1 - 0.1 17.9 £39,6001.8 2.6 5.8 2.6 1.5 1.3 1.0 0.5 0.3 0.2 0.1 0.1 17.6 £41,1000.7 1.8 5.6 2.4 1.5 1.2 1.0 0.6 0.3 0.2 0.1 - 15.4 £42,9000.2 1.0 5.6 2.3 1.4 1.1 1.1 0.7 0.4 0.4 0.1 - 14.4 £44,9000.1 0.2 1.0 0.4 0.3 0.2 0.2 0.2 0.1 0.1 0.1 - 2.9 £46,400
44.4 27.4 40.8 17.2 9.6 6.5 4.9 2.4 1.5 1.1 0.5 0.6 156.8 £36,500
1.5 - - - - - - - - - - - 1.5 £24,0003.9 1.5 0.9 0.3 0.1 - - - - - - 0.1 6.8 £29,9001.5 1.8 2.2 1.7 0.6 0.3 0.1 - - - - - 8.3 £37,0000.6 0.8 1.8 1.7 1.2 0.6 0.3 0.1 0.1 0.1 - - 7.4 £41,8000.4 0.6 1.5 1.4 1.2 0.6 0.4 0.2 0.1 0.1 0.1 - 6.7 £43,9000.3 0.5 1.5 1.2 0.9 0.4 0.3 0.1 0.1 0.1 0.2 - 5.7 £45,0000.1 0.4 1.5 1.3 0.9 0.4 0.3 0.2 0.1 0.1 0.3 - 5.6 £46,700
- 0.2 1.1 1.0 0.8 0.3 0.2 0.1 0.1 0.1 0.2 - 4.4 £47,800- 0.1 0.3 0.2 0.1 0.1 - - - - 0.1 - 1.0 £47,300
8.4 5.9 10.8 8.9 5.9 2.8 1.7 0.8 0.6 0.5 0.9 0.3 47.4 £40,600
3.8 0.1 - - - - - - - - - 0.1 4.0 £24,0008.3 3.4 1.9 0.7 0.1 - - - - - - 0.1 14.5 £29,9002.3 2.8 3.9 2.6 1.0 0.4 0.1 - - - - 0.1 13.2 £36,9000.9 1.1 2.5 2.1 1.2 0.6 0.2 0.1 - - - - 8.7 £40,2000.7 0.8 1.8 1.6 1.0 0.5 0.3 0.1 0.1 0.1 - - 7.0 £41,4000.5 0.7 1.8 1.4 1.0 0.5 0.3 0.1 0.1 0.1 0.1 - 6.6 £42,8000.2 0.4 1.9 1.8 1.3 0.6 0.4 0.2 0.1 0.1 0.2 - 7.2 £45,1000.1 0.2 1.5 1.4 1.0 0.4 0.3 0.1 0.1 0.1 0.2 - 5.5 £45,800
- 0.1 0.3 0.3 0.2 0.1 - - - - - - 1.1 £45,60016.7 9.6 15.7 11.9 6.9 3.0 1.6 0.6 0.4 0.4 0.6 0.4 67.6 £37,800
5.3 0.1 - - - - - - - - - 0.1 5.5 £24,00012.2 4.9 2.8 1.0 0.2 0.1 - - - - - 0.2 21.4 £29,9003.8 4.6 6.1 4.3 1.6 0.6 0.2 - - - - 0.1 21.5 £36,9001.5 1.9 4.3 3.8 2.5 1.1 0.5 0.2 0.1 0.1 - 0.1 16.1 £40,9001.2 1.4 3.3 3.0 2.2 1.1 0.7 0.3 0.2 0.2 0.1 0.1 13.7 £42,6000.7 1.2 3.2 2.7 2.0 0.9 0.5 0.3 0.2 0.2 0.3 - 12.3 £43,8000.3 0.8 3.4 3.1 2.2 1.0 0.7 0.3 0.2 0.3 0.5 - 12.8 £45,8000.1 0.5 2.7 2.4 1.8 0.7 0.5 0.3 0.2 0.2 0.4 0.1 9.9 £46,700
- 0.1 0.6 0.4 0.3 0.2 0.1 - - - 0.1 - 2.0 £46,40025.1 15.5 26.5 20.8 12.8 5.8 3.2 1.4 1.0 0.9 1.5 0.7 115.1 £39,000
Table 10All full-time regular qualified school teachers 1 in publicly funded schools by salary bands, average salary 2, sector, gender and age.
NURSERY AND PRIMARY
MenUnder 2525-29
50-5455-59
30-3435-3940-4445-49
55-5960 and over
60 and overAll ages 6
WomenUnder 2525-2930-3435-3940-4445-4950-54
60 and overAll ages 6
All ages 6
Men and Women 7
Under 2525-2930-3435-3940-4445-4950-5455-59
60 and overAll ages 6
SECONDARY
MenUnder 2525-2930-3435-3940-4445-4950-5455-59
All ages 6
Men and Women 7
WomenUnder 2525-2930-3435-3940-4445-4950-5455-5960 and over
continued overleaf
Under 2525-2930-3435-3940-4445-4950-5455-5960 and overAll ages 6

November 2011England
(Thousands)
UNDER £30,0003
£30,000-£34,999
£35,000-£39,999
£40,000-£44,999
£45,000-£49,999
£50,000-£54,999
£55,000-£59,999
£60,000-£64,999
£65,000-£69,999
£70,000-£80,000
OVER £80,000
Mis-reported Salary4 Total5
Average salary (£)2
SPECIAL AND CENTRALLY EMPLOYED
0.1 - - - - - - - - - - - 0.1 £26,3000.2 0.1 - - - - - - - - - - 0.4 £29,3000.1 0.1 0.1 0.1 - - - - - - - - 0.5 £36,600
- 0.1 0.2 0.2 0.1 - - - - - - - 0.7 £41,000- 0.1 0.2 0.1 0.1 - - - - - - - 0.6 £42,700- 0.1 0.2 0.2 0.1 - - - - - - - 0.7 £44,200- 0.1 0.2 0.2 0.1 0.1 0.1 - - - - - 0.9 £47,200- - 0.2 0.3 0.1 0.1 - - - - 0.1 - 0.9 £48,300- - 0.1 0.1 - - - - - - - - 0.3 £43,900
0.6 0.6 1.3 1.1 0.5 0.3 0.2 0.1 0.1 0.1 0.1 - 5.1 £42,600
0.3 - - - - - - - - - - - 0.3 £25,2000.6 0.4 0.2 - - - - - - - - - 1.3 £30,6000.2 0.4 0.5 0.2 0.1 - - - - - - - 1.5 £36,7000.1 0.2 0.4 0.3 0.2 0.1 - - - - - - 1.3 £39,6000.1 0.2 0.4 0.3 0.2 0.1 - - - - - - 1.4 £40,9000.1 0.2 0.5 0.4 0.2 0.1 0.1 - - - - - 1.7 £42,7000.1 0.1 0.6 0.6 0.3 0.2 0.1 0.1 0.1 0.1 - - 2.1 £44,700
- 0.1 0.6 0.8 0.3 0.2 0.1 0.1 0.1 0.1 - - 2.4 £45,000- - 0.2 0.1 0.1 - - - - - - - 0.5 £44,600
1.6 1.6 3.4 2.9 1.3 0.7 0.4 0.2 0.2 0.2 0.1 - 12.6 £40,700
0.3 - - - - - - - - - - - 0.4 £25,4000.9 0.5 0.2 0.1 - - - - - - - - 1.7 £30,3000.3 0.5 0.7 0.3 0.1 0.1 - - - - - - 2.0 £36,7000.2 0.3 0.7 0.5 0.2 0.1 0.1 - - - - - 2.0 £40,1000.2 0.2 0.6 0.5 0.2 0.1 0.1 - - - - - 2.0 £41,4000.1 0.2 0.7 0.6 0.3 0.1 0.1 0.1 0.1 0.1 - - 2.4 £43,1000.1 0.2 0.8 0.8 0.4 0.2 0.1 0.1 0.1 0.1 0.1 - 3.0 £45,4000.1 0.1 0.9 1.1 0.4 0.3 0.2 0.1 0.1 0.1 0.1 - 3.3 £45,900
- 0.1 0.2 0.2 0.1 - - - - - - - 0.8 £44,4002.2 2.2 4.7 4.0 1.8 1.0 0.6 0.3 0.3 0.3 0.2 0.1 17.7 £41,200
2.7 0.1 - - - - - - - - - - 2.8 £23,9006.9 2.3 1.2 0.5 0.1 - - - - - - 0.1 11.2 £29,3002.9 3.0 3.4 2.3 0.9 0.4 0.1 - - - - 0.1 13.3 £36,2001.2 1.6 3.0 2.5 1.8 1.0 0.5 0.2 0.1 0.1 - - 12.2 £41,2000.8 1.1 2.6 2.1 1.6 1.0 0.7 0.3 0.2 0.2 0.1 0.1 10.8 £43,5000.5 0.9 2.4 1.8 1.3 0.8 0.6 0.3 0.3 0.2 0.2 - 9.3 £45,0000.2 0.6 2.3 1.7 1.2 0.7 0.6 0.3 0.3 0.3 0.3 - 8.6 £47,0000.1 0.4 1.8 1.5 1.1 0.6 0.5 0.4 0.3 0.3 0.3 - 7.3 £48,500
- 0.1 0.5 0.3 0.2 0.1 0.1 0.1 0.1 0.1 0.1 - 1.6 £48,00015.4 10.2 17.3 12.7 8.2 4.7 3.2 1.6 1.2 1.1 1.2 0.4 77.1 £40,300
14.4 0.3 0.1 - - - - - - - - 0.2 14.9 £24,00025.7 10.8 4.4 1.3 0.3 0.1 - - - - - 0.3 42.9 £29,4006.7 9.6 11.3 5.4 2.1 0.7 0.2 - - - - 0.1 36.2 £35,8002.9 4.1 8.5 4.9 2.8 1.3 0.6 0.2 0.1 - - 0.1 25.4 £38,9003.0 3.3 6.9 4.0 2.4 1.5 0.9 0.3 0.2 0.1 0.1 0.1 22.8 £39,7002.1 3.2 7.2 4.1 2.4 1.6 1.1 0.5 0.3 0.2 0.2 0.1 23.0 £41,2000.9 2.2 7.5 4.5 2.9 1.7 1.2 0.6 0.4 0.3 0.3 0.1 22.6 £43,3000.3 1.2 7.3 4.4 2.5 1.5 1.3 0.7 0.5 0.4 0.3 0.1 20.3 £44,7000.1 0.3 1.4 0.8 0.5 0.3 0.2 0.1 0.1 0.1 0.1 - 4.0 £45,300
56.2 34.9 54.6 29.3 15.9 8.6 5.5 2.5 1.6 1.3 1.0 0.9 212.2 £36,900
17.2 0.3 0.1 - - - - - - - - 0.2 17.8 £24,00032.7 13.1 5.7 1.7 0.4 0.1 - - - - - 0.4 54.2 £29,4009.6 12.7 14.7 7.7 3.0 1.1 0.3 0.1 - - - 0.2 49.5 £35,9004.1 5.7 11.5 7.4 4.6 2.2 1.1 0.4 0.2 0.1 0.1 0.1 37.6 £39,6003.8 4.4 9.5 6.1 4.1 2.5 1.6 0.7 0.4 0.3 0.2 0.1 33.6 £41,0002.6 4.0 9.7 5.9 3.7 2.4 1.7 0.8 0.6 0.4 0.4 0.1 32.3 £42,3001.1 2.8 9.8 6.3 4.0 2.4 1.9 1.0 0.6 0.6 0.6 0.1 31.2 £44,3000.4 1.6 9.1 5.8 3.6 2.1 1.8 1.0 0.7 0.7 0.7 0.1 27.6 £45,7000.1 0.4 1.9 1.1 0.7 0.4 0.3 0.2 0.2 0.2 0.2 0.1 5.7 £46,100
71.7 45.1 72.0 42.0 24.1 13.2 8.7 4.1 2.7 2.3 2.1 1.4 289.5 £37,800
45-4950-5455-5960 and overAll ages 6
continued overleaf
60 and overAll ages 6
Men and Women 7
Under 2525-2930-3435-3940-44
Under 2525-2930-3435-3940-4445-4950-5455-59
35-3940-4445-4950-5455-5960 and overAll ages 6
Women
25-2930-34
MenUnder 25
Table 10 continued
55-5960 and over
Table 10All full-time regular qualified school teachers 1 in publicly funded schools by salary bands, average salary 2, sector, gender and age.
MenUnder 2525-2930-3435-3940-4445-4950-54
60 and overAll ages 6
All ages 6
WomenUnder 2525-2930-3435-3940-4445-4950-5455-59
All ages 6
TOTAL MAINTAINED SECTOR
Men and Women 7
Under 2525-2930-3435-3940-4445-4950-5455-5960 and over

November 2011England
(Thousands)
UNDER £30,0003
£30,000-£34,999
£35,000-£39,999
£40,000-£44,999
£45,000-£49,999
£50,000-£54,999
£55,000-£59,999
£60,000-£64,999
£65,000-£69,999
£70,000-£80,000
OVER £80,000
Mis-reported Salary4 Total5
Average salary (£)2
ACADEMIES 8
1.0 - - - - - - - - - - - 1.1 £24,3002.4 0.9 0.5 0.2 0.1 - - - - - - 0.1 4.3 £29,9000.8 0.9 1.2 1.0 0.4 0.2 0.1 - - - - - 4.6 £37,5000.4 0.5 1.0 0.9 0.7 0.4 0.2 0.1 0.1 - - 0.1 4.2 £42,3000.2 0.4 0.9 0.7 0.6 0.3 0.2 0.1 0.1 - 0.1 0.1 3.8 £44,1000.2 0.2 0.7 0.7 0.4 0.3 0.1 0.1 0.1 0.1 0.1 - 3.0 £45,3000.1 0.2 0.7 0.7 0.5 0.2 0.2 0.1 0.1 0.1 0.2 - 3.0 £46,800
- 0.1 0.5 0.5 0.4 0.2 0.1 0.1 - 0.1 0.2 - 2.3 £49,300- - 0.2 0.1 0.1 - - - - - - - 0.6 £48,700
5.2 3.3 5.7 4.8 3.2 1.6 0.9 0.5 0.3 0.3 0.6 0.4 26.8 £40,600
2.6 0.1 - - - - - - - - - 0.1 2.8 £24,1005.0 2.1 1.2 0.4 0.1 - - - - - - 0.2 9.0 £29,9001.3 1.5 2.2 1.5 0.6 0.2 0.1 - - - - 0.1 7.6 £36,9000.5 0.6 1.4 1.1 0.7 0.3 0.1 - - - - 0.1 4.8 £40,1000.4 0.5 1.0 0.8 0.5 0.3 0.1 0.1 - - - 0.1 3.9 £41,1000.3 0.4 1.0 0.8 0.5 0.3 0.1 0.1 - - 0.1 0.1 3.7 £42,1000.1 0.3 1.1 0.9 0.6 0.3 0.2 0.1 0.1 0.1 0.1 0.1 3.8 £44,700
- 0.1 0.9 0.7 0.5 0.2 0.1 0.1 0.1 0.1 0.1 - 3.0 £45,900- - 0.2 0.1 0.1 - - - - - - - 0.6 £45,900
10.4 5.5 9.0 6.4 3.5 1.6 0.8 0.4 0.3 0.2 0.3 0.7 39.1 £37,300
3.6 0.1 - - - - - - - - - 0.1 3.9 £24,2007.5 3.0 1.7 0.6 0.2 - - - - - - 0.3 13.3 £29,9002.2 2.4 3.4 2.5 1.0 0.4 0.1 - - - - 0.2 12.2 £37,1000.9 1.0 2.3 2.0 1.3 0.6 0.3 0.1 0.1 0.1 - 0.1 9.0 £41,1000.7 0.8 1.9 1.6 1.1 0.6 0.3 0.2 0.1 0.1 0.1 0.1 7.7 £42,6000.5 0.6 1.8 1.5 0.9 0.5 0.3 0.1 0.1 0.1 0.2 0.1 6.7 £43,5000.2 0.5 1.8 1.6 1.1 0.5 0.3 0.2 0.1 0.1 0.3 0.1 6.8 £45,6000.1 0.3 1.4 1.2 0.9 0.4 0.3 0.1 0.1 0.1 0.3 0.1 5.3 £47,300
- 0.1 0.3 0.3 0.2 0.1 - - - - 0.1 - 1.2 £47,30015.7 8.8 14.7 11.3 6.7 3.2 1.7 0.8 0.6 0.5 0.9 1.2 65.9 £38,600
TOTAL PUBLICLY FUNDED SCHOOLS
3.7 0.1 - - - - - - - - - 0.1 3.9 £24,0009.4 3.2 1.8 0.7 0.2 0.1 - - - - - 0.2 15.5 £29,4003.7 3.9 4.6 3.3 1.3 0.6 0.2 0.1 - - - 0.1 17.9 £36,6001.6 2.1 4.0 3.5 2.5 1.3 0.7 0.3 0.2 0.1 0.1 0.1 16.4 £41,5001.1 1.5 3.5 2.8 2.3 1.4 0.9 0.5 0.2 0.2 0.2 0.1 14.6 £43,7000.6 1.1 3.2 2.5 1.7 1.1 0.8 0.4 0.3 0.2 0.3 0.1 12.3 £45,0000.3 0.9 3.0 2.4 1.7 0.9 0.8 0.4 0.3 0.3 0.5 0.1 11.5 £46,9000.1 0.6 2.4 2.0 1.5 0.8 0.7 0.4 0.3 0.3 0.5 0.1 9.6 £48,700
- 0.2 0.6 0.4 0.3 0.1 0.1 0.1 0.1 0.1 0.1 0.1 2.2 £48,20020.6 13.5 23.0 17.5 11.3 6.2 4.1 2.1 1.5 1.3 1.8 0.9 103.8 £40,300
17.0 0.4 0.1 - - - - - - - - 0.3 17.7 £24,00030.7 12.9 5.6 1.7 0.4 0.1 - - - - - 0.4 51.9 £29,5008.1 11.1 13.5 6.9 2.7 0.9 0.3 0.1 - - - 0.3 43.8 £36,0003.4 4.6 9.8 6.0 3.4 1.6 0.7 0.2 0.1 0.1 - 0.2 30.2 £39,1003.4 3.7 8.0 4.9 2.9 1.7 1.0 0.4 0.2 0.2 0.1 0.1 26.7 £39,9002.5 3.6 8.3 4.9 2.9 1.8 1.2 0.6 0.4 0.3 0.2 0.1 26.7 £41,3001.0 2.4 8.6 5.4 3.5 2.0 1.4 0.7 0.5 0.4 0.4 0.1 26.4 £43,5000.3 1.3 8.2 5.1 3.0 1.7 1.4 0.7 0.5 0.5 0.4 0.1 23.3 £44,8000.1 0.3 1.5 0.9 0.6 0.3 0.3 0.2 0.1 0.1 0.1 - 4.6 £45,400
66.6 40.3 63.6 35.7 19.5 10.1 6.3 2.8 1.8 1.5 1.3 1.7 251.3 £37,000
20.8 0.5 0.1 - - - - - - - - 0.3 21.7 £24,00040.2 16.1 7.4 2.4 0.6 0.1 - - - - - 0.6 67.5 £29,50011.8 15.0 18.1 10.2 4.0 1.5 0.5 0.1 0.1 - - 0.4 61.7 £36,1005.0 6.7 13.9 9.4 5.9 2.9 1.4 0.5 0.3 0.2 0.1 0.3 46.6 £39,9004.5 5.2 11.4 7.7 5.2 3.1 1.9 0.8 0.4 0.4 0.3 0.3 41.3 £41,3003.1 4.7 11.4 7.3 4.6 2.9 2.0 1.0 0.7 0.5 0.6 0.2 39.0 £42,5001.4 3.3 11.6 7.8 5.1 2.9 2.2 1.1 0.8 0.7 0.9 0.2 38.0 £44,5000.5 1.9 10.5 7.1 4.5 2.5 2.1 1.2 0.8 0.8 0.9 0.2 32.9 £45,9000.1 0.5 2.2 1.3 0.9 0.5 0.4 0.2 0.2 0.2 0.3 0.1 6.9 £46,300
87.4 53.8 86.7 53.3 30.8 16.4 10.4 5.0 3.3 2.8 3.1 2.5 355.4 £37,900
Source: School Workforce Census1. Includes teachers of all grades both leadership and classroom.
4. Includes those whose salary was misreported or details were incomplete.
6. Includes a small number where age is not known or unspecified, therefore totals may not equal the sum of the component parts.7. Includes a small number where gender was unspecified or not known, therefore totals may not equal the sum of the component parts.
8. See footnote 8 in Table 9a.
55-5960 and overAll ages 6
2. In each phase of education average salary is calculated by adding together the salaries of teachers in a given age band and dividing the total by the number of teachers in that age band. Please note thiexcludes those whose salary has been mis-reported.3. Includes classroom teachers earning £21,588 and leadership teachers earning at least £37,461, the lowest point on the teachers' pay scales in England, excluding Inner London, Outer London and
Numbers below 50 are shown as nil or negligible and average salaries based on teachers below 50 are also are not provided.
- Nil or negligible.Totals may not apprear to equal the sum of component parts because of rounding.
5.Totals will not agree with tables 2 because no estimates are included for schools who did not submit information. Please see paragraph 23 and 24 of the SFR technical notes for further information.
Men and Women 7
Under 2525-2930-3435-3940-4445-4950-54
30-3435-3940-4445-4950-5455-5960 and overAll ages 6
45-4950-5455-5960 and overAll ages 6
WomenUnder 2525-29
60 and overAll ages 6
MenUnder 2525-2930-3435-3940-44
Under 2525-2930-3435-3940-4445-4950-5455-59
35-3940-4445-4950-5455-5960 and overAll ages 6
Men and Women 7
50-5455-5960 and overAll ages 6
WomenUnder 2525-2930-34
All full-time regular qualified school teachers 1 in publicly funded schools by salary bands, average salary 2, sector, gender and age.
MenUnder 2525-2930-3435-3940-4445-49
Table 10 continuedTable 10

Head count of regular teachers in all publicly funded schools by sector, grade and highest level of post A-level qualification1,2.
NUMBER FOR WHOM
QUALIFICATIONS PROVIDED 7
NO QUALIFICATION INFORMATION
PROVIDEDTOTAL
TEACHERSNo's % No's % No's % No's % No's % No's % No's No's No's
Heads 7.2 46.3 6.1 39.8 0.6 4.0 1.5 9.8 - . - . 15.5 1.2 16.710.6 57.9 6.0 32.8 0.4 2.4 1.2 6.5 - . - . 18.4 0.8 19.1
109.8 64.2 39.7 23.2 11.2 6.5 9.0 5.3 0.6 0.4 0.6 0.3 170.9 13.5 184.4All grades 127.5 62.3 51.9 25.4 12.2 6.0 11.7 5.7 0.7 0.3 0.6 0.3 204.7 15.5 220.3
Heads 1.5 73.0 0.3 15.0 0.2 10.1 - . - . - . 2.1 0.1 2.28.2 75.7 1.7 15.6 0.6 5.2 0.4 3.4 - . - . 10.8 0.5 11.2
97.9 80.9 10.8 8.9 8.1 6.7 3.4 2.8 0.5 0.4 0.3 0.2 120.9 10.6 131.6All grades 107.5 80.4 12.8 9.6 8.8 6.6 3.8 2.8 0.5 0.4 0.3 0.2 133.8 11.2 145.0
Heads 0.4 49.3 0.3 33.8 - . 0.1 10.9 - . - . 0.8 0.1 0.91.0 52.3 0.6 31.3 0.1 5.4 0.2 10.3 - . - . 1.8 0.2 2.07.2 61.4 2.6 21.7 0.7 6.1 1.1 9.1 0.1 0.8 0.1 0.8 11.8 1.7 13.5
All grades 8.6 59.6 3.4 23.6 0.9 6.0 1.4 9.4 0.1 0.8 0.1 0.7 14.4 1.9 16.4
Heads 0.1 47.5 0.1 28.6 - . - . - . - . 0.3 0.1 0.40.2 52.6 0.1 24.2 0.1 16.7 - . - . - . 0.4 0.1 0.67.0 57.7 2.5 20.9 1.6 13.4 0.8 6.4 0.2 1.2 - . 12.1 6.6 18.8
All grades 7.4 57.4 2.7 21.1 1.7 13.6 0.8 6.4 0.2 1.2 - . 12.9 6.9 19.7
Heads 9.2 49.4 6.8 36.6 0.9 4.9 1.7 8.9 - . - . 18.6 1.6 20.220.0 63.6 8.4 26.7 1.2 3.7 1.8 5.7 0.1 0.2 - . 31.4 1.5 32.9
221.9 70.3 55.6 17.6 21.6 6.8 14.3 4.5 1.4 0.4 1.0 0.3 315.8 32.5 348.2All grades 251.1 68.6 70.8 19.4 23.7 6.5 17.7 4.8 1.5 0.4 1.1 0.3 365.8 35.6 401.4
Heads 0.9 70.2 0.2 17.4 0.1 9.3 - . - . - . 1.3 0.1 1.44.8 77.6 0.9 15.1 0.3 4.3 0.2 2.8 - . - . 6.1 0.3 6.4
57.1 81.6 6.3 9.0 4.2 6.0 1.8 2.6 0.4 0.5 0.2 0.3 70.0 6.8 76.8All grades 62.8 81.1 7.4 9.6 4.6 5.9 2.0 2.6 0.4 0.5 0.2 0.3 77.4 7.2 84.6
Heads 10.1 50.8 7.0 35.3 1.0 5.2 1.7 8.5 - . - . 19.9 1.7 21.624.7 65.9 9.3 24.8 1.4 3.8 1.9 5.2 0.1 0.2 - . 37.6 1.8 39.4
279.0 72.3 61.9 16.0 25.8 6.7 16.1 4.2 1.8 0.5 1.2 0.3 385.7 39.3 425.0All grades 313.8 70.8 78.2 17.7 28.3 6.4 19.7 4.5 1.9 0.4 1.3 0.3 443.2 42.8 486.0
HIGHEST LEVEL OF QUALIFICATION 1
Degree or higher 3
Table 11
November 2011England
(Thousands)
Certificate of Education 4
Other qualification 5
NON UK TEACHING
QUALIFICATION 6
NURSERY AND PRIMARY
Classroom teachers 8
SPECIAL
Bachelor of Education
Postgraduate Certificate of
Education
Deputy and assistant headsClassroom teachers 8
SECONDARY
Deputy and assistant heads
Classroom teachers 8
TOTAL PUBLICLY FUNDED SCHOOLS
Deputy and assistant headsClassroom teachers 8
CENTRALLY EMPLOYED
Deputy and assistant headsClassroom teachers 8
TOTAL MAINTAINED SECTOR
Deputy and assistant headsClassroom teachers 8
ACADEMIES
Deputy and assistant heads
5. Includes any other qualification at NQF level 4 or 5 e.g. diplomas of higher education and further education, foundation degrees, higher national diplomas and certificates of higher education.
6. Level of qualification not provided for qualifications gained outside of the UK.
Deputy and assistant headsClassroom teachers 8
Source: School Workforce CensusBase: 486,026 teachers (head count)
1. Where a teacher has more than one post A-level qualification, the qualification level was determined by the highest level reading from left (degree or higher) to right (other qualification).
2. Not including qualifications in Special Educational Needs provision.3. Includes Doctorates and other National Qualifications Level, (NQF), 8 qualifications, Masters and other Level 7 qualifications (e.g. Post Graduate certificates and diplomas), and first degrees (excluding BEds) and other level 6 qualifications (e.g. graduate certificates and diplomas).4. Certificate of Education includes: the original Certification of Education qualification that was required for non-degree holders to become teachers, discontinued in 1980 and replaced by the Bachelor of Education; and the the current Certificate of Education, offering training in teaching at further or higher education level.
7. Percentages based on this figure.8. Includes ASTs, post threshold and grade unknown.
Percentages are row percentages, and based on the number of teachers for whom qualifications information was provided.Numbers below 50 are rounded to nil or negligible.. Not applicable.- Nil or negligible.
Totals may not appear equal to the sum of the component parts because of rounding.

(Thousands)
Key Stage 3 2 Key Stage 4 2 Key Stage 5 2 Key Stage 3 2 Key Stage 4 2 Key Stage 5 2
SUBJECT 1
Mathematics 35.2 30.6 27.9 12.6 485.7 237.6 189.2 58.9English 38.8 33.8 29.5 12.5 491.9 243.6 197.1 51.3
Physics 5.9 1.2 3.0 4.3 39.5 3.4 13.4 22.6Chemistry 6.9 1.2 3.3 5.4 45.3 3.1 13.5 28.7Biology 8.5 1.4 3.7 6.9 53.4 3.7 14.2 35.5Combined/General Science 34.7 30.7 27.8 2.7 416.6 207.2 200.2 9.3Other Sciences 2.8 0.6 1.7 1.1 13.6 2.9 7.2 3.5
History 16.6 14.8 10.0 6.0 161.8 84.8 48.6 28.3Geography 14.9 13.5 8.8 5.0 146.6 83.7 41.9 21.0
French 15.3 13.9 9.0 3.7 141.4 92.3 37.2 11.9German 5.5 4.7 3.6 1.7 43.4 22.8 14.7 6.0Spanish 6.8 5.7 4.2 1.8 55.0 30.2 18.2 6.6Other Modern Languages 3.3 2.6 1.2 0.6 23.6 17.0 4.5 2.1
Design and technology 14.8 6.2 12.0 3.6 114.6 38.5 61.5 14.6Of which:
Electronics / Systems and Control 1.3 0.6 0.9 0.3 8.4 3.3 4.0 1.1Food Technology 5.3 2.4 4.0 0.8 36.3 13.5 20.0 2.9Graphics 3.9 1.2 2.9 0.9 22.1 6.2 12.4 3.5Resistant Materials 4.5 1.8 3.4 0.6 27.3 10.5 14.7 2.1Textiles 3.3 1.1 2.4 1.2 20.6 5.1 10.3 5.1
Other/Combined Technology 4 16.8 15.1 4.5 2.7 145.8 113.5 21.9 10.4Engineering 1.6 0.2 1.3 0.5 9.0 0.9 6.3 1.9ICT 5 18.6 15.8 12.5 5.6 182.7 76.8 76.3 29.6
Business / Economics 11.1 1.9 8.0 7.2 98.4 6.5 39.5 52.4Religious Education 6 16.5 12.7 10.7 3.8 125.3 62.1 47.6 15.5Classics / Other Humanities 7.9 6.1 1.7 0.9 42.4 32.0 6.1 4.3Other Social Studies 7 9.2 0.7 2.3 7.6 70.5 1.7 9.0 59.8
Music 8.0 7.4 5.4 3.2 93.1 59.7 19.4 14.0Drama 11.6 9.7 6.4 3.9 96.5 50.5 28.4 17.5Art and Design 13.9 12.2 9.5 6.1 157.7 77.0 49.4 31.2Media Studies 6.6 0.8 4.0 3.9 38.8 2.2 16.2 20.4Combined Arts / Humanities / Social Studies 1.2 0.8 0.3 0.2 4.5 3.3 0.8 0.5
Physical Education 26.0 22.5 22.1 10.0 326.3 155.3 134.4 36.5
PSHE 5 39.5 19.3 16.9 8.0 91.8 31.5 37.7 22.6Citizenship 10.0 5.7 4.6 0.8 20.7 10.3 9.2 1.2General Studies 4.8 0.7 0.7 3.3 8.9 2.1 1.9 4.8Careers Education / Key Skills 1.7 0.4 1.1 0.3 4.3 1.1 2.7 0.5
Other 45.4 17.0 19.2 12.0 141.3 50.0 57.5 33.8
Total 241.5 213.3 211.1 118.9 3,890.7 1,807.6 1,425.8 657.3
Source: School Workforce CensusBase: 178,884 teachers to years 7-13 (unweighted head count)
3. Total number of hours may not be equal to the sum of total hours taught to Key Stages 3, 4 and 5 due to rounding.
6. Includes philosophy. 7. Includes law, politics, sociology and psychology
HEAD COUNT OF IN SERVICE TEACHERS
Head count of teachers and number of hours taught by subject 1 and key stage to year groups 7-13 in all publicly funded secondary schools.November 2011
Table 12
England
NUMBER OF TEACHERS OF: TOTAL NUMBER OF
HOURS TAUGHT 3
NUMBER OF HOURS TAUGHT TO:
Totals may not appear equal to the sum of the component parts because of rounding.
1. Teachers were counted once against each subject that they were teaching, regardless of the amount of time they spend teaching the subject. Teachers were counted under each key stage they were recorded as teaching to; a Mathematics teacher who taught all years (7-13) would be included under Number of teachers of Key Stage 3, Key Stage 4 and Key Stage 5.2. Key Stage 3: year 7 to year 9; Key Stage 4: year 10 and year 11; Key Stage 5: year 12 and year 13.
4. Includes construction and built environment.5. Information & Communication Technology is abbreviated as ICT and Personal, Social, Health and Economic Education is abbreviated as PSHE.

Table 13 (Provisional)
November 2011England
(Percentages)
ANY RELEVANT POST A-LEVEL QUALIFICATION
NO RELEVANT POST A-LEVEL QUALIFICATION
TOTAL HEAD COUNT
% ± CI7 % ± CI7 % ± CI7 % ± CI7 % % (Thousands)
SUBJECT 3
Mathematics 45.4 ± 0.8 7.1 ± 0.4 18.2 ± 0.6 2.2 ± 0.2 72.9 27.1 35.2English 63.1 ± 0.7 4.5 ± 0.3 9.1 ± 0.4 1.7 ± 0.2 78.3 21.7 38.8
Physics 8 56.1 ± 1.9 3.0 ± 0.7 6.3 ± 1.0 0.8 ± 0.3 66.3 33.7 5.9Chemistry 8 65.8 ± 1.6 2.4 ± 0.5 6.2 ± 0.8 0.6 ± 0.3 75.0 25.0 6.9Biology 8 76.0 ± 1.2 3.8 ± 0.5 5.7 ± 0.7 0.8 ± 0.3 86.3 13.7 8.5Combined/General science 8 80.4 ± 0.6 4.8 ± 0.3 4.9 ± 0.3 1.3 ± 0.2 91.4 8.6 34.7Other Sciences 8 77.7 ± 2.1 3.5 ± 0.9 4.4 ± 1.0 1.4 ± 0.6 87.0 13.0 2.8
History 61.7 ± 1.1 3.1 ± 0.4 6.6 ± 0.6 0.9 ± 0.2 72.3 27.7 16.6Geography 57.4 ± 1.2 3.3 ± 0.4 5.9 ± 0.6 1.0 ± 0.2 67.5 32.5 14.9
French 51.3 ± 1.2 4.1 ± 0.5 16.7 ± 0.9 1.3 ± 0.3 73.4 26.6 15.3German 52.4 ± 2.0 2.1 ± 0.6 10.7 ± 1.3 1.0 ± 0.4 66.2 33.8 5.5Spanish 33.6 ± 2.1 1.6 ± 0.6 10.6 ± 1.4 1.0 ± 0.5 46.9 53.1 6.8Other Modern Languages 25.0 ± 3.3 0.4 ± 0.5 7.7 ± 2.0 1.0 ± 0.8 34.0 66.0 3.3
Design and technology 9 51.8 ± 1.1 14.8 ± 0.8 9.6 ± 0.7 5.4 ± 0.5 81.6 18.4 14.8
Electronics / Systems and Control 9 55.5 ± 3.6 16.6 ± 2.7 7.9 ± 2.0 3.3 ± 1.3 83.3 16.7 1.3Food Technology 9 42.5 ± 2.0 16.3 ± 1.5 9.6 ± 1.2 8.0 ± 1.1 76.4 23.6 5.3Graphics 9 59.5 ± 2.1 14.1 ± 1.5 10.5 ± 1.3 3.0 ± 0.7 87.1 12.9 3.9Resistant Materials 9 56.6 ± 1.9 16.4 ± 1.5 10.0 ± 1.2 4.5 ± 0.8 87.5 12.5 4.5Textiles 9 58.6 ± 2.3 10.3 ± 1.4 9.0 ± 1.4 4.9 ± 1.0 82.8 17.2 3.3
Other/Combined Technology 9 48.7 ± 1.1 13.9 ± 0.8 9.5 ± 0.6 4.6 ± 0.5 76.7 23.3 16.8Engineering 16.4 ± 5.2 0.9 ± 1.3 0.8 ± 1.2 1.0 ± 1.4 19.0 81.0 1.6ICT 10 26.4 ± 1.3 2.0 ± 0.4 8.9 ± 0.8 0.6 ± 0.2 37.9 62.1 18.6
Business / Economics 51.8 ± 1.5 4.8 ± 0.6 4.6 ± 0.6 1.1 ± 0.3 62.2 37.8 11.1Religious Education 11 33.0 ± 1.4 3.1 ± 0.5 7.6 ± 0.8 1.0 ± 0.3 44.7 55.3 16.5
Music 73.3 ± 1.4 4.9 ± 0.7 4.6 ± 0.6 2.1 ± 0.4 84.9 15.1 8.0Drama 39.2 ± 1.6 3.0 ± 0.6 6.0 ± 0.8 1.5 ± 0.4 49.7 50.3 11.6Art and design 70.1 ± 1.1 5.3 ± 0.5 7.8 ± 0.6 1.3 ± 0.3 84.5 15.5 13.9Media Studies 15.4 ± 2.5 0.7 ± 0.6 2.4 ± 1.1 0.3 ± 0.4 18.8 81.2 6.6
Physical education 56.0 ± 0.8 15.7 ± 0.6 6.8 ± 0.4 1.5 ± 0.2 80.0 20.0 26.0
Citizenship 3.9 ± 1.9 0.1 ± 0.3 2.4 ± 1.5 0.2 ± 0.4 6.5 93.5 10.0
Source: School Workforce CensusBase: 150,852 secondary level teachers (unweighted head count)
10. Information & Communication Technology is abbreviated as ICT.11. Includes philosophy.
Percentages are row percentages, and based on the number of teachers for whom curriculum and qualifications information was provided.Numbers rounded to the nearest 100 and numbers below 50 are shown as nil or negligible. . Not applicable.- Nil or negligible.
Totals may not appear equal to the sum of the component parts because of rounding.
Other qualification6
8. Teachers qualified in biology, chemistry, or physics are treated as qualified to teach both combined/general science and other science.
9. Teachers qualified in each of the specialist design & technology subjects are treated as qualified to teach other/combined design & technology.
Highest post A-level qualifications 1,2 held by publicly funded secondary school teachers (head count) in the subjects 3 they taught to year groups 7-13 in 2011.
HIGHEST LEVEL OF QUALIFICATION 1 HELD IN A RELEVANT SUBJECT 3,4
1. Where a teacher has more than one post A level qualification in the same subject, the qualification level is determined by the highest level reading from left (Degree or higher) to right (Other Qualification). For example, teachers shown under PGCE have a PGCE but not a Degree.2. Not including qualifications in Special Educational Needs provision.3. Teachers are counted once against each subject which they are teaching. Head counts are used, so a teacher teaching French and German would be counted once in each.
Degree or higher5Bachelor of Education
Postgraduate Certificate of
Education
4. A full list of what was deemed as a 'relevant' qualification subject for each curriculum subject taught can be found in the SFR home page, November 2010 at http://www.education.gov.uk/rsgateway/DB/SFR/s000997/index.shtml .
5. Includes Doctorates and other Level 8 qualifications, Masters and other Level 7 qualifications (e.g. Post Graduate certificates and diplomas), first degrees (excluding BEds) and other level 6 qualifications (e.g. graduate certificates and diplomas).
6. Includes Certificate of Education, Non-UK Qualifications where the level was not provided and Other Qualification at National Qualifications Framework (NQF) level 4 or 5 and above e.g. diplomas or higher education and further education, foundation degrees, higher national diplomas and certificates of higher education.
7. Confidence intervals have been calculated around the proportions as not all schools were able to submit curriculum information, and not all qualifications returns were complete. Qualifications information was either not provided, or the subject field was missing for 12% of the teachers in schools submitting curriulum data. The confidence intervals show the statistical accuracy for the data, and give a range within which we can be reasonably sure (95% certain) that the true value actually lies.

November 2011England
ANY RELEVANT POST A-LEVEL QUALIFICATION
NO RELEVANT POST A-LEVEL QUALIFICATION TOTAL HOURS
% ± CI6 % ± CI6 % ± CI6 % ± CI6 % % (Thousands)
SUBJECTMathematics 52.6 ± 0.8 7.4 ± 0.4 21.7 ± 0.7 2.3 ± 0.2 84.0 16.0 485.7English 71.8 ± 0.7 4.5 ± 0.3 9.7 ± 0.4 1.6 ± 0.2 87.5 12.5 491.9
Physics7 65.1 ± 1.9 3.2 ± 0.7 6.9 ± 1.0 0.8 ± 0.3 75.9 24.1 39.5Chemistry7 73.0 ± 1.5 2.6 ± 0.5 5.8 ± 0.8 0.6 ± 0.3 82.1 17.9 45.3Biology7 79.2 ± 1.2 3.9 ± 0.6 5.1 ± 0.6 0.8 ± 0.3 89.0 11.0 53.4Combined/General science7 82.7 ± 0.5 4.6 ± 0.3 5.5 ± 0.3 1.3 ± 0.2 94.2 5.8 416.6Other Sciences7 79.3 ± 2.1 3.3 ± 0.9 4.2 ± 1.0 1.4 ± 0.6 88.2 11.8 13.6
History 75.6 ± 1.0 3.2 ± 0.4 7.7 ± 0.6 0.9 ± 0.2 87.4 12.6 161.8Geography 71.6 ± 1.1 3.6 ± 0.5 7.5 ± 0.7 1.0 ± 0.2 83.7 16.3 146.6
French 55.2 ± 1.2 4.6 ± 0.5 18.6 ± 0.9 1.3 ± 0.3 79.8 20.2 141.4German 59.8 ± 2.0 2.3 ± 0.6 11.7 ± 1.3 1.4 ± 0.5 75.2 24.8 43.4Spanish 43.1 ± 2.2 2.0 ± 0.6 13.3 ± 1.5 1.4 ± 0.5 59.8 40.2 55.0Other Modern Languages 26.3 ± 3.4 0.4 ± 0.5 8.5 ± 2.1 1.3 ± 0.9 36.5 63.5 23.6
Design and technology8 54.1 ± 1.1 15.7 ± 0.8 9.7 ± 0.7 5.5 ± 0.5 85.0 15.0 114.6Of which:
Electronics / Systems and Control8 58.8 ± 3.6 16.5 ± 2.7 8.1 ± 2.0 3.1 ± 1.3 86.5 13.5 8.4Food Technology8 42.5 ± 2.0 17.8 ± 1.5 9.8 ± 1.2 8.9 ± 1.1 79.0 21.0 36.3Graphics8 60.0 ± 2.1 15.4 ± 1.5 9.7 ± 1.2 3.4 ± 0.8 88.6 11.4 22.1Resistant Materials8 57.3 ± 1.9 17.3 ± 1.5 10.8 ± 1.2 3.9 ± 0.8 89.3 10.7 27.3Textiles8 60.5 ± 2.3 9.9 ± 1.4 8.5 ± 1.3 5.5 ± 1.1 84.4 15.6 20.6
Other/Combined Technology8 54.0 ± 1.1 14.8 ± 0.8 10.3 ± 0.7 4.6 ± 0.5 83.6 16.4 145.8Engineering 18.9 ± 5.5 1.6 ± 1.8 1.1 ± 1.5 1.4 ± 1.6 22.9 77.1 9.0ICT9 39.0 ± 1.4 2.7 ± 0.5 13.3 ± 1.0 0.9 ± 0.3 56.0 44.0 182.7
Business/Economics 65.5 ± 1.4 5.5 ± 0.7 6.1 ± 0.7 1.2 ± 0.3 78.3 21.7 98.4Religious education 54.3 ± 1.5 4.9 ± 0.6 12.4 ± 1.0 1.4 ± 0.3 72.9 27.1 125.3
Music 81.2 ± 1.2 5.2 ± 0.7 5.2 ± 0.7 2.3 ± 0.5 93.8 6.2 93.1Drama 58.4 ± 1.6 4.2 ± 0.7 7.4 ± 0.9 2.0 ± 0.5 71.9 28.1 96.5Art and design 78.2 ± 0.9 4.8 ± 0.5 7.8 ± 0.6 1.1 ± 0.2 91.8 8.2 157.7Media Studies 23.3 ± 3.0 1.1 ± 0.7 3.5 ± 1.3 0.4 ± 0.5 28.4 71.6 38.8
Physical education 64.7 ± 0.8 15.6 ± 0.6 7.7 ± 0.5 1.4 ± 0.2 89.4 10.6 326.3
Citizenship 10.3 ± 3.0 0.2 ± 0.4 7.8 ± 2.6 0.4 ± 0.6 18.7 81.3 20.7
Source: School Workforce CensusBase: 150,852 secondary level teachers (unweighted head count)
2. Not including qualifications in Special Educational Needs provision.
7. Teachers qualified in biology, chemistry, or physics are treated as qualified to teach both combined/general science and other science.8. Teachers qualified in each of the specialist design & technology subjects are treated as qualified to teach other/combined design & technology.9. Information & Communication Technology is abbreviated as ICT.
Percentages are row percentages, and based on the number of teachers for whom curriculum and qualifications information was provided.
Numbers rounded to the nearest 90 and numbers below 50 are shown as nil or negligible.. Not applicable.- Nil or negligible.
Totals may not appear equal to the sum of the component parts because of rounding.
5. Includes Certificate of Education, Non-UK Qualifications where the level was not provided and Other Qualification at National Qualifications Framework (NQF) level 4 or 5 and above e.g. diplomas or higher education and further education, foundation degrees, higher national diplomas and certificates of higher education.
Hours taught in a typical week in 2011 to pupils in years 7 to 13 by highest post A-level qualifications1,2 of the teacher teaching the lesson.
6. Confidence intervals have been calculated around the proportions as not all schools were able to submit curriculum information, and not all qualifications returns were complete. Qualifications information was either not provided, or the subject field was missing for 12% of the teachers in schools submitting curriulum data. The confidence intervals show the statistical accuracy for the data, and give a range within which we can be reasonably sure (95% certain) that the true value actually lies.
1. Where a teacher has more than one post A level qualification in the same subject, the qualification level is determined by the highest level reading from left (Degree) to right (Other Qual.). For example, teachers shown under PGCE have a PGCE but not a degree.
Degree or higher4Bachelor of Education
Postgraduate Certificate of Education
Other qualification5
Table 14 (provisional)
HIGHEST LEVEL OF QUALIFICATION1 HELD IN A RELEVANT SUBJECT3
3. A full list of what was deemed as a 'relevant' qualification subject for each curriculum subject taught can be found in the SFR home page, November 2010 at http://www.education.gov.uk/rsgateway/DB/SFR/s000997/index.shtml .4. Includes Doctorates and other Level 8 qualifications, Masters and other Level 7 qualifications (e.g. Post Graduate certificates and diplomas), and first degrees (excluding BEds) and other level 6 qualifications (e.g. graduate certificates and diplomas).
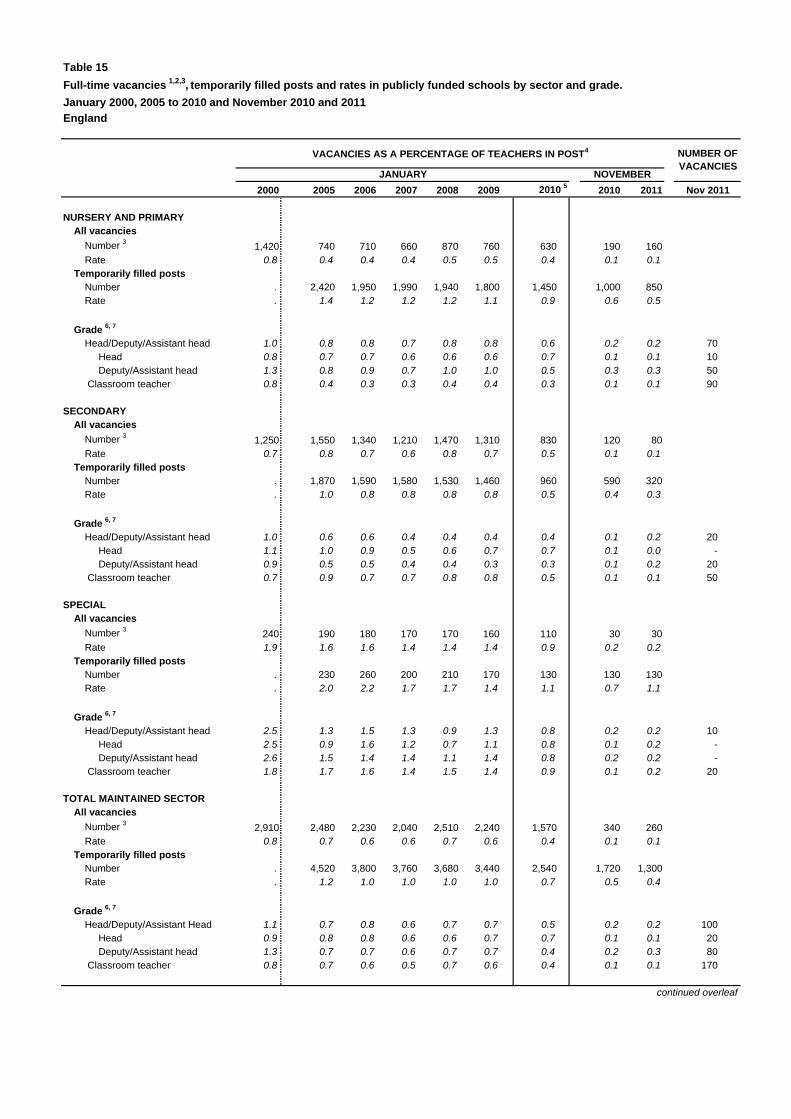
Table 15Full-time vacancies 1,2,3, temporarily filled posts and rates in publicly funded schools by sector and grade.January 2000, 2005 to 2010 and November 2010 and 2011
2000 2005 2006 2007 2008 2009 2010 5 2010 2011 Nov 2011
Number 3 1,420 740 710 660 870 760 630 190 160Rate 0.8 0.4 0.4 0.4 0.5 0.5 0.4 0.1 0.1
Number . 2,420 1,950 1,990 1,940 1,800 1,450 1,000 850Rate . 1.4 1.2 1.2 1.2 1.1 0.9 0.6 0.5
Head/Deputy/Assistant head 1.0 0.8 0.8 0.7 0.8 0.8 0.6 0.2 0.2 70 Head 0.8 0.7 0.7 0.6 0.6 0.6 0.7 0.1 0.1 10
1.3 0.8 0.9 0.7 1.0 1.0 0.5 0.3 0.3 500.8 0.4 0.3 0.3 0.4 0.4 0.3 0.1 0.1 90
Number 3 1,250 1,550 1,340 1,210 1,470 1,310 830 120 80Rate 0.7 0.8 0.7 0.6 0.8 0.7 0.5 0.1 0.1
Number . 1,870 1,590 1,580 1,530 1,460 960 590 320Rate . 1.0 0.8 0.8 0.8 0.8 0.5 0.4 0.3
Head/Deputy/Assistant head 1.0 0.6 0.6 0.4 0.4 0.4 0.4 0.1 0.2 20 Head 1.1 1.0 0.9 0.5 0.6 0.7 0.7 0.1 0.0 -
0.9 0.5 0.5 0.4 0.4 0.3 0.3 0.1 0.2 200.7 0.9 0.7 0.7 0.8 0.8 0.5 0.1 0.1 50
Number 3 240 190 180 170 170 160 110 30 30Rate 1.9 1.6 1.6 1.4 1.4 1.4 0.9 0.2 0.2
Number . 230 260 200 210 170 130 130 130Rate . 2.0 2.2 1.7 1.7 1.4 1.1 0.7 1.1
Head/Deputy/Assistant head 2.5 1.3 1.5 1.3 0.9 1.3 0.8 0.2 0.2 10 Head 2.5 0.9 1.6 1.2 0.7 1.1 0.8 0.1 0.2 -
2.6 1.5 1.4 1.4 1.1 1.4 0.8 0.2 0.2 -1.8 1.7 1.6 1.4 1.5 1.4 0.9 0.1 0.2 20
Number 3 2,910 2,480 2,230 2,040 2,510 2,240 1,570 340 260Rate 0.8 0.7 0.6 0.6 0.7 0.6 0.4 0.1 0.1
Number . 4,520 3,800 3,760 3,680 3,440 2,540 1,720 1,300Rate . 1.2 1.0 1.0 1.0 1.0 0.7 0.5 0.4
1.1 0.7 0.8 0.6 0.7 0.7 0.5 0.2 0.2 100 Head 0.9 0.8 0.8 0.6 0.6 0.7 0.7 0.1 0.1 20
1.3 0.7 0.7 0.6 0.7 0.7 0.4 0.2 0.3 800.8 0.7 0.6 0.5 0.7 0.6 0.4 0.1 0.1 170
NURSERY AND PRIMARY
England
VACANCIES AS A PERCENTAGE OF TEACHERS IN POST 4 NUMBER OF VACANCIES
JANUARY NOVEMBER
Classroom teacher
SPECIAL
All vacancies
Temporarily filled posts
Grade 6, 7
Deputy/Assistant head Classroom teacher
SECONDARYAll vacancies
Temporarily filled posts
Grade 6, 7
Deputy/Assistant head
Deputy/Assistant head Classroom teacher
All vacancies
Temporarily filled posts
Grade 6, 7
Deputy/Assistant head Classroom teacher
TOTAL MAINTAINED SECTORAll vacancies
Temporarily filled posts
Grade 6, 7
Head/Deputy/Assistant Head
continued overleaf

Table 15Full-time vacancies 1,2,3, temporarily filled posts and rates in publicly funded schools by sector and grade.January 2000, 2005 to 2010 2 and November 2010 and 2011
2000 2005 2006 2007 2008 2009 2010 5 2010 2011 Nov 2011
ACADEMIES (AND CTCs)
Number 3 . . . . . . . 40 80Rate . . . . . . . 0.2 0.1
Number . . . . . . . 70 160Rate . . . . . . . 0.4 0.2
Head/Deputy/Assistant head . . . . . . . 0.4 0.2 20 Head . . . . . . . - - -
. . . . . . . 0.5 0.2 20
. . . . . . . 0.2 0.1 70
Number 3 . . . . . . . 380 350Rate . . . . . . . 0.1 0.1
Number . . . . . . . 1,790 1,450Rate . . . . . . . 0.5 0.4
Head/Deputy/Assistant head . . . . . . . 0.2 0.2 110 Head . . . . . . . 0.1 0.1 20
. . . . . . . 0.2 0.3 90
. . . . . . . 0.1 0.1 240
7. The role of assistant head was created in 2001.
. Not applicable.
Totals may not appear to equal the sum of the component parts because of rounding.
5. The January 2010 headline figures utilises 83 local authority SWF returns and 69 local authority Form 618g returns. The definitions used in the SWF are as close as possible to the Form 618g survey it replaced and validation checks indicate that the two sources are comparable.6. The number of teachers in post by grade is from the Form 618g survey for 2001 onwards, previous years were estimated using the Database of Teacher Records. For November 2010 and onwards the School Workforce Census has been used.
- Nil or negligible.
1. The number of vacancies for local authorities that provided information through the School Workforce Census have been proportioned from overall vacancy numbers including temporarily filled posts. See notes to editors for further details.2. Advertised vacancies for full-time permanent appointments (or appointments of at least one term's duration). Includes vacancies being filled on a temporary basis of less than one term.3. There are 50 vacancies recorded for which the status is unknown and these have been excluded.4. Teachers in post include full-time qualified regular teachers in service on the census date.
Grade 6, 7
Deputy/Assistant head Classroom teacher
Source: Form 618g survey and School Workforce Census
Table 15 continued
England
VACANCIES AS A PERCENTAGE OF TEACHERS IN POST 4 NUMBER OF VACANCIES
JANUARY NOVEMBER
All vacancies
Temporarily filled posts
All vacancies
Temporarily filled posts
Grade 6, 7
Deputy/Assistant head Classroom teacher
TOTAL PUBLICLY FUNDED SCHOOLS

November 2010 and 2011
2010 2011 2010 2011
0.4 0.3 630 520
0.7 0.5 120 1000.5 0.4 40 300.4 0.4 80 900.3 0.4 30 400.5 0.4 110 800.3 0.1 10 -0.2 0.3 10 200.6 0.3 20 100.2 0.2 10 100.3 0.2 10 100.4 0.2 40 200.5 0.1 20 -0.2 0.1 10 100.2 0.2 10 100.2 0.1 30 20- - - -
0.5 0.4 50 50Unknown subjects . . 30 20
. Not applicable
Totals may not appear to equal the sum of the component parts because of rounding.
1. Advertised vacancies for full-time permanent appointments (or appointments of at least one term's duration). Includes vacancies being filled on a temporary basis of less than one year.
2. Teachers in post include full-time qualified regular teachers in (or on secondment from) publicly funded secondary schools.
- Negligible
Physical education/sport/danceCareersOther main and combined subjects
Source: School Workforce Census
LanguagesEnglish
Table 16Full-time classroom teacher vacancies and temporary filled number 1 of posts and rates in publicly funded secondary schools and academies by subject.
England
VACANCIES AS A PERCENTAGE OF
TEACHERS IN POST 2 NUMBER OF VACANCIES
ALL VACANCIES
MAIN TEACHING SUBJECTMathematicsInformation technologyAll sciences
Commercial/business studiesArt/craft/designMusic
DramaHistorySocial sciencesGeographyReligious educationDesign and technology

January 2000, 2005 to November 2011England
NURSERY SCHOOLSPTR within-schools 1, 2 18.1 16.5 16.3 16.8 16.3 16.5 16.1 16.7PAR within-schools 3 7.1 5.5 5.3 5.2 4.9 4.8 .. 4.9
PRIMARY SCHOOLSPTR within-schools 1, 2 23.3 22.5 22.0 21.9 21.6 21.4 20.9 21.0PAR within-schools 3 16.8 13.4 12.8 12.4 12.0 11.6 .. 11.9
SECONDARY SCHOOLSPTR within-schools 1, 2 17.2 16.7 16.6 16.5 16.2 15.9 15.6 15.5PAR within-schools 3 14.5 12.2 11.7 11.4 11.0 10.7 .. 10.9
LOCAL AUTHORITY MAINTAINED OVERALLOverall PTR 2, 4 18.6 17.4 17.2 17.1 16.9 16.9 17.3 17.6
SPECIAL SCHOOLSPTR within-schools 1, 2 6.8 6.4 6.4 6.4 6.3 6.3 6.4 6.3PAR within-schools 3 3.2 2.4 2.3 2.2 2.1 2.0 .. 2.2
ACADEMIESPTR . 15.1 14.7 15.1 14.7 14.2 15.9 16.0PAR within-schools 3 . . . . . . .. 11.1
Source: School Census, School Workforce Census and 618g survey (overall teachers)
2007 2008 2009
Table 17Pupil:teacher ratios1 in local authority maintained nursery, primary, secondary and special schools and publicly funded academies.
JANUARY NOVEMBER
The source used up to January 2009 is the School Census for pupils and teachers (except overall teachers, form 618g). For November 2010 and 2011 the sources are the School Workforce Census and for pupil numbers the School Census from the following January. Due to some minor differences in the data collection methodology and definitions figures in 2010 and 2011 may not be fully comparable with the earlier years.
2010 2011
1. The within-school PTR is calculated by dividing the total FTE number of pupils on roll in schools by the total FTE number of qualified teachers regularly employed in schools. Source: ASC. See note to editors for further details.
2. For statistical purposes only, pupils who do not attend both morning and afternoon at least five days a week are regarded as part-time. Each part-time pupil is treated as 0.5 FTE.
3. The PAR is calculated by dividing the total FTE number of pupils on roll in schools by the total FTE number of all teachers and support staff employed in schools, excluding administrative and clerical staff.
4. The overall PTR is based on the total FTE number of pupils on roll in local authority maintained nursery, primary and secondary schools and the FTE of all teachers in these schools (including: centrally employed; occasional teachers; those on employment based routes to QTS; others without QTS, those on paid absence and any replacements). Special schools are excluded. Prior to 2010 the teacher numbers are from the 618g survey.
2000 2005 2006

Calendar years 2000, 2005 to 2009 and academic years 2009-2010 and 2010-2011
2000 2005 2006 2007 2008 2009 2009-10 2010-11
% of teachers taking sickness absence3 55 55 57 57 57 56 52 56
Days sick per teacher3 5.4 5.2 5.3 5.4 5.0 4.9 4.2 4.6
Days sick per teacher taking sickness absence 9.9 9.3 9.3 9.3 8.8 8.7 8.2 8.2
Number of teachers taking sickness absence 273,300 300,700 308,400 313,700 312,500 308,800 278,400 268,800
Total days sickness absence taken 2,694,400 2,796,000 2,876,900 2,930,300 2,749,900 2,695,200 2,277,700 2,216,000
Source School Workforce Census (2009-10 and 2010-11) and Form 618g (2000 to 2009).
1. Includes academy schools for academic years only.2. Includes estimated figures for local authorities and schools that did not provide complete data.3. Based on an estimate of the number of teachers that have worked in the maintained sector during the calendar year except 2009-10 and 2010-11.
`
Table 18Full-time and part-time teacher sickness absence 1 in publicly funded schools2.
England
CALENDAR YEAR ACADEMIC YEAR