statistical characterization of the hydrochemical data’s
TRANSCRIPT

Geologia CroaticaGeologia CroaticaAB STRA CTThe main purpose of this research is to determine the quality of ground water in Wadi AdDawasir by the assessment of 12 chemical parameters: pH, EC, Eh, TDS, TH, Ca2+, Cl–, HCO3
–, Mg2+, Na+, NO3–, and SO4
2–. Statistical analy-ses were carried out using descriptive statistics, histograms, and normal quantile plots. The SPSS 15 software pack-age (SPSS Inc. 2006) and JMPIN (version 4.0.4) were used as the main statistical software. Many locations within the study area show thatf pH, EC, HCO3
– and Na+ values exceed permissible limits. The concentration of anions is
in the order SO42–>Cl–>HCO3
–. Some of the analyzed parameters approach a normal distribution, as both their skew-ness and kurtoses are close to zero. However, skewness for some parameters such as Mg2+ and HCO3
– is high. Kur-
tosis for most of the elements varies from moderate to low. Only pH, HCO3– and SO4
2– have kurtoses. Both the re-sults of cluster tree and geochemical features of variables could be generally classifi ed into three main groups. Group 1 is comprised of Na and SO4
2–. The relationships within this group are strong. Group 2 consisted of Mg2+, NO3–,
pH, HCO3–, and Ca2+. The fact that this group has a close relationship with group 1 demonstrates that the increase in
the concentration of some elements could be the same. Group 3 is comprised of TH, Cl–, Eh, and EC.
Keywords: Hydrochemistry, geostatistics, histograms, normal quantile plots, Wadi AdDawasir, Saudi Arabia
Geologia Croatica 67/3 207–216 6 Figs. 3 Tabs. Zagreb 2014
Statistical characterization ofthe hydrochemical data’s of
groundwater in the arid land of Wadi AdDawasir area, Saudi Arabia:
A probabilistic assessment
1Yousef Nazzal*, 1Nassir S. N. Al-Arifi , 2H.A. Kishawy, 1Khaled M. Al-Kahtany and 1Awad Alshmrani
1 Department of Geology and Geophysics, King Saud University, PO Box 2455, Riyadh 11451, Saudi Arabia2 Faculty of Engineering and Applied Science, University of Ontario Institute of Technology, 2000 Simcoe
Street North, Oshawa, Ontario, L1H 7K4, Canada
doi: 10.4154/gc.2014.15
HAKEN (2013). When limited trace element data are avail-able, geochemical environmental scientists are often re-quested to evaluate the character and quality of groundwater. If the distribution of trace elements in groundwater is known, then observed data could be used to easily differentiate be-tween representative or anomalous groundwater composi-tions. However, because characterizing a groundwater sys-tem is diffi cult and expensive, a representative benchmark of known element distributions to categorize observed data is rarely available. As a result, effective evaluation of con-centrations of observed trace elements might be challenging
1. INTRODUCTIONThe chemical composition of water is an important factor in determining its healthy condition for the various applications that support human life. The quality of groundwater is go-verned by many factors, such as soil characteristics, circula-tion pattern of groundwater through different rock types, to-pography of the region, saline water intrusion in coastal areas, and fi nally human activities, REGHUNATH et al.(2002). In many countries, for instance Saudi Arabia, groundwater is the unique source of freshwater to satisfy do-mestic uses as well as industrial and agricultural demands

Geologia Croatica 67/3Geologia Croatica208
and require further investigation, NEWCOMB, W.D. & RIM STIDT, J.D. (2002).
Probabilistic methods are well suited for describing the complex distributions of trace elements in groundwater. These techniques rely on large sample populations which can satisfactorily represent the system of groundwater to be studi ed. The costs associated with sample collection and lab-oratory analyses to establish large sample populations may impose a barrier to the application of probabilistic methods. Public domain data resources, such as STORET, are appro-priate databases where large environmental data can be ac-cessed at low cost, EPA (2001). However, little or no data analysis capabilities are provided in the public domain sources. Moreover, trace element sample populations are of-ten censored at multiple reporting limits (RLs), depending upon variations in laboratory analysis methodology and tech-niques. The use of data analysis techniques, as described by HELSEL (1990), and HELSEL, D.R. & HIRSCH, R.M. (1992), for multiple-censored sample populations can be used to extract salient information from raw trace element data.
The present study deals with the assessment of the ma-jor groundwater parameters data. To achieve this, histograms and normal quantile plots were used to define subpopulations in the water samples. This work provides a rapid, cost-effec-tive screening tool for evaluating groundwater quality based on the observed element concentration data. Normal quan-tile plots yield significant detail on the behavior of subpopu-lations at both the high and low end of the frequency spec-trum, as well as those having a central tendency. Having been utilized in data mining in space research, normal quantile plots demonstrate their strong capability in explaining clus-tered properties even in very large data sets (e.g., MANKU et al., 1999). NEWCOMB, W.D. & RIMSTIDT, J.D. (2002) used the probability distribution of trace elements in very large numbers of ground water samples in the STORET da-
Figure 1: a – Sampling locations and geological map of Wadi AdDawasir in Saudi Arabia; b – Summary stratigraphic succession of the Wajid Sand-stone in the Region (after KELLONG et al., 1986).
a)
b)

Nazzal et al.: Statistical characterization of the hydrochemical data’s of groundwater in the arid land of Wadi AdDawasir area, Saudi Arabia ... Geologia Croatica209
tabase, U.S. ENVIRONMENTAL PROTECTION AGENCY (2002).
Major research and discoveries related to Wajid sand-stone hydrogeology, geology, and hydrochemistry of the study area have been published by DABBAG (1981), DAB-BAG, M.E & ROGERS, J.J.W. (1983), MOSHARIF (1989), MOSHARIF & EL-HITTI, A. (1989), STUMP, T.E.& VON der EEM, J.G.(1994), ITALCONSULT (1969), and AL-FAIFI, H.J.A. (2005).
2. STUDY AREA
2.1. Descriptions of the study areaThe study area is situated within Wadi AdDawasir. It is lo-cated between latitudes 19° 30ʹ 00ʺ N, 21° 00ʹ 00ʺ and lon-gitudes 44° 00ʹ 00ʺ E, 46° 30ʹ 00ʺ 650 km south of Riyadh (Fig. 1a).The study area is very important in Saudi Arabia from an agricultural point of view. The Annual average tem-perature in the area is about 29 °C, the maximum average temperature is 43 °C, and the minimum average temperature is 6 °C. The mean temperature during summer is 35 °C and June is the hottest month of the year. The annual average relative humidity is about 24% and it is more than 70% dur-ing winter. The average rainfall is 37.6 mm/year. Maximum rainfall in March includes the Mediterranean storm effect on winter rainfall, AL-FAIFI, H.J.A. (2005).
2.2. Geological setting The study area lies within the Wadi Tathlith Quadrangle, which covers a surface area of 8902 km2 of the southern Najd Province of Saudi Arabia. About two thirds of the quadrangle is underlain by an assemblage of stratified rock overlying the oldest crystalline, metamorphosed, Precambrian basement rocks of the Arabian shield, much of it comprising an almost flat pediment surface. Almost horizontally bedded Phanero-zoic sedimentary rocks underlie the remaining part of the Wadi Tathlith Quadrangle in the southwest. In the study area, the Phanerozoic rocks lie unconformably on the Proterozoic of the Arabian shield. The contact is not clearly exposed any-where in the Wadi Tathlith Quadrangle, and is commonly con-cealed by debris from the poorly consolidated basal conglom-erate of the Wajid Sandstone. The Wajid Formation, which is one of the important geological formations in the study area, is divided into four members from bottom to top: Dibsiyah member, Sanamah member, Khusayyan member, and Juwayl member (Fig. 1a, and b), AL-FAIFI, H.J.A. (2005).
2.3. Hydrogeological settingThe Wjid aquifer is considered to be one of the most impor-tant hydrostratigraphic units in the Kingdom of Saudi Ara-bia. It is only to the east that there remain any doubts as to its extent. The depth of the aquifer, which reaches 480 me-tres, has made it impossible to detect the aquifer east of lon-gitude 45 35 00 E. The unconfined part of the aquifer, in and near the outcrop zone of the Wajid formation, is very exten-sive. It can be followed from the south bank of Wadi AdDa-wasir to the Yemen border in the south. The unconfined part of the aquifer seems to be absent to the north of Wadi Ad-
Dawasir. The confined part of the aquifer is more extensive. The border between the unconfined and confined conditions roughly coincides with the western limit of the Khuff forma-tion at outcrop. The presence of the confined Wajid Aquifer has been confirmed over an area of 12000 km2 in the Wadi AdDawasir region. However, it is reasonable to suppose that it continues for a considerable distance to the east of the Su-layyil-Wadi Hinw, AL-FAIFI, H.J.A. (2005).
3. MATERIALS AND METHODS
A total of 253 samples of groundwater were collected (each from a different water well location) in the Wadi AdDawasir, Saudi Arabia, in the period between January to June 2013 (Fig. 1). These wells are used for irrigation and public sup-ply purposes. Water depth ranges between 450–472 m, well casing is 269–278 m, screen is open.The pumps are installed in the wells and the samples collected directly from the well during pumping, AL-FAIFI, H.J.A. (2005). Samples were collected in 1 litre capacity polyethylene bottles, which were rinsed with well water prior to filling in order to minimize the chance of contamination. The sample preservation and applied analytical techniques were in accordance with the standard methods from the American Public Health Asso-ciation (APHA, 1995). Unstable parameters, such as hydro-gen ion concentration (pH), total dissolved solids (TDS) and electrical conductivity (EC), were determined at the sam-pling sites by means of a pH-meter, a portable EC-meter and a TDS-meter (Hanna Instruments, Michigan, USA). The So-dium (Na+), potassium (K+), magnesium (Mg2+), and cal-cium (Ca2+) ions were determined by an atomic absorption spectrophotometer (AAS). Bicarbonate (HCO3
–) and chlo-ride (Cl–) were analyzed by volumetric methods. Sulfate (SO4
2–) was estimated by the colorimetric and turbidimetric methods. Silicon dioxide (SiO2
2–) was calorimetrically ana-lyzed by the ammonium molybdate method. Nitrate (NO3
–) was measured by ionic chromatography.
For the present study, statistical analyses were carried out using descriptive statistics, histograms, and normal quan-tile plots. The SPSS 15 packages (SPSS Inc. 2006) and JMPIN (version 4.0.4) were used as the main statistical software.
Histograms were used to analyze the data distribution. They are the appropriate tools for displaying frequency dis-tributions and rely on dividing the data into classes (or bins). The data, following a normal distribution, will show a sym-metric bell-shaped histogram, where a tail towards high val-ues implies that the data are positively skewed. Histograms provide visual approximations to distributions such as the bell shape of a normal distribution, but they have some lim-itations. The number of bins affects the shape of the curve where this number can be determined by the software. A curve representing the normal distribution, corresponding to the mean and standard deviation of the data set, is superim-posed on the histogram for the purpose of comparison. Ex-treme values occur at the high end, which are separated and identified as outliers in order to show the major tendency of the data. The limitations of the histograms are offset by nor-mal quantile plots.
Geologia Croatica 67/3Geologia Croatica210
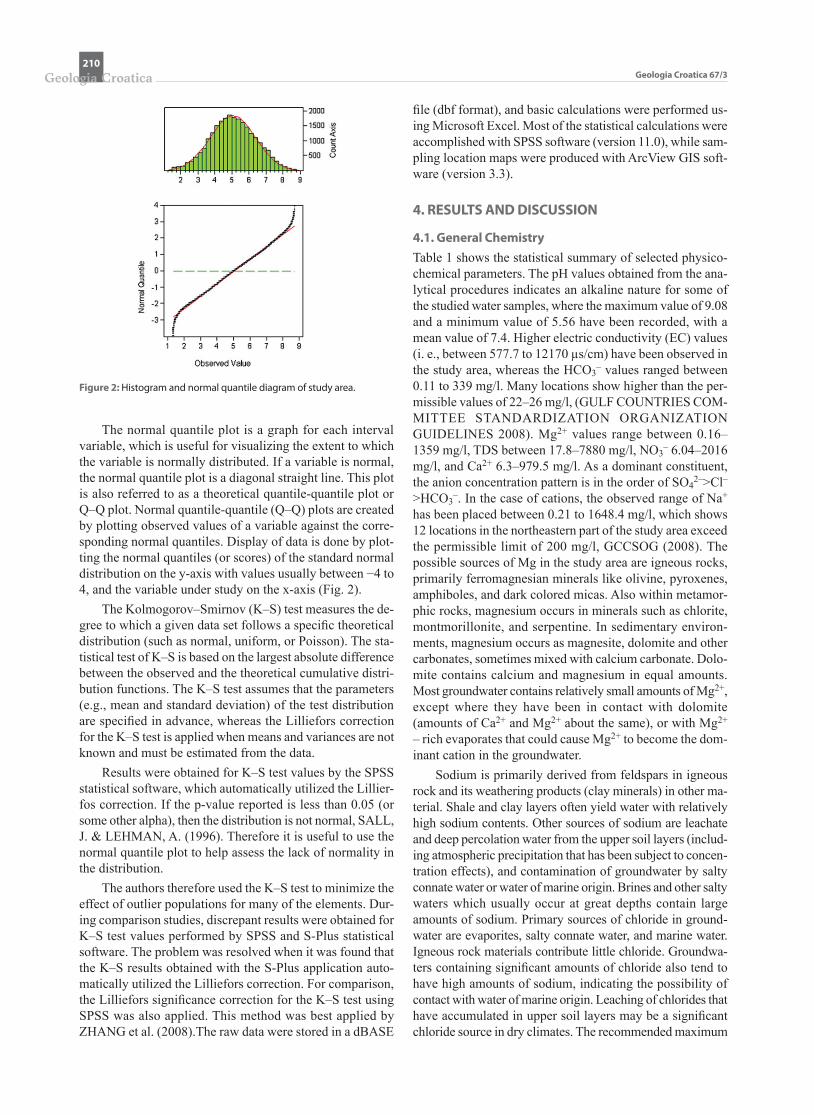
The normal quantile plot is a graph for each interval variable, which is useful for visualizing the extent to which the variable is normally distributed. If a variable is normal, the normal quantile plot is a diagonal straight line. This plot is also referred to as a theoretical quantile-quantile plot or Q–Q plot. Normal quantile-quantile (Q–Q) plots are created by plotting observed values of a variable against the corre-sponding normal quantiles. Display of data is done by plot-ting the normal quantiles (or scores) of the standard normal distribution on the y-axis with values usually between −4 to 4, and the variable under study on the x-axis (Fig. 2).
The Kolmogorov–Smirnov (K–S) test measures the de-gree to which a given data set follows a specific theoretical distribution (such as normal, uniform, or Poisson). The sta-tistical test of K–S is based on the largest absolute difference between the observed and the theoretical cumulative distri-bution functions. The K–S test assumes that the parameters (e.g., mean and standard deviation) of the test distribution are specified in advance, whereas the Lilliefors correction for the K–S test is applied when means and variances are not known and must be estimated from the data.
Results were obtained for K–S test values by the SPSS statistical software, which automatically utilized the Lillier-fos correction. If the p-value reported is less than 0.05 (or some other alpha), then the distribution is not normal, SALL, J. & LEHMAN, A. (1996). Therefore it is useful to use the normal quantile plot to help assess the lack of normality in the distribution.
The authors therefore used the K–S test to minimize the effect of outlier populations for many of the elements. Dur-ing comparison studies, discrepant results were obtained for K–S test values performed by SPSS and S-Plus statistical software. The problem was resolved when it was found that the K–S results obtained with the S-Plus application auto-matically utilized the Lilliefors correction. For comparison, the Lilliefors significance correction for the K–S test using SPSS was also applied. This method was best applied by ZHANG et al. (2008).The raw data were stored in a dBASE
file (dbf format), and basic calculations were performed us-ing Microsoft Excel. Most of the statistical calculations were accomplished with SPSS software (version 11.0), while sam-pling location maps were produced with ArcView GIS soft-ware (version 3.3).
4. RESULTS AND DISCUSSION
4.1. General ChemistryTable 1 shows the statistical summary of selected physico-chemical parameters. The pH values obtained from the ana-lytical procedures indicates an alkaline nature for some of the studied water samples, where the maximum value of 9.08 and a minimum value of 5.56 have been recorded, with a mean value of 7.4. Higher electric conductivity (EC) values (i. e., between 577.7 to 12170 µs/cm) have been observed in the study area, whereas the HCO3
– values ranged between 0.11 to 339 mg/l. Many locations show higher than the per-missible values of 22–26 mg/l, (GULF COUNTRIES COM-MITTEE STANDARDIZATION ORGANIZATION GUIDELINES 2008). Mg2+ values range between 0.16–1359 mg/l, TDS between 17.8–7880 mg/l, NO3
– 6.04–2016 mg/l, and Ca2+ 6.3–979.5 mg/l. As a dominant constituent, the anion concentration pattern is in the order of SO4
2–>Cl–>HCO3
–. In the case of cations, the observed range of Na+ has been placed between 0.21 to 1648.4 mg/l, which shows 12 locations in the northeastern part of the study area exceed the permissible limit of 200 mg/l, GCCSOG (2008). The possible sources of Mg in the study area are igneous rocks, primarily ferromagnesian minerals like olivine, pyroxenes, amphiboles, and dark colored micas. Also within metamor-phic rocks, magnesium occurs in minerals such as chlorite, montmorillonite, and serpentine. In sedimentary environ-ments, magnesium occurs as magnesite, dolomite and other carbonates, sometimes mixed with calcium carbonate. Dolo-mite contains calcium and magnesium in equal amounts. Most groundwater contains relatively small amounts of Mg2+, except where they have been in contact with dolomite (amounts of Ca2+ and Mg2+ about the same), or with Mg2+
– rich evaporates that could cause Mg2+ to become the dom-inant cation in the groundwater.
Sodium is primarily derived from feldspars in igneous rock and its weathering products (clay minerals) in other ma-terial. Shale and clay layers often yield water with relatively high sodium contents. Other sources of sodium are leachate and deep percolation water from the upper soil layers (includ-ing atmospheric precipitation that has been subject to concen-tration effects), and contamination of groundwater by salty connate water or water of marine origin. Brines and other salty waters which usually occur at great depths contain large amounts of sodium. Primary sources of chloride in ground-water are evaporites, salty connate water, and marine water. Igneous rock materials contribute little chloride. Groundwa-ters containing significant amounts of chloride also tend to have high amounts of sodium, indicating the possibility of contact with water of marine origin. Leaching of chlorides that have accumulated in upper soil layers may be a significant chloride source in dry climates. The recommended maximum
Figure 2: Histogram and normal quantile diagram of study area.

Nazzal et al.: Statistical characterization of the hydrochemical data’s of groundwater in the arid land of Wadi AdDawasir area, Saudi Arabia ... Geologia Croatica211
concentration for chloride in drinking water is 250 mg/1, pri-marily for reasons of taste. Sulfate is formed by oxidation of pyrite and other sulfides widely distributed in igneous and sedimentary rocks. The most important sulfate deposits are found in evaporite sediments (gypsum, anhydrite, sodium sul-fate). In arid regions, leaching of sulfate from the upper soil layers may also be significant, causing sulfate to be the prin-cipal anion of the underlying groundwater. Sulfate concentra-tions in drinking water should not exceed 250 mg/1 because the water will have a bitter taste and can produce laxative ef-fects at higher levels.
Factors that govern the concentration of various ele-ments in the groundwater of the study area are the climate of the area, chemical composition of the water and the pres-ence of accessory minerals in the rocks through which the groundwater is circulating. The high salinity particularly with in agricultural areas envisages anthropogenic influence. A variety of chemical fertilizers used for agricultural growth may enter into the groundwater system through return water. Over exploitation of groundwater in the study area causes groundwater decline which may also affect its quality, AL-FAIFI, H.J.A. (2005). Thus, anthropogenic activities in the study area are also considered as potential factors in ground-water quality. Industrial sources, including for example the production of glass, ceramics, electronics, steel and alumi-num, processing pesticide and fertilizers and untreated waste water, together with agricultural activities are all considered as important anthropogenic sources for various elements in the study area. Agricultural and industrial developments place huge demands on precious water resources. There has been significant over-exploitation of water resources result-ing in large cones of depression. With the Pumping rate of 1800 USG/min, drawdown after 20 years equals 43m. The predicted drawdown after 40 years and 60 years may reach to 90 m and 141m, respectively, AL-FAIFI, H.J.A. (2005).
4.2. Basic statisticsThe basic statistics (maximum, minimum, percentiles, mean, median, and standard deviation) for the data are shown in Table 1. Percentages are variable for all of the parameters in the study area; e.g., Mg2+ varies between 0.16 and 1359.9 mg/l. The shape parameters (skewness and kurtosis) are also calculated and listed in Table 2. Some of the analyzed pa-rameters approach a normal distribution, as both their skew-ness and kurtosis reach close to 0. Skewness for some ele-ments is high; e.g., Mg2+ shows a high value of 4.51. Others such as HCO3
– have a much lower level of skewness. Some parameters are characterized by high kurtosis values; Mg2+ shows a high value of 29.02, which may be due to a large number of low value samples compared to the wide data range associated with the outliers. Parameters such as HCO3
–
also have fairly low kurtosis, with the fact that these values are more evenly distributed within the data ranges.
Skewness measures the presence of a tail deviating from a normal distribution (0) toward lower values (negative skewness) or higher values (positive skewness). For the raw data sets, the skewness for the other parameters are positive, many of which are high (Mg2+).This confirms the strongly
skewed distributions displayed in the histograms and normal Q–Q plots. Kurtosis refers to the “fatness” of the tails in sta-tistical plots, where positive kurtosis denotes peakedness while a negative value represents a “flat” distribution. The kurtosis for most parameters is moderate to low. High posi-tive kurtosis shows that very high values in the data are rare, presumably associated with rare processes such as miner-alization. Only pH, HCO3
– and SO42+ have a fairly small
kurtosis, showing that these values are more evenly distrib-uted within the data ranges, and that special concentration of these parameters is rare.
Logarithmic transformation tends to move both skew-ness and kurtosis for most parameters towards normality, i.e., closer to 0. Another feature of the logarithmic transfor-mation is that most of the transformed data sets have nega-tive skewness values showing that the log-transformation has over-transformed the data.
4.3. Histograms and normal quantile diagramsThe probabilistic display delineates discrete populations that have genetic or other affinities as line segments showing changes in slope (i.e., “kinks”). The observed distributions significantly differ from the synthetic distributions modeled by SINCLAIR, A.J. (1976) and ZHANG et al. (2008) for chemical distributions. It appeared that these pioneering au-thors have superimposed different types of distributions hav-ing the same concentration range, which yielded curved chan ges in the slope. The present data include elemental dis-tributions with substantial overlap and curvatures. In fact, notable features include the prominent role of line segments showing sharp angular change. Such features require largely discrete chemical subpopulations.
Histograms of data are shown in Figure 3. As can be seen, some parameters have high values, which are reflected in the histograms by data being located on the left of the di-agram. These extreme values are well visualized on the nor-mal quantile diagrams, and they are identified as outliers. Some parameters have values below or close to the detection limits (e.g., Na+ and SO4
2+), resulting in high frequencies for the lowest value group, near the limit of detection.
The frequency distributions of some of the parameters are positively skewed and include some very high values. Some extreme values (Eh, Cl–, Mg2+, Na+, and NO3
–) appear to be separated from the majority of the samples, and do not appear to be part of a continuous distribution (e.g., Figure 3, Table 1). These extreme values might be regarded as evi-dence of particular natural or anthropogenic processes.
The normal quantile diagrams for the data are shown in Figure 4. Straight-line segments are observed for some pa-rameters including HCO3
–. Samples below the detection limit form the vertical line on the left side of the diagram (e.g., Na+ and SO4
2–). Most of the parameters depart from normality towards the highest values, located on the right side of the straight normal distribution line. The result is re-ferred to as the positively skewed or convex distribution fea-ture for most elements. Most of the parameters demonstrate some form of convex shapes; they are composed of multiple geochemical families and have closer to log-normal distri-

Geologia Croatica 67/3Geologia Croatica212
butions. The diagrams provide useful information for outlier detection. Many single samples are separated from the dis-tribution curve.
The diagrams indicate mixtures of populations or geo-chemical families by identified changes in the slope for many parameters. Most elements have high values, which are well visualized in normal quantile diagrams (Fig. 4). The high concentrations for Ca2+, Cl–, Mg2+, Na+, NO3
– and SO42–
show a sharp reduction in the slope at high concentration values. These samples may be influenced by natural or an-thropogenic particular processes. Most parameters show a closer approach to normality with some departures from nor-mality occurring in the highest values, located on the right side of the straight normal distribution line.
4.4. Correlation CoefficientThe Correlation Coefficient is presented in matrix form in Table 3, which shows the Pearson product-moment correla-tion coefficients. The matrix contains 12 variables, and sum-
marizes the strength of the linear relationships between each pair of variables. If there is an exact linear relationship be-tween two variables then the correlation is 1 or –1 depend-ing on whether the variables are positively or negatively re-lated. If there is no linear relationship, the correlation tends toward zero. A finding is described as “statistically signifi-cant” when the probability is less than 0.05 (p<0.05) and as “highly statistically significant” when p is less than 0.01 (p<0.01). If the probability value is greater than 0.05 (P > 0.05), the coefficient of correlation is not significant.
Most of the metal pairs exhibit positive relationships (except for Eh, EC, Mg2+, and NO3
–). However, only a few of these correlations are significant at the 0.05 level (2-tailed), while the majority of them are significant at the 0.01 level (2-tailed). The parameters showing significantly higher pos-itive correlation are: TDS with EC; TH and EC, TDS; Ca2+ and EC, TDS, TH; Cl– and EC, TDS, TH, Ca2+; Mg2+ and EC; Na+ and EC, TDS, TH, Ca2+, Cl–; NO3
– and Mg2+; SO42–
and EC, TDS, TH, Ca2+, Cl–, Na+.
Table 1: Percentiles of the variables of groundwater at Wadi AdDawasir in Saudi Arabia (EC in [µS/cm]; Eh in mV; chemical parameters are in mg/l).
Minimum 5% 10% 25% 50% 75% 90% 95% Maximum Mean S.D
pH 5.46 6.83 7.04 7.22 7.45 7.64 8.04 8.52 9.08 7.48 0.46
EC 3.5 577 828 1028 1520 2700 3672 5380 1217 2119 1830
Eh –206 –183 –117 –42 –19 623 1850 2018 7490 424 931
TDS 17.8 172 218 464 784 1300 2282 3136 7880 1096 1119
TH 13.5 48 61 143 315 588 920 1228 3944 440 497
Ca2+ 6.3 14 18 30 89 172 278 366 979 127 135
Cl– 5.2 94 110 151 180 356 721 1164 3793 349 464
HCO3– 0.11 6.15 13 50 128 168 203 236 339 117 73
Mg2+ 0.16 12 17 26 46 96 248 363 1359 97 146
Na+ 0.21 2.71 5.6 10 93 189 345 494 1648 149 226
NO3– 0.04 2.01 5.62 27 108 170 418.4 543 2016 147 201
SO42– 0.01 0.1 0.19 0.43 156 272 507 633 1785 202 261
Figure 3: Histograms of the data set (a normal distribution curve for all the values is superimposed for comparison; EC in [µS/cm]; chemical parameters are in mg/L).

Nazzal et al.: Statistical characterization of the hydrochemical data’s of groundwater in the arid land of Wadi AdDawasir area, Saudi Arabia ... Geologia Croatica213
The reason for this is the observed correlation for the vari-ous parameters based on the geochemical behaviour of the chemical species and /or the possible anthropogenic inputs to the water. Therefore, the concentration of various parameters in groundwater is related to lithology and relies on the distance from the alteration areas, climate of the area, and chemistry
of the water and the presence of accessory minerals of the rocks through which the groundwater is circulating.
4.5. Scatter Diagrams MatrixCorrelation scatter diagrams help to visualize the correla-tions. Scatter diagrams of each pair of variables are display ed
Figure 4: Normal quantile plots for the data set (the normal quantiles are plotted on the y-axis; the observed values are plotted on the x-axis EC in [µS/cm]; chemical parameters are in mg/l).
Table 2: Skewness, Kurtosis in the data sets with results of Kolmogorov-Smirnov test.
Raw variables Log-Raw variables
Parameter Skewness Kurtosis K-S p Skewness Kurtosis K-S p
pH 0.5 2.39 0.000 0.14 2.98 0.000
EC 2.92 10.75 0.000 –1.38 13.05 0.000
TDS 2.99 11.99 0.000 –0.37 0.91 0.000
TH 3.38 16.66 0.000 –0.21 –0.43 0.000
Ca2+ 2.81 11.41 0.000 –0.22 –0.56 0.000
Cl– 4.27 23.12 0.000 –0.14 3.29 0.000
HCO3– 0.16 –0.52 0.000 –1.45 1.57 0.000
Mg2+ 4.51 29.02 0.000 0.3 0.53 0.001
Na+ 3.63 16.95 0.000 –0.3 –0.94 0.000
NO3– 4.14 28.47 0.000 –0.74 0.05 0.000
SO42– 2.58 9.59 0.000 –0.46 –1.59 0.000

Geologia Croatica 67/3Geologia Croatica214
Table 3: Correlation coefficients between the variables of groundwater at Wadi AdDawasir in Saudi Arabia.
pH EC Eh TDS TH Ca2+ Ca2+ Ca2+ Ca2+ Ca2+ Ca2+ Ca2+
pH 1
EC –0.10 1
Eh –0.31 0.35 1
TDS 0.03 0.89 –0.09 1
TH 0.06 0.79 –0.21 0.94 1
Ca2+ 0.00 0.79 –0.18 0.93 0.97 1
Cl– 0.04 0.80 –0.21 0.95 0.92 0.89 1
HCO3– 0.25 0.08 –0.44 0.27 0.34 0.30 0.16 1
Mg2+ –0.21 0.61 0.92 0.21 0.11 0.11 0.08 –0.26 1
Na+ 0.09 0.74 –0.31 0.93 0.84 0.81 0.93 0.30 –0.04 1
NO3– –0.25 0.35 0.85 0.00 –0.11 –0.06 –0.13 –0.31 0.81 –0.22 1
SO42– 0.09 0.66 –0.39 0.88 0.86 0.86 0.84 0.41 –0.11 0.92 –0.28 1
Figure 5: Scatter Matrix plot for selected elements in analysed groundwater samples from the study area.

Nazzal et al.: Statistical characterization of the hydrochemical data’s of groundwater in the arid land of Wadi AdDawasir area, Saudi Arabia ... Geologia Croatica215
in a matrix arrangement. A 95% bivariate normal density el-lipse is imposed on each scatter diagram. If the variables are bivariate normally distributed, this ellipse encloses approx-imately 95% of the points (when the number of points is high). The strong correlation of the variables is seen by col-lapsing the ellipse along the diagonal axis. If the ellipse is fairly round and is not diagonally oriented, the variables are uncorrelated (Fig. 5).
To better visualize multiple relationships between the variables, a scatter matrix plot was produced (Fig. 5) for the 12 variables, showing the best relationship in the cluster tree (Fig. 6).In this plot, each cell shows the scatter between the variables in the corresponding row and column. A histogram for each variable was also provided in the diagonal cells where the variables for the corresponding row and column are the same. The histogram is shown separately in Figure 3. To some extent, a good correlation between all 12 varia-bles of pH, EC, Eh, TDS, TH, Ca2+, Cl–, HCO3
–, Mg2+, Na+, NO3
–, and SO42– was illustrated. The best correlation exists
between Na and SO42–. Relative correlations were observed
for the variables TDS, TH, and Ca2+, while the scatter plots between HCO3
– and other variables were also relatively noisy. The results were in line with the cluster tree.
4.6. Hierarchical cluster analysis (HCA)The hierarchical cluster analysis (HCA) seeks to identify ho-mogeneous subgroups of cases in a population and to identify a set of groups which both minimize within-group variation and maximize between-group variation. One of the general approaches to cluster analysis is hierarchical clustering. The product of this approach is a dendrogram (Fig. 6).Also called tree diagrams, these show the relative size of the proximity coefficients at which cases were combined. In the present study, the Euclidean distance is selected as the measured dis-tance. The sampling sites with significant similarity are first grouped. Following this, groups of samples are joined with a linkage rule, and the steps are repeated until all observations are classified. Ward’s method has been successfully applied here to form clusters that are more or less homogenous and
geochemically distinct from other clusters (BATAYNEH, A. & ZUMLOT, T. 2012; CLOUTIER et al., 2008).
It was also found that using the Euclidean distance as a distance measure, and Ward’s method as a linkage rule, pro-duced the most distinctive groups. However, taking both the results of the cluster tree and geochemical features of vari-ables into consideration, they could be generally classified into three main groups. Group 1 comprised Na+ and SO4
2–. The relationship within this group is strong. Group 2 con-sisted of Mg2+, NO3
–, pH, HCO3–, and Ca2+. The fact that
this group has a close relationship with group 1 demonstrates that the increase in the concentration of some elements could be the same. Group 3 comprised TH, Cl–, Eh, EC, and TDS.
5. CONCLUSIONS
Hydrochemical variable concentrations dominantly deter-mine the overall quality and characteristics of groundwater. Chemical parameters in groundwater are derived from both natural and anthropogenic sources. Complex processes gov-ern the distribution of chemical elements in groundwater. Sophisticated data analysis techniques are required to effec-tively interpret chemical data. Probabilistic data analysis techniques provide an enhanced data analysis capability for complicated chemical parameter distributions in groundwa-ter. The results of this work suggest that chemical parameter data are approximately log-normally distributed, as both their skewness and kurtosis values are close to 0. The study shows that most of the metal pairs exhibit positive relation-ships (except for Eh, EC, Mg2+, and NO3
–). The parameters showing significantly higher positive correlations are: TDS with EC; TH and EC, TDS; Ca2+ and EC, TDS, TH; Cl– and EC, TDS, TH, Ca2+; Mg2+ and EC; Na+ and EC, TDS, TH, Ca2+, Cl–; NO3
– and Mg2+; SO42– and EC, TDS, TH, Ca2+,
Cl–, Na+. The Cluster tree shows that they could be gener-ally classified into three main groups. Group 1 comprised Na+ and SO4
2–. The relationship within this group is strong. Group 2 consists of Mg2+, NO3
–, pH, HCO3–, and Ca2+. The
fact that this group has a close relationship with group 1 de-
Figure 6: Dendrogram resulting from Ward’s method of hierarchical cluster analysis for the 12 variables.

Geologia Croatica 67/3Geologia Croatica216
monstrates that the increase in the concentration to some el-ements could be the same. Group 3 comprised TH, Cl–, Eh, EC, and TDS. Some recommendation may considered here as follows:
– A groundwater chemical analysis study should be con-ducted periodically and a solute transport model is rec-ommended to monitor future deterioration of the water quality.
– Well drilling is one of the major problems in the study area, and there should be control on this factor.
Recommend the growth of crops that have a low demand for water to the agriculture industry.
– Irrigation systems must be changed to modern irriga-tion ones.
Should some of these problematic factors have been men tioned above in the body of the report, saying why they are an issue rather than just dropping them in here at the end? No conclusion or recommendations should really contain new information that hasn’t been mentioned before e.g. what high demand crops are grown and what are the problematic irrigation systems – how and why is well drilling an issue? I am assuming you mean small wells mentioned at the be-ginning for irrigation? It is much more informative for the reader if you discuss these issues before you make recom-mendations against them.
ACKNOWLEDGMENT
This project was supported by NSTIP strategic technologies programs number (Project No. 12-WAT 2453-02) in the Kingdom of Saudi Arabia.
REFERENCES
AL-FAIFI, H.J.A. (2005): Evaluation of groundwater resources in Wajid Aquifer in WadiDawasir area southern Saudi Arabia, using compu-ter simulation.– M.Sc. Thesis, King Saud University, Riyadh.
AMERICAN PUBLIC HEALTH ASSOCIATION (APHA) (1995): Standard methods for the examination of water and wastewater, 19th edn. APHA, Washington DC, USASS.
BATAYNEH, A. & ZUMLOT, T. (2012): Multivariate statistical ap-proach to geochemical methods in water quality factor identifica-tion; application to the shallow aquifer system of the Yarmouk Ba-sin of north Jordan.– Res. J. Environ. Earth. Sci., 4/7, 756–768.
CLOUTIER, V., LEFEBVRE, R., THERRIEN, R. & SAVARD, M. (2008): Multivariate statistical analysis of geochemical data as in-dicative of the hydrogeochemical evolution of groundwater in a se-dimentary rock aquifer system.– J. Hydrol., 353, 294–313.
DABBAGH, M.E. (1981)(ed.):Environmental interpretation and tecton-ic significance of theWajid Sandstone, Saudi Arabia.– M.Sc. of Sci-ence, University of North Carolina, U.S.A., 84 p.
DABBAGH, M.E. & ROGERS, J.J.W. (1983): Depositional environ-ments and tectonic significance of the Wajid Sandstone of southern Saudi Arabia.– Journal of African Earth Sciences, 1/1, 47–57.
GULF COUNTRIES COMMITTEE STANDARDIZATION ORGAN-IZATION., (GSO) GSO5/ (2008): Unbottled drinking water.
HAKAN, ARSLAN (2013): Application of multivariate statistical tech-niques in the assessment of groundwater quality in seawater intru-sion area in Bafra Plain, Turkey.– Environ monitoring and assess-ment, 185, 2439–2452.
HELSEL, D.R. (1990): Less than obvious: statistical treatment of data below the detection limit.– Env. Sci and Tech., 24, 1766–1774.
HELSEL, D.R. & HIRSCH, R.M. (1992): Studies in Environmental Sci-ence 49. Statistical Methods in Water Resources, Elsevier, New York.
ITALCONSULT (1969): Water and Agricultural Development studies for Area IV, Eastern Province, Saudi Arabian”.– Unpublished Re-port to the Ministry of Agriculture and Water, Riyadh, Kingdom of Saudi Arabia.
KELLOGG, K.S., JANJOU, D., MINOUX, L. & FOURNIGUET, J. (1986): Explanatory notes to the Geologic Map of the Wadi Tathlith Quadrangle, sheet 20 G, Kingdom of Saudi Arabia. Ministry of Pe-troleum and Mineral Resources, Deputy Ministry for Mineral Re-sources, 27 p.
MANKU, G.S., RAJAGOPALAN, S. & LINDSAY, B.G. (1999): Ran-dom sampling techniques for space efficient online computation of order statistics of large datasets.– In: Proceedings of the ACM SIG-MOD International Conference on Management of Data, 251–262.
MOSHRIF, M.A. (1989): Fluvial environment of the southern part of Wajid Sandstone (Cambrian – Ordovician) deduced by textural analysis”.– Iraqi Journal of Science, 30/1, 47–71.
MOSHRIF, M.A. & EL-HITI, A. (1989): Lithofacies and petrography of Wajid sandstone (Cambrian-Ordovician) Saudi Arabia.– Journal of African Earth Sciences, 9/3–4, 401–412.
NEWCOMB, W.D. & RIMSTIDT, J.D. (2002): Trace element distribu-tion in US groundwaters: a probabilistic assessment using public domain data.– Appl. Geochem., 17, 49–57.
REGHUNATH, R., MURTHY, S.T.R. & RAGHAVAN, B.R. (2002): The utility of multivariate statistical techniques in hydrogeo-chemical studies: an example from Karnataka, India.– Water Research, 36, 2437–2442.
SALL, J. & LEHMAN, A.(1996): A Guide to Statistic and Data Analysis Using JMP and JMP IN Software SAS Institute Inc. Duxbury Press.
SINCLAIR, A.J. (1974): Selection of threshold values in geochemical data using probability graphs.– J. Geochem. Explor., 3/2, 129–149.
STUMP, T.E. & VAN DER EEM, J.G. (1994): The stratigraphy, deposi-tional environments and periods of deformation of the Wajid out-crop belt, southwestern Saudi Arabia”.– Journal of African Earth Sciences, 21/3, 421–441.
U.S. ENVIRONMENTAL PROTECTION AGENCY. (2002): STORET, U.S. Environmental Protection Agency. Office of Water. Available from: <http://www.epa.gov/storet/> (last accessed 08.12.04).
ZHANG, C.S., DEIRDRE, F., DAVID, M., EAMONN, G. & OWEN, T.C. (2008): Statistical analysis of geochemical variables in soils of Ireland.– Geoderma, 146, 378–390.
Manuscript received September 10, 2013 Revised manuscript accepted May 28, 2014
Available online October 31, 2014