statistical appendix - world trade organization · pdf filestatistical appendix ... united...
TRANSCRIPT

WORLD TRADE REPORT 2010
204
Statistical appendixThe definition of natural resources in sub-section 1 of Section B is sufficient for many analyses, but a more precise statistical definition is required in order to deal consistently with data on trade flows, which is surveyed in sub-section 2 of Section B. An even broader conception of natural resources is needed when examining non-traded goods. This appendix provides details on alternative definitions of natural resources, followed by summary tables of trade by individual countries, as well as maps illustrating various aspects of natural resource supplies and trade.
The United Nations System of National Accounts (SNA) proposes a classification of natural resources that includes the following components natural land, subsoil assets, non-cultivated biological resources, water resources, and other natural resources (United Nations, 2006). The comprehensiveness of this definition is appealing, but its application to international trade is problematic. Natural land, for instance, is immobile and cannot be traded. In principle, water could be traded internationally with the aid of pipelines, but in practice this never occurs. International trade in water is limited to bottled water, the total value of which represents just 0.02 per cent of world merchandise trade according to Secretariat estimates.1 Furthermore, this definition does not consider refined petroleum products to be natural resources, even though many countries import significant quantities of them. For example, although Viet Nam is an exporter of crude oil, the country imports all of its refined petroleum products.
The product classification used in the WTO’s International Trade Statistics is better suited to the analysis of natural resources trade, since it includes aggregates that cover most international trade in this class of goods (WTO, 2009). Product groups are defined in terms of revision 3 of the Standard International Trade Classification (SITC) and are divided into primary products (SITC sections 0, 1, 2, 3, 4 plus division 68) and manufactures (SITC sections 5, 6, 7, 8 minus division 68 and group 891), with remaining codes (SITC section 9 and group 891) comprising unspecified products. The category “primary products” is broader than natural resources since it includes food and other cultivated goods that would not normally be considered natural resources. However, if we exclude food products other than fish, we arrive at a usable statistical definition for which data on global trade flows are readily available. The relevant product groups are as follows:
1 Based on 2008 data from the UN Comtrade database.
1. Fish (SITC division 03)
2. Raw materials (SITC divisions 21, 23, 24, 25, 26, 29)
of which:
Raw hides, skins and furskins (21)
Crude rubber (23)
Cork and wood (24)
Wood pulp (25)
Textile fibres (26)
Crude animal and vegetable materials, not elsewhere specified (29)
3. Fuels and mining products (SITC section 3 and divisions 27, 28, 68)
of which:
Ores and other minerals (SITC divisions 27, 28)
Fuels (SITC section 3)
Non-ferrous metals (SITC division 68)
The sum of the above three product groups provides us with a basic, usable statistical definition of natural resources. Unfortunately, the category of raw materials is overly broad as it contains a number of cultivated agricultural products. However, we may still use it in cases where no further breakdown of the data is possible. This is not usually a problem, since forestry products make up the majority of raw materials trade for most countries and regions. This definition is also useful in that it covers products that may be considered natural resources in some circumstances but not in others – for example, crude rubber (which may be natural or synthetic) and furskins (either wild or farmed). It may also be seen as an upper bound definition.
Where sufficiently detailed data are available, it is preferable to use the following definition of forestry products in place of raw materials:
II – TRADE IN NATURAL RESOURCES
205
STA
TISTIC
AL A
PP
EN
DIX
4. Forestry products (SITC divisions 24 and 25)
of which:
Cork and wood (24)
Wood pulp (25)
“Natural resources narrowly defined” is equal to the sum of groups 1, 3 and 4 and is our preferred definition since the products it covers are all unambiguously natural resources. For an even broader view of resources, one might also consider adding the category “Other semi-manufactures”, which includes lightly processed manufactures made from natural resources.
5. Other semi-manufactures (SITC divisions 61, 62, 63, 64, 66, 69)
of which:
Leather, leather manufactures, not elsewhere specified (61)
Rubber manufactures, not elsewhere specified (62)
Cork and wood manufactures, excluding furniture (63)
Paper, paperboard and articles thereof (64)
Non-metallic mineral manufactures, not elsewhere specified (66)
Manufactures of metals, not elsewhere specified (69)
Two noteworthy details are 1) the fact that scrap metal is included in “Ores and other minerals”, and 2) that non-monetary gold is excluded from natural resources altogether. The inclusion of scrap metal in ores is a result of the underlying SITC classification rather than a conscious decision on the part of the WTO, but it makes sense since both ores and scrap are used as inputs in new metal production. As for non-monetary gold (SITC 97), this is recorded under “commodities not elsewhere specified” in the SITC classification but is not recorded systematically by all countries. Its inclusion in statistics on natural resources would distort aggregate figures for natural resources for certain countries.
Unless otherwise noted, this report uses the standard WTO geographical regions from International Trade Statistics 2009.

WORLD TRADE REPORT 2010
206
Appendix Table 1: World proved oil reserves by country and region, 2008 (Billion barrels and percentage)
Proved reserves(Billion barrels)
Share in world(Percentage)
World a 1,258.0 100.0
Regions
Middle East 754.1 59.9
Commonwealth of Independent States (CIS) 128.4 10.2
Africa 125.6 10.0
South and Central America 123.2 9.8
North America 70.9 5.6
Asia Pacific 42.0 3.3
Europe 13.8 1.1
Countries
Saudi Arabia 264.1 21.0
Iran 137.6 10.9
Iraq 115.0 9.1
Kuwait 101.5 8.1
Bolivarian Rep. of Venezuela 99.4 7.9
United Arab Emirates 97.8 7.8
Russian Federation 79.0 6.3
Libya 43.7 3.5
Kazakhstan 39.8 3.2
Nigeria 36.2 2.9
United States 30.5 2.4
Canada 28.6 2.3
Qatar 27.3 2.2
China 15.5 1.2
Angola 13.5 1.1
Above 15 1,129.4 89.8
Brazil 12.6 1.0
Algeria 12.2 1.0
Mexico 11.9 0.9
Norway 7.5 0.6
Azerbaijan 7.0 0.6
Sudan 6.7 0.5
India 5.8 0.5
Oman 5.6 0.4
Malaysia 5.5 0.4
Viet Nam 4.7 0.4
Egypt 4.3 0.3
Australia 4.2 0.3
Ecuador 3.8 0.3
Indonesia 3.7 0.3
United Kingdom 3.4 0.3
Gabon 3.2 0.3
Yemen 2.7 0.2
Argentina 2.6 0.2
Syria 2.5 0.2
Congo, Dem. Rep. of 1.9 0.2
Equatorial Guinea 1.7 0.1
Colombia 1.4 0.1
Peru 1.1 0.1
Brunei Darussalam 1.1 0.1
Chad 0.9 0.1
Above 40 1,247.4 99.2
Memo items:
OPEC 955.8 76.0
European Union 6.3 0.5
a Excludes Canadian oil sands.Source: BP Statistical Review of World Energy.

II – TRADE IN NATURAL RESOURCES
207
STA
TISTIC
AL A
PP
EN
DIX
Appendix Table 2: Leading exporters and importers of natural resources including intra-EU trade, 2008 (Billion dollars and percentage)
Value Share in world
Share in total merchandise
Annual percentage change
2000-08 2007 2008
Exporters
World 3,734.2 100.0 23.8 18.3 14.9 31.1
Russian Federation 341.2 9.1 72.9 23.1 16.2 34.1
Saudi Arabia 282.0 7.6 90.0 18.8 9.9 35.7
Canada 177.7 4.8 39.0 13.0 13.6 24.9
United States 142.5 3.8 11.0 17.3 17.5 42.4
Norway 130.6 3.5 77.8 14.0 8.4 23.7
Australia 114.3 3.1 61.1 19.3 13.6 54.3
United Arab Emirates 109.4 2.9 52.1 17.6 8.9 33.5
Iran 95.5 2.6 84.2 18.0 38.4 27.1
Germany 89.9 2.4 6.1 17.9 14.6 11.1
United Kingdom 83.5 2.2 18.3 12.9 12.8 24.1
Kuwait 82.9 2.2 95.2 20.9 11.5 39.7
Bolivarian Rep. of Venezuela 79.8 2.1 95.8 14.1 7.4 27.8
Algeria 78.4 2.1 98.8 17.4 10.3 31.7
Netherlands 75.8 2.0 13.9 15.6 -10.6 25.3
Nigeria 75.4 2.0 92.2 13.7 -12.5 48.2
Above 15 1,958.7 52.5 - - - -
Importers
World 3,832.6 100.0 23.8 17.8 14.0 31.2
United States 583.4 15.2 27.0 15.0 6.9 27.9
Japan 350.2 9.1 45.9 13.9 9.2 40.6
China 330.3 8.6 29.2 30.0 32.5 43.0
Germany 231.5 6.0 19.2 16.7 6.4 29.2
Korea, Rep. of 182.0 4.7 41.8 17.3 13.4 37.0
France 148.5 3.9 21.4 16.2 7.5 32.2
India 135.4 3.5 42.9 25.1 20.8 52.5
Italy 117.3 3.1 21.2 14.2 14.3 15.8
United Kingdom 111.8 2.9 17.7 18.4 12.8 24.5
Spain 106.3 2.8 26.5 18.0 14.3 25.0
Netherlands 96.4 2.5 19.5 16.8 0.4 24.0
Belgium 96.3 2.5 20.5 19.1 5.4 33.5
Singapore 95.1 2.5 29.7 22.3 16.0 60.0
Taipei, Chinese 83.1 2.2 34.5 18.6 18.1 29.3
Canada 67.3 1.8 16.5 15.2 10.1 30.1
Above 15 2,735.0 71.4 - - - -
Source: UN Comtrade database and WTO Secretariat estimates.
WORLD TRADE REPORT 2010
208
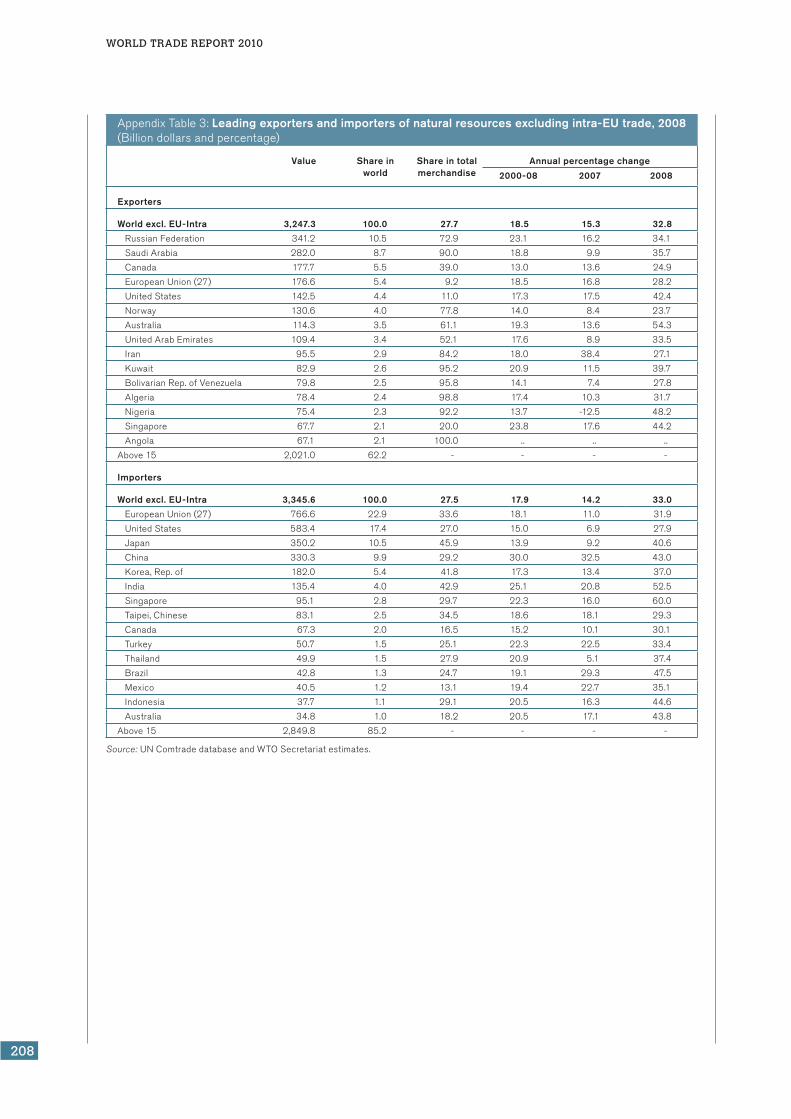
Appendix Table 3: Leading exporters and importers of natural resources excluding intra-EU trade, 2008(Billion dollars and percentage)
Value Share in world
Share in total merchandise
Annual percentage change
2000-08 2007 2008
Exporters
World excl. EU-Intra 3,247.3 100.0 27.7 18.5 15.3 32.8
Russian Federation 341.2 10.5 72.9 23.1 16.2 34.1
Saudi Arabia 282.0 8.7 90.0 18.8 9.9 35.7
Canada 177.7 5.5 39.0 13.0 13.6 24.9
European Union (27) 176.6 5.4 9.2 18.5 16.8 28.2
United States 142.5 4.4 11.0 17.3 17.5 42.4
Norway 130.6 4.0 77.8 14.0 8.4 23.7
Australia 114.3 3.5 61.1 19.3 13.6 54.3
United Arab Emirates 109.4 3.4 52.1 17.6 8.9 33.5
Iran 95.5 2.9 84.2 18.0 38.4 27.1
Kuwait 82.9 2.6 95.2 20.9 11.5 39.7
Bolivarian Rep. of Venezuela 79.8 2.5 95.8 14.1 7.4 27.8
Algeria 78.4 2.4 98.8 17.4 10.3 31.7
Nigeria 75.4 2.3 92.2 13.7 -12.5 48.2
Singapore 67.7 2.1 20.0 23.8 17.6 44.2
Angola 67.1 2.1 100.0 .. .. . .
Above 15 2,021.0 62.2 - - - -
Importers
World excl. EU-Intra 3,345.6 100.0 27.5 17.9 14.2 33.0
European Union (27) 766.6 22.9 33.6 18.1 11.0 31.9
United States 583.4 17.4 27.0 15.0 6.9 27.9
Japan 350.2 10.5 45.9 13.9 9.2 40.6
China 330.3 9.9 29.2 30.0 32.5 43.0
Korea, Rep. of 182.0 5.4 41.8 17.3 13.4 37.0
India 135.4 4.0 42.9 25.1 20.8 52.5
Singapore 95.1 2.8 29.7 22.3 16.0 60.0
Taipei, Chinese 83.1 2.5 34.5 18.6 18.1 29.3
Canada 67.3 2.0 16.5 15.2 10.1 30.1
Turkey 50.7 1.5 25.1 22.3 22.5 33.4
Thailand 49.9 1.5 27.9 20.9 5.1 37.4
Brazil 42.8 1.3 24.7 19.1 29.3 47.5
Mexico 40.5 1.2 13.1 19.4 22.7 35.1
Indonesia 37.7 1.1 29.1 20.5 16.3 44.6
Australia 34.8 1.0 18.2 20.5 17.1 43.8
Above 15 2,849.8 85.2 - - - -
Source: UN Comtrade database and WTO Secretariat estimates.

II – TRADE IN NATURAL RESOURCES
209
STA
TISTIC
AL A
PP
EN
DIX
Appendix Table 4: Leading exporters and importers of fish including intra-EU trade, 2008 (Billion dollars and percentage)
Value Share in world
Share in total merchandise
Annual percentage change
2000-08 2007 2008
Exporters
World 97.6 100.0 0.6 7.9 7.7 9.1
China 10.1 10.3 0.7 13.6 3.1 9.4
Norway 6.8 7.0 4.0 8.9 13.2 11.6
Thailand 6.5 6.6 3.7 5.1 8.1 15.5
United States 4.3 4.4 0.3 4.8 0.8 -0.3
Viet Nam 4.1 4.2 6.5 13.6 12.1 8.5
Canada 3.7 3.8 0.8 3.4 0.8 0.4
Spain 3.4 3.5 1.3 9.6 15.7 4.8
Chile 3.3 3.4 4.8 10.1 3.3 8.2
Denmark 3.3 3.4 2.9 7.4 6.6 7.7
Netherlands 2.8 2.9 0.5 9.8 13.8 5.5
Indonesia 2.5 2.5 1.8 5.7 7.3 17.4
Germany 2.1 2.1 0.1 11.3 9.3 11.0
France 1.9 2.0 0.3 8.0 16.0 4.7
Sweden 1.9 1.9 1.0 19.3 5.5 15.1
United Kingdom 1.8 1.9 0.4 7.4 15.1 -5.8
Above 15 58.5 59.9 - - - -
Importers
World 102.6 100.0 0.6 7.7 7.2 9.2
United States 14.8 14.4 0.7 4.5 2.7 3.3
Japan 14.0 13.7 1.8 -1.1 -5.6 9.9
Spain 6.4 6.2 1.6 8.3 10.1 -9.7
France 5.7 5.6 0.8 8.9 6.0 8.4
Italy 5.4 5.2 1.0 9.9 10.8 3.6
Germany 4.3 4.2 0.4 9.5 8.9 6.3
United Kingdom 4.1 4.0 0.6 9.2 13.1 1.8
China 3.7 3.6 0.3 15.0 9.8 6.7
Korea, Rep. of 3.2 3.1 0.7 11.4 10.9 7.5
Sweden 2.7 2.6 1.6 18.4 22.9 9.7
Thailand 2.4 2.3 1.3 16.0 11.2 41.6
Netherlands 2.3 2.2 0.5 10.6 15.3 16.6
Belgium 2.2 2.2 0.5 10.6 10.2 7.2
Russian Federation 2.2 2.2 0.8 39.1 40.9 18.7
Denmark 2.0 2.0 1.8 7.3 6.1 7.1
Above 15 75.4 73.5 - - - -
Source: UN Comtrade database and WTO Secretariat estimates.

WORLD TRADE REPORT 2010
210
Appendix Table 5: Leading exporters and importers of fish excluding intra-EU trade, 2008 (Billion dollars and percentage)
Value Share in world
Share in total merchandise
Annual percentage change
2000-08 2007 2008
Exporters
World excl. EU-Intra 77.2 100.0 0.7 7.4 6.5 10.9
China 10.1 13.1 0.7 13.6 3.1 9.4
Norway 6.8 8.8 4.0 8.9 13.2 11.6
Thailand 6.5 8.4 3.7 5.1 8.1 15.5
United States 4.3 5.6 0.3 4.8 0.8 -0.3
Viet Nam 4.1 5.3 6.5 13.6 12.1 8.5
European Union (27) 4.1 5.3 0.2 11.8 13.7 18.6
Canada 3.7 4.8 0.8 3.4 0.8 0.4
Chile 3.3 4.3 4.8 10.1 3.3 8.2
Indonesia 2.5 3.2 1.8 5.7 7.3 17.4
Iceland 1.7 2.3 32.5 6.1 11.0 -3.4
Ecuador 1.7 2.2 9.1 14.5 3.0 26.8
Japan 1.6 2.1 0.2 9.5 18.4 -1.5
India 1.6 2.0 0.9 1.7 3.6 -9.9
Taipei, Chinese 1.5 1.9 0.6 2.9 -0.4 24.6
Korea, Rep. of 1.3 1.7 0.3 -0.3 15.6 25.9
Above 15 54.7 70.9 - - - -
Importers
World excl. EU-Intra 82.1 100.0 0.7 7.2 5.9 10.9
European Union (27) 23.7 28.9 1.0 10.7 11.1 7.4
United States 14.8 18.0 0.7 4.5 2.7 3.3
Japan 14.0 17.1 1.8 -1.1 -5.6 9.9
China 3.7 4.5 0.3 15.0 9.8 6.7
Korea, Rep. of 3.2 3.9 0.7 11.4 10.9 7.5
Thailand 2.4 2.9 1.3 16.0 11.2 41.6
Russian Federation 2.2 2.7 0.8 39.1 40.9 18.7
Canada 1.9 2.3 0.5 4.6 10.1 0.6
Australia 1.0 1.3 0.5 9.8 12.0 7.7
Singapore 0.9 1.1 0.3 6.3 8.1 13.5
Ukraine 0.7 0.9 0.9 30.2 19.8 36.4
Brazil 0.7 0.8 0.4 10.9 26.1 21.6
Nigeria 0.6 0.8 2.3 12.5 59.0 -46.8
Switzerland 0.6 0.8 0.3 7.4 12.5 9.0
Taipei, Chinese 0.6 0.7 0.2 5.0 19.6 40.3
Above 15 71.1 86.6 - - - -
Source: UN Comtrade database and WTO Secretariat estimates.
II – TRADE IN NATURAL RESOURCES
211
STA
TISTIC
AL A
PP
EN
DIX
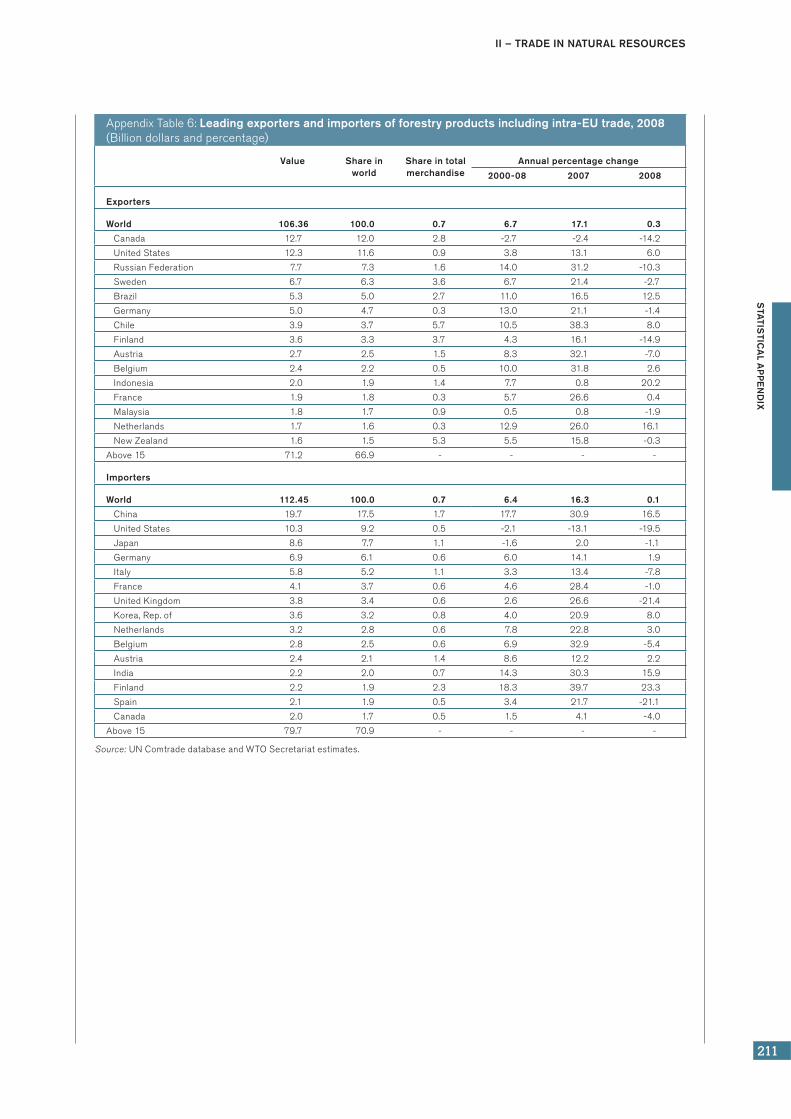
Appendix Table 6: Leading exporters and importers of forestry products including intra-EU trade, 2008(Billion dollars and percentage)
Value Share in world
Share in total merchandise
Annual percentage change
2000-08 2007 2008
Exporters
World 106.36 100.0 0.7 6.7 17.1 0.3
Canada 12.7 12.0 2.8 -2.7 -2.4 -14.2
United States 12.3 11.6 0.9 3.8 13.1 6.0
Russian Federation 7.7 7.3 1.6 14.0 31.2 -10.3
Sweden 6.7 6.3 3.6 6.7 21.4 -2.7
Brazil 5.3 5.0 2.7 11.0 16.5 12.5
Germany 5.0 4.7 0.3 13.0 21.1 -1.4
Chile 3.9 3.7 5.7 10.5 38.3 8.0
Finland 3.6 3.3 3.7 4.3 16.1 -14.9
Austria 2.7 2.5 1.5 8.3 32.1 -7.0
Belgium 2.4 2.2 0.5 10.0 31.8 2.6
Indonesia 2.0 1.9 1.4 7.7 0.8 20.2
France 1.9 1.8 0.3 5.7 26.6 0.4
Malaysia 1.8 1.7 0.9 0.5 0.8 -1.9
Netherlands 1.7 1.6 0.3 12.9 26.0 16.1
New Zealand 1.6 1.5 5.3 5.5 15.8 -0.3
Above 15 71.2 66.9 - - - -
Importers
World 112.45 100.0 0.7 6.4 16.3 0.1
China 19.7 17.5 1.7 17.7 30.9 16.5
United States 10.3 9.2 0.5 -2.1 -13.1 -19.5
Japan 8.6 7.7 1.1 -1.6 2.0 -1.1
Germany 6.9 6.1 0.6 6.0 14.1 1.9
Italy 5.8 5.2 1.1 3.3 13.4 -7.8
France 4.1 3.7 0.6 4.6 28.4 -1.0
United Kingdom 3.8 3.4 0.6 2.6 26.6 -21.4
Korea, Rep. of 3.6 3.2 0.8 4.0 20.9 8.0
Netherlands 3.2 2.8 0.6 7.8 22.8 3.0
Belgium 2.8 2.5 0.6 6.9 32.9 -5.4
Austria 2.4 2.1 1.4 8.6 12.2 2.2
India 2.2 2.0 0.7 14.3 30.3 15.9
Finland 2.2 1.9 2.3 18.3 39.7 23.3
Spain 2.1 1.9 0.5 3.4 21.7 -21.1
Canada 2.0 1.7 0.5 1.5 4.1 -4.0
Above 15 79.7 70.9 - - - -
Source: UN Comtrade database and WTO Secretariat estimates.

WORLD TRADE REPORT 2010
212
Appendix Table 7: Leading exporters and importers of forestry products excluding intra-EU trade, 2008(Billion dollars and percentage)
Value Share in world
Share in total merchandise
Annual percentage change
2000-08 2007 2008
Exporters
World excl. EU-Intra 76.0 100.0 0.6 6.2 14.4 0.8
Canada 12.7 16.7 2.8 -2.7 -2.4 -14.2
United States 12.3 16.2 0.9 3.8 13.1 6.0
European Union (27) 9.1 12.0 0.5 10.9 20.5 4.5
Russian Federation 7.7 10.2 1.6 14.0 31.2 -10.3
Brazil 5.3 7.0 2.7 11.0 16.5 12.5
Chile 3.9 5.2 5.7 10.5 38.3 8.0
Indonesia 2.0 2.6 1.4 7.7 0.8 20.2
Malaysia 1.8 2.4 0.9 0.5 0.8 -1.9
New Zealand 1.6 2.1 5.3 5.5 15.8 -0.3
Australia 1.4 1.9 0.8 12.9 25.0 14.7
China 1.3 1.8 0.1 14.0 6.8 0.2
South Africa 0.9 1.2 1.3 3.5 5.7 13.6
Japan 0.9 1.2 0.1 26.1 28.8 15.1
Norway 0.6 0.7 0.3 7.5 14.9 14.4
Thailand 0.6 0.7 0.3 6.6 17.3 -3.2
Above 15 62.1 81.7 - - - -
Importers
World excl. EU-Intra 82.1 100.0 0.7 5.9 13.5 0.5
China 19.7 24.0 1.7 17.7 30.9 16.5
European Union (27) 16.0 19.5 0.7 4.2 19.3 -4.9
United States 10.3 12.6 0.5 -2.1 -13.1 -19.5
Japan 8.6 10.5 1.1 -1.6 2.0 -1.1
Korea, Rep. of 3.6 4.4 0.8 4.0 20.9 8.0
India 2.2 2.7 0.7 14.3 30.3 15.9
Canada 2.0 2.4 0.5 1.5 4.1 -4.0
Mexico 1.7 2.1 0.6 7.8 11.5 3.9
Taipei, Chinese 1.7 2.0 0.7 1.8 15.4 4.0
Indonesia 1.6 2.0 1.3 4.3 18.3 41.6
Thailand 1.2 1.4 0.6 4.8 7.9 14.6
Turkey 1.0 1.2 0.5 11.8 15.8 7.4
Egypt 1.0 1.2 2.1 8.2 30.6 27.9
Norway 0.9 1.0 1.0 5.7 40.9 -10.9
Switzerland 0.9 1.0 0.5 5.4 17.7 9.6
Above 15 72.4 88.1 - - - -
Source: UN Comtrade database and WTO Secretariat estimates.

II – TRADE IN NATURAL RESOURCES
213
STA
TISTIC
AL A
PP
EN
DIX
Appendix Table 8: Leading exporters and importers of fuels including intra-EU trade, 2008(Billion dollars and percentage)
Value Share in world
Share in total merchandise
Annual percentage change
2000-08 2007 2008
Exporters
World 2,861.89 100.0 18.2 20.0 13.4 41.0
Russian Federation 307.4 10.7 65.7 24.8 14.2 42.0
Saudi Arabia 281.0 9.8 89.7 18.8 9.9 35.8
Canada 125.9 4.4 27.6 16.8 13.0 43.9
Norway 113.7 4.0 67.7 14.6 5.8 29.7
United Arab Emirates 103.3 3.6 49.2 17.3 7.0 33.0
Iran 93.0 3.2 82.0 17.7 38.4 27.6
Kuwait 82.8 2.9 95.0 20.9 11.4 39.8
Bolivarian Rep. of Venezuela 78.2 2.7 93.8 14.4 4.9 31.1
Algeria 77.8 2.7 98.1 17.4 10.5 31.5
United States 76.5 2.7 5.9 24.4 20.3 82.4
Nigeria 75.1 2.6 91.7 13.6 -13.1 48.5
Angola 66.4 2.3 98.9 .. .. . .
Singapore 62.5 2.2 18.5 25.5 15.9 51.2
United Kingdom 60.3 2.1 13.2 12.2 7.2 31.1
Australia 59.6 2.1 31.9 20.6 6.8 88.3
Above 15 1,663.3 58.1 - - - -
Importers
World 2,921.96 100.0 18.1 19.5 12.2 41.3
United States 501.9 17.2 23.2 17.3 7.9 34.8
Japan 267.8 9.2 35.1 16.8 6.9 55.0
China 168.8 5.8 14.9 30.0 17.9 60.8
Germany 163.7 5.6 13.6 18.1 0.3 46.6
Korea, Rep. of 142.5 4.9 32.7 17.9 11.3 47.7
France 117.4 4.0 16.9 18.6 4.6 43.5
India 115.8 4.0 36.7 25.1 19.2 58.2
Singapore 87.3 3.0 27.3 23.4 17.5 66.0
United Kingdom 81.7 2.8 12.9 23.9 8.8 38.5
Spain 81.4 2.8 20.3 20.3 12.7 39.3
Italy 78.8 2.7 14.2 16.6 12.7 30.0
Netherlands 77.1 2.6 15.6 18.4 -2.6 34.4
Belgium 72.7 2.5 15.5 21.8 -0.8 53.6
Taipei, Chinese 61.9 2.1 25.7 21.5 18.8 42.2
Canada 50.6 1.7 12.4 19.1 10.7 43.0
Above 15 2,069.5 70.8 - - - -
Source: UN Comtrade Database and WTO Secretariat estimates.

WORLD TRADE REPORT 2010
214
Appendix Table 9: Leading exporters and importers of fuels excluding intra-EU trade, 2008(Billion dollars and percentage)
Value Share in world
Share in total merchandise
Annual percentage change
2000-08 2007 2008
Exporters
World excl. EU-Intra 2,565.6 100.0 21.8 20.0 14.2 40.9
Russian Federation 307.4 12.0 65.7 24.8 14.2 42.0
Saudi Arabia 281.0 11.0 89.7 18.8 9.9 35.8
Canada 125.9 4.9 27.6 16.8 13.0 43.9
European Union (27) 114.0 4.4 5.9 20.3 13.8 39.4
Norway 113.7 4.4 67.7 14.6 5.8 29.7
United Arab Emirates 103.3 4.0 49.2 17.3 7.0 33.0
Iran 93.0 3.6 82.0 17.7 38.4 27.6
Kuwait 82.8 3.2 95.0 20.9 11.4 39.8
Bolivarian Rep. of Venezuela 78.2 3.0 93.8 14.4 4.9 31.1
Algeria 77.8 3.0 98.1 17.4 10.5 31.5
United States 76.5 3.0 5.9 24.4 20.3 82.4
Nigeria 75.1 2.9 91.7 13.6 -13.1 48.5
Angola 66.4 2.6 98.9 .. .. . .
Singapore 62.5 2.4 18.5 25.5 15.9 51.2
Australia 59.6 2.3 31.9 20.6 6.8 88.3
Above 15 1,717.0 66.9 - - - -
Importers
World excl. EU-Intra 2,625.6 100.0 21.6 19.4 12.9 41.2
European Union (27) 619.0 23.6 27.1 20.1 8.2 42.4
United States 501.9 19.1 23.2 17.3 7.9 34.8
Japan 267.8 10.2 35.1 16.8 6.9 55.0
China 168.8 6.4 14.9 30.0 17.9 60.8
Korea, Rep. of 142.5 5.4 32.7 17.9 11.3 47.7
India 115.8 4.4 36.7 25.1 19.2 58.2
Singapore 87.3 3.3 27.3 23.4 17.5 66.0
Taipei, Chinese 61.9 2.4 25.7 21.5 18.8 42.2
Canada 50.6 1.9 12.4 19.1 10.7 43.0
Thailand 37.2 1.4 20.8 22.1 1.1 43.7
Brazil 34.3 1.3 19.8 19.4 30.2 53.6
Turkey 32.8 1.2 16.2 20.2 17.4 37.4
Indonesia 30.7 1.2 23.7 22.4 15.6 39.4
Australia 30.0 1.1 15.7 22.6 15.2 48.8
Mexico 29.2 1.1 9.5 23.8 34.1 50.4
Above 15 2,209.7 84.2 - - - -
Source: UN Comtrade database and WTO Secretariat estimates.

II – TRADE IN NATURAL RESOURCES
215
STA
TISTIC
AL A
PP
EN
DIX
Appendix Table 10: Leading exporters and importers of mining products including intra-EU trade, 2008(Billion dollars and percentage)
Value Share in world
Share in total merchandise
Annual percentage change
2000-08 2007 2008
Exporters
World 668.3 100.0 4.3 16.9 20.9 7.2
Australia 52.4 7.8 28.0 19.0 19.6 29.9
United States 49.4 7.4 3.8 16.6 18.0 17.0
Germany 45.3 6.8 3.1 16.3 20.0 3.8
Chile 41.5 6.2 60.1 22.7 19.5 -2.5
Canada 35.4 5.3 7.8 14.5 25.4 -2.3
Russian Federation 25.5 3.8 5.5 13.3 28.9 -10.9
Brazil 25.3 3.8 12.8 20.8 19.0 34.1
China 23.5 3.5 1.6 22.7 5.3 7.1
South Africa 21.5 3.2 29.0 29.0 25.4 14.4
United Kingdom 20.2 3.0 4.4 15.3 28.8 11.0
Japan 18.9 2.8 2.4 15.6 19.8 9.1
Belgium 15.9 2.4 3.3 15.0 21.0 0.6
France 15.5 2.3 2.6 13.4 15.2 -0.4
Peru 13.4 2.0 43.0 25.0 21.0 -1.8
Netherlands 12.8 1.9 2.3 15.7 0.7 -8.1
Above 15 416.6 62.3 - - - -
Imports
World 695.5 100.0 4.3 16.5 20.5 7.7
China 138.1 19.9 12.2 34.0 52.6 30.7
Japan 59.8 8.6 7.8 14.0 23.6 9.0
Germany 56.6 8.1 4.7 15.7 19.5 -0.1
United States 56.4 8.1 2.6 9.2 7.1 -0.8
Korea, Rep. of 32.7 4.7 7.5 17.8 20.2 8.8
Italy 27.3 3.9 4.9 12.8 18.7 -6.3
United Kingdom 22.2 3.2 3.5 11.7 21.8 1.2
France 21.2 3.0 3.0 11.5 16.4 0.7
Taipei, Chinese 18.9 2.7 7.9 14.7 16.7 1.4
Belgium 18.5 2.7 3.9 14.8 18.8 -6.3
India 17.3 2.5 5.5 27.9 28.7 26.7
Turkey 16.7 2.4 8.3 29.3 33.9 28.2
Spain 16.4 2.4 4.1 16.6 20.7 -2.8
Netherlands 13.8 2.0 2.8 13.3 7.3 -9.9
Canada 12.9 1.9 3.2 9.8 9.5 3.7
Above 15 528.9 76.0 - - - -
Source: UN Comtrade database and WTO Secretariat estimates.
WORLD TRADE REPORT 2010
216
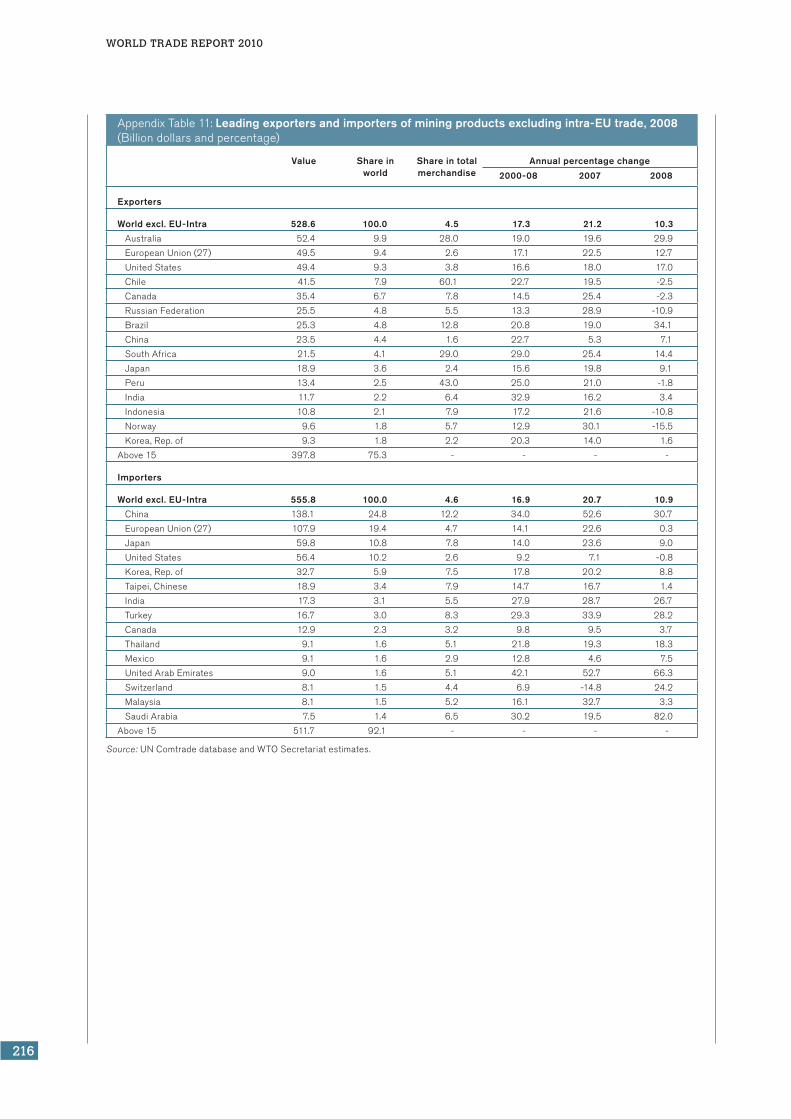
Appendix Table 11: Leading exporters and importers of mining products excluding intra-EU trade, 2008(Billion dollars and percentage)
Value Share in world
Share in total merchandise
Annual percentage change
2000-08 2007 2008
Exporters
World excl. EU-Intra 528.6 100.0 4.5 17.3 21.2 10.3
Australia 52.4 9.9 28.0 19.0 19.6 29.9
European Union (27) 49.5 9.4 2.6 17.1 22.5 12.7
United States 49.4 9.3 3.8 16.6 18.0 17.0
Chile 41.5 7.9 60.1 22.7 19.5 -2.5
Canada 35.4 6.7 7.8 14.5 25.4 -2.3
Russian Federation 25.5 4.8 5.5 13.3 28.9 -10.9
Brazil 25.3 4.8 12.8 20.8 19.0 34.1
China 23.5 4.4 1.6 22.7 5.3 7.1
South Africa 21.5 4.1 29.0 29.0 25.4 14.4
Japan 18.9 3.6 2.4 15.6 19.8 9.1
Peru 13.4 2.5 43.0 25.0 21.0 -1.8
India 11.7 2.2 6.4 32.9 16.2 3.4
Indonesia 10.8 2.1 7.9 17.2 21.6 -10.8
Norway 9.6 1.8 5.7 12.9 30.1 -15.5
Korea, Rep. of 9.3 1.8 2.2 20.3 14.0 1.6
Above 15 397.8 75.3 - - - -
Importers
World excl. EU-Intra 555.8 100.0 4.6 16.9 20.7 10.9
China 138.1 24.8 12.2 34.0 52.6 30.7
European Union (27) 107.9 19.4 4.7 14.1 22.6 0.3
Japan 59.8 10.8 7.8 14.0 23.6 9.0
United States 56.4 10.2 2.6 9.2 7.1 -0.8
Korea, Rep. of 32.7 5.9 7.5 17.8 20.2 8.8
Taipei, Chinese 18.9 3.4 7.9 14.7 16.7 1.4
India 17.3 3.1 5.5 27.9 28.7 26.7
Turkey 16.7 3.0 8.3 29.3 33.9 28.2
Canada 12.9 2.3 3.2 9.8 9.5 3.7
Thailand 9.1 1.6 5.1 21.8 19.3 18.3
Mexico 9.1 1.6 2.9 12.8 4.6 7.5
United Arab Emirates 9.0 1.6 5.1 42.1 52.7 66.3
Switzerland 8.1 1.5 4.4 6.9 -14.8 24.2
Malaysia 8.1 1.5 5.2 16.1 32.7 3.3
Saudi Arabia 7.5 1.4 6.5 30.2 19.5 82.0
Above 15 511.7 92.1 - - - -
Source: UN Comtrade database and WTO Secretariat estimates.

II – TRADE IN NATURAL RESOURCES
217
STA
TISTIC
AL A
PP
EN
DIX
Appendix Table 12: Imports of natural resources by partner region and supplier for major economies, 2008(Billion dollars and percentage)
European Union (27) United States
Value Share Annual percentage change
Value Share Annual percentage change
2008 2008 2000-08 2008 2008 2008 2000-08 2008
World 1,093.04 100.00 16 16 World 583.43 100.00 15 28
Europe 510.90 46.74 15 15 North America 188.99 32.39 14 26
CIS 224.39 20.53 21 25 Africa 104.58 17.92 20 23
Africa 119.13 10.90 14 13 South and Central America 102.59 17.58 14 26
Middle East 65.73 6.01 10 6 Middle East 88.16 15.11 17 62
South and Central America 44.79 4.10 17 -1 Europe 45.40 7.78 11 13
North America 37.99 3.48 12 15 CIS 28.25 4.84 23 44
Asia 37.36 3.42 18 11 Asia 25.47 4.37 9 -1
Suppliers Suppliers
European Union (27) 399.48 36.55 16 12 Canada 141.99 24.34 13 29
Russian Federation 174.22 15.94 20 23 Saudi Arabia 56.28 9.65 19 54
Norway 92.83 8.49 14 30 Bolivarian Rep. of Venezuela 50.89 8.72 14 29
Libya 42.02 3.84 18 24 Mexico 46.99 8.05 15 20
United States 26.02 2.38 15 37 European Union (27) 40.27 6.90 14 16
Above 5 734.57 67.20 - - Above 5 336.42 57.66 - -
Kazakhstan 23.38 2.14 29 37 Nigeria 38.99 6.68 17 16
Saudi Arabia 21.47 1.96 8 7 Iraq 22.71 3.89 17 100
Algeria 20.66 1.89 8 -2 Russian Federation 21.40 3.67 19 37
Brazil 15.91 1.46 19 16 Algeria 19.98 3.42 27 9
Nigeria 14.71 1.35 13 23 Angola 19.46 3.34 23 51
Azerbaijan 14.50 1.33 42 46 Brazil 11.95 2.05 21 56
Iran 13.19 1.21 9 -13 Colombia 8.91 1.53 9 58
Iraq 11.15 1.02 9 23 Ecuador 8.30 1.42 22 54
South Africa 10.78 0.99 14 5 China 7.52 1.29 17 33
Canada 10.54 0.96 9 12 Kuwait 6.96 1.19 11 71
Chile 9.84 0.90 14 -25 Congo 5.18 0.89 33 63
Angola 8.82 0.81 36 108 Chile 4.97 0.85 14 -17
Australia 8.60 0.79 13 -2 Trinidad and Tobago 4.96 0.85 16 -18
China 8.08 0.74 21 9 Azerbaijan 4.46 0.76 128 132
Switzerland 7.74 0.71 14 9 Norway 4.43 0.76 -0 -7
Kuwait 7.07 0.65 13 30 Libya 4.16 0.71 .. 23
Bolivarian Rep. of Venezuela 6.31 0.58 15 5 South Africa 3.84 0.66 7 -23
Ukraine 5.88 0.54 17 39 Peru 3.66 0.63 16 19
Egypt 5.03 0.46 14 -3 Chad 3.45 0.59 .. 55
Syria 4.62 0.42 6 12 Equatorial Guinea 3.27 0.56 46 102
India 4.52 0.41 29 16 Aruba 3.24 0.56 10 6
Colombia 3.98 0.36 21 41 Australia 2.85 0.49 5 59
Belarus 3.70 0.34 33 -3 Thailand 2.74 0.47 4 15
Turkey 3.48 0.32 19 -1 Argentina 2.68 0.46 9 15
United Arab Emirates 3.06 0.28 20 -15 Korea, Rep. of 2.60 0.45 13 -42
Above 30 981.62 89.81 - - Above 30 559.08 95.83 - -
Source: UN Comtrade database.

WORLD TRADE REPORT 2010
218
Appendix Table 12: Imports of natural resources by partner region and supplier for major economies, 2008 (Billion dollars and percentage) continued
Japan China
Value Share Annual percentage change
Value Share Annual percentage change
2008 2008 2000-08 2008 2008 2008 2000-08 2008
World 350.20 100.00 14 41 World 331.27 100.00 30 43
Middle East 165.57 47.28 17 48 Asia 109.33 33.00 27 38
Asia 115.05 32.85 12 40 Middle East 72.14 21.78 30 75
Africa 18.14 5.18 22 47 Africa 50.59 15.27 35 57
South and Central America 15.98 4.56 15 11 South and Central America 42.52 12.84 45 39
North America 15.68 4.48 4 26 CIS 27.52 8.31 29 23
CIS 12.75 3.64 14 23 North America 15.92 4.81 24 15
Europe 6.99 2.00 8 24 Europe 13.24 4.00 24 17
Suppliers Suppliers
Saudi Arabia 50.49 14.42 17 45 Australia 32.88 9.93 39 53
United Arab Emirates 46.99 13.42 16 46 Saudi Arabia 27.26 8.23 43 96
Australia 41.83 11.95 19 60 Angola 22.36 6.75 37 74
Qatar 26.53 7.58 21 57 Russian Federation 19.60 5.92 27 21
Indonesia 24.59 7.02 10 26 Brazil 18.64 5.63 51 61
Above 5 190.43 54.38 - - Above 5 120.75 36.45 - -
Iran 18.09 5.17 17 45 Iran 18.45 5.57 35 44
Kuwait 15.30 4.37 15 54 India 15.54 4.69 49 54
Russian Federation 12.61 3.60 14 26 Korea, Rep. of 13.68 4.13 22 33
Malaysia 11.38 3.25 13 58 Japan 12.99 3.92 30 40
China 10.19 2.91 7 20 Oman 11.49 3.47 17 72
United States 8.28 2.36 3 30 European Union (27) 10.97 3.31 24 16
Chile 7.12 2.03 14 -3 Chile 10.45 3.15 30 7
South Africa 6.98 1.99 15 18 United States 9.20 2.78 22 13
Canada 6.49 1.85 5 23 Taipei, Chinese 6.75 2.04 23 33
Korea, Rep. of 5.87 1.68 3 21 Kazakhstan 6.75 2.04 36 24
Oman 5.57 1.59 13 56 Indonesia 6.75 2.04 16 17
Brazil 5.56 1.59 17 58 Bolivarian Rep. of Venezuela 6.41 1.93 73 117
European Union (27) 4.83 1.38 9 21 Sudan 6.31 1.90 31 52
Brunei Darussalam 4.54 1.30 13 81 Canada 5.72 1.73 26 12
Sudan 4.23 1.21 41 58 South Africa 5.48 1.66 41 40
Viet Nam 3.85 1.10 16 88 Kuwait 4.84 1.46 51 130
Thailand 2.81 0.80 9 32 Singapore 4.53 1.37 22 129
India 2.53 0.72 9 24 United Arab Emirates 4.34 1.31 34 55
Peru 1.88 0.54 29 -5 Congo 3.73 1.13 36 32
Nigeria 1.69 0.48 31 166 Peru 3.55 1.07 52 -5
Singapore 1.67 0.48 12 22 Yemen 3.19 0.96 20 84
Egypt 1.56 0.44 36 94 Malaysia 2.81 0.85 15 15
Iraq 1.51 0.43 11 48 Thailand 2.65 0.80 21 27
Taipei, Chinese 1.46 0.42 3 8 Libya 2.59 0.78 79 67
Norway 1.38 0.39 6 33 Viet Nam 2.28 0.69 15 32
Above 30 337.79 96.46 - - Above 30 302.18 91.22 - -
Source: UN Comtrade database.

II – TRADE IN NATURAL RESOURCES
219
STA
TISTIC
AL A
PP
EN
DIX
App
endi
x M
ap 1
: Net
exp
ort
ers
of
fish
and
fish
pro
duct
s, 2
00
8 o
r la
test
yea
r
Fish
Net
impo
rter
Net
exp
orte
r
No
data
ava
ilabl
e
Not
e: C
olou
rs a
nd b
ound
arie
s do
not
impl
y an
y ju
dgem
ent o
n th
e pa
rt o
f th
e W
TO a
s to
the
lega
l sta
tus
of a
ny f
ront
ier
or t
erri
tory
.
Sou
rce:
UN
Com
trad
e da
taba
se.

WORLD TRADE REPORT 2010
220
App
endi
x M
ap 2
: Net
exp
ort
ers
of
fore
stry
pro
duct
s, 2
00
8 o
r la
test
yea
r
Fore
stry
Net
impo
rter
Net
exp
orte
r
No
data
ava
ilabl
e
Not
e: C
olou
rs a
nd b
ound
arie
s do
not
impl
y an
y ju
dgem
ent o
n th
e pa
rt o
f th
e W
TO a
s to
the
lega
l sta
tus
of a
ny f
ront
ier
or t
erri
tory
.
Sou
rce:
UN
Com
trad
e da
taba
se.

II – TRADE IN NATURAL RESOURCES
221
STA
TISTIC
AL A
PP
EN
DIX
App
endi
x M
ap 3
: Net
exp
ort
ers
of
fuel
s, 2
00
8 o
r la
test
yea
r
Fuel
s
Net
impo
rter
Net
exp
orte
r
No
data
ava
ilabl
e
Not
e: C
olou
rs a
nd b
ound
arie
s do
not
impl
y an
y ju
dgem
ent o
n th
e pa
rt o
f th
e W
TO a
s to
the
lega
l sta
tus
of a
ny f
ront
ier
or t
erri
tory
.
Sou
rce:
UN
Com
trad
e da
taba
se.

WORLD TRADE REPORT 2010
222
App
endi
x M
ap 4
: Net
exp
ort
ers
of
non-
ferr
ous
met
als,
20
08
or
late
st y
ear
Non
-fer
rous
met
als
Net
impo
rter
Net
exp
orte
r
No
data
ava
ilabl
e
Not
e: C
olou
rs a
nd b
ound
arie
s do
not
impl
y an
y ju
dgem
ent o
n th
e pa
rt o
f th
e W
TO a
s to
the
lega
l sta
tus
of a
ny f
ront
ier
or t
erri
tory
.
Sou
rce:
UN
Com
trad
e da
taba
se.
II – TRADE IN NATURAL RESOURCES
223
STA
TISTIC
AL A
PP
EN
DIX
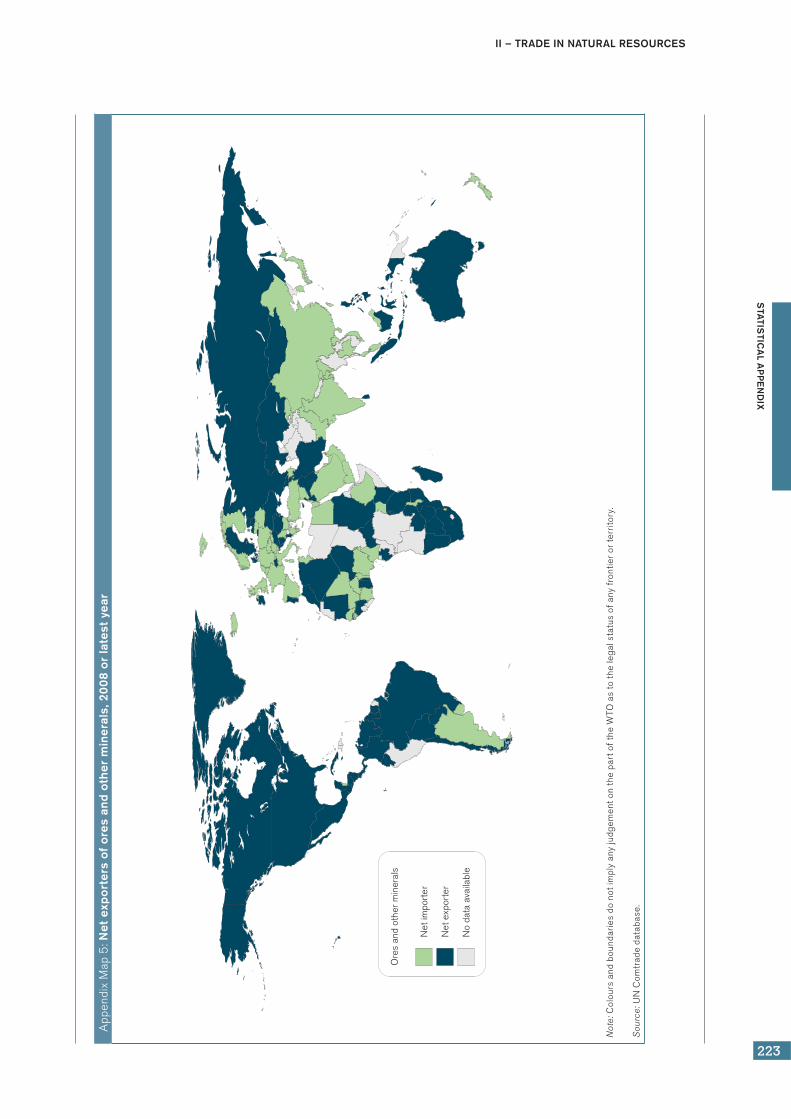
App
endi
x M
ap 5
: Net
exp
ort
ers
of
ore
s an
d o
ther
min
eral
s, 2
00
8 o
r la
test
yea
r
Ore
s an
d ot
her m
iner
als
Net
impo
rter
Net
exp
orte
r
No
data
ava
ilabl
e
Not
e: C
olou
rs a
nd b
ound
arie
s do
not
impl
y an
y ju
dgem
ent o
n th
e pa
rt o
f th
e W
TO a
s to
the
lega
l sta
tus
of a
ny f
ront
ier
or t
erri
tory
.
Sou
rce:
UN
Com
trad
e da
taba
se.

WORLD TRADE REPORT 2010
224
App
endi
x M
ap 6
: To
tal r
enew
able
fre
sh w
ater
res
our
ces
per
cap
ita,
20
08
(m3 p
er in
habi
tant
per
yea
r)
Gre
ater
than
10
,00
0
3,0
00
to 1
0,0
00
1,0
00
to 3
,00
0
Less
than
1,0
00
No
data
ava
ilabl
e
Not
e: C
olou
rs a
nd b
ound
arie
s do
not
impl
y an
y ju
dgem
ent o
n th
e pa
rt o
f th
e W
TO a
s to
the
lega
l sta
tus
of a
ny f
ront
ier
or t
erri
tory
.
Sou
rce:
UN
Foo
d an
d A
gric
ultu
re O
rgan
izat
ion
(FA
O),
Aqu
asta
t dat
abas
e.
II – TRADE IN NATURAL RESOURCES
225
STA
TISTIC
AL A
PP
EN
DIX
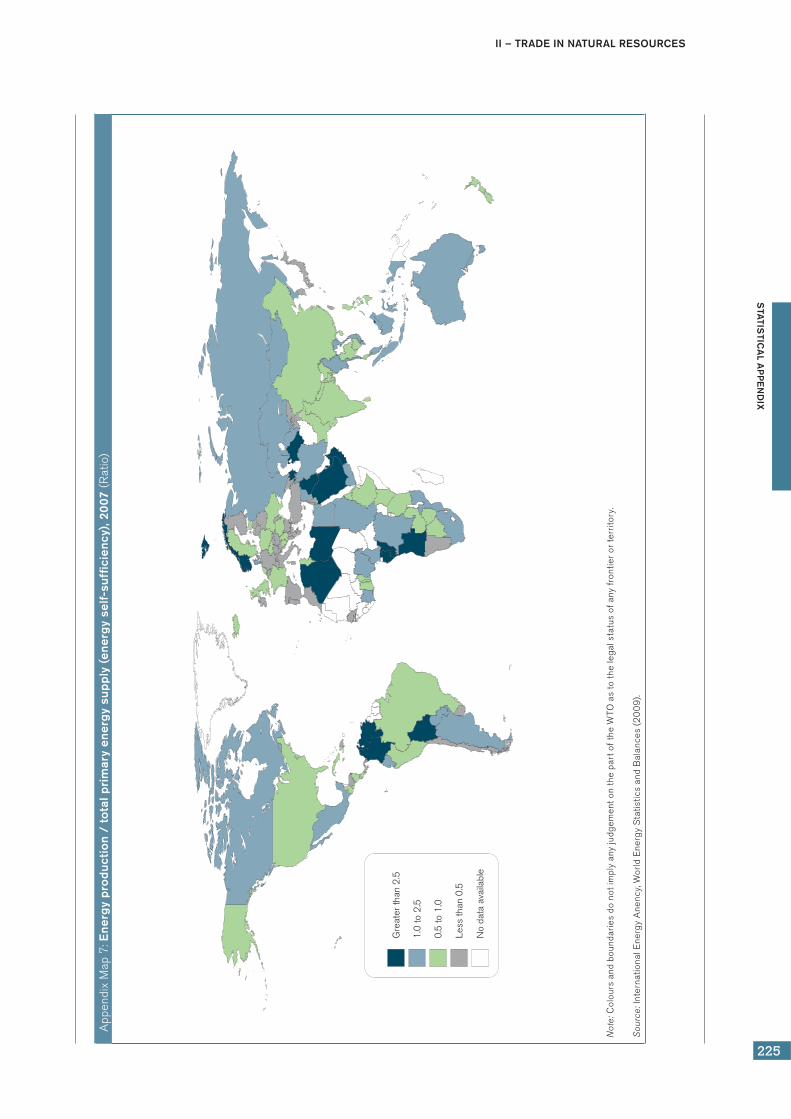
App
endi
x M
ap 7
: Ene
rgy
pro
duct
ion
/ to
tal p
rim
ary
ener
gy
sup
ply
(en
erg
y se
lf-su
ffici
ency
), 20
07 (
Rat
io)
Gre
ater
than
2.5
1.0
to 2
.5
0.5
to 1
.0
Less
than
0.5
No
data
ava
ilabl
e
Not
e: C
olou
rs a
nd b
ound
arie
s do
not
impl
y an
y ju
dgem
ent o
n th
e pa
rt o
f th
e W
TO a
s to
the
lega
l sta
tus
of a
ny f
ront
ier
or t
erri
tory
.
Sou
rce:
Inte
rnat
iona
l Ene
rgy
Ane
ncy,
Wor
ld E
nerg
y S
tatis
tics
and
Bal
ance
s (2
00
9).

WORLD TRADE REPORT 2010
226
App
endi
x M
ap 8
: Oil
pro
duct
ion
/ to
tal p
rim
ary
ener
gy
sup
ply
of
oil
(oil
self-
suffi
cien
cy),
2007
(R
atio
)
Gre
ater
than
2
1.0
to 2
.0
0.2
5 to
1.0
0 to
0.2
5
No
data
ava
ilabl
e
Not
e: C
olou
rs a
nd b
ound
arie
s do
not
impl
y an
y ju
dgem
ent o
n th
e pa
rt o
f th
e W
TO a
s to
the
lega
l sta
tus
of a
ny f
ront
ier
or t
erri
tory
.
Sou
rce:
Inte
rnat
iona
l Ene
rgy
Ane
ncy,
Wor
ld E
nerg
y S
tatis
tics
and
Bal
ance
s (2
00
9).
II – TRADE IN NATURAL RESOURCES
227
STA
TISTIC
AL A
PP
EN
DIX
App
endi
x M
ap 9
: To
tal p
rim
ary
ener
gy
sup
ply
/ G
DP
(en
erg
y in
tens
ity
of
GD
P),
2007
(toe
per
tho
usan
d 2
00
0 U
S d
olla
rs)
Gre
ater
than
1
0.5
to 1
.0
0.3
to 0
.5
Less
than
0.3
No
data
ava
ilabl
e
Not
e: C
olou
rs a
nd b
ound
arie
s do
not
impl
y an
y ju
dgem
ent o
n th
e pa
rt o
f th
e W
TO a
s to
the
lega
l sta
tus
of a
ny f
ront
ier
or t
erri
tory
.
Sou
rce:
Inte
rnat
iona
l Ene
rgy
Ane
ncy,
Wor
ld E
nerg
y S
tatis
tics
and
Bal
ance
s (2
00
9).
WORLD TRADE REPORT 2010
228
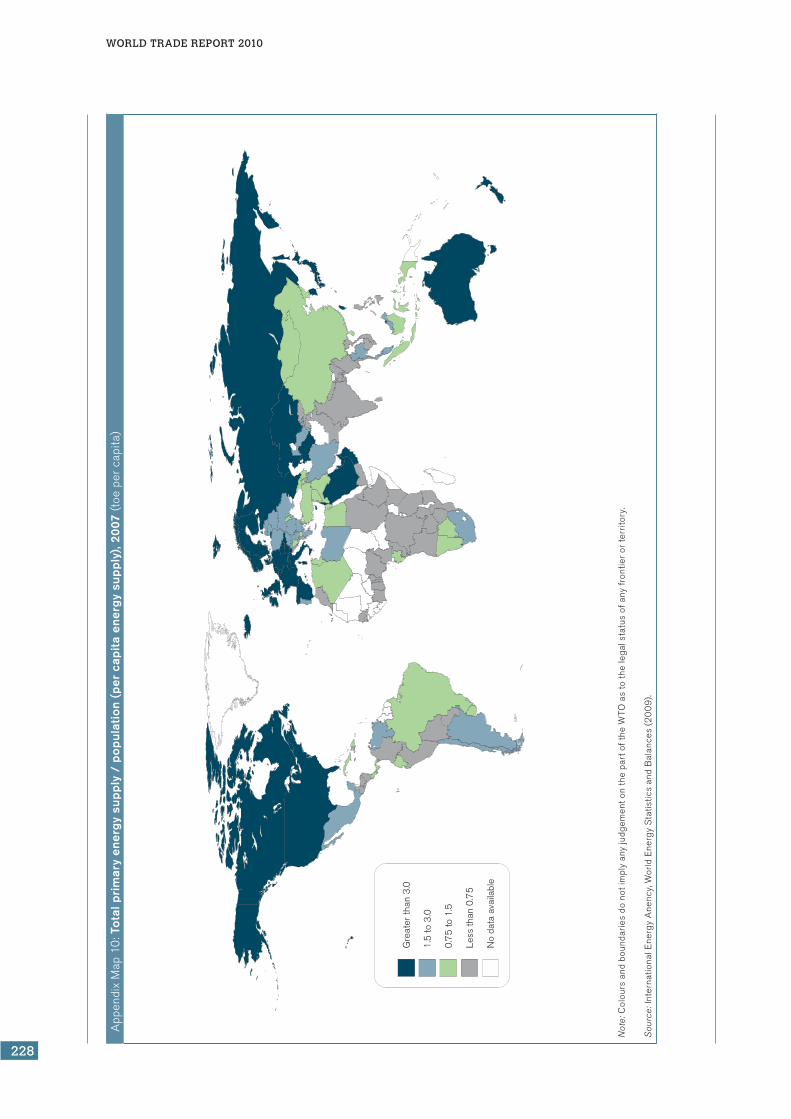
App
endi
x M
ap 1
0: T
ota
l pri
mar
y en
erg
y su
pp
ly /
po
pul
atio
n (p
er c
apit
a en
erg
y su
pp
ly),
2007
(toe
per
cap
ita)
Gre
ater
than
3.0
1.5
to 3
.0
0.7
5 to
1.5
Less
than
0.7
5
No
data
ava
ilabl
e
Not
e: C
olou
rs a
nd b
ound
arie
s do
not
impl
y an
y ju
dgem
ent o
n th
e pa
rt o
f th
e W
TO a
s to
the
lega
l sta
tus
of a
ny f
ront
ier
or t
erri
tory
.
Sou
rce:
Inte
rnat
iona
l Ene
rgy
Ane
ncy,
Wor
ld E
nerg
y S
tatis
tics
and
Bal
ance
s (2
00
9).