statistical analysis. statistics u description –describes the data –mean –median –mode u...
TRANSCRIPT

Statistical Analysis
Statistics
Description– Describes the data– Mean– Median– Mode
Inferential– Allows prediction from the sample to the
population in general
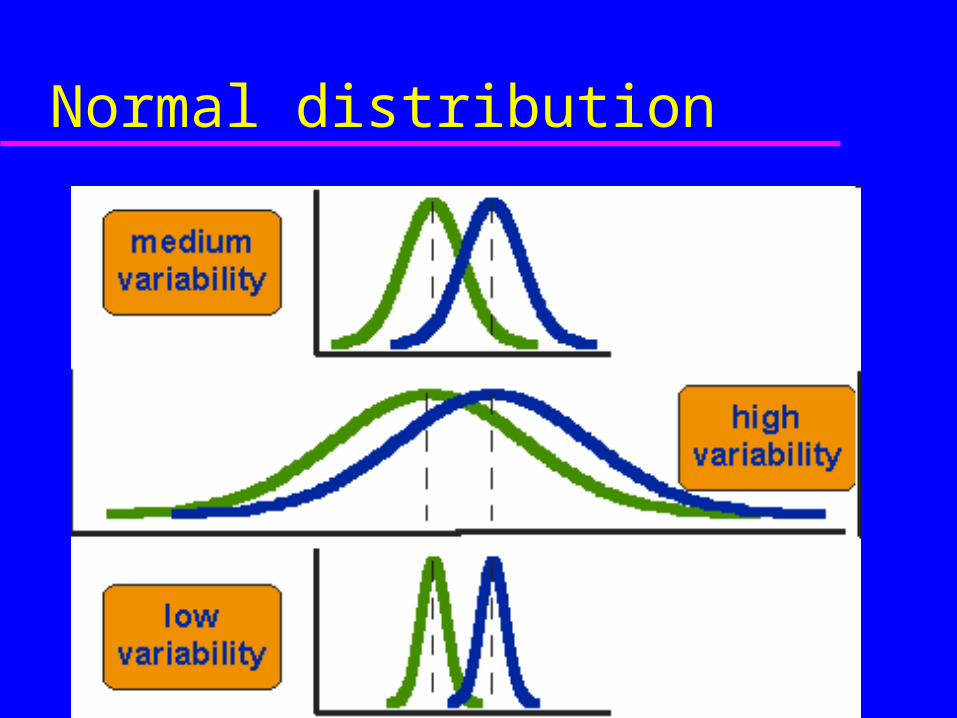
Normal distribution
Standard deviation
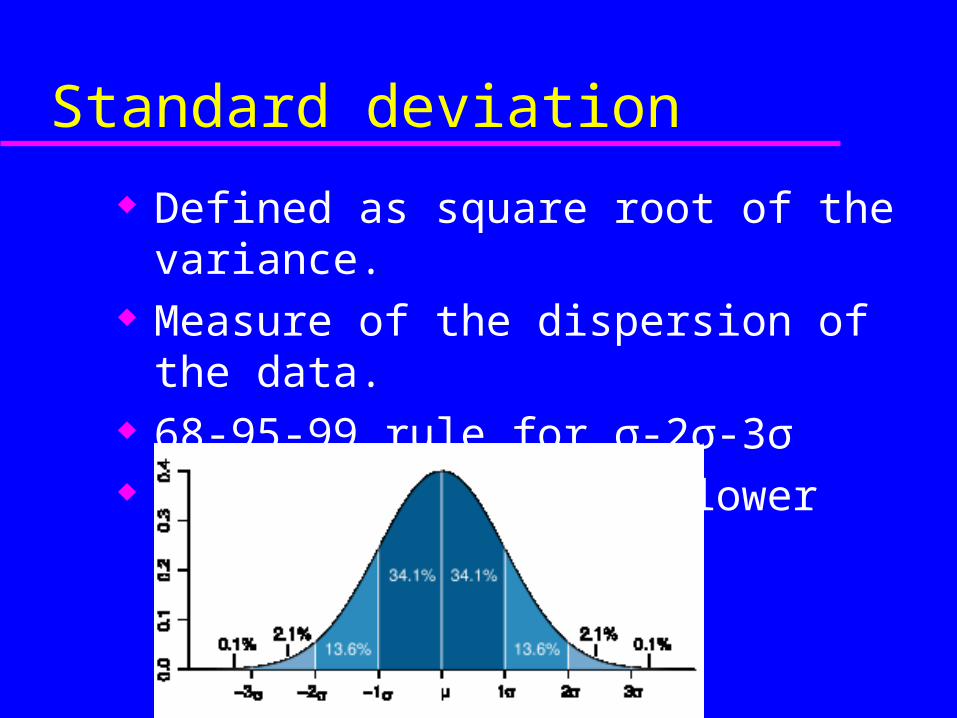
Defined as square root of the variance. Measure of the dispersion of the data. 68-95-99 rule for σ-2σ-3σ Denoted by letter σ (lower case sigma).
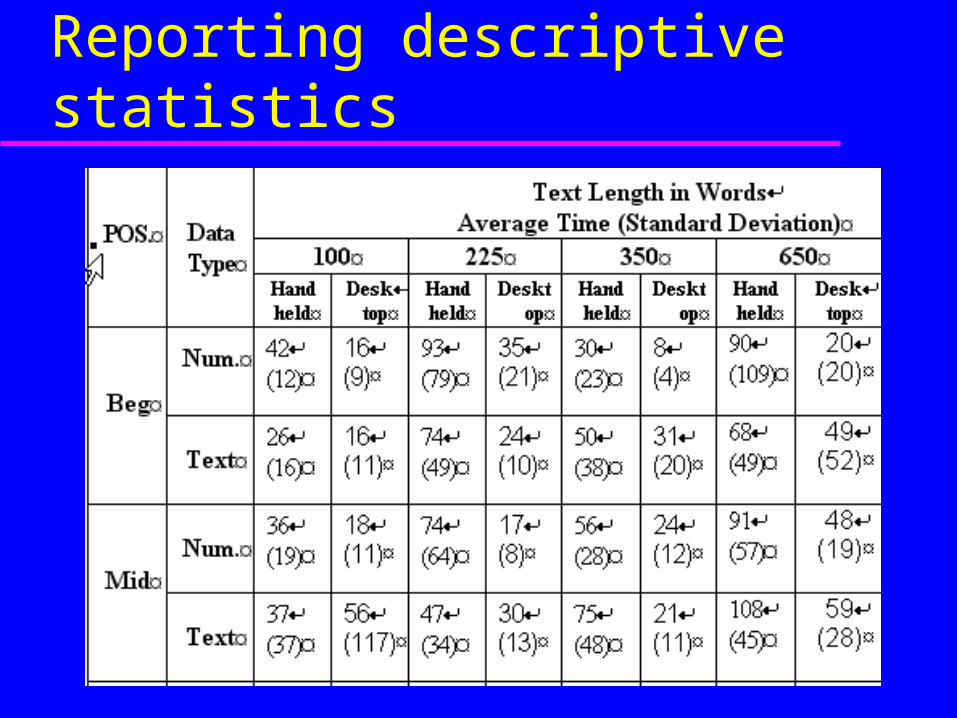
Reporting descriptive statistics

Box plots

p values
Value that gives the confidence that the test results occurred by chance.
Typically must be less than .1 or .05. Must always be reported as part of the data.

Reporting the statistics

Tests
T-test ANOVA Regression Correlation Non-parametric tests

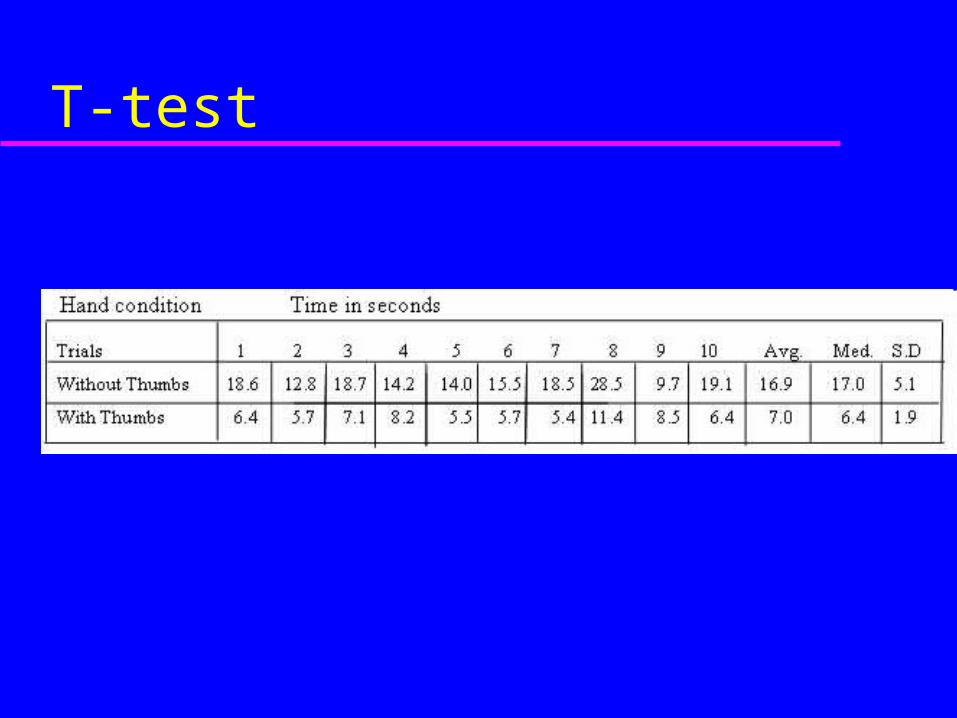
T-test
Tests two different sets of values Assumes a normal distribution Different forms if the variance of the
samples are different Different forms for independent or
dependent samples (whether the two samples data can be paired up)
T-test
ANOVA
Observed variance between different dependent variables in the experiment
Assumes a normal distribution and also assumes the treatment only effects the mean and not the variance
Correlation
Degree of fit between actual scores for a dependent variable and the predicted values based on a regression
Measures the degree of relationship Correlation coefficients can range from -1.00 to
+1.00. The value of -1.00 represents a perfect negative correlation while a value of +1.00 represents a perfect positive correlation. A value of 0.00 represents a lack of correlation.

Correlation

Correlation
This line is called the regression line or least squares line, because it is determined such that the sum of the squared distances of all the data points from the line is the lowest possible.
Regression
Prediction of the dependent variable value based on one or more independent variables
Measures the type of relationship between multiple values
Gives the percent of the variance accounted for by each element
Regression
But the world is complex and, in most cases, we are interested in comparisons that can’t be captured adequately using just two variables. Accordingly, analogues of the methods we’ve discussed so far have been developed to analyze relations between suites of variables. Because these suites are composed of multiple variables—as opposed to pairs of variables—the family of methods we’re now going to discuss are useful for ‘multiple variable’ or ‘multivariate’ analysis
Regression

Regression
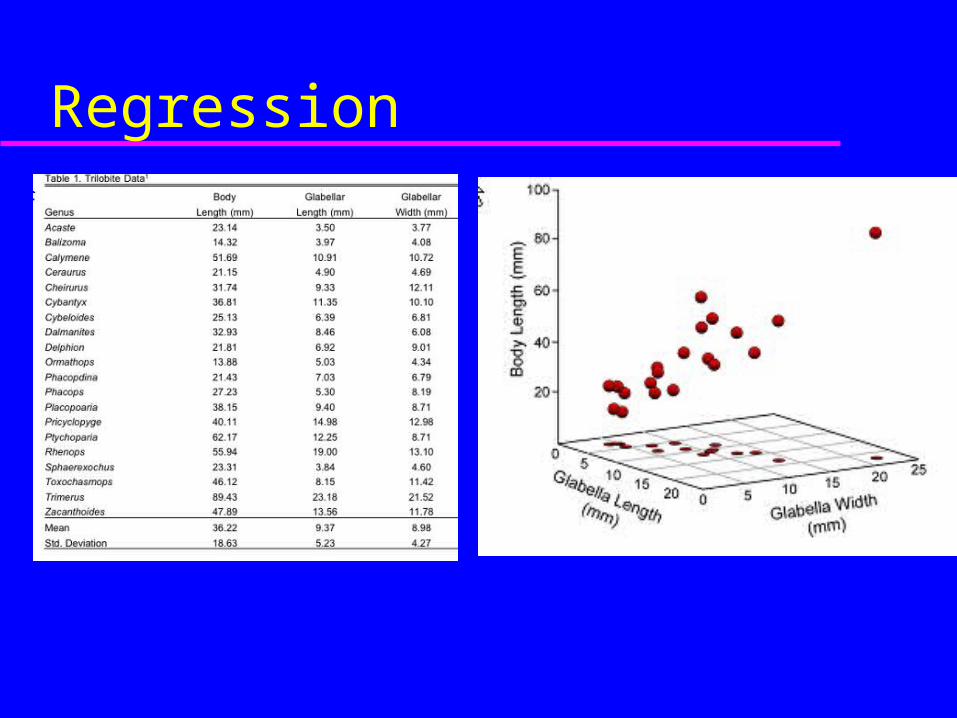
Performing a regression on the previous data gives:
Non-parametric tests
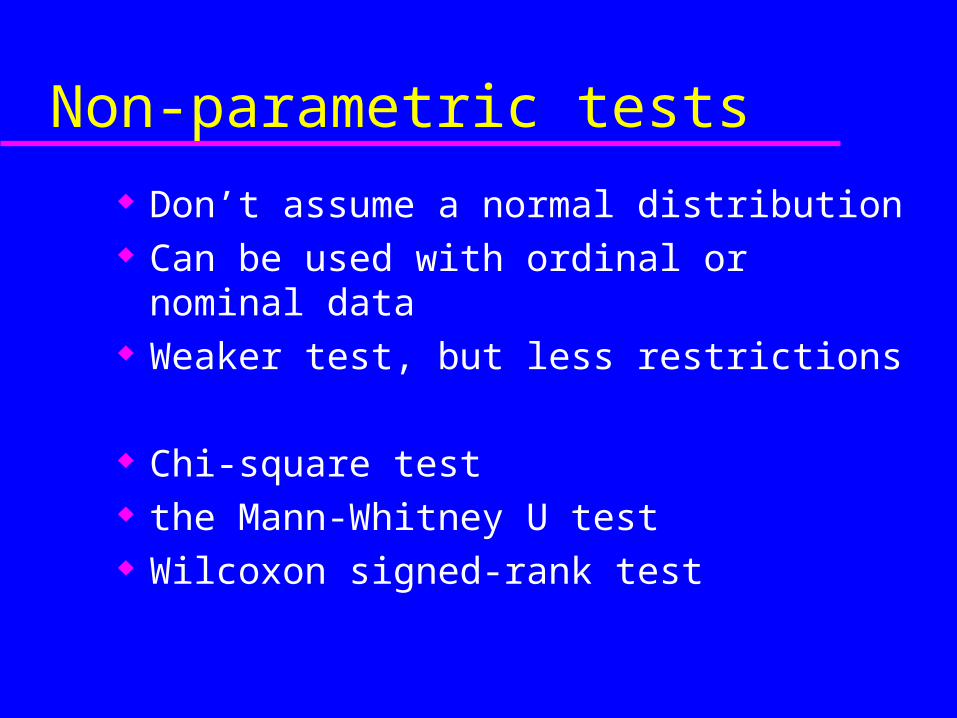
Don’t assume a normal distribution Can be used with ordinal or nominal data Weaker test, but less restrictions
Chi-square test the Mann-Whitney U test Wilcoxon signed-rank test
Mann-Whitney U test
Non-parametric test for assessing whether the medians between 2 samples are the same
for independent data http://geographyfieldwork.com/Mann
%20Whitney.htm
Wilcoxon signed-rank
Used for related samples No assumptions on distribution
Confidence intervals
How sure are we that we have enough people in the sample
Methods of calculating either – how big the sample should be– how much confidence you can place in an
existing sample
Confidence intervals Since there are no comparable studies, estimates of the
standard deviation was difficult. We used the values obtained by Cardinal & Siedler (1995) in their study of readability of healthcare material: sd = 12 for low groups and sd = 10 for high groups. They also saw a difference of 14 percent in total score between groups. Thus, the numbers we used for the power analysis were: control mean = 53 sd = 12 and experimental group mean = 67 sd = 10. For a significance level of .05 and a power of .9, this gives a value of 12 in each cell of the test design.
Outliers
Data that looks to not be part of the set.Want to remove it, but no real standards for what makes it real or an error.
For example, if one is calculating the average temperature of 10 objects in a room, and most are between 20-25° Celsius, but an oven is at 350° C, the median of the data may be 23 but the mean temperature will be 55
http://www.statsoft.com/textbook/stbasic.html#Correlations
significant digits writing up the statistics in an article

End